Hydraulic Analysis of Effects of Sea-Level Rise on King ...
36
Hydraulic Analysis of Effects of Sea-Level Rise on King County’s Wastewater System Phase I Report November 2012
Transcript of Hydraulic Analysis of Effects of Sea-Level Rise on King ...

Hydraulic Analysis of Effects of Sea-Level Rise on
King County’s Wastewater System
Phase I Report
November 2012

For comments or questions, contact: John Phillips King County Wastewater Treatment Division 201 S. Jackson St. KSC-NR-0512 Seattle, WA 98104-3855 206-263-6543 [email protected] Alternative Formats Available 206-684-1280 TTY Relay: 711
November 2012 Phase I, Hydraulic Analysis of Effects of Sea-Level Rise on King County’s Wastewater System iii
Contents
Executive Summary ........................................................................................................................ 1
1.0 Introduction ......................................................................................................................... 3
1.1 WTD Facilities Influenced by Tides ............................................................................... 3
1.2 Sea-Level Rise in the Puget Sound Area ........................................................................ 6
1.3 Previous Analyses of Impacts of Sea-Level Rise on the Wastewater System ................ 7
1.3.1 Saltwater Intrusion from Existing High Tides ............................................................ 7
1.3.2 Potential for Flooding from Existing and Future High Tides ..................................... 8
1.4 Hydraulic Analysis of Saltwater Inflow ......................................................................... 9
2.0 Where Saltwater Inflow Could Occur ............................................................................... 11
2.1 Scope and Assumptions ................................................................................................ 11
2.2 Methods......................................................................................................................... 11
2.3 Results ........................................................................................................................... 11
3.0 Estimated Inflow Volumes ............................................................................................... 21
3.1 Scope and Assumptions ................................................................................................ 21
3.2 Methods......................................................................................................................... 21
3.2.1 Range of Maximum Saltwater Inflow ....................................................................... 22
3.2.2 Inflow Rates and Volumes ........................................................................................ 22
3.2.3 Inflow Frequency ...................................................................................................... 22
3.3 Results ........................................................................................................................... 24
4.0 Conclusions and Recommendations ................................................................................. 31
5.0 References ......................................................................................................................... 32
November 2012 Phase I, Hydraulic Analysis of Effects of Sea-Level Rise on King County’s Wastewater System iv
Tables Table 1. Puget Sound High Tides Under Sea-Level Rise–Storm Surge Scenarios ........................ 7
Table 2. WTD Facilities at Risk of Flooding from Sea-Level Rise and Storm Surges .................. 9
Table 3. Facilities Predicted to Receive Salt Water Under Combinations of Current and Predicted Sea Levels and Historical Storms ........................................................................................ 15
Table 4. Saltwater Inflow Volumes for Tidally Influenced Facilities Without Flap Gates .......... 26
Table 5. Average Number of Overtopping Tides per Year for Facilities Without Flap Gates ..... 29
Figures
Figure 1. WTD Facilities Adjacent to Tidally Influenced Water Bodies ....................................... 4
Figure 2. Overflow Weir at a Typical Pump Station ...................................................................... 5
Figure 3. Flap Gate at a Typical Regulator Station ........................................................................ 5
Figure 4. Outfall Gate at South Michigan Outfall Under Low and High Water Conditions .......... 5
Figure 5. Outfalls at Risk of Saltwater Inflow from Sea-Level Rise ............................................ 12
Figure 6. Tides Above Weir Elevations Under Current Conditions (Mean Higher High Water) With and Without Storm Surge ........................................................................................... 17
Figure 7. Tides Above Weir Elevations With a 6-Inch Sea-Level Rise With and Without Storm Surge .................................................................................................................................... 17
Figure 8. Tides Above Weir Elevations With a 13-Inch Sea-Level Rise With and Without Storm Surge .................................................................................................................................... 18
Figure 9. Tides Above Weir Elevations With a 22-Inch Sea-Level Rise With and Without Storm Surge .................................................................................................................................... 18
Figure 10. Tides Above Weir Elevations With a 50-Inch Sea-Level Rise With and Without Storm Surge ......................................................................................................................... 19
Figure 11. Change in Surge Frequency Under Sea-Level Rise Scenarios at Murray Avenue Pump Station Weir (Elevation 108 Feet Metro Datum) ................................................................ 23
Figure 12. Average Number of Overtopping Tides per Year from Sea-Level Rise Scenarios at Murray Avenue Pump Station ............................................................................................. 23
November 2012 Phase I, Hydraulic Analysis of Effects of Sea-Level Rise on King County’s Wastewater System 1
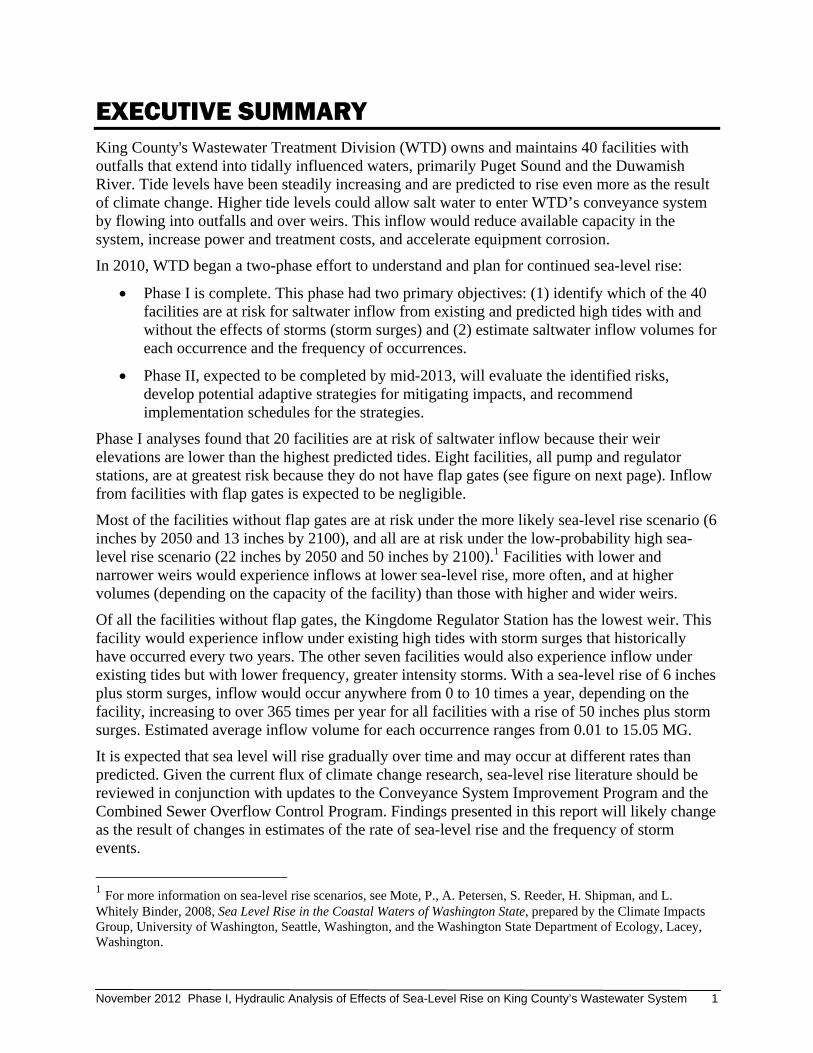
EXECUTIVE SUMMARY King County's Wastewater Treatment Division (WTD) owns and maintains 40 facilities with outfalls that extend into tidally influenced waters, primarily Puget Sound and the Duwamish River. Tide levels have been steadily increasing and are predicted to rise even more as the result of climate change. Higher tide levels could allow salt water to enter WTD’s conveyance system by flowing into outfalls and over weirs. This inflow would reduce available capacity in the system, increase power and treatment costs, and accelerate equipment corrosion.
In 2010, WTD began a two-phase effort to understand and plan for continued sea-level rise:
Phase I is complete. This phase had two primary objectives: (1) identify which of the 40 facilities are at risk for saltwater inflow from existing and predicted high tides with and without the effects of storms (storm surges) and (2) estimate saltwater inflow volumes for each occurrence and the frequency of occurrences.
Phase II, expected to be completed by mid-2013, will evaluate the identified risks, develop potential adaptive strategies for mitigating impacts, and recommend implementation schedules for the strategies.
Phase I analyses found that 20 facilities are at risk of saltwater inflow because their weir elevations are lower than the highest predicted tides. Eight facilities, all pump and regulator stations, are at greatest risk because they do not have flap gates (see figure on next page). Inflow from facilities with flap gates is expected to be negligible.
Most of the facilities without flap gates are at risk under the more likely sea-level rise scenario (6 inches by 2050 and 13 inches by 2100), and all are at risk under the low-probability high sea-level rise scenario (22 inches by 2050 and 50 inches by 2100).1 Facilities with lower and narrower weirs would experience inflows at lower sea-level rise, more often, and at higher volumes (depending on the capacity of the facility) than those with higher and wider weirs.
Of all the facilities without flap gates, the Kingdome Regulator Station has the lowest weir. This facility would experience inflow under existing high tides with storm surges that historically have occurred every two years. The other seven facilities would also experience inflow under existing tides but with lower frequency, greater intensity storms. With a sea-level rise of 6 inches plus storm surges, inflow would occur anywhere from 0 to 10 times a year, depending on the facility, increasing to over 365 times per year for all facilities with a rise of 50 inches plus storm surges. Estimated average inflow volume for each occurrence ranges from 0.01 to 15.05 MG.
It is expected that sea level will rise gradually over time and may occur at different rates than predicted. Given the current flux of climate change research, sea-level rise literature should be reviewed in conjunction with updates to the Conveyance System Improvement Program and the Combined Sewer Overflow Control Program. Findings presented in this report will likely change as the result of changes in estimates of the rate of sea-level rise and the frequency of storm events.
1 For more information on sea-level rise scenarios, see Mote, P., A. Petersen, S. Reeder, H. Shipman, and L. Whitely Binder, 2008, Sea Level Rise in the Coastal Waters of Washington State, prepared by the Climate Impacts Group, University of Washington, Seattle, Washington, and the Washington State Department of Ecology, Lacey, Washington.

November 2012 Phase I, Hydraulic Analysis of Effects of Sea-Level Rise on King County’s Wastewater System 2
Outfalls at Risk of Saltwater Inflow from Sea-Level Rise
November 2012 Phase I, Hydraulic Analysis of Effects of Sea-Level Rise on King County’s Wastewater System 3
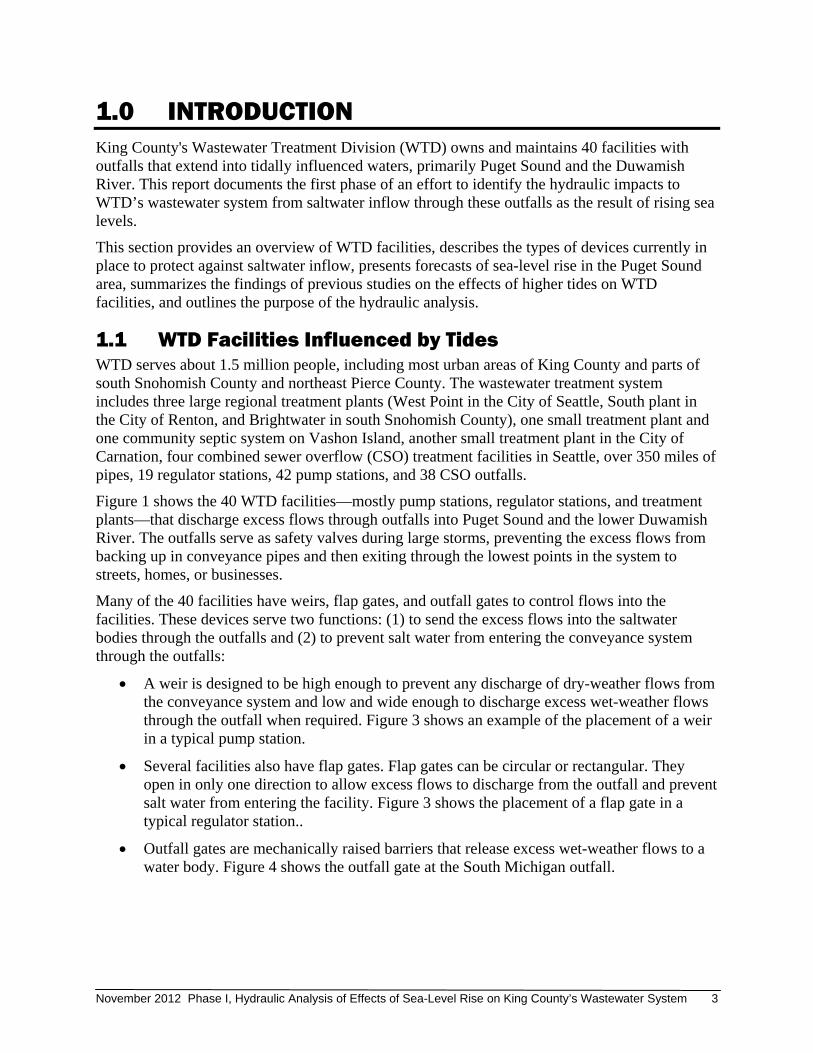
1.0 INTRODUCTION King County's Wastewater Treatment Division (WTD) owns and maintains 40 facilities with outfalls that extend into tidally influenced waters, primarily Puget Sound and the Duwamish River. This report documents the first phase of an effort to identify the hydraulic impacts to WTD’s wastewater system from saltwater inflow through these outfalls as the result of rising sea levels.
This section provides an overview of WTD facilities, describes the types of devices currently in place to protect against saltwater inflow, presents forecasts of sea-level rise in the Puget Sound area, summarizes the findings of previous studies on the effects of higher tides on WTD facilities, and outlines the purpose of the hydraulic analysis.
1.1 WTD Facilities Influenced by Tides WTD serves about 1.5 million people, including most urban areas of King County and parts of south Snohomish County and northeast Pierce County. The wastewater treatment system includes three large regional treatment plants (West Point in the City of Seattle, South plant in the City of Renton, and Brightwater in south Snohomish County), one small treatment plant and one community septic system on Vashon Island, another small treatment plant in the City of Carnation, four combined sewer overflow (CSO) treatment facilities in Seattle, over 350 miles of pipes, 19 regulator stations, 42 pump stations, and 38 CSO outfalls.
Figure 1 shows the 40 WTD facilities—mostly pump stations, regulator stations, and treatment plants—that discharge excess flows through outfalls into Puget Sound and the lower Duwamish River. The outfalls serve as safety valves during large storms, preventing the excess flows from backing up in conveyance pipes and then exiting through the lowest points in the system to streets, homes, or businesses.
Many of the 40 facilities have weirs, flap gates, and outfall gates to control flows into the facilities. These devices serve two functions: (1) to send the excess flows into the saltwater bodies through the outfalls and (2) to prevent salt water from entering the conveyance system through the outfalls:
A weir is designed to be high enough to prevent any discharge of dry-weather flows from the conveyance system and low and wide enough to discharge excess wet-weather flows through the outfall when required. Figure 3 shows an example of the placement of a weir in a typical pump station.
Several facilities also have flap gates. Flap gates can be circular or rectangular. They open in only one direction to allow excess flows to discharge from the outfall and prevent salt water from entering the facility. Figure 3 shows the placement of a flap gate in a typical regulator station..
Outfall gates are mechanically raised barriers that release excess wet-weather flows to a water body. Figure 4 shows the outfall gate at the South Michigan outfall.

November 2012 Phase I, Hydraulic Analysis of Effects of Sea-Level Rise on King County’s Wastewater System 4
Figure 1. WTD Facilities Adjacent to Tidally Influenced Water Bodies

November 2012 Phase I, Hydraulic Analysis of Effects of Sea-Level Rise on King County’s Wastewater System 5
Figure 2. Overflow Weir at a Typical Pump Station
Figure 3. Flap Gate at a Typical Regulator Station
Figure 4. Outfall Gate at South Michigan Outfall Under Low and High Water Conditions
November 2012 Phase I, Hydraulic Analysis of Effects of Sea-Level Rise on King County’s Wastewater System 6
1.2 Sea-Level Rise in the Puget Sound Area The elevations of most weirs, flap gates, and outfall gates for tidally influenced facilities in WTD’s system are based on tidal elevations measured in the 1960s. The devices were designed to accommodate the higher high water of tides and some amount of storm surge. It was assumed at the time that tidal elevations would remain constant over time. However, sea level in the Seattle area has steadily risen by approximately 0.3 feet between 1950 and 2000.2
The University of Washington Climate Impacts Group (CIG) completed a regional analysis of sea-level rise (SLR) for Washington State’s major tidally influenced water bodies (Mote et al., 2008). The study was based on an analysis conducted by the United Nations International Panel on Climate Change that indicates the planet could experience a mean SLR of 7 to 23 inches during the 21st century, excluding future rapid dynamical changes in ice flow (IPCC, 2007).
CIG developed three SLR scenarios for the years 2050 and 2100, ranging from a rise of 3 inches to 50 inches (0.25 to 4.17 feet). The researchers first predicted the mostly likely scenario (medium impact) and then added two low-probability scenarios at the low- and high-impact extremes. Probabilities were not quantified for the scenarios. The three scenarios are as follows:
The very low scenario (low probability) predicts 3 inches of SLR by 2050 and 6 inches by 2100.
The medium scenario (most likely) predicts 6 inches of SLR by 2050 and 13 inches by 2100.
The very high scenario (low probability) predicts 22 inches of SLR by 2050 and 50 inches by 2100.
Because weather affects local tides, the frequency and intensity of storm events must be considered in the analysis of SLR and its impact on WTD facilities. Tidal heights above mean higher high water (MHHW) in Puget Sound range from 1.48 feet for a storm with a historical return frequency of once a year to 3.19 feet for a storm with a historical return frequency of once in 100 years (Zervas, 2005 and 2007).
Table 1 shows 25 high tide elevations for current tides and for 2050 and 2100 under CIG medium and very high SLR forecasts combined with no storm and with storms with historical return frequencies of once every year, 2 years, 10 years, and 100 years. Current tidal data were taken from the National Oceanic and Atmospheric Administration (NOAA) Tides and Currents website for the Seattle tide gauge located at Coleman Dock, which is centrally located to all facilities considered.3 The data are based on the last tidal epoch, defined as the 19-year period from 1983 through 2001. The MHHW datum was used as the baseline elevation. For the Seattle tide gauge, the MHHW is 9.01 feet above NAVD88 zero feet, or 105.36 feet Metro Datum.4
The estimated high tide levels in Table 1 range from 105.36 feet Metro Datum (current conditions, no storm) to 112.72 feet Metro Datum (2100 very high SLR plus a 100-year storm).
2 From the observed National Oceanographic and Atmospheric Administration (NOAA) mean sea level trend measured at the Seattle tide gauge. 3 http://tidesandcurrents.noaa.gov/station_info.shtml?stn=9447130+SEATTLE,+PUGET+SOUND,+WA 4 The North American Vertical Datum of 1988 (NAVD88) is based on mean sea level at a tide gauge in North America (considered as NAVD88 zero). Metro Datum, which is based on NAVD88, is used at King County. Each Metro Datum level is 96.35 feet higher than the corresponding NAVD88 level.

November 2012 Phase I, Hydraulic Analysis of Effects of Sea-Level Rise on King County’s Wastewater System 7
WTD is using these 25 tide elevations for its analysis of potential risks to its system from sea-level rise. The very low CIG scenario is not included because historical trends, as recorded by NOAA for the Seattle tide gauge, suggest a greater than 3-inch rise by 2050.
Table 1. Puget Sound High Tides Under Sea-Level Rise–Storm Surge Scenarios
Scenario No
Storm (MHHW)
Storm Surge Plus MHHW (feet Metro Datum) 1-Year Storm
(1.48 feet)
2-Year Storm
(2.27 feet)
10-Year Storm
(2.79 feet)
100-Year Storm
(3.19 feet) Current conditions 105.36 106.84 107.63 108.15 108.55 Medium SLR 2050 (6 inches) 105.86 107.34 108.13 108.65 109.05 Medium SLR 2100 (13 inches) 106.44 107.92 108.71 109.23 109.63 Very High SLR 2050 (22 inches) 107.19 108.67 109.46 109.98 110.38 Very High SLR 2100 (50 inches) 109.53 111.01 111.8 112.32 112.72 SLR = sea-level rise; MHHW = mean higher high water.
The assumptions regarding the rates and impacts of the melting ice sheets were modest in both the IPCC and CIG projections. Other studies predict more rapid melting of glaciers and ice sheets and their effects on SLR for the planet. Csatho et al. (2008), for example, indicate that ice sheet models usually do not include all the complexity of ice dynamics that can occur in nature. If current climate models from the IPCC had included data from ice dynamics in Greenland, the SLR estimated during this century could be twice as high (University at Buffalo, 2008). One researcher (Hansen, 2007) indicates a possible “multi-meter” rise in sea level in the future.
Because the rate at which SLR will occur is uncertain, WTD analyses emphasize which facilities could be at risk at various increases in sea level, regardless of when the increases are predicted to occur. This approach ensures that conclusions of the analyses will remain valid even as the model results change to incorporate additional data in the future.
1.3 Previous Analyses of Impacts of Sea-Level Rise on the Wastewater System
The following sections describe two studies that WTD undertook to gain a better understanding of how much salt water is currently entering its conveyance system and how SLR could pose a risk of flooding at some facilities near tidally influenced water bodies.
1.3.1 Saltwater Intrusion from Existing High Tides Premature corrosion of equipment at the West Point Treatment Plant prompted a study in 2003 to identify the causes of the corrosion. Salt water entering the conveyance system at high tides was identified as the major cause (King County, 2003a and 2003b). As part of the study, WTD monitored locations in the conveyance system to determine the presence, magnitude, and sources of saltwater intrusion.
The division undertook a more comprehensive study in 2007 on the intrusion of salt water into the WTD conveyance system and published a report in 2011 on data collected over a two-year period (King County, 2011). The study built on earlier data collection and confirmed the relationship between tides and the saltwater content of wastewater conveyed to the West Point plant from the combined sewer system. Findings showed spikes in wastewater conductivity as the result of high tides of at least 10 feet mean lower low water (MLLW). However, salt water is

November 2012 Phase I, Hydraulic Analysis of Effects of Sea-Level Rise on King County’s Wastewater System 8
entering the system daily through leaky gates, overflow weirs, groundwater infiltration, and local waterfront facilities and sewer connections, primarily in the industrial area along the Duwamish Waterway, Downtown Seattle Waterfront, and Salmon Bay area near the Hiram M. Chittenden Locks.
It is estimated that about 3 to 6 million gallons of salt water enters the system each day, amounting to about 1 to 2 billion gallons a year. The salt water is not only causing premature corrosion of equipment at the West Point plant but is also corroding equipment at pump stations, aggravating pipe linings and diminishing their longevity, and using system capacity needed during critical overflow periods. Reduced capacity both at the plant and in the conveyance system can contribute to CSOs in wet-weather conditions and sanitary sewer overflows in dry-weather conditions.
The additional flow adds to treatment, power, repair, and other costs. The yearly cost of treating salt water entering the King County wastewater system has been estimated at $0.5 to $1.0 million (King County, 2012). The costs for power to pump flows are greater because of the increase in flows. In addition, the County continues to incur the costs of rehabilitating corroded equipment. Repairing all damaged clarifiers at West Point after only seven years of service cost $1.2 million in 2003, and it cost almost $0.6 million to repair and replace gates at the plant. Many small repairs go unreported as saltwater-related damage.
The 2011 report on the saltwater intrusion study can be found at http://www.kingcounty.gov/environment/wtd/About/RespondingToClimateChange.aspx.
1.3.2 Potential for Flooding from Existing and Future High Tides In 2008, WTD conducted a study to identify which of the 40 facilities with outfalls to tidally influenced water bodies are at risk for flooding from climate-change-induced SLR (King County, 2008). This study focused on overland flooding based on the proximity of the facilities to tidally influenced waters; it did not evaluate the potential for saltwater inflow through outfalls. The risk for flooding was considered for various combinations of estimated SLR and historical storm intensities shown earlier in Table 1.
The study concluded that no facilities are at risk of overland flooding with sea-level rise less than 9.6 inches over current MHHW (very low SLR scenario and medium SLR scenario in 2050). By 2100, as many as 14 of the 40 facilities could experience flooding under the medium (in 2100) and very high SLR scenarios, depending on the effects of storm surges, as shown in Table 2 and summarized below:
By 2050, five facilities could flood under the very high SLR scenario coupled with the effects of 2-year, 10-year, and 100-year storms:
— During the 2-year and 10-year storms, the three lowest elevation facilities would flood.
— During the 100-year storm, an additional two facilities would flood.
By 2100, up to 14 facilities could flood under all storm and no-storm conditions:
— The three lowest elevation facilities and one other facility would flood during a 100-year storm under the medium SLR scenario and would flood in non-storm conditions under the very high SLR scenario.

November 2012 Phase I, Hydraulic Analysis of Effects of Sea-Level Rise on King County’s Wastewater System 9
— Five facilities would flood during the 1-year storm, eight facilities during the 2-year and 10-year storms, and fourteen facilities during the 100-year storm under the very high SLR scenario.
Higher tides in conjunction with storms have already caused overflows at some facilities located near the water. The Murray Pump Station, for example, experienced an overflow on January 20, 2010, caused by high tide levels and a low pressure system over the area.
For more information on the flooding study, see http://your.kingcounty.gov/dnrp/library/archive-documents/wtd/csi/csi-docs/0807_SLR_VF_TM.pdf.
Table 2. WTD Facilities at Risk of Flooding from Sea-Level Rise and Storm Surges
1.4 Hydraulic Analysis of Saltwater Inflow SLR could affect the ability of the conveyance system to operate as designed by increasing hydraulic pressure and allowing greater inflow of salt water into the system. In 2010, WTD began a two-phase analysis to identify current and future risks of saltwater inflow through outfalls into its wastewater system and to develop adaptive strategies to reduce these risks:
Phase I is documented in this report. This phase had two primary objectives: (1) identify which WTD facilities are at risk for saltwater inflow through outfalls and under which
2100 Medium Sea Rise Scenario (1.08 feet)
2050 Low Probability–High Impact Sea-Level Rise Scenario (1.83 feet)
2100 Low Probability–High Impact Sea-Level Rise Scenario (4.17 feet)
No
Even
t
Onc
e a
Year
Eve
nt
Onc
e Ev
ery
Two
Year
Eve
nt
Onc
e Ev
ery
Ten
Year
Eve
nt
Onc
e Ev
ery
100
Year
Eve
nt
No
Even
t
Onc
e a
Year
Eve
nt
Onc
e Ev
ery
Two
Year
Eve
nt
Onc
e Ev
ery
Ten
Year
Eve
nt
Onc
e Ev
ery
100
Year
Eve
nt
No
Even
t
Onc
e a
Year
Eve
nt
Onc
e Ev
ery
Two
Year
Eve
nt
Onc
e Ev
ery
Ten
Year
Eve
nt
Onc
e Ev
ery
100
Year
Eve
nt
Sea-level rise plus storm surge (feet)
1.08 2.56 3.35 3.87 4.27 1.83 3.31 4.10 4.62 5.02 4.17 5.65 6.44 6.96 7.36
Elevation above NAVD88 0.00 feet: Tide elevation →
Facility elevation ↓
10.09 11.57 12.36 12.88 13.28 10.84 12.32 13.11 13.63 14.03 13.18 14.66 15.45 15.97 16.37
Barton Pump Station 13 8th Ave Regulator Station 13 Brightwater Sampling Facility 13 Brightwater Flow Meter Vault 14 Elliott West CSO Facility 14 Lander Regulator Station 15 Hanford 2 Regulator Station 15 Chelan Regulator Station 15 King Street Regulator Station 16 Connecticut Regulator Station
16
Interbay Pump Station 16
Denny Regulator Station 16 Michigan Regulator Station 16 Lander 2 Regulator Station 16
Sea-level rise scenarios are from Mote, P., Petersen A., Reeder, S., Shipman, H., and Whitely Binder, L. 2008. Sea Level Rise in the Coastal Waters of Washington State. Report prepared by the Climate Impacts Group, University of Washington, Seattle, Washington, and the Washington State Department of Ecology, Lacey, Washington.

November 2012 Phase I, Hydraulic Analysis of Effects of Sea-Level Rise on King County’s Wastewater System 10
SLR-storm scenarios the inflow will occur and (2) estimate saltwater inflow volumes for each occurrence and the frequency of occurrences.
Phase II, expected to be completed by mid-2013, will evaluate the identified risks, develop potential adaptive strategies for mitigating impacts, and recommend implementation schedules for the strategies. Strategies could include incorporating measures in planned future improvement projects, modifying operations of existing facilities, and addressing saltwater inflow in design of new facilities.
Increased saltwater inflow through outfalls and over weirs will reduce capacity in the system, increase power and treatment costs, and accelerate corrosion of equipment. Identifying problems now, developing design and operational adaptive strategies, and implementing changes systematically over time could lessen the overall impact of rising sea levels.
The following sections describe the methods and results for estimating where, how much, and how often salt water will enter the conveyance system under the 25 high-tide elevation scenarios shown earlier in Table 1.

November 2012 Phase I, Hydraulic Analysis of Effects of Sea-Level Rise on King County’s Wastewater System 11
2.0 WHERE SALTWATER INFLOW COULD OCCUR This section describes the scope, assumptions, and methods used to identify which tidally influenced facilities in WTD’s system could experience saltwater inflow and under which SLR-storm scenarios this inflow is expected to occur.
2.1 Scope and Assumptions The emphasis in this analysis is on which facilities will be impacted at various increases in sea level, regardless of when the increases are predicted to occur. This approach ensures that the conclusions of the analysis will remain valid even as regional SLR predictions change.
Assumptions used in the analysis include the following:
The U.S. Army Corps of Engineers will maintain Lake Washington and some low-lying river reaches at their current levels through operation of the Hiram M. Chittenden Locks.
Storm-triggered rise in sea level will continue to occur at historical levels for various storm return frequencies.
Although flap gates should prevent salt water from entering the system, vulnerable places around the gates or improperly seated gates can allow salt water into the system. Therefore, facilities with flap gates were included in the identification of at-risk facilities.
2.2 Methods The 40 WTD tidally influenced facilities identified in WTD’s 2008 flooding study were used as a starting point for identifying facilities at risk for saltwater inflow. The methods used were as follows:
Reviewed digital and hardcopy resources for each facility, including as-built drawings, operation and maintenance manuals, and SCADA data, to obtain information about facilities such as weir and gate elevations, operational settings, minimum and maximum gate openings, system connections, and capacities.5
Compared projected tide levels for the 25 combinations of SLR and storm events shown in Table 1 with facility weir elevations. All facilities with weir elevations lower than the highest tide level in the 25 combinations (112.72 feet Metro Datum resulting from 50 inches of SLR and a 100-year storm surge) were considered at risk for saltwater inflow.
2.3 Results The process determined that 20 facilities are at risk for saltwater inflow under various SLR-storm scenarios. Figure 5 shows the locations of these facilities and which of the facilities have flap gates.
5 SCADA = supervisory control and data acquisition system.

November 2012 Phase I, Hydraulic Analysis of Effects of Sea-Level Rise on King County’s Wastewater System 12
Figure 5. Outfalls at Risk of Saltwater Inflow from Sea-Level Rise

November 2012 Phase I, Hydraulic Analysis of Effects of Sea-Level Rise on King County’s Wastewater System 13
Table 3 and Figures 6–10 show under which SLRstorm surge scenarios tides could overtop weirs at or near the outfalls for the 20 facilities. Because the outfalls are considered CSO discharge points, the table and figures show the discharge serial number (DSN) for each location.6
Twelve of the twenty facilities have flap gates associated with their weirs. The eight facilities without flap gates are either pump stations or regulator stations. Given the size of these unprotected facilities, large volumes of salt water would enter into the conveyance system at these locations.
Weir elevations range from 102.84 feet Metro Datum at the Denny Way Interbay Weir to 111.77 feet Metro Datum at the Norfolk Outfall. Facilities with lower weirs would experience tides above weir elevations more frequently than those with higher weirs, and a greater number of facilities would experience these overtopping tides as SLR increases:
Although they would experience tides higher than their weirs under most of the scenarios, the five facilities with the lowest weir elevations are protected by flap gates:
— The Denny Way Interbay Weir would experience overtopping tides under all conditions, including the current condition with no storm.
— The East Duwamish Pump Station Emergency/Siphon Aftbay and West Duwamish Siphon Forebay, both at 105.83 feet Metro Datum, would experience overtopping tides under all conditions except the current condition with no storm.
— The South Michigan and Brandon Street Regulator Stations, with slightly higher weirs than those at the Duwamish facilities, would experience overtopping tides under similar conditions as the Duwamish facilities except that they would be exempt from inflow under the 2050 medium SLR scenario with no storms.
The two facilities with the highest weir elevations, Denny Lake Union and Norfolk Outfall (111.50 and 111.77 feet Metro Datum, respectively), would experience higher-than-weir tides only under the very high SLR scenarios in 2100 during 2-year, 10-year, and 100-year storms. Both facilities have flap gates.
The weir elevations of the facilities without flap gates range from 107.45 to 109.45 feet Metro Datum. Tides would remain under weir elevations at these eight facilities for all scenarios under no-storm conditions. With the effect of storms, six of the facilities are at risk under the medium SLR scenario and all are at risk under the very high SLR scenario. Other findings for facilities without flap gates are as follows:
— The facility with the lowest weir (Kingdome Regulator Station) would experience overtopping tides with the 2-year storm under existing high tides; the facility with the highest weir (63rd Avenue North and South Inlets) would not experience overtopping tides until the 100-year storm under the 2100 medium SLR scenario.
— The other seven facilities without flap gates would experience tides above their weirs with the 10-year storm under current conditions. Occurrences of
6 DSNs are assigned for CSO locations by the Washington State Department of Ecology as part of the National Pollutant Discharge Elimination System permitting process.

November 2012 Phase I, Hydraulic Analysis of Effects of Sea-Level Rise on King County’s Wastewater System 14
overtopping tides would steadily increase through the medium SLR scenarios and would be higher than weirs for all storms under both very high SLR scenarios.
The following summarizes the number of facilities affected under current conditions and under each SLR scenario:
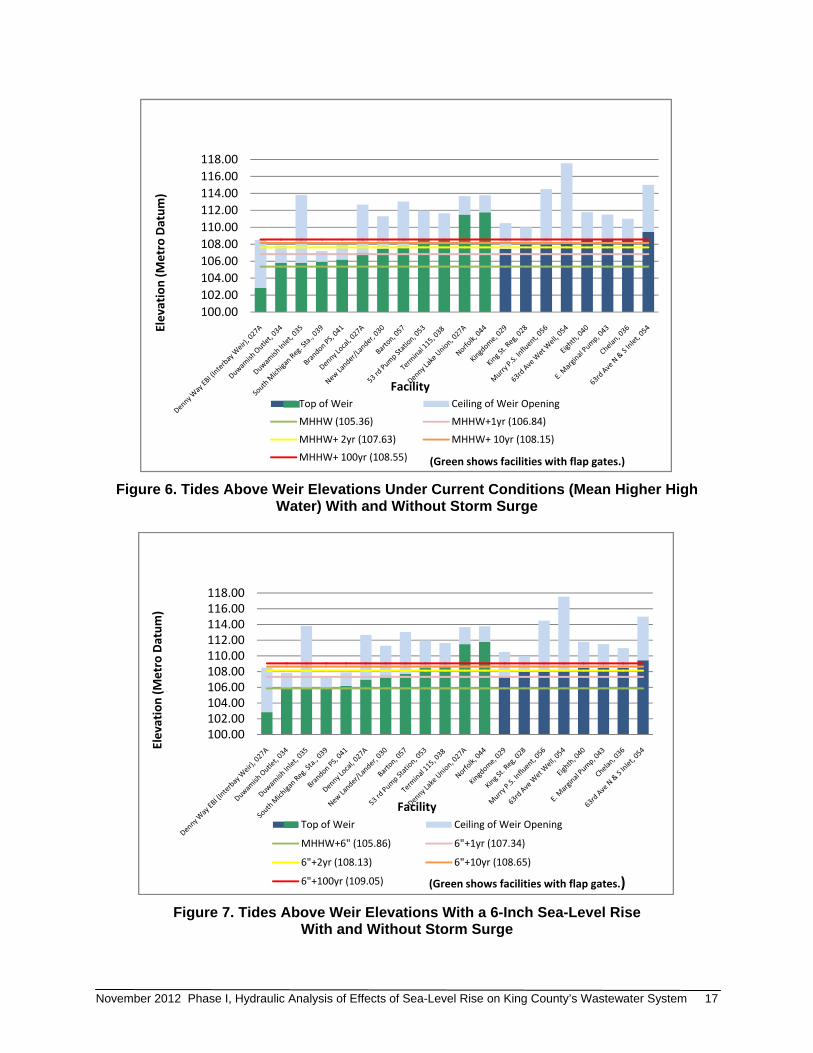
Current conditions (Figure 6). Under no-storm and 1-year storm conditions, only facilities with flap gates would experience tides above weir elevations (one and five facilities, respectively). With a 100-year storm, as many as 15 facilities (7 without flap gates) would experience overtopping tides.
Medium sea-level rise scenario, 2050 (Figure 7). At a tide height of 105.86 feet Metro Datum (no storm), three facilities would experience overtopping tides. When storm surge is added, up to 17 facilities would be affected. With the effect of the three lower frequency storms, six facilities—all with flap gates—would be affected. Seven facilities without flap gates would be affected with the 100-year storm surge.
Medium sea-level rise scenario, 2100 (Figure 8). At a tide height of 106.44 feet Metro Datum (no storm), five facilities—all with flap gates—would experience tides over their weir heights. With storm surge added, up to 18 facilities would be affected. Facilities without flap gates would be affected starting with the 1-year storm. All eight facilities without flap gates would be affected by a 100-year storm.
Very high sea-level rise scenario, 2050 (Figure 9). At a tide height of 107.19 feet Metro Datum (no storm), six facilities—all with flap gates—are at risk. Just a 1-year storm would create tides above the weirs at 17 facilities. Seven of these facilities do not have flap gates. A 100-year storm would affect 18 facilities.
Very high sea-level rise scenario, 2100 (Figure 10). At a tide height of 109.53 feet Metro Datum (no storm), 18 facilities are at risk of inflow. Eight of these facilities lack flap gates. All 20 facilities would be affected during all storms, except the 63rd Avenue inlets (no overtopping with a 1-year storm). The eight facilities without flap gates would be at risk for a storm event as low as a 2-year storm.

November 2012 Phase I, Hydraulic Analysis of Effects of Sea-Level Rise on King County’s Wastewater System 15
Table 3. Facilities Predicted to Receive Salt Water Under Combinations of Current and Predicted Sea Levels and Historical Storms
Facility (and DSN)a
Tide Height
Weir/Gate Height
(feet Metro Datum)
Flap Gate
Current Tidal Conditions Medium SLR 2050 (6 inches) Medium SLR 2100 (13 inches) Very High SLR 2050 (22 inches) Very High SLR 2100 (50 inches)
No Storm
(MHHW)
1-Year Storm
2-Year Storm
10-Year
Storm
100-Year
Storm
No Storm
1-Year Storm
2-Year Storm
10-Year Storm
100-Year
Storm
No Storm
1-Year Storm
2-Year Storm
10-Year Storm
100-Year
Storm
No Storm
1-Year Storm
2-Year Storm
10-Year Storm
100-Year
Storm
No Storm
1-Year Storm
2-Year Storm
10-Year Storm
100-Year
Storm
105.36 106.84 107.63 108.15 108.55 105.86 107.34 108.13 108.65 109.05 106.44 107.92 108.71 109.23 109.63 107.19 108.67 109.46 109.98 110.38 109.53 111.01 111.80 112.32 112.72
Elliott Bay
Denny Way Regulator (027a)
Denny Way Interbay Weir 102.84 Yes X X X X X X X X X X X X X X X X X X X X X X X X X
Denny Lake Union 111.50 Yes X X X
Denny Local 107.00 Yes X X X X X X X X X X X X X X X X X X X X X
King Street Regulator (028) 108.00 X X X X X X X X X X X X X X X X X
Kingdome Regulator (029) 107.45 X X X X X X X X X X X X X X X X X X X
Duwamish River
Lander Street Regulator (030) 107.50 Yes X X X X X X X X X X X X X X X X X X X
East Duwamish Pump Station Emergency and Siphon Aftbay Overflow (034)
105.83
Yes X X X X X X X X X X X X X X X X X X X X X X X X
West Duwamish Siphon Forebay Overflow (035) 105.83 Yes
X X X X X X X X X X X X X X X X X X X X X X X X
Chelan Avenue Regulator (036) 108.50
X X X X X X X X X X X X X X X
Terminal 115 Overflow (038) 108.65 Yes X X X X X X X X X X X X X
South Michigan Regulator (039) 105.94 Yes
X X X X X X X X X X X X X X X X X X X X X X X
8th Avenue S Regulator and West Marginal Way Pump Station Overflow (040) 108.55
X X X X X X X X X X X X X X X
Brandon Street Regulator (041) 106.20 Yes
X X X X X X X X X X X X X X X X X X X X X X X
East Marginal Way Pump Station (043) 108.50
X X X X X X X X X X X X X X X
Norfolk Outfall (044) 111.77 Yes X X X
Puget Sound
53rd Avenue SW Pump Station (052) 108.55 Yes
X X X X X X X X X X X X X X
63rd Avenue SW Pump Station (054) 108.05
X X X X X X X X X X X X X X X X X
63rd Avenue North and South Inlet (054) 109.45
X X X X X X X X X
Murray Avenue Pump Station Emergency Overflow (056) 108.00
X X X X X X X X X X X X X X X X X
Barton Street Pump Station Emergency Overflow (057) 107.75 Yes
X X X X X X X X X X X X X X X X X X
a DSN (discharge serial number), assigned by the Washington State Department of Ecology to combined sewer overflow discharge points as part of National Pollutant Discharge Elimination System permits.
November 2012 Phase I, Hydraulic Analysis of Effects of Sea-Level Rise on King County’s Wastewater System 16
November 2012 Phase I, Hydraulic Analysis of Effects of Sea-Level Rise on King County’s Wastewater System 17
Figure 6. Tides Above Weir Elevations Under Current Conditions (Mean Higher High Water) With and Without Storm Surge
Figure 7. Tides Above Weir Elevations With a 6-Inch Sea-Level Rise
With and Without Storm Surge
100.00
102.00
104.00
106.00
108.00
110.00
112.00
114.00
116.00
118.00Elevation (Metro Datum)
Facility
(Green shows facilities with flap gates.)
Top of Weir Ceiling of Weir Opening
MHHW (105.36) MHHW+1yr (106.84)
MHHW+ 2yr (107.63) MHHW+ 10yr (108.15)
MHHW+ 100yr (108.55)
100.00102.00104.00106.00108.00110.00112.00114.00116.00118.00
Elevation (Metro Datum)
Facility
(Green shows facilities with flap gates.)
Top of Weir Ceiling of Weir Opening
MHHW+6" (105.86) 6"+1yr (107.34)
6"+2yr (108.13) 6"+10yr (108.65)
6"+100yr (109.05)

November 2012 Phase I, Hydraulic Analysis of Effects of Sea-Level Rise on King County’s Wastewater System 18
Figure 8. Tides Above Weir Elevations With a 13-Inch Sea-Level Rise
With and Without Storm Surge
Figure 9. Tides Above Weir Elevations With a 22-Inch Sea-Level Rise With and Without Storm Surge
100.00
102.00
104.00
106.00
108.00
110.00
112.00
114.00
116.00
118.00Elevation (Metro Datum)
Facility
(Green shows facilities with flap gates.)
Top of Weir Ceiling of Weir Opening
MHHW+13" (106.44) 13"+1yr (107.92)
13"+2yr (108.71) 13"+10yr (109.23)
13"+100yr (109.63)
100.00
102.00
104.00
106.00
108.00
110.00
112.00
114.00
116.00
118.00
Elevation (Metro Datum)
Facility
(Green shows facilities with flap gates.)
Top of Weir Ceiling of Weir Opening
22"+MHHW (107.19) 22"+1yr (108.67)
22"+2yr (109.46) 22"+10yr (109.98)
22"+100yr (110.38)

November 2012 Phase I, Hydraulic Analysis of Effects of Sea-Level Rise on King County’s Wastewater System 19
Figure 10. Tides Above Weir Elevations With a 50-Inch Sea-Level Rise
With and Without Storm Surge
100.00
102.00
104.00
106.00
108.00
110.00
112.00
114.00
116.00
118.00
Elevation (Metro Datum)
Facility
(Green shows facilities with flap gates.)
Top of Weir Ceiling of Weir Opening
50"+MHHW (109.53) 50"+1yr (111.01)
50"+2yr (111.80) 50"+10yr (112.32)
50"+100yr (112.72)

November 2012 Phase I, Hydraulic Analysis of Effects of Sea-Level Rise on King County’s Wastewater System 20

November 2012 Phase I, Hydraulic Analysis of Effects of Sea-Level Rise on King County’s Wastewater System 21
3.0 ESTIMATED INFLOW VOLUMES Saltwater inflow volumes and frequencies were estimated for facilities without flap gates that were identified as being at risk of saltwater inflow under current and SLR scenarios. This section describes the scope, assumptions, methods, and results of this analysis.
3.1 Scope and Assumptions The scope of the analysis and the assumptions used are as follows:
Any inflow from a leaking flap gate will be negligible. Thus, facilities with flap gates were excluded from this part of the analysis.
The analysis of the 63rd Avenue Pump Station Wet Well covers the pump station’s north and south inlets, which were listed as a separate facility in the identification of facilities at risk. Although the inlets are vulnerable and affect the pump station inflow, the pump station’s weir is lower than the inlet weirs.
Because of uncertainty regarding how climate change may affect the duration and intensity of tides, it was assumed that current tide cycles will remain constant in duration and intensity even though tide elevations will increase.
Wastewater flow will not be reduced by inflowing salt water. During low flows such as dry-weather flows, the system could allow more saltwater inflow than when the system has high flows.
Connecting interceptors can accept all flow from regulators or pump stations. Downstream capacity was not a factor in this evaluation.
Because no storm surge predictions are available, the increase in the tide height produced by future storm surges was assumed to remain the same as historical storm surges for the four storm events used in this analysis.
3.2 Methods The following methods were used to estimate inflow volumes and frequencies:
Selected six historical tides with verified tide height data in 6-minute increments to represent a range of tide levels with and without storm surge. These tides included the highest tide recorded in the last 15 years and tides sampled from months with tides influenced by storms (January, February, and December) and tides in drier months (March to September).
Determined the maximum saltwater inflow that each facility can accommodate during wet and dry seasons based on the facility’s wastewater flow and capacity.
Estimated the saltwater inflow rates (mgd) for incremental heights of inflow above weir elevations for each facility.
Determined the duration of each overtopping event for each tide and each incremental height.
Estimated the saltwater inflow volumes (MG) for each facility for each selected tide based on facility capacity, flow rates, and durations.

November 2012 Phase I, Hydraulic Analysis of Effects of Sea-Level Rise on King County’s Wastewater System 22
Calculated the number of overtopping tides per year for each facility.
3.2.1 Range of Maximum Saltwater Inflow Pump and regulator stations are designed to handle a certain amount of flow; any excess flow will result in an overflow. Facility weirs are designed to discharge large volumes of water through outfalls to prevent damage and backups in the system. Typically, weirs can discharge flow coming in from the conveyance system at a greater rate than their facilities are designed to pump or regulate. Weirs can also allow flow into facilities from outfalls more quickly than the facilities can handle, filling up a station’s wet well.
To find the range of maximum saltwater inflow that pump stations and regulator stations can accommodate, wet- and dry-weather wastewater flows were subtracted from the facility’s capacity (in mgd). Capacities were estimated as follows:
For pump stations, the capacity was assumed to be the firm pumping capacity.
For regulator stations, the capacity was determined by the size of the pipe connecting to the main interceptor and an assumed allowance for 2 feet of head loss at the regulator gate entrance and through the connecting pipe.
3.2.2 Inflow Rates and Volumes Flow rates over weirs were calculated using weir width, a discharge coefficient, a gravitational constant, and height of water over the weir. Sharp-crested weirs and an average discharge coefficient were assumed.
When a tide begins to rise and overtop a weir, flow normally increases proportionally to the height of the tide until the tide peaks, after which flow begins to decrease with the falling tide. Flow rates were estimated for peak tide elevations for 2-inch increments from 2 to 22 inches above a facility’s weir elevation. These increments allow for greater flexibility in planning for a range of inflow compared to the SLR scenarios shown in Table 1. If a flow rate over the weir was found to be greater than the system’s capacity, a constant inflow rate (at a maximum rate of saltwater inflow) during the duration associated with the tidal event was used.
The resulting flow rates were then used to estimate inflow volumes:
The flow rate for each facility and tide was multiplied by each data time step (6 minutes).
The 6-minute volumes were summed to obtain the total volume of saltwater inflow with and without SLR and storm surge.
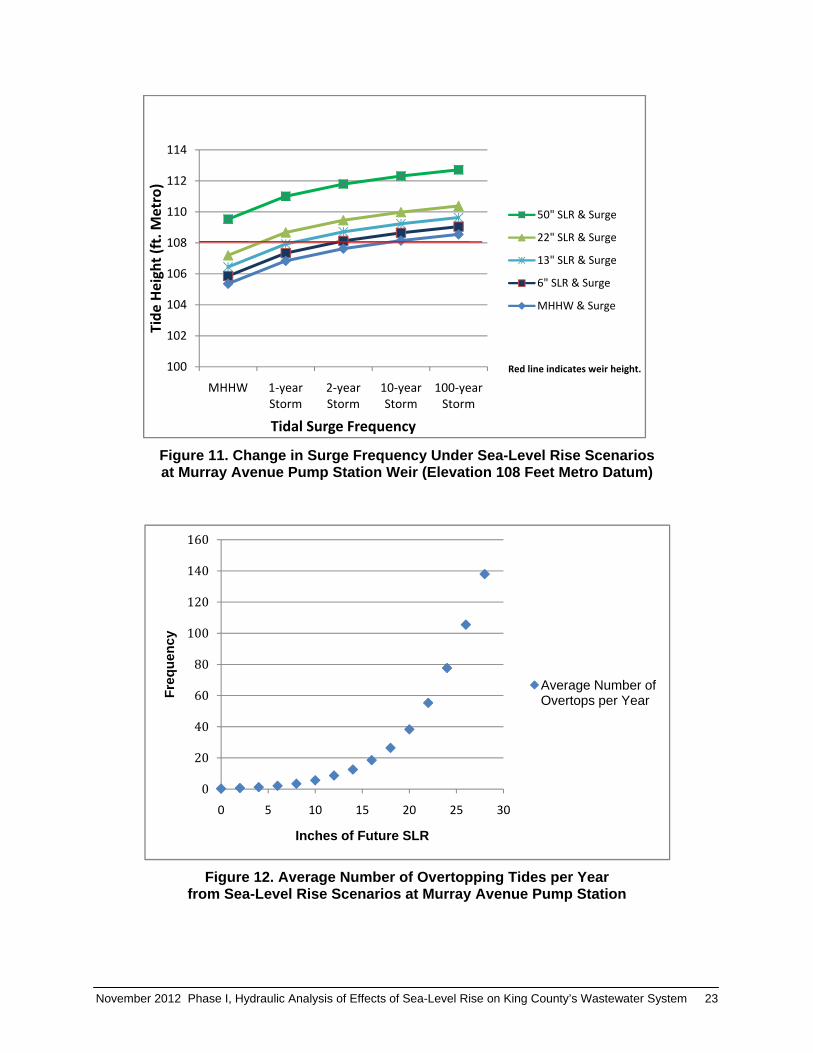
3.2.3 Inflow Frequency To calculate the average number of overtopping tides per year for each facility, SLR scenarios without storms were applied to 30 years of recorded peak tidal data that include the effects of historical storms. The frequency of a particular tide-plus-storm-surge height will increase from current conditions as the result of SLR. For example, a tide of 108 feet Metro Datum that would occur with a 10-year storm would occur every 2 years with a 6-inch SLR. The frequency of tides that overtop weirs would increase accordingly. (See the examples for the Murray Avenue Pump Station in Figure 11 and Figure 12.)
November 2012 Phase I, Hydraulic Analysis of Effects of Sea-Level Rise on King County’s Wastewater System 23
Figure 11. Change in Surge Frequency Under Sea-Level Rise Scenarios at Murray Avenue Pump Station Weir (Elevation 108 Feet Metro Datum)
Figure 12. Average Number of Overtopping Tides per Year
from Sea-Level Rise Scenarios at Murray Avenue Pump Station
100
102
104
106
108
110
112
114
MHHW 1‐year Storm
2‐year Storm
10‐year Storm
100‐year Storm
Tide Height (ft. M
etro)
Tidal Surge Frequency
Red line indicates weir height.
50" SLR & Surge
22" SLR & Surge
13" SLR & Surge
6" SLR & Surge
MHHW & Surge
0
20
40
60
80
100
120
140
160
0 5 10 15 20 25 30
Fre
qu
ency
Inches of Future SLR
Average Number of Overtops per Year

November 2012 Phase I, Hydraulic Analysis of Effects of Sea-Level Rise on King County’s Wastewater System 24
3.3 Results The Kingdome and Chelan regulator stations have the largest amount of available capacity for saltwater inflow (107 and 84 mgd, respectively). Each of the other facilities without flap gates could potentially contribute maximum flow rates between 20 and 50 mgd.
Table 4 lists estimated inflow volumes for the 2-inch increments of tide elevation over weir elevation for the facilities without flap gates. Maximum, minimum, and average volumes correspond to the largest, smallest, and average historical tides used in the analysis. Also shown in Table 4 are the SLR scenarios shown in Table 1 with and without storm surge effects. Some of the tide heights from these scenarios correspond closely with the 2-inch increments, in which case the inflow volumes would be similar. Volumes were not calculated for scenario tide heights that fall between the increments.
The volumes shown in Table 4 give the range of inflow for each occurrence of an overtopping tide. For all facilities, even those contributing the smallest amounts of inflow, volumes would add up over a given year if there is more than one inflow event. Table 5 shows the estimated average number of occurrences per year at each facility. Highlights are as follows:
All facilities would experience overtopping tides more than 365 times per year under the 50-inch SLR scenario.
The Kingdome Regulator Station would experience the greatest frequency of overtopping tides under existing and predicted high tides: an average of 2 times under existing MHHW, 10 times with 6 inches of SLR, 36 times with 13 inches of SLR, and 149 times with 22 inches of SLR.
Annual occurrences for other facilities range from zero to two times for 6 inches of SLR and 19 to 55 times for 22 inches of SLR.
The largest to smallest contributors of saltwater inflow, based on volume and frequency, are as follows:
1. Kingdome Regulator Station. This facility would have the greatest saltwater inflow volumes and the most annual occurrences of inflow because it has a wide weir and because it has the lowest weir and the largest potential capacity compared to the other facilities without flap gates. Average inflow volume for each occurrence ranges from 0.26 to 15.05 MG.
2. 63rd Avenue Pump Station (wet well). Because of its capacity and low, wide weir, this facility would be the second largest contributing inflow point. Average inflow volumes range from 0.52 to 7.32 MG.
3. Murray Avenue Pump Station. The capacity of the Murray Avenue Pump Station would restrict the average inflow volume for each occurrence to a range of 0.27 to 4.57 MG, depending on the tide elevation.
4. King Street Regulator Station. A narrow weir at the King Street Regulator Station would limit average inflow volume for each occurrence to a range of 0.05 to 3.79 MG.
5. Chelan Avenue Regulator Station. Although this facility would allow greater volumes of inflow than the King Street Regulator Station, the frequency of occurrences would be less. Average inflow volume for each occurrence ranges from 0.06 to 7.94 MG.

November 2012 Phase I, Hydraulic Analysis of Effects of Sea-Level Rise on King County’s Wastewater System 25
6. 8th Avenue South Regulator Station. With a very narrow and high weir, this facility would contribute a small amount of salt water compared to the facilities listed above. Average inflow volume for each occurrence ranges from 0.01 to 1.61 MG.
7. East Marginal Way Pump Station. Average inflow volume for each occurrence at the East Marginal Way Pump Station ranges from 0.01 to 1.53 MG.

November 2012 Phase I, Hydraulic Analysis of Effects of Sea-Level Rise on King County’s Wastewater System 26
Table 4. Saltwater Inflow Volumes for Tidally Influenced Facilities Without Flap Gates
Incremental Overtopping Inflow Volume for Each Increment (MG) CIG SLR Scenarios
Flow Over Weir (in)
Peak Tide (ft MD)a
Maximum Minimum Average SLR + Storm
Tide Height (ft MD)a
Kingdome Regulator Station (DSN 029, Weir Elevation 107.45, Maximum Flow 104.5 mgd at Tide 107.34 feet Metro Datum) 6"+1yr 107.34 2 107.62 0.32 0.18 0.26 2yr 107.63 4 107.78 1.34 0.82 1.09
6 107.95 3.02 3.50 2.48 13"+1yr 107.92 8 108.12 5.36 3.50 4.47 6"+2yr 108.13 10yr 108.15 10 108.28 8.30 5.52 7.11 100yr 108.55 12 108.45 10.38 7.11 9.24 14 108.62 12.07 8.41 10.82 6"+10yr 108.65 22"+1yr 108.67 16 108.78 13.60 7.12 11.10 13"+2yr 108.71 18 108.95 15.06 10.56 13.17 6"+100yr 109.05 20 109.17 16.22 11.50 14.17 13"+10yr 109.23 22"+2yr 109.46 50" 109.53 13"+100yr 109.63
22 109.65 16.95 12.36 15.05 22"+10yr 109.98
63rd Avenue Pump Station Wet Well (DSN 054, Weir Elevation 105.05, Maximum Flow 47 mgd at Tide 108.55 feet Metro Datum) 10yr 108.15 2 108.22 0.65 0.37 0.52
4 108.38 2.55 1.57 2.06 6 108.55 3.74 3.15 3.10 100yr 108.55 6"+10yr 108.65 22"+1yr 108.67 8 108.72 4.58 3.15 3.91 13"+2yr 108.71 10 108.88 5.60 3.70 4.88 12 109.05 7.27 4.24 5.87 6"+100yr 109.05 14 109.22 7.32 4.70 6.29 13"+10yr 109.23 16 109.38 7.31 5.09 6.48 22"+2yr 109.46 18 109.55 7.87 5.51 7.04 50" 109.53 13"+100yr 109.63 20 109.72 8.07 5.89 7.32 22"+10yr 109.98 22 110.25 8.10 6.24 7.57 22"+100yr 110.38

November 2012 Phase I, Hydraulic Analysis of Effects of Sea-Level Rise on King County’s Wastewater System 27
Incremental Overtopping Inflow Volume for Each Increment (MG) CIG SLR Scenarios
Flow Over Weir (in)
Peak Tide (ft MD)a
Maximum Minimum Average SLR + Storm
Tide Height (ft MD)a
Murray Avenue Pump Station (DSN 056, Weir Elevation 108.00, Maximum Flow 28.6 mgd at Tide 108.55 feet Metro Datum) 6"+2yr 108.13 2 108.17 0.34 0.19 0.27 10yr 108.15 4 108.33 1.40 0.86 1.16 6 108.50 2.20 1.87 1.82 100yr 108.55 8 108.67 2.73 1.87 2.32 6"+10yr 108.65 22"+1yr 108.67 13"+2yr 108.71 10 108.83 3.27 2.22 2.90 12 109.00 4.33 2.54 3.51 6"+100yr 109.05 14 109.17 4.38 2.84 3.78 13"+10yr 109.23 16 109.33 6.14 3.07 4.28 22"+2yr 109.46 18 109.50 4.75 3.32 4.24 50" 109.53 20 109.67 4.89 3.55 4.42 13"+100yr 109.63 22"+10yr 109.98 22 110.20 4.91 3.77 4.57 22"+100yr 110.38
King Street Regulator Station (DSN 028, Weir Elevation 108.00, Maximum Flow 28 mgd at Tide 109.23 feet Metro Datum) 6"+2yr 108.13 2 108.17 0.06 0.03 0.05 10yr 108.15 4 108.33 0.25 0.15 0.20 6 108.50 0.55 0.64 0.45 100yr 108.55 6"+10yr 108.65 8 108.67 0.98 0.64 0.82 22"+1yr 108.67 13"+2yr 108.71 10 108.83 1.54 1.02 1.32 12 109.00 2.22 1.49 1.95 6"+100yr 109.05
14 109.17 2.83 1.94 2.49 13"+10yr 109.23 16 109.33 3.78 2.28 3.01 22"+2yr 109.46 18 109.50 3.70 2.59 3.22 50" 109.53 13"+100yr 109.63 20 109.67 4.05 2.86 3.52 22"+10yr 109.98 22 110.20 4.31 3.11 3.79
22"+100yr 110.38

November 2012 Phase I, Hydraulic Analysis of Effects of Sea-Level Rise on King County’s Wastewater System 28
Incremental Overtopping Inflow Volume for Each Increment (MG) CIG SLR Scenarios
Flow Over Weir (in)
Peak Tide (ft MD)a
Maximum Minimum Average SLR + Storm
Tide Height (ft MD)a
Chelan Avenue Regulator Station (DSN 036, Weir Elevation 108.5, Maximum Flow 84 mgd at Tide 112.72 feet Metro Datum) 6"+10yr 108.65 2 108.67 0.08 0.04 0.06 22"+1yr 108.67 4 108.83 0.31 0.19 0.25 13"+2yr 108.71 6 109.00 0.70 0.82 0.58 6"+100yr 109.05 13"+10yr 109.23 8 109.17 1.25 0.82 1.04 10 109.33 1.95 1.30 1.67 22"+2yr 109.46 12 109.50 2.82 1.90 2.48 50" 109.53 14 109.67 3.85 2.61 3.37 13"+100yr 109.63 16 109.83 5.04 3.44 4.34 18 110.00 6.41 4.39 5.50 22"+10yr 109.98 20 110.17 7.90 5.45 6.77 22"+100yr 110.38 22 110.70 9.29 6.46 7.94 50"+1yr 111.01
8th Avenue South Regulator Station (DSN 040, Weir Elevation 108.5, Maximum Flow 45 mgd at Tide 112.32 feet Metro Datum) 6"+10yr 108.65 2 108.67 0.01 0.01 0.01 22"+1yr 108.67 13"+2yr 108.71 4 108.83 0.06 0.04 0.05 6 109.00 0.14 0.16 0.11 6"+100yr 109.05 8 109.17 0.25 0.16 0.2 13"+10yr 109.23 10 109.33 0.38 0.26 0.33 12 109.50 0.55 0.37 0.49 22"+2yr 109.46 50" 109.53 14 109.67 0.76 0.51 0.66 13"+100yr 109.63 16 109.83 0.99 0.68 0.85 18 110.00 1.26 0.86 1.08 22"+10yr 109.98 20 110.17 1.55 1.07 1.33 22"+100yr 110.38 22 110.70 1.86 1.31 1.61 50"+1yr 111.01

November 2012 Phase I, Hydraulic Analysis of Effects of Sea-Level Rise on King County’s Wastewater System 29
Table 5. Average Number of Overtopping Tides per Year for Facilities Without Flap Gates
Facility Name (DSN)
Average Number of Overtopping Tides per Year for Historical Tides With and Without Sea‐Level Rise (SLR)
MHHW 6" SLR 13" SLR 22" SLR 50" SLR
Kingdome Regulator Station (029) 2 10 36 149 over 365
63rd Ave. Pump Station Wet Well (054) <1 2 10 50 over 365
Murray Ave. Pump Station (056) <1 2 15 55 over 365
King St. Regulator Station (028) <1 2 10 55 over 365
Chelan Ave. Regulator Station (036) 0 0 3 19 over 365
8th Ave. S. Regulator Station (040) 0 0 3 19 over 365
E. Marginal Way Pump Station (043) 0 0 3 19 over 365
Incremental Overtopping Inflow Volume for Each Increment (MG) CIG SLR Scenarios
Flow Over Weir (in)
Peak Tide (ft MD)a
Maximum Minimum Average SLR + Storm
Tide Height (ft MD)a
East Marginal Way Pump Station (DSN 043, Weir Elevation 108.5, Maximum Flow 47 mgd at Tide 111.8 feet Metro Datum) 6"+10yr 108.65 2 108.67 0.01 0.01 0.01 22"+1yr 108.67 13"+2yr 108.71 4 108.83 0.06 0.04 0.05 6 109.00 0.13 0.15 0.11 6"+100yr 109.05 8 109.17 0.23 0.15 0.20 13"+10yr 109.23 10 109.33 0.37 0.24 0.31 12 109.50 0.53 0.36 0.46 22"+2yr 109.46 50" 109.53 14 109.67 0.72 0.49 0.63 13"+100yr 109.63 16 109.83 0.95 0.65 0.81 18 110.00 1.20 0.82 1.03 22"+10yr 109.98 20 110.17 1.48 1.02 1.27 22"+100yr 110.38 22 110.70 1.78 1.25 1.53 50"+1yr 111.01 a MD = Metro Datum.

November 2012 Phase I, Hydraulic Analysis of Effects of Sea-Level Rise on King County’s Wastewater System 30

November 2012 Phase I, Hydraulic Analysis of Effects of Sea-Level Rise on King County’s Wastewater System 31
4.0 CONCLUSIONS AND RECOMMENDATIONS An estimated 3 to 6 million gallons of salt water enters the King County wastewater system each day, amounting to about 1 to 2 billion gallons a year (King County, 2011). The salt water enters through leaky gates, overflow weirs, groundwater infiltration, and local waterfront facilities and sewer connections, primarily in the industrial area along the Duwamish Waterway, Downtown Seattle Waterfront, and Salmon Bay area near the Hiram M. Chittenden Locks.
This saltwater intrusion not only is causing premature corrosion of equipment at the West Point plant but also is corroding equipment at pump stations, aggravating pipe linings and diminishing their longevity, and using system capacity needed during critical overflow periods. Reduction in capacity both at the plant and in the conveyance system can contribute to CSOs in wet-weather conditions and sanitary sewer overflows in dry-weather conditions.
The additional flow adds to treatment, power, repair, and other costs. The yearly cost of treating salt water entering the King County wastewater system has been estimated at $0.5 to $1.0 million (King County, 2012). The costs for power to pump flows are greater because of the increase in flows. In addition, the County continues to incur the costs of rehabilitating corroded equipment. Repairing all damaged clarifiers at West Point after only seven years of service cost $1.2 million in 2003, and it cost almost $0.6 million to repair and replace gates at the plant. Many small repairs go unreported as saltwater-related damage.
Predicted rises in sea level could increase the inflow of salt water into the system. This Phase I hydraulic analysis found that 20 facilities are at risk of saltwater inflow because their weir elevations are lower than the highest predicted tides. Eight of the facilities are not protected by flap gates. These facilities are at greatest risk because they can allow the most inflow. The Kingdome Regulator Station would experience the largest inflow volumes and more frequently—both under existing and predicted high tides—than the other seven facilities without flap gates. For all facilities, even those that would contribute the smallest amounts of inflow at any given occurrence, volumes would add up over a given year.
To account for evolving conditions and predictions, SLR literature should be reviewed in conjunction with updates to the Conveyance System Improvement Program and the CSO Control Program. Given the current flux of climate change research, it is likely that findings presented in this report will change as the result of changes in estimates of the rate of SLR and the frequency of storm events.
SLR should be included as a factor in planning for asset rehabilitation or conveyance planning that involves any of the facilities included in this analysis. Adaptive strategies to reduce the risk of saltwater inflow should be adopted and designed into rehabilitation or upgrades based on the outcome of a risk analysis for a site and an analysis comparing benefits and costs of adopting the adaptive strategy. Phase II of this hydraulic analysis will conduct such a risk analysis and will recommend adaptive strategies.

November 2012 Phase I, Hydraulic Analysis of Effects of Sea-Level Rise on King County’s Wastewater System 32
5.0 REFERENCES Csatho, B., Schenk, T., Van der Veen, C.J., and Krabill, W.B. 2008. Intermittent Thinning of
Jakobshavn Isbrae, West Greenland, Since the Little Ice Age. Journal of Glaciology, 54 (184).
Hansen, J.E. 2007. Scientific Reticence and Sea Level Rise. Environmental Research Letters, 2, 024002. http://pubs.giss.nasa.gov/docs/2007/2007_Hansen.pdf.
Intergovernmental Panel on Climate Change (IPCC). 2007. Climate Change 2007: The Physical Science Basis. Contribution of Working Group I to the Fourth Assessment Report of the Intergovernmental Panel on Climate Change. Solomon, S., Qin, D., Manning, M., Chen, Z.,. Marquis, M., Averyt, K.B., Tignor, M. and Miller, H.L. (Eds.). Cambridge, UK, and New York, NY: Cambridge University Press.
King County. 2003a. Saltwater Intrusion into the King County Sewer System. King County Department of Natural Resources and Parks, Wastewater Treatment Division, Facilities Inspection Unit.
King County. 2003b. West Point Treatment Plant Corrosion Control Investigation. Prepared for King County Department of Natural Resources and Parks, Wastewater Treatment Division, by Tinnea & Associates and U.S. Department of Energy, Albany Research Center.
King County. 2008. Vulnerability of Major Wastewater Facilities to Flooding from Sea-Level Rise. King County Department of Natural Resources and Parks, Wastewater Treatment Division.
King County. 2011. Saltwater Intrusion and Infiltration into the King County Wastewater System. King County Department of Natural Resources and Parks, Wastewater Treatment Division.
King County. 2012. CSO Incremental Cost Summary. King County Department of Natural Resources and Parks, Wastewater Treatment Division.
Mote, P., A. Petersen, S. Reeder, H. Shipman, and L. Whitely Binder. 2008. Sea Level Rise in the Coastal Waters of Washington State. Report prepared by the Climate Impacts Group, University of Washington, Seattle, Washington, and the Washington State Department of Ecology, Lacey, Washington.
University at Buffalo. 2008, February 12. Global Warming: Sea Level Rise Could Be Twice As High As Current Projections, Greenland Ice Sheet Study Suggests. ScienceDaily. Retrieved March 4, 2008, from http://www.sciencedaily.com. See Csatho et al. for a full citation of the source document.
Zervas, C.E. 2005. Response of Extreme Storm Tide Levels to Long-Term Sea Level Change. Oceans, 2005, Proceedings of MTS/IEEE, 3, 2501-2506.
Zervas. 2007. Personal communication with Sascha Peterson, University of Washington Climate Impacts Group. November 9.