Hydration: Fluids for Life - ILSI North America | North...
50
ILSI North America Monograph Series Hydration: Fluids for Life Ann C. Grandjean Sheila M. Campbell
Transcript of Hydration: Fluids for Life - ILSI North America | North...

ILSI North America MonographSeries
Hydration:Fluids for Life
Ann C. GrandjeanSheila M. Campbell

i
ILSI North America
Hydration:Fluids for Life
A Monograph by theNorth American Branchof the International LifeSciences Institute
Ann Grandjean, EdD, FACN, CNSSheila Campbell, PhD, RD

ii
© 2004 ILSI North America
All rights reserved.
No part of this publication may be reproduced, stored in a retrieval system, or trans-mitted, in any form or by any means, electronic, mechanical, photocopying, record-ing, or otherwise, without the prior written permission of the copyright holder. The International Life Sciences Institute –North American Branch (ILSI NA) does not claim copyright in U.S. Government information.
Authorization to photocopy items for internal or personal use is granted by ILSI for libraries and other users registered with the Copyright Clearance Center (CCC) Transactional Reporting Services, provided that $0.50 per copy per page is paid directly to CCC, 222 Rosewood Drive, Danvers, MA 01923. (508) 750-8400.
The use of trade names and commercial sources in this document is for purposes of identification only, and does not imply endorsement by ILSI North America. In addition, the views expressed herein are those of the individual authors and/or their organizations, and do not necessarily reflect those of ILSI North America.
ILSI North AmericaOne Thomas Circle, NW, Ninth FloorWashington, DC 20005
ISBN 1-57881-182-1
Printed in the United States of America

iii
Contents
Foreword _____________________________________________ v
About ILSI and ILSI North America ________________________vi
Acknowledgments _____________________________________ vii
Hydration — Fluids for Life ______________________________ 1
Appendix A __________________________________________ 29
Appendix B __________________________________________ 30
References ___________________________________________ 32

iv

v
FOREWORD
Poets have called water the elixir of life. Scientists and clinicians, who are more pragmatic and less dramatic, call water a nutrient. Poets’ depiction may in fact be more appropriate, as water is second only to oxygen as essential to life. As stated in an ancient proverb: A man can live three weeks without food, three days without water, but only three minutes without air.
After we assumed for years that our thirst would ensure sufficient water intake, we are beginning to appreciate the impact of body water, and the balance thereof, and recognize the detriments of reduced body water and electrolyte imbalances. The incidence of deaths in otherwise healthy young adults, the increased awareness of dehydration in nursing home residents, and other recent research findings about type and amount of fluids that support hydration increase the value of this monograph.
The Lead Review Article published in Nutrition Reviews in August 2003, reviewed by the ILSI North America Project Committee on Hydration, provides a comprehensive, albeit brief, overview of pertinent aspects of hydration. For the most part, the review article is current. However, the recent publication of the Dietary Reference Intakes for Water, Potassium, Sodium, Chloride, and Sulfate (Food and Nutrition Board [FNB] 2004) renders the section on recom-mended intakes obsolete. Additionally, due to space, the coverage of some topics, especially basic physiology and population-specific information, is limited. Therefore, the ILSI North America Project Committee on Hydration commissioned this concise monograph.
This monograph provides readers with an overview of current knowledge related to the functions of water, methods of determin-ing hydration status, sources of water in the diet, and specific considerations for infants, children, physically active individuals, and the elderly. Recommended intakes, as specified by the FNB in the 2004 Dietary Reference Intakes for water, are also covered. For additional reading and more detailed explanations of the informa-tion herein, a list of references is provided.
“Thousands have lived without love, not one without water.”
W. H. Auden
(1907-1973)

vi
About ILSI and ILSI North America
The International Life Sciences Institute (ILSI) is a nonprofit, worldwide foundation based in Washington, D.C. established in 1978 to advance the understanding of scientific issues relat-ing to nutrition, food safety, toxicology, risk assessment, and the environment. ILSI branches include Argentina, Brasil, Europe, India, Japan, Korea, Mexico, North Africa and Gulf Region, North America, North Andean, South Africa, South Andean, Southeast Asia Region, the Focal Point in China, and the ILSI Health and Environmental Sciences Institute. ILSI also accomplishes its work through the ILSI Research Foundation (composed of the ILSI Hu-man Nutrition Institute and the ILSI Risk Science Institute) and the ILSI Center for Health Promotion.
The North American branch of the International Life Sciences Institute (ILSI N.A.) is a public, non-profit scientific foundation. ILSI N.A. advances the understanding and application of scientific issues related to the nutritional quality and safety of the food sup-ply, as well as health issues related to consumer self-care products. The organization carries out its mission by sponsoring relevant research programs, professional education programs and work-shops, seminars, and publications, as well as providing a neural forum for government, academic, and industry scientists to discuss and resolve scientific issues of common concern for the well-being of the general public. ILSI N.A.’s programs are supported primarily by its industry membership.
For more information, visit www.ilsi.org

vii
Acknowledgements
This monograph was created with the support of the ILSI N.A. Project Committee on Hydration. The committee was established in 2001 to investigate broad issues of hydration including the scien-tific understanding of adequate hydration sources, the fluid/disease relationship, and the role of foods and beverages in maintaining hydration. The committee is grateful for the invaluable support of scientific advisors Dr. Ann Grandjean, UNMC Center for Human Nutrition and Dr. Suzie Harris, ILSI Human Nutrition Institute. The commit-tee wishes to express its sincere thanks to Dr. Sheila Campbell for her valuable contribution in the writing of the document. The com-mittee also wishes to convey its great appreciation and gratitude to Dr. Ann Grandjean as main author of the document. The commit-tee is also appreciative of the dedicated work of committee chair Dr. Maxime Buyckx, The Coca-Cola Company, and Ms. Heather Hartland Steele, committee manager.
ILSI North America Project Committee on Hydration
Cadbury Adams USA, LLC Campbell Soup Company The Coca-Cola Company Danisco USA Kraft Foods, Inc. Nestlé, USA, Inc. The Gatorade CompanyUnilever Bestfoods NA

viii

1
Hydration – Fluids for Life
Water is by far the most abundant substance on earth and in our bodies. For example, approximately six pounds of an eight-pound baby is water. Water is not only abundant, it is essential to life, as all metabolic processes occur in a water medium. This monograph reviews the functions and distribution of water throughout the body, describes imbalances that occur, presents current recommendations for water consumption, and delineates and describes age-specific issues.
Functions and Distribution of Body WaterWater, because of its many properties, performs numerous distinct and vital bodily functions. Instrumental properties of water include the following.
Water transports nutrients to cells, wastes from cells, and substanc-es, such as hormones, enzymes, blood platelets, and blood cells. As such, it facilitates cellular metabolism and proper cellular chemical functioning.
Water is an excellent solvent and suspending medium. Many sub-strates dissolve or become suspended in water, and thus can react to form new compounds. This attribute of water also facilitates excre-tion of waste products and toxins in urine.
Water, the solvent, combines with viscous molecules to form lu-bricating fluids for joints, mucous that lubricates the digestive and genitourinary tracts, serous fluid that lubricates the viscera, and saliva and other secretions that lubricate food as it passes through the digestive tract.
Water absorbs heat with relatively little change in water tempera-ture. Because of this heat-storing ability, water helps regulate body temperature by absorbing heat and releasing it through production and evaporation of perspiration.
•
•
•
•

2
Water is an important structural unit in the body. It maintains cel-lular shape, is an integral part of cell membranes, cushions organs, and helps maintain body structures.
The amount of water in the human body, commonly called total body water (TBW), varies due to age, sex, muscularity, and adipos-ity. In healthy individuals, TBW changes little except as a result of growth, weight gain, weight loss, or conditions such as pregnancy and lactation. The amount of TBW does vary significantly however from individual to individual due to a variety of factors. Fat-free mass in adults is approximately 70% to 75% water, while adipose tissue is approximately 10% to 40% water. Accordingly, women tend to have a lower percent of body water than men because of a relatively higher percentage of fat. With increasing adiposity, the water portion of adipose tissue decreases (Laaksonen 2003).
As we age, total body water (TBW) decreases primarily due to loss of muscle mass (Rose 2001). For example, if female, the newborn who is 74% water at birth will be 47% water by age 51; if male, 56% at the same age. Table 1 demonstrates the impact of age and gender on TBW.
Effectively, TBW is distributed between two compartments. All fluids outside the cells are collectively referred to as extracellular fluid (ECF), while water inside cells is called intracellular fluid (ICF). ECF is further divided into three compartments. The largest -- interstitial fluid -- makes up more than three-fourths of ECF and plasma comprises almost one-fourth. Transcellular fluid volume is small, about 1 to 2 liters, and includes such fluids as synovial, peritoneal, pericardial, cerebrospinal, and intraocular.
•
Table 1. Total Body Water (TBW) as a Percentage of Total Body Weight in Various Age and Gender Groups
Population TBW as % of Body Weight, Mean (range)
Newborn to 6 months 74 (64-84)6 months to 1 y 60 (57-64)1 to 12 y 60 (49-75)12 to 18 y, M 59 (52-66)12 to 18 y, F 56 (49-63)19 to 50 y, M 59 (43-73)19 to 50 y, F 50 (41-60)51+ y, M 56 (47-67)51+ y, F 47 (39-57)
M = males; F= females.Source: FNB (2004); original source Altman (1961).

3
The fluid inside each of the trillions of body cells is collectively called the ICF, and thus ICF is not truly a single compartment. Compartment is a non-specific term that generally refers to a region in the body with a unique chemical composition or a unique behav-ior. Cells in various tissues differ in both solute content and concen-trations. However, the concentrations of sodium and chloride are high in ECF and low in ICF. Potassium, on the other hand, is high in ICF and low or absent in ECF. This similarity compared to ICF is why the fluid from all the different cells is collectively considered to be one large fluid compartment. ICF is the medium in which major cellular processes, such as enzymatic reactions, occur and therefore, the body strives to maintain a stable ionic environment.
ECF functions as a conduit between cells and organs, and regulates ICF volume and ionic strength. ECF can be further divided into plasma and interstitial fluid. Interstitial fluid is the fluid that bathes all cells. A minor subdivision of ECF is the transcellular compart-ment which includes such fluids as cerebrospinal, intraocular, pleural, peritoneal, and synovial fluids, and digestive secretions.
Interstitial fluid fills the spaces between cells, linking ICF and the intravascular compartment. Although bone and dense connective tissue contain about 15% of TBW, this fluid is mobilized slowly compared to fluid in other compartments. Transcellular fluid is the small amount of fluid made up of body fluids formed from cellular transport activities (e.g., urine, cerebrospinal fluid, gastrointestinal fluids). In subsequent sections, the size and distinctive composition of these compartments, factors that maintain their characteristics, as well as causes and effects of disruption are considered.
The amount of solute within a compartment determines the volume or compartment size. The movement of water between the two compartments is controlled not only by osmotic differences but by a balance of oncotic and hydrostatic pressures in both compartments. Oncotic pressure is created by colloids (mainly plasma proteins) that are normally retained within the vascular system. Oncotic pressure nearly offsets the hydrostatic pressure, resulting in small amounts of fluid crossing the vascular barrier. In homeostasis, or steady state, the size of each compartment is stable. Composition of the fluids in the various body fluid compartments vary as shown in Table 2.
The regulation of cellular hydration and volume is important for maintenance of cell function (Lang and Waldegger 1997). Cells adapt to external osmotic stress by accumulating low-molecular-weight inorganic ions and organic osmolytes (Häussinger 1996).

4
Key inorganic ions are sodium, potassium, chloride, and bicarbon-ate. Sodium, the major extracellular ion, is the primary osmolyte maintaining total body water volume and the ratio between extra-cellular and intracellular fluid volume. The fluid volumes of the main extracellular compartments, plasma and interstitium, depend primarily on total body sodium and its attendant anions (mainly chloride and bicarbonate), since these constitute 90% to 95% of the total osmotically active particles in extracellular fluid (Valtin and Schafer 1995). Disturbances in total body sodium content are mani-fested by changes in extracellular volume whereas disturbances of total body water content are manifested as disturbances in the serum sodium concentration. Although plasma proteins are a major component of plasma by weight (about 70g/L) they contribute less than 1% to the total osmolality of plasma. Because cell membranes are highly permeable to water, movement of water between ICF and ECF is controlled by each compartment’s osmolality.
In addition to inorganic ions, some cells accumulate or release organic compounds in response to cell swelling or shrinkage (Häussinger 1996; Lang and Waldegger 1997). There are only a few classes of organic osmolytes-polyols such as inositol and sorbitol, methylamines such as betaine and a-glycerophosphocholine, and certain amino acids such as taurine. They are non-perturbing to cel-lular metabolism even at high concentrations.
Table 2. Electrolyte Concentrations in Extracellular and Intracellular Fluids
Plasma Interstitial Fluid Plasma Water Cell Water in Muscle
(mEq/L) (mmol/L) (mEq/L) (mmol/L) (mEq/L) (mmol/L) (mEq/L) (mmol/L)
Na+ 140 140 145.3 145.3 149.8 149.8 13 13K+ 4.5 4.5 4.7 4.7 4.8 4.8 140 140CA2+ 5.0 2.5 2.8 2.8 5.3 5.3 1 x 10⁻⁷ 0.5 x 10⁻⁷
Mg2+ 1.7 0.85 1.0 0.5 1.8 0.9 7.0 3.5Cl- 104 104 14.7 114.7 111.4 111.4 3 3HCO- 24 24 6.5 26.5 25.7 25.7 10 10SO 2/4- 1 0.5 1.2 0.6 1.1 0.55 — —Phosphate 2 1.1a 2.3 1.3a 2.2 1.2a 107 57b
Protein 15 1 8 0.5 16 1 40 2.5c
Organic anions 5 5d 5.6 5.6d 5.3 5.3d — a The calculation is based on the assumption that the pH of the extracellular fluid is 7.4 and the pK of H2PO4 is 6.8.b The intracellular molal concentration of phosphate is calculated with the assumption that pKs of organic phosphates are 6.1 and the intracellularpH 7.0.c The calculation is based on the assumption that each mmol of intracellular protein has an average 15 mEq, but the nature of cell proteins is not clearly known.d The assumption is that all the organic anions are all univalent.Source: Oh and Uribarri (1999).

5
Because maintaining normal blood osmolality (280 mOsm/kg H20) is vital, the body has a number of mechanisms to ensure water bal-ance. A rise in blood osmolality as small as 1% to 2% causes the hypothalamus to secrete vasopressin. Vasopressin stimulates thirst and a powerful urge to drink. At the same time, the pituitary gland secretes antidiuretic hormone, which causes the kidneys to con-centrate urine and minimize urine volume. The state of hydration and classifications of dehydration are determined, in part, by the distribution of water between these two compartments.
Water Balance, Exchange, and ImbalancesBody water balance refers to the net results of balance between wa-ter intake and water loss (Mudge and Weiner 1990). When the net difference is equal, water balance is maintained. Assuming fluids are available, thirst results in fluid consumption, and if unusual conditions don’t impact the major routes of water loss, water bal-ance is maintained. Hydration and euhydration are terms commonly used to describe the state of water balance.
Minor perturbations in hydration status are difficult to measure (Shirreffs 2000; Speedy 2001). Because the body is constantly striving to preserve plasma volume and regain homeostasis, bio-markers are transient at any point during the process of dehydration and rehydration. As such, sensitivity of a given biomarker will vary based on the duration and severity of dehydration (Francesconi et al.1987; Walsh et al. 1994). Investigators have repeatedly attempted to measure hydration status using biochemical markers (Francesco-ni et al. 1987; Armstrong et al. 1994; Walsh et al. 1994; Bergeron et al. 1995; Gorelick et al. 1997; Pollock et al. 1997; Armstrong et al. 1998; Shirreffs and Maughan 1998; Grandjean et al. 2000; Popow-ski et al. 2001) but none have identified an unequivocal correlate with acute, small changes in body weight.
While urine and blood assays remain the cornerstone of clinical assessment of hydration, body weight change remains the most universal, valid, economical, and feasible surrogate for body water change. Impedance and dilution techniques may provide new research opportunities, but have limited practical use. Regardless of the method chosen, assessing hydration status with a series of measures increases the validity of the assessment. A brief review of some of the available methods follows.
Impedance and Dilution Techniques. Dilution techniques for assessment of total body water theoretically afford the opportunity, when measured repeatedly, to directly assess changes in hydration status. However, a single measure does not indicate hydration sta-

6
tus. While assessing changes via repeated measurements of TBW allows for determining hydration state, the technical requirements, cost, and demands on the individual being tested make the method impractical for routine use. Dilution techniques utilize markers such as antipyrine, deuterium oxide (D2O), and titrated water (HTO). Bioelectrical impedance analysis (BIA) and bioelectrical impedance spectroscopy (BIS) use electrical current to measure conductivity of the body tissues.
Typically, the measure of TBW is not an end in and of itself. Com-mon applications are to predict fat-free mass in the case of BIA, or used in combination with 18O, to predict total energy expenditure, as is the case with deuterium oxide dilution technique. At issue with dilution and impedance methodologies, in addition to incon-venience and cost, are measurement error and lack of validation in all populations (Zappe et al. 1993; Valtin 1995; Koulmann et al. 2000; FNB 2004). It has been estimated that the measurement error for the dilution technique is approximately 1% to 2% (Thomas et al. 1999). BIA and BIS have been found to vary from the dilution technique by 2 to 3 liters (Schoeller 1996; Ellis and Wong 1998). Additionally, BIA loses resolution with isotonic fluid loss (FNB 2004). Impedance and dilution techniques may provide new re-search opportunities, but have limited practical use.
Plasma Indicators. Plasma osmolality is closely controlled by homeostatic systems and is the primary physiologic signal to regulate water balance. Plasma osmolality rarely varies more than ± 2%, with 280 to 290 mOsm/kg being the “set-point.” However, there is an increase in this “set-point” with aging and the variabil-ity between people also increases with age. In severe dehydration serum osmolality increases. While osmolality is frequently used, plasma volume may be more sensitive than serum osmolality during dehydration (Shirreffs and Maughan 1998).
In addition to plasma osmolality, numerous blood indices are used to assess hydration status such as testosterone, adrenaline, nor-adrenaline, cortisol, atrial natriuretic peptide, aldosterone, blood urea nitrogen (BUN), BUN/creatinine ratio, sodium, potassium, he-matocrit, and plasma protein (Lavizzo-Mourey et al. 1988; Dauter-man et al. 1995; Hackeny et al. 1995; O’Brien et al. 1996; Shirreffs and Maughan 1998; Speedy et al. 2001). The blood parameter chosen as a marker depends on the situation, and corroboration with weight change and clinical signs increases validity of the marker.
Urine Indicators. Urine is commonly used to assess hydration status (Francesconi et al. 1987; Armstrong et al. 1994; Walsh et

7
al. 1994; Wilmore and Costill 1994; Weinberg and Minaker 1995; Arant 1996; Pollock et al. 1997; Shirreffs and Maughan 1998; Yankanich et al. 1998; Popowski et al. 2001). Urinary measures such as specific gravity and osmolality have been reported to be more indicative of non-acute moderate levels of impending or ac-tual dehydration than are blood measurements such as hematocrit, serum osmolality or plasma sodium (Walsh et al. 1994; Armstrong et al. 1998; Popowski et al. 2001). Urine color has been correlated with urine-specific gravity and osmolality in the field setting (Armstrong et al. 1994; Popowski et al. 2001). Urine-specific grav-ity and osmolality have, however, been shown to lag behind plasma osmolality changes during rapid (<4 hours) dehydration (5% body weight) (Francesconi et al. 1987). Hence, the validity of urine mark-ers depends on the clinical or research conditions. Additionally, renal function declines with aging, thus urine volume and concen-tration are not good indicators of hydration status in older adults.
Urine volume varies inversely with hydration and thus is often used as an indicator of hydration status. A urine output of approximately 100 mL/hour indicates a hydrated state, with higher outputs (300 to 600 mL/hr) most likely indicating excess fluid ingestion. Dehy-dration is likely at an output of less than 30 mL/hr. While a good indicator, the inconvenience of 24-hour collection and the potential of sample loss make urine volume an infrequently used marker. Like blood, the urine parameter chosen as a marker depends on the situation, and corroboration with weight change and clinical signs increases validity of the marker.
Body Weight Changes. While urine and blood assays remain the cornerstone of clinical assessment of hydration, body weight change remains the most universal, valid, economical, and feasible sur-rogate for body water change. Essential to body weight as a mea-sure is controlling for confounding factors. If properly controlled, body weight changes can provide a more sensitive estimate of total body water changes than repeat measurements by dilution methods (Gudivaka et al. 1999). Regardless of the method chosen, assessing hydration status with a series of measures increases the validity of the assessment.
As stated before, body water balance is the net results between wa-ter gain and water loss. Usually, healthy adults respond to negative fluid balance by increasing fluid intake and concentrating urine to reduce fluid output. Consequently, negative fluid balance is usually short-lived and self-limiting. However, a variety of factors influenc-es both water loss and consumption, and therefore has the potential of negatively impacting hydration.

8
Water LossFor sedentary to moderately active individuals under temperate conditions, water is lost from the body via urine, feces, respira-tion, and evaporation. The minimal amount of fluid loss that can occur is referred to as the obligatory water loss. However, a variety of factors can affect obligatory loss. For example, obligatory urine loss occurs because of the need to remove various solutes from the body. The minimum water required for urine is dependent on the daily solute excretory load (primarily determined by diet) and the maximum urinary concentration achievable (Howard 1998; Singer and Brenner 1998). Urinary concentrating ability varies with age (Bergmann et al. 1974; Phillips et al. 1984) and with renal disease. Under normal conditions, fecal water loss is quite small, estimated at about 100 mL/day (Alper 1968; FNB 1989). A brief review of the types of water losses follows.
Insensible Water Loss and Sweat. Water that passes through the skin (transepidermal diffusion) and is lost by evaporation, and wa-ter that is lost from the respiratory tract, is referred to as insensible water loss. Insensible water correlates with metabolic heat dissipa-tion (Benedict and Root 1926; Johnston and Newburgh 1930). Even when caloric expenditure and body surface area are equal, however, insensible water loss through the skin and lungs varies. Environ-mental temperature and humidity, barometric pressure, altitude, volume of air inspired, air currents, clothing, blood circulation through skin, and water content of the body can all affect insensible water loss (Newburgh and Johnston 1942). The volume of respira-tory water, for example, is impacted by physical activity, hypoxia, and hypercapnia. Physical activity has a greater effect on both insensible water loss and sweat loss than environmental conditions (see Figure 1).
When radiation is not adequate to dissipate excess body heat, sweating occurs. Under conditions of thermal and/or physical stress, evaporation of sweat becomes the primary means of heat loss in an attempt to maintain ideal body temperature. A physically active person living in a hot climate can lose several liters of sweat a day. (See section on physically active children and adults.)
Urinary Water Loss. The kidneys are able to conserve water dur-ing periods of deprivation and to excrete water when fluid intake is excessive, making them the major determinant of total body water balance. The kidneys also play a central role in maintaining solute balance since excretion of the major solutes is determined by the kidneys. It is the balance between solute and water intake, and solute and water excretion that determines the osmolality of the dif-ferent body compartments.

9
The minimal amount of water lost via the kidneys is the quantity needed for the renal solute load (RSL). RSL refers to all solutes, most derived from the diet, which must be excreted by the kidneys. Under steady state conditions the daily solute excretion must equal the daily solute load. Excretion of RSL requires the excretion of a certain amount of water as urine, and thus, the amount of obligatory urine water is dependent on both the solute load and renal concen-trating ability. The major contributors to RSL for adults are urea, sodium, chloride, and potassium. When dietary composition is known, RSL for adults can be computed as follows:
RSL (mOsm) = [protein (g) x 5.7] + [sodium (mEq)] + [potassium (mEq)] + [chloride (mEq)] (Fomon and Ziegler 1999).
The usual solute excretion in adults ranges between 600 and 900 mOsm/day. Maximal renal concentrating ability is approximately 1,200 mOsm/kg water. Thus the minimum urine output is ap-proximately 500 mL/day. By way of contrast, if an individual were totally unable to concentrate the urine, the same solute load of 600
Daily Water Requirements
Daily Mean WBGT, °F 50 60 70 80 90 100 110
Hard Work(5600 kcal/day)
Moderate Work(4400 kcal/day)
Light-Mod Work(3500 kcal/day)
Light Work(2800 kcal/day)
Sedentary(1800 kcal/day)
5 10 15 20 25 30 35 40 45Daily Mean WBGT, °C
22
20
18
16
14
12
10
8
6
4
2
0
Dai
ly W
ater
Req
uire
men
ts, Q
uart
s/da
y
Figure 1. Approximate daily water requirements as a function of climatic temperature (Wet Bulb Globe Temperature, WBGT) and total energy expenditure (kcal). Reprinted with permission from Sawka and Montain (2001). Copyright 2001 by International Life Sciences Institute.

10
mOsm/day would require 8 L/d of urinary water. Even at a fixed solute excretion rate, obligatory renal water losses are not constant, due to the renal concentrating ability. Assuming a constant RSL and normal concentrating ability, urine volume is determined by fluid intake.
Fecal Water Loss. Although it can vary, normal stools contain about 70% water, whereas hard stools contain 40% to 60% (Devro-ede 1993). Under normal conditions, fecal water loss is estimated at 100 mL daily for adults. In cases of diarrhea, losses are greater.
Pathological Losses. Pathological losses of fluid and electrolytes include losses from the gastrointestinal (GI) tract, through the skin, lungs, and kidneys. Examples of abnormal GI tract losses include diarrhea, vomiting, gastric drainage, and fistula output. Abnormal skin loss occurs with fever, increased metabolism, and burns. Fever and hyperventilation can increase water lost through the lungs. Ab-normally high amounts of water can be lost via the kidneys due to diuretic therapy, and certain hormonal deficiencies. Miscellaneous pathological losses include drainage from the pleural and peritoneal cavity, bleeding, seepage from burns, and fluid loss during dialysis. Additionally, medical therapies such as dry oxygen air fluidized beds, phototherapy, and radiant warmers increase insensible water losses (Breslow 1994; Anderson, 2000).
Water Gain While there are numerous routes for losing body water, under normal conditions there are only two routes for gaining water, the production of metabolic water and oral consumption.
Metabolic. Metabolic water is a by-product of metabolism, and is proportional to the energy expenditure, with minor adjustment for the specific substrate oxidized. Thus, the higher the energy expen-diture, the greater the volume of metabolic water. Extrapolating available data, an energy expenditure of ~2,500 kcal/day yields ap-proximately 250 mL/day of metabolic water, or about 8.5 ounces.
Consumption. Water contained in the food we eat and the fluids we drink constitute all but a small amount of the total amount of daily water. Data from national surveys show that approximately 20% to 25% of daily water consumed comes from food and 75% to 80% from beverages (FNB 2004). However, significant variability exists. For example, data from NHANES III shows that while the average daily intake of food water for men 31 to 50 years old is 761 mL/day, the 1st percentile’s contribution from food is 264 mL/day with the 99th percentile for the same age averaging 1,519 mL/day.

11
Variance is also great for the amount of daily water consumed as beverages. For men 31 to 50 years old, the average beverage (includ-ing plain water) consumption was 3,089 mL/day with the 1st and 99th percentiles being 1,054 mL and 7,114 mL per day respectively.
Water ImbalanceThe body strives to maintain fluid and electrolyte homeostasis despite wide variations in intake and losses. Nonetheless, physical, behavioral, and environmental conditions can surpass the lim-its of homeostatic mechanisms, resulting in fluid and electrolyte imbalances. Water imbalances, dehydration and water toxicity, are defined based on the amount of salt and water lost or gained.
Dehydration can adversely effect physical and mental functioning, and has been indicated as a contributing or exacerbating factor in some diseases. Dehydration is classified depending on the quantity of salt loss in relation to the water loss. Isotonic, hypertonic, and hypotonic are the three general classifications. Net salt and water losses are equal in isotonic hydration, whereas water loss is dispro-portionate to salt loss in both hypotonic and hypertonic. Table 3, “Classifications of Dehydration,” outlines the aberration and poten-tial etiologies of the aforementioned classifications of dehydration.
Assuming equal amounts of total body water loss, net alterations in body composition occur in intracellular volume (ICV) and extracel-lular volume (ECV). In isotonic dehydration, ICV is maintained
Table 3. Classifications of Dehydration
Type Aberration Etiology
Isotonic Dehydration Isotonic loss of water and salt from ECF Ascites Does not cause osmotic water shift Diuretic therapy from ICF Gastrointestinal fluid losses Aspiration of pleural effusion Inadequate fluid and salt intake
Hypertonic Dehydration Water loss exceeds salt loss Vomiting Osmotic shift of water from cells into Sweat loss ECF (plasma and interstitial) Osmotic diuresis Osmotic diarrhea Inadequate water intake
Hypotonic Dehydration More salt lost than water Sweat loss Osmotic shift of water from ECF Gastrointestinal fluid losses (plasma and interstitial) into cells Thiazide diuretics, especially in elderly Water replacement without adequate sodium and potassium replacement

12
while ECV decreases. Both ECV and ICV decrease in hypertonic dehydration, and ICV depletion depends on the magnitude of hypertonicity. In hypotonic dehydration, ECV is significantly de-creased and ICV is increased.
Isotonic Dehydration. Isotonic dehydration results when equal amounts of body water and sodium are lost (Reese 1991). Gastro-intestinal (GI) fluid losses through diarrhea, vomiting, nasogastric suction, or excessive GI ostomy output put people at risk for the condition because loss of GI fluids results in loss of water and electrolytes.
Hypertonic Dehydration. Hypertonic dehydration occurs with loss of water alone or when water losses are greater than sodium losses (Reese 1991). This type of dehydration is also called hypernatremic dehydration, water deficit, and volume depletion dehydration.
Hypertonic dehydration can occur whenever body water is lost through conditions and therapies such as the following.
Conditions such as elevated ambient temperature, exercise, burns, skin breakdown, tachypnea, or fever.
Therapies such as dry oxygen air fluidized beds, phototherapy, and radiant use of warmers.
Medications that increase body water loss or cause thirst or diarrhea (Breslow 1994; Anderson 2000).
Hypotonic Dehydration. Salt losses greater than water losses results in hypotonic dehydration (Reese 1991). This type of dehy-dration can occur when diuretics are used along with a low-sodium diet. Other causes include glucocorticoid deficiency, hypothyroid-ism, and syndrome of inappropriate antidiuretic hormone secretion (Kugler 2000).
Other terms for loss of water and electrolytes are water and electro-lyte deficit, hyponatremic dehydration, and volume and electrolyte depletion.
Acute water toxicity (or water intoxication) can occur with con-sumption of large quantities of fluids that exceed the kidneys’ ability to excrete the excess water. The kidneys’ maximal excretion rate is approximately 0.7 to 1.0 L/hour (FNB 2004). Water intoxica-tion can lead to hyponatremia, which can be life threatening. Cases of water intoxication, hyponatremia, and deaths have been reported in psychiatric patients (de Leon et al. 1994), infants (Keating et
•
•
•

13
al. 1991; Arieff and Kronlund 1999), military personnel (Gardner and Gutmann 2002), and in social situations (Arieff and Kronlund, 1999).
The importance of consuming adequate fluids to avoid dehydra-tion has been aggressively communicated to physically active people. However, the importance of fluid consumption has, in some cases, overshadowed the risk of consuming too much plain water, which can lead to hyponatremia. This type of hyponatremia (serum sodium <135 mmol/L) (Montain et al. 2001) occurs when the individual, in an effort to avoid heat illness, diligently consumes copious amounts of water while consuming inadequate sodium. The condition has been reported to occur primarily during prolonged exertion, such as ultra marathons, recreational hiking, and military training (Montain et al. 2001). If severe, hyponatremia leads to lung congestion and brain swelling. Central nervous system (CNS) symptoms include headache, fatigue, anorexia, lethargy, confusion, disorientation, hyper-irritability, nausea, vomiting, seizures, and coma. Musculoskeletal symptoms include cramps, muscle twitch-ing, and weakness. Ironically, the symptoms mimic heat illness, and if treated as dehydration, the situation worsens. Rapid correc-tion of chronic hyponatremia may be dangerous, leading to brain edema and seizures. In most cases, hyponatremia can be corrected with no long-term sequela, but in extreme cases of water overload, called water intoxication, the situation is fatal (Montain et al. 2001). Additional articles are available for a more in depth discussion of hyponatremia (Garigan and Ristedt 1999; O’Brien et al. 2001).
Requirements and Recommended IntakesThe Food and Nutrition Board (FNB) of the Institute of Medicine was established in 1940 to advise the government on nutrition problems as they related to national defense. The first table of Recommended Dietary Allowances (RDAs) was published in 1941, and has since been updated throughout the years, with the 10th and final edition published in 1989. RDAs have been applied far more broadly than originally intended, becoming the US standard for dietary assessment and planning. In 1994, the Institute of Medicine announced its plan to revise and expand the RDAs and establish Di-etary Reference Intakes (DRIs) (FNB 1994), publishing the first of a series of DRIs in 1997. DRIs go beyond RDAs, encompassing the Estimated Average Requirement (EAR), the Adequate Intake (AI), and the Tolerable Upper Intake Level (UL), as well as the RDAs.
The RDA for a nutrient is the average daily dietary intake level that is sufficient to meet the nutrient requirement of nearly all (97% to 98%) healthy individuals in a particular life stage and gender group.

14
Establishing an RDA requires that the EAR be determined. Es-tablishing an EAR requires that a specific indicator or criterion of adequacy exists and that research data are available to determine a level that meets the needs of half of the healthy individuals in a life stage and gender group. Data on water requirements are deemed in-sufficient or inadequate to establish an EAR, and thus an AI instead of an RDA has been chosen.
An AI is based on experimentally derived intake levels or approxi-mations of observed mean intakes of healthy people. An AI is ex-pected to meet or exceed the amount needed to maintain a defined nutritional state or criterion of adequacy in essentially all members of a specific healthy population.
As stated in the DRIs for water and electrolytes report, there is much less certainty about the AI value than about the RDA value, due to the fact that AIs depend on a greater degree of judgment. Thus, AIs must be used with greater care than RDAs.
A requirement is the lowest amount needed to result in a predeter-mined physiologic endpoint, e.g., hydration. A recommendation, the DRIs for example, is the intake of nutrients deemed to meet the “re-quirement” for that nutrient by most healthy members of a specific population, e.g., men 19 to 50 years old, girls 9 to 13 years old.
The amount of water needed to replace losses is the absolute requirement. Whereas requirements are impossible to predict precisely, except under controlled conditions, recommendations are standards to be used in the assessment and planning of diets for individuals and for groups, and for establishing policy.
Studies measuring fluid losses, fluid intake, and fluid balance have provided means, standard deviations, and ranges. From those data, statements, tables, and figures have been made to exemplify the quantity of fluid gained and lost by males and females of various ages and under various conditions. However, recommendations are not requirements.
Water requirements are determined by an individual’s metabolism, environmental conditions, and activity level, and are therefore extremely variable. Not only do requirements vary from individual to individual, but can vary greatly for a given individual from day to day. As stated in the DRIs, “there is not a single level of water intake that would ensure adequate hydration and optimal health for half of all apparently healthy persons in all environmental condi-tions” (FNB 2004). Therefore, an AI has been established by the

15
Panel on Dietary Intakes for Electrolytes and Water (FNB 2004). Age-specific AIs are discussed in the life-stage-specific sections that follow.
Perhaps the most significant conclusions that can be drawn from an examination of water requirements are the limited scientific data, and the magnitude of the variability within and among individu-als (Newburgh et al. 1930; Grandjean et al. 2000; Grandjean et al. 2003). This is important to keep in mind when considering recom-mendations, as recommendations are not necessarily requirements, although the two words are often used interchangeably.
Infants. For a healthy infant, the absolute requirement for water is probably 75 to 100 mL/kg/day, but due to the numerous factors that increase risk of dehydration in infants, the recommended fluid in-take is 150 mL/kg/day (Heird 2004). Thus the recommended daily fluid intake of an 11-lb (5-kg) six-month-old infant is approximately 750 mL. If recommendations for adults were comparable (150 mL/kg), the recommended water intake for a 70-kg adult would be 10.5 L/day. Why are infants’ requirements so disproportionate?
A greater percentage of an infant’s body weight is water, averaging 74% at birth, and decreasing to an average of 60% by 6 months. (See Table 1 for TBW by age and gender.) In addition to the higher percentage of TBW, infants (0 to 12 months) differ physiologically from adults and children in that they have
higher surface area-to-body mass ratiohigher rate of water turnoverless developed sweating apparatuslimited ability to excrete soluteslower ability to express thirstproportionately higher ratio of extracellular fluidhigher level of total body sodium and chloridelower level of potassium, magnesium, and phosphate
The rate of fluid exchange is 7 times greater in infants than in adults, and the rate of metabolism is twice as great relative to body weight. The kidneys of newborns are immature, and thus infants have limited ability to excrete solutes. In healthy, term babies, functional development of the nephron are not complete until one month, and the tubules do not mature until approximately 5 months. Additionally, production of the antidiuretic hormone vasopressin by the pituitary gland is limited in infants. Combined, these factors limit the newborn’s ability to sufficiently concentrate urine, and thus conserve body water. As a result, infants are more vulnerable to fluid and electrolyte imbalances (Wong 2003). Because of the in-
••••••••

16
creased vulnerability, careful attention is given to the solute load of formula, signs of dehydration, and rapid treatment of dehydration.
As previously discussed, renal solute load (RSL) refers to all solutes of endogenous or dietary origin that require excretion by the kid-neys. For infants, experts recommend that Potential Renal Solute Load (PRSL) be used. PRSL refers to solutes of dietary origin that would need to be excreted in the urine if none were used to syn-thesize new tissue or lost through non-renal routes. The formula for determining PRSL is shown in Table 4. PRSL is expressed as milliosmoles (mOsm).
Available phosphorus (phosphorusa), is assumed to be the total phosphorus in milk-based formulas and two-thirds the phosphorus in soy-based formulas (Fomon and Ziegler 1999; Klein 2002). The phytate phosphorus in soy-based infant formula is largely unab-sorbed, thus the adjustment.
Difficulties with solute load are unlikely in healthy infants fed hu-man milk or correctly prepared formula. Problems may occur when a) elevated environmental temperature or fever increases evapora-tive loss, b) vomiting and/or diarrhea occur, c) powdered formula is not diluted appropriately, and/or d) the volume of fluid consumed is reduced.
As explained previously, only AIs have been established for water. The method used to determine the AI for infants is based on the average amount generally consumed by full-term infants born to healthy, well-nourished mothers who are exclusively fed human milk. The AI for infants 0 to 6 months is 0.7 L/day. The average volume of human milk consumed during the first 6 months is esti-mated to be 0.78 L/day and serves as the basis of the AI. Assuming only breast milk is consumed, and that breast milk is approximately 87% water, results in a daily water intake of .68L. Rounding to the nearest 0.1L yields an AI of 0.7L. (See Table 5.)
The AI for water for infants 7 to 12 months is slightly higher, 0.8 L/day. During the second half of the first year, the AI assumes milk
Table 4. Calculations Potential Renal Solute Load (PRSL)
PRSL = N/28 + Na + Cl + K + Pa N/28 represents nitrogenous solutes (mmol) based on the assumption that the modal number of N atoms per molecule is 2. Pa (available phosphorus) is equal to total P except in soy-based diets, in which Pa is about 2/3 of total P.
Source: Fomon and Ziegler (1999).

17
consumption of 0.6L/day plus 0.2L from complementary foods and other beverages.
The AI does not consider possible variations in physiological need or variations in intake of nutrients from human milk that result from differences in milk volume and nutrient concentration during early lactation.
Children and Adolescents. The rapid and significant changes in TBW and water turnover seen in infancy slow after the first year. TBW gradually declines during childhood and adolescence (Table 1). Daily water turnover per body mass also declines significantly between infancy and early childhood but the decline is modest thereafter. Intake data correlate with the decline in turnover. Data from water balance studies show a two-fold increase in water intake from the first month of life and months 6 to 12. The increase in intake between the ages of 2 and 9 years is only about 5% to 10%.
The AI for water is based on the median total water intake and the median total water from food reported in NHANES III. The AIs for ages 1 to 8 are shown in Table 6.
As stated in the DRIs for water and electrolytes, there is not a single water intake level that can be recommended for ensuring hydra-tion and optimal health. Data from NHANES III on children show a wide range of total water intake with corresponding indication of normal hydration status as measured by serum osmolality. For example, mean total water intake for boys and girls between the ages of 4 to 8 years was 1,779 mL/day with a mean range of 1,069 mL/d for the 1st percentile and 2,826 for the 99th percentile. Gen-der does not appear to be a factor in water intake until age 9, after which the variance in intakes between males and females continues
Table 6. AI Boys and Girls 1 to 8 years of age
1 to 3 years 1.3 L/day of total water. This includes approximately 0.9 L (~4 cups) as total beverages, including drinking water.
4 to 8 years 1.4 L/day of total water. This includes approximately 1.2 L
(~5 cups) as total beverages, including drinking water.
Table 5. AI for Infants
0 to 6 months 0.7 L/day of water, assumed to be from human milk.7 to 12 months 0.8 L/day of water, assumed to be from human milk
and complementary foods and beverages. This includes approximately 0.6 L (~3 cups) as total fluid, including formula, juices, and drinking water.

18
to increase with age. Mean intakes, 1st and 99th percentiles, by sex, for ages 4 to 18 are shown in Table 7.
Although body water content, as percent of body mass, decreases with age, children maintain a higher percentage of TBW compared to adults. Additionally, children are less heat tolerant than adults, especially during physical activity in hot environments. Compared to adults, children have a higher metabolic rate during physical activity, a larger surface area-to-mass ratio, a lower sweating capac-ity, lower cardiac output at a given metabolic level, and are slower to acclimatize.
While sweat production is less in children than in adults, differ-ences are seen based on stage of development. Children of prepu-bertal age produce less sweat, under similar environmental condi-tions, than do those of mid- and late-pubertal age. While studies on children exercising in the heat have shown that children develop voluntary dehydration at a rate similar to adults, children’s core body temperature rises faster than adults. Thus, adequate fluid re-placement is of particular importance. Children playing or exercis-ing in the heat should not only be encouraged to drink fluids, they should be monitored.
Children, and especially infants and toddlers, are at greater risk of dehydration than adults. Dehydration in children is not only serious, but can be life threatening. Therefore knowing the signs and symp-toms of dehydration in children, and knowing what to do, is very important for parents and other caregivers.
In infants and toddlers, vomiting and diarrhea are the most common causes of dehydration. Symptoms of dehydration include
no tearsdry skin, mouth and tonguesunken eyesgrayish skin
••••
Table 7. Daily Intake of Total Water (mL/day)
Sex/Age Mean 1st Percentile 99th Percentile
Both 4 to 8 1,779 1,069 2,826M 9 to 13 2,535 1,211 4,715F 9 to 13 2,240 1,003 4,497M 14 to 18 3,400 1,765 6,102F 14 to 18 2,498 957 5,688
Source: FNB (2004).

19
sunken soft spot (fontanel) on infants headdecreased urination
Normal urination for infants less than 3 months old is a wet diaper at least once every 6 hours. Toddlers should wet at least 3 diapers a day.
Adults. Water balance studies indicate that the minimal water requirements of inactive adults who live in temperate climates are approximately 1 to 3.1 L/day, an amount that should adequately re-place estimated minimum respiratory, urinary, fecal, and insensible water losses (see Table 8). The AI for total water intake for men 19 years and older is based on median intakes of total water (drink-ing water, beverages, and food) from NHANES III. The AI should cover minimal requirements for losses that occur for individuals with limited physical activity, at temperate climates.
Other than during pregnancy and lactation, from age 19 years on, the AI is the same regardless of age, with the median intakes from the NHANES III survey serving as the basis for the recommenda-tion. See Table 9 for the AIs for men and women 19 years and older.
When analysis of total water intake data from NHANES III in-cludes frequency of leisure time activity, mean intakes increases with activity level. For example, men and women ages 31 to 50, on average, consistently increases total water intake with increasing activity (see Table 10). However, even within a given activity level,
••
Table 8. Estimation of Minimum Daily Water Losses and Production a
Production Reference Source Loss (mL/d) (mL/d)
Hoyt and Honig 1996 Respiratory loss -250 to -350 Adolph 1947b Urinary loss -500 to -1,000 Newburgh et al. 1930 Fecal loss -100 to -200 Kuno 1956 Insensible loss -450 to -1,900 Hoyt and Honig 1996 Metabolic production +250 to +350 Total -1,300 to -3,450 +250 to +350 Net loss -1,050 to -3,100
a Assuming conditions in which there is minimal water loss from sweatingSource: FNB (2004).
Table 9 AI for Men and Women 19 to 30 years and 31 to 50 years
Men 3.7 L/day of total water. This includes approximately 3.0 L (~13 cups) as total beverages, including drinking water.
Women 2.7 L/day of total water. This includes approximately 2.2 L (~9 cups) as total beverages, including drinking water.

20
the range of intakes varies greatly. For example, the 1st percentile of men ages 31 to 50 years who report five or more bouts of physical activity a week have a mean total water intake of 1,851 g compared to 7,824 for the 99th percentile. This variance could reflect differ-ences in the environment, personal preference, or sweating rates.
Under temperate, sedentary conditions, water loss due to sweating is usually low. But profuse sweating can be a major source of water and electrolyte loss for persons exercising or laboring in extreme heat. In physically active individuals, sweating presents the most highly variable water loss. Total daily fluid requirements range from as little as 2 liters per day to 16 liters per day depending on the work load and the level of heat stress (Sawka and Montain 2001). The fluid requirements of physically active adults and/or those exposed to environmental stress deserve special consideration.
The words physically active often conjure up visions of athletes. However, farmers, miners, military personnel, construction work-ers, fire fighters, park and recreation employees, and industrial per-sonnel are among the many that are physically active on a routine basis, and in many cases, in hot environments. Both physical activ-ity and exposure to heat increase water loss, primarily via sweat. It is important that the increased fluid losses are replaced, and for those who sweat profusely, electrolytes are also a consideration. The daily water requirements for temperate conditions can double or even triple in very hot weather and can quadruple for very active individuals compared to those who are sedentary (Sawka and Mon-tain 2001). For active populations living in tropic or desert weather, daily sweat losses are often an additional 2 to 7 L/day.
Data collected on people exposed to hot weather and/or who per-form physical activity in hot weather show markedly increased wa-ter requirements. Figure 1 exemplifies the increased water require-ments resulting from increased physical activity and environmental stress.
Sweat loss varies depending upon exercise intensity and duration, age, gender, training, heat acclimatization, air temperature, humid-
Table 10. Total Water Intake (g) By Activity Level
0 to 5 Occasions 5 or More Occasions No Activity per Week per Week
Men 31 to 50 y 3,608 3,774 3,961Women 31 to 50 y 2,693 3,028 3,355

21
ity, wind velocity, cloud cover, clothing, and individual sweat rate. Daily sweat rate varies based on environment, amount of clothing, and activity levels. Such variances are depicted in Table 11. Sweat rates as high as 2 to 3 L/h have been observed, but these rates can-not be sustained for more that several hours. Maximum daily sweat rates are usually in the range of 10 to 15 L (Wilmore and Costill 1994). It has been reported that very active fire fighters had daily water requirements of about 7 L/d (Ruby et al, 2002), and the sweat rate for Alberto Salazar during the 1984 Olympic marathon was calculated to be 3.71 L/h (Armstrong et al. 1986). Failure to replace water lost in sweat leads to dehydration, inhibits performance, and can result in heat injury, including cardiovascular failure and heat stroke (Sawka and Montain 2001).
It has long been known that persons under thermal and physiologic stress need to pay special attention to fluid and salt intake (Johnson 1943; Council on Pharmacy and Chemistry 1945; Adolph 1947; Strydom et al. 1965). Military personnel and athletes are popula-tions whose hydration status is critical to performance and thus they have been studied extensively in this regard. Studies have explored the consequences of dehydration during physical performance, as well as strategies and recommendations for fluid intake. Athletes are commonly instructed to replace body water lost during training and competition with an amount of fluid that is equal to the amount lost using the guideline that 1 kg of body weight equals 1 L.
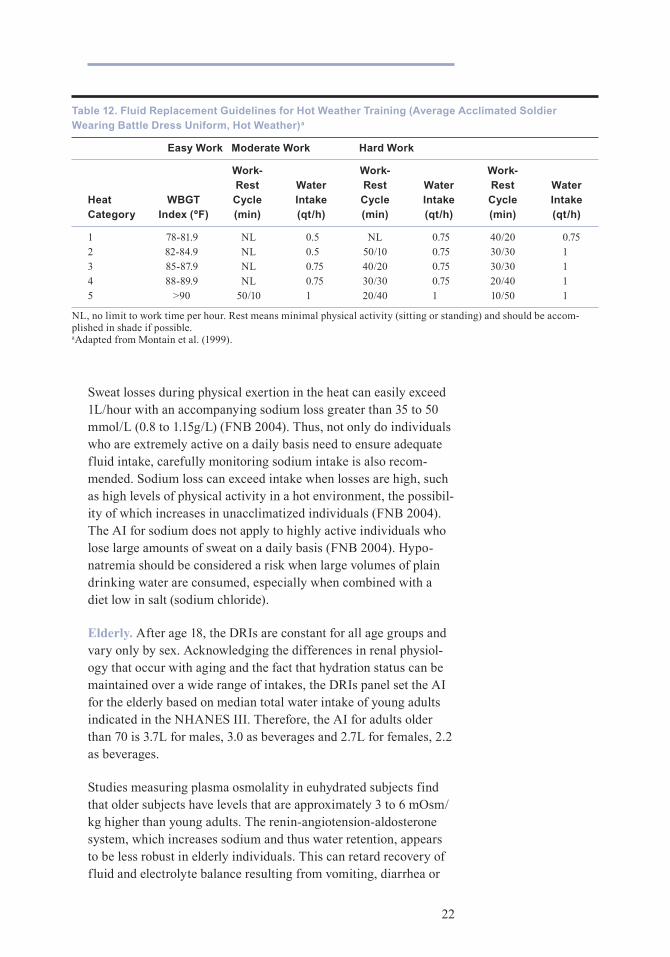
The United States Army revised their fluid replacement guide-lines in 1999. A study to compare the revised guidelines with the previous guidelines was conducted on soldiers engaged in outdoor military combat training in hot weather (Montain et al. 1999). The revised guidelines effectively reversed some of the problems incurred with the previous guidelines (e.g., decreases in serum sodium, increase in body mass, hyponatremia) while maintaining hydration and minimizing overdrinking. The new guidelines are sophisticated and consider the numerous variables that affect fluid needs, as can be seen in Table 12.
Table 11. Sweating Rates per Hour During High Intensity Exercisea
Conditions mL/hour
Desert – Full Clothing 1,980Tropical – Full Clothing 1,980Desert – Partial Clothing 1,560Tropical – Partial Clothing 1,620
aCalculated from Montain et al. (1994).
22
Sweat losses during physical exertion in the heat can easily exceed 1L/hour with an accompanying sodium loss greater than 35 to 50 mmol/L (0.8 to 1.15g/L) (FNB 2004). Thus, not only do individuals who are extremely active on a daily basis need to ensure adequate fluid intake, carefully monitoring sodium intake is also recom-mended. Sodium loss can exceed intake when losses are high, such as high levels of physical activity in a hot environment, the possibil-ity of which increases in unacclimatized individuals (FNB 2004). The AI for sodium does not apply to highly active individuals who lose large amounts of sweat on a daily basis (FNB 2004). Hypo-natremia should be considered a risk when large volumes of plain drinking water are consumed, especially when combined with a diet low in salt (sodium chloride).
Elderly. After age 18, the DRIs are constant for all age groups and vary only by sex. Acknowledging the differences in renal physiol-ogy that occur with aging and the fact that hydration status can be maintained over a wide range of intakes, the DRIs panel set the AI for the elderly based on median total water intake of young adults indicated in the NHANES III. Therefore, the AI for adults older than 70 is 3.7L for males, 3.0 as beverages and 2.7L for females, 2.2 as beverages.
Studies measuring plasma osmolality in euhydrated subjects find that older subjects have levels that are approximately 3 to 6 mOsm/kg higher than young adults. The renin-angiotension-aldosterone system, which increases sodium and thus water retention, appears to be less robust in elderly individuals. This can retard recovery of fluid and electrolyte balance resulting from vomiting, diarrhea or
Table 12. Fluid Replacement Guidelines for Hot Weather Training (Average Acclimated Soldier Wearing Battle Dress Uniform, Hot Weather)a
Easy Work Moderate Work Hard Work
Work- Work- Work- Rest Water Rest Water Rest Water Heat WBGT Cycle Intake Cycle Intake Cycle Intake Category Index (ºF) (min) (qt/h) (min) (qt/h) (min) (qt/h)
1 78-81.9 NL 0.5 NL 0.75 40/20 0.752 82-84.9 NL 0.5 50/10 0.75 30/30 13 85-87.9 NL 0.75 40/20 0.75 30/30 14 88-89.9 NL 0.75 30/30 0.75 20/40 15 >90 50/10 1 20/40 1 10/50 1
NL, no limit to work time per hour. Rest means minimal physical activity (sitting or standing) and should be accom-plished in shade if possible.aAdapted from Montain et al. (1999).

23
other causes of ECF loss. Impairments in renal-concentrating and sodium-conserving ability are associated with increased incidence of volume depletion and hypernatremia in the elderly. The situation can be compounded by a deficit in thirst and regulation of fluid intake, further contributing to the increased incidence of dehydra-tion and hypernatremia.
Renal diluting ability is also impaired with aging. Studies have confirmed that thirst and fluid intake are impaired in the elderly (Miller et al. 1982; Phillips et al. 1984; Fish et al. 1985; Murphy et al. 1988). Thirst impairment and reduced fluid intake can be a func-tion of the aging process and/or a result of pathology such as stroke, cognitive impairment, or endocrine dysfunction (Miller et al. 1982).
Despite age-associated physiologic changes that can affect hydra-tion status, healthy elderly people are generally able to maintain fluid balance. However for some, these age-related impairments in renal function can be of significant clinical consequence.
Dehydration is the most common fluid and electrolyte disorder in institutionalized elderly and among frail older adults in the commu-nity (Hackeny et al. 1995; Arant 1996; Morley et al. 1998; Holben et al. 1999; Kayser-Jones et al. 1999). Blunted thirst response, decreased functional status, mobility disorders, voluntary water restriction to minimize incontinence, decreased renal-concentrating ability, and medication effects, place older adults at risk for dehy-dration (Arant 1996; Sansevero 1997; Kenney and Chiu 2001). The issue appears to be more related to intake than output.
Dehydration is not a benign condition. It is associated with in-creased risk of falls, urinary tract infection, dental disease, bron-chopulmonary disorders, kidney stones, cancer, constipation, and impaired cognitive function. Furthermore, it is an independent pre-dictor of mortality in the elderly (Altieri et al. 2003; Arnaud 2003; Beetz 2003; Boddaert and Belmin 2003; Kalhoff 2003; Siener and Hesse 2003; Smith and Shaw 2003). Ideally, dehydration should be prevented. But when it does occur, dehydration must be treated. It is important to determine the type of dehydration to ensure appropri-ate treatment (Mange et al. 1997).
Maintaining adequate oral hydration for elderly is an ongoing chal-lenge for nursing home staff members. Conditions such as inade-quate staffing, infirmity, functional dependence, dementia, reduced consciousness, and limited access to fluids, increase the risk for hypertonic dehydration (Kayser-Jones et al. 1999).

24
Based on a study conducted in 1986, the Institute of Medicine pro-posed sweeping reforms for nursing homes. Most of the proposed reforms became law in 1987 with passage of the Omnibus Budget Reconciliation Act of 1987, also known as the Nursing Home Re-form Act. The Nursing Home Reform Act specifies what services nursing homes must give residents and establishes standards of care.
To monitor whether nursing homes meet the Nursing Home Reform Act requirements, the law also established a certification process that requires states to conduct unannounced surveys, including resi-dent interviews, at irregular intervals at least once every 15 months. If a survey reveals that a nursing home is out of compliance, the Nursing Home Reform Act enforcement process begins. The Center for Medicare & Medicaid Services (CMS) oversees the Medicare and Medicaid programs and related federal medical care quality control programs. Prior to 2001, CMS was called the Health Care Financing Administration (HCFA).
In 1999, the CMS identified hydration as one of four quality indica-tors (QI) to be especially scrutinized during surveys of long-term care facilities. Additionally CMS identified dehydration as a sentinel event. A sentinel event is a QI that represents a signifi-cant problem, even if it affects only one or a few residents. The regulated care requirements specifically state that a nursing home must provide each resident with sufficient fluid intake to maintain proper hydration and health. If problems with fluid and hydration status are noted, nursing home surveyors can issue citations. The incidence of citations is listed on many nursing home “report card” websites.
Because of the severe consequences of dehydration to elderly residents and the serious penalties that can be imposed should hydration issues arise, long-term care health care professionals must be aware of methods for assessing fluid needs and of appropriate interventions.
The American Medical Directors Association (AMDA) has pub-lished a series of clinical practice guidelines to be used as a tool to identify and treat a specific condition or problem found in long-term care patients. One of the guidelines is on dehydration and fluid maintenance (American Medical Directors Association 2001). A formula for estimating fluid deficit is included in the guidelines and is given in Table 13.

25
Based on purported dehydrating effects of caffeine, it is com-mon practice to dissuade or prohibit caffeine-containing beverage consumption by elderly (Kositzke 1990). Research now shows that coffee, tea, and other caffeine-containing beverages do not increase urine output or negatively affect indicators of hydration status in those who are accustomed to consuming caffeine (Grandjean et al. 2000; Armstrong 2002). Thus, caffeine-containing beverages can be considered as part of the daily total water intake. Inclusion of caffeinated beverages in the diets of elderly not only increases fluid options, but for those who have consumed them for most, or a significant portion of their life, their inclusion in the diet serves to improve their quality of life.
Dietary Sources of Water, and Factors Effecting ConsumptionAs stated in the Dietary Reference Intakes for Water, Potassium, Sodium, Chloride, and Sulfate:
Over the course of a few hours, body water deficits can occur due to reduced intake or increased water losses from physical activity and environmental (e.g., heat) exposure. However, on a day-to-day basis, fluid intake, driven by thirst and the consumption of beverages at meals, allows maintenance of hydration status and total body water at normal levels. (FNB 2004)
Humans ingest water as plain drinking water, in beverages, and in food, which can be inherent or added during preparation. Actual fluid intake differs among individuals and is affected by thirst, habit, cultural factors, access, and palatability.
National survey data was used in determining the DRIs for water. While results vary slightly, national U.S. surveys find that food contributes roughly 20% to 30% of total water intake, with bever-ages (including plain drinking water) contributing 70% to 80%.
Table 13. Formula for Estimating Fluid Deficit
Fluid deficit can be estimated by the following formula (assumes that the clinician knows the patient’s desired weight):Estimated fluid deficit = desired total body water (L) – current total body water (L) that is, Estimated fluid deficit = [ measured serum sodium x (total body weight (kg) x 0.5)] – [total body weight (kg) x 0.5] 140 For example, if a patient’s sodium is 154 mEq/L and weight is 50 kg, then: Estimated fluid deficit = [ 154 x (50 x 0.5)] – (50 x 0.5) = 27.5 L – 25 L = approx 2.5 L fluid deficit 140
Source: AMDA (2001).

26
The DRIs for total water intake are based on median intake of total water from NHANES III, rounded to the nearest 0.1L. Food is assumed to provide approximately 20% of total water intake. The DRIs are expressed as measurable amounts of water, e.g., liters and cups, instead of mL per kg body weight used in previous recom-mendations. Appendix A shows the DRIs for total dietary water, which is based on median intake found in the NHANES III survey.
A common misperception is that beverages vary in their capacity to maintain hydration status. People are admonished for drinking caffeinated beverages, and told that they contribute to dehydration. Additionally, the perception persists that plain drinking water is more hydrating than other beverages. Neither statement is evidence-based. Research shows that a tolerance to caffeine develops (Colton et al. 1968; Robertson et al. 1978; Passmore et al. 1987; Neuhauser-Berthold et al. 1997). As such, those who regularly ingest caffeine do not experience increased urine output or altered indicators of hydration status after consuming caffeinated beverages (Denaro et al. 1991; Gorelick et al. 1997; Montain et al. 1999; Grandjean et al. 2000).
As stated in the DRIs for water, “Fluid is consumed in the form of food and beverages, and regardless of form, is absorbed by the gas-trointestinal tract and acts the same physiologically.” The pertinent information therefore is not the source of the water, but the amount of water in a food or beverage, and the amount of each that a person consumes. Appendix B shows the water content of commonly con-sumed food and beverages.
Normal hydration status can be achieved with a wide range of water intakes. Of interest is not only the wide range of intakes for total water, but also the variance in the water content of the food con-sumed. For example, total water intake by males 31 to 50 years of age who participated in NHANES III was 2,100 mL/d for the 5th percentile and 6,340 mL/d for the 95th percentile. Total water from food for the same population was 372 mL/d for the 5th percentile and 1,251 for the 95th percentile. Thus, paramount to answering the common question, “how much fluid do I need to drink?” is under-standing the diversity of people’s diets, and the numerous factors that affect requirements.
Fluid consumption is as much, if not more, of a behavior as it is a response to thirst, and thirst is triggered by both physiologic and perceptual mechanisms. Research indicates there are three main physiologic triggers for thirst: cerebral osmoreceptors, extracerebral osmoreceptors, and volume receptors. Osmoreceptors respond to

27
cellular dehydration, while volume receptors respond to extracel-lular dehydration. While the need for water is biological, beverage selection is influenced by several factors.
Consumption data support the observation of a culture influence on drinking behavior. The British are known for their tea consumption, the Italians for wine. And culture is known to be a major determi-nant of food and beverage preferences. Other factors, however, are known to also influence beverage selection. Sensory attributes such as color, flavor, odor, and texture determine the palatability of a beverage. Appearance and temperature also effect consumption as does availability.
The consumption of beverages varies over the course of the day with the majority of total beverage consumption occurring with meals. The types of beverages consumed also vary by occasion. For example, milk is often consumed with meals while alcoholic bever-ages are more common at social functions.
Summary and Conclusions Below are key points about hydration that have important practical implications:
Water is a major constituent of the body and plays a number of vital functions. Because the body cannot produce enough water, ad-equate amounts must be supplied by the diet.
The body has numerous mechanisms to maintain fluid balance. These include kidney function and hormone action. Usually, a healthy adult responds to negative fluid balance by increasing fluid intake and concentrating urine to reduce fluid output. Negative fluid balance is usually short-lived and self-limiting.
Dehydration occurs when water or water and electrolyte intake does not equal output. It is important to determine the specific type of dehydration as this determines appropriate treatment.
Children, especially infants and toddlers, are at greater risk of dehydration than are adults. Parents and other caregivers should be aware of the signs and symptoms of dehydration in children and know when to seek medical help.
Physically active children, especially in hot environments, have fluid needs greater than sedentary individuals in temperate envi-ronments. Adequate salt intake is also a concern for individuals with high fluid intakes.
Older adults can have impairments in renal-concentrating, so-dium-conserving ability, and thirst, and may limit fluid intake, all
•
•
•
•
•
•

28
of which can contribute to an increased risk of dehydration and hypernatremia.
While urine and blood assays are used for clinical assessment of hydration, body weight change remains the most universal, valid, economical, and feasible surrogate for body water change. Essential to body weight as a measure is controlling for confounding factors such as clothing, empty bladder, time of day, and presence of food in the alimentary tract.
A guide for replacing water losses is 1 L of fluid for every kilogram lost, or 2 cups (16 oz) for every pound.
While the intake of plain drinking water is important, other bever-ages as well as food are important sources of water. On average, 20% to 25% of the water consumed by Americans is from food, 75% to 80% is from beverages.
People who are accustomed to consuming caffeinated beverages suffer no negative effects on hydration status by drinking coffee, tea, soft drinks, and other caffeinated beverages.
•
•
•
•

29
Appendix A
Recommended Water Intakes for Individuals
Life Stage Group Total Daily AIa Assumptions
Infants
0 to 6 mo 0.7 Assumed to be from human milk7 to 12 mo 0.8 Assumed to be from human milk and complementary foods and beverages. This includes approximately 0.6 L (~3 cups) as total fluid, including formula, juices, and drinking water.
Children
1 to 3 y 1.3 Approximately 0.9 L (~4 cups) as total beverages, including drinking water.4 to 8 y 1.4 Approximately 1.2 L (~5 cups) as total beverages, including drinking water.
Males
9 to 13 y 2.4 Approximately 1.8 L (~8 cups) as total beverages, including drinking water.14 to 18 y 3.3 Approximately 2.6 L (~11 cups) as total beverages, including drinking water.19 to >70 y 3.7 Approximately 3.0 L (~13 cups) as total beverages, including drinking water.
Females
9 to 13 y 2.1 Approximately 1.6 L (~7 cups) as total beverages, including drinking water.14 to 18 y 2.3 Approximately 1.8 L (~ 8 cups) as total beverages, including drinking water.19 to >70 y 2.7 Approximately 2.2 L (~9 cups) as total beverages, including drinking water.
Pregnancy
14 to 50 y 3.0 Approximately 2.3 L (~10 cups) as total beverages, including drinking water.
Lactation
14 to 50 y 3.8 Approximately 3.1 L (~13 cups) as total beverages, including drinking water.
a all values are liters per daySource: (Food and Nutrition Board 2004)

30
Appendix B
Water Intake from Frequently Consumed Foods and Beverages
NON-ALCOHOLIC BEVERAGES
Water, brewed tea, brewed coffee, diet soft drinks, canned/bottled tea, sports drinks, lemonade, vegetable juice 90% to 100%Milk (skim, 1%, 2%, whole, chocolate), soft drinks (regular), fruit juice, fruit drinks 85% to 90%
ALCOHOLIC BEVERAGES
Beer and wine 90% to 95%Spirits 60% to 70%Liqueurs 30%
SOUP
Clear broth, french onion, vegetable beef, minestrone, tomato, cream of mushroom (made with water) 90% to 95%Chicken noodle, chunky minestrone, chunky soups, tomato, cream of mushroom (made with milk) 80% to 90%
FRUITS & VEGETABLES
Strawberries, melons, grapefruit, peaches, pears, oranges, apples, grapescucumbers, lettuce, celery, tomatoes, cabbage, broccoli, onions, carrots 80% to 85%Banana, potatoes, corn 70% to 75%
DAIRY
Cottage cheese and yogurt 75% to 80%Pudding, milk shake, eggnog 70% to 75%Ice Cream 50% to 60%Cheese 40% to 50%
GRAINS
Cooked cereals 85% to 90%Rice & pasta 65% to 80%Breads, bagels, biscuits 30% to 45%Ready-to-eat breakfast cereals 2% to 5%
MEAT, FISH, EGGS
Fish & seafood 70% to 80%Eggs (scrambled, fried, poached), omelet, egg substitute 65% to 80%Beef, chicken, lamb, pork, turkey, veal 45% to 65%Jerky, bacon 15% to 30%
MIXED DISHES
Stew, pasta & meat dishes, casseroles (with meat & meatless), meatloaf, tacos, enchiladas, macaroni & cheese, vegetarian quiche 60% to 80%Pizza 50% to 60%

31
Water Intake from Frequently Consumed Foods and Beverages (continued)
MEAL REPLACEMENT DRINKS
All liquid drinks for weight loss, muscle gain, meal replacement 70% to 85%
SNACKS, CANDIES, CONFECTIONS
Chips, pretzels, candies, crackers, puffs, dried fruit, popcorn 1% to 10%
SEEDS & NUTS 1% to 5%
SAUCES, GRAVIES, DIPS
Sauces and gravies 50% to 85%Dips (salsa, sour cream based, bean) 70% to 90%

32
References
Adolph EF. Heat exchanges, sweat formation, and water turn-over. In: Adolph EF, ed. Physiology of Man in the Desert. New York: Interscience Publishers, 1947:33–43.
Alper C. Fluid and electrolyte balance. In: Wohl MG, Goodhart RS, eds. Modern Nutrition in Health and Disease. Philadelphia: Lea & Febiger, 1968:404–424.
Altieri A, La Vecchia C, Negri E. Fluid intake and risk of blad-der and other cancers. Eur J Clin Nutr 2003;57:S59-S68.
Altman PL. Blood and Other Body Fluids. Washington, DC: Federation of American Societies for Experimental Biology, 1961.
American Medical Directors Association. Dehydration and Fluid Maintenance. Clinical Practice Guideline. Columbia, MD: American Medical Directors Association, 2001.
Anderson DM. Parenteral nutrition: Fluid and electrolytes. In Groh-Wargo S, Thompson M, Cox JH, eds. Nutrition Care for High-Risk Newborns. Chicago: Precept Press, Inc, 2000:109-111.
Arant BJ. Fluids and electrolyte abnormalities in children. In: Kokko J, Tannen R, eds. Fluids and electrolytes. Philadelphia, PA: W.B. Saunders Company, 1996:819–829.
Arieff AI, Kronlund BA. Fatal child abuse by forced water in-toxication. Pediatrics 1999;103:1292-1295.
Armstrong LE, Hubbard RW, Jones BH, Daniels JT. Preparing Alberto Salazar for the heat of the 1984 Olympic marathon. The Physician and Sportsmedicine 1986;14(3):73-81.
Armstrong LE, Maresh CM, Castellani JW, et al. Urinary indices of hydration status. Int J Sport Nutr 1994;4:265–279.
Armstrong LE, Soto JA, Hacker FT Jr, Casa DJ, Kavouras SA, Maresh CM. Urinary indices during dehydration, exercise, and rehydration. Int J Sport Nutr 1998;8:345–355.
Armstrong LE. Caffeine, body fluid-electrolyte balance, and ex-ercise performance. Int J Sport Nutr Exerc Metab 2002;12:189–206.
33
Arnaud MJ. Mild dehydration: A risk factor of constipation. Eur J Clin Nutr 2003;57:S88-S95.
Beetz R. Mild dehydration: A risk factor of urinary tract infec-tion? Eur J Clin Nutr 2003;57:S52-S58.
Benedict FG, Root HF. Insensible perspiration: its relation to human physiology and pathology. Arch Intern Med 1926;38:1–35.
Bergeron MF, Maresh CM, Armstrong LE, et al. Fluid-electrolyte balance associated with tennis match play in a hot environ-ment. Int J Sport Nutr 1995;5:180–193.
Bergmann KE, Ziegler EE, Fomon SJ. Water and renal solute load. In: Fomon SJ, ed. Infant Nutrition. Philadelphia: W.B. Saunders, 1974:245–266.
Boddaert J, Belmin J. Orthostatic hypotension and its treat-ment in the elderly. Presse Med 2003;32:1707-1715.
Breslow RA. Nutrition and air-fluidized beds: A literature re-view. Adv Wound Care 1994;7:57-58, 60, 62.
Colton T, Gosselin R, Smith R. The tolerance of coffee drinkers to caffeine. Clin Pharmacol Ther 1968;9:31–39.
Council on Pharmacy and Chemistry. The addition of salt to drinking water. JAMA 1945;129:131.
Dauterman KW, Bennett RG, Greenough IWB, et al. Plasma specific gravity for identifying hypovolaemia. J Diarrhoeal Dis Res 1995;13:33–38.
de Leon J, Verghese C, Tracy JI, Josiassen RC, Simpson GM. Polydipsia and water intoxication in psychiatric patients: A review of the epidemiological literature. Society of Biological Psychiatry 1994;35:408-419.
Denaro C, Brown C, Jacob PI, Benowitz N. Effects of caffeine with repeated dosing. Eur J Clin Pharmacol 1991;40:273–278.
Devroede G. Constipation. In: Sleisenger MH, Fordtran JS, eds. Gastrointestinal Disease. Volume 1, 5th edition. Philadel-phia: W.B. Saunders Company,1993.
Ellis KJ, Wong WW. Human hydrometry: comparison of multi-frequency bioelectrical impedance with H20 and bromine dilu-tion. J Appl Physiol 1998;85:1056–1062.
Fish LC, Minaker KL, Rower JW. Altered thirst threshold dur-ing hypertonic stress in aging men. Gerontologist 1985;25:A118-A119.

34
Fomon SJ, Ziegler EE. Renal solute load and potential renal solute load in infancy. J Pediatr 1999;134:11-14.
Food and Nutrition Board of the Institue of Medicine. Sub-committee on the Tenth Edition of the RDAs. Recommended Dietary Allowances, 10th edition. Washington, DC: National Academy Press, 1989.
Food and Nutrition Board of the Institute of Medicine. How Should the Recommended Dietary Allowances Be Revised? Washington, DC: National Academy Press, 1994.
Food and Nutrition Board of the Institute of Medicine. Dietary Reference Intakes for Water, Potassium, Sodium, Chloride, and Sulfate. Washington, DC: National Academies Press, 2004.
Francesconi RP, Hubbard RW, Szlyk P, et al. Urinary and hema-tologic indexes of hypohydration. J Appl Physiol 1987;62:1271–1276.
Gardner JW, Gutmann FD, et al. Nontraumatic exercise-related deaths in the U.S. Military, 1996-1999. Mil Med 2002;167:964-970.
Garigan TP, Ristedt DE. Death from hyponatremia as a result of acute water intoxication in an Army basic trainee. Mil Med 1999;164:234–238.
Gorelick MH, Shaw KN, Murphy KO. Validity and reliability of clinical signs in the diagnosis of dehydration in children. Pedi-atrics 1997;99:E6.
Grandjean AC, Reimers KJ, Bannick KE, Haven MC. The effect of caffeinated, non-caffeinated, caloric and non-caloric bever-ages on hydration. J Am Coll Nutr 2000;19:591–600.
Grandjean AC, Reimers KJ, Haven MC, Curtis GL. The effect on hydration of two diets, one with and one without plain water. J Am Coll Nutr 2003;22(2):165-173.
Gudivaka R, Schoeller DA, Kushner RF, Bolt MJG. Single and multifrequency models for bioelectrical impedance analysis of body water compartments. J Appl Physiol 1999;87(3):1087-1096.
Hackeny AC, Coyne JT, Pozos R, Feith S, Seale J. Validity of urine-blood hydrational measures to assess total body water changes during mountaineering in the sub-Arctic. Arct Med Res 1995;54:69–77.
Häussinger D. The role of cellular hydration in the regulation of cell function. Biochem J 1996;313:697-710.

35
Heird WC. Nutritional Requirements. In: Behrman RE, Klieg-man RM, Jenson HB, eds. Nelson Textbook of Pediatrics 17th edition. Philadelphia: Saunders, 2004.
Holben DH, Hassell JT, Williams JL, Helle B. Fluid intake com-pared with established standards and symptoms of dehydra-tion among elderly residents of a long-term-care facility. J Am Diet Assoc 1999;99:1447–1450.
Howard L. Enteral and parenteral nutrition therapy. In: Fauci A, Braunwald E, Isselbacher K, et al., eds. Harrison’s Principles of Internal Medicine. CD-ROM. NY, NY: McGraw-Hill, 1998.
Hoyt RW, Honig A. Environmental influences on body fluid balance during exercise: Altitude. In: Buskirk ER, Puhl SM, eds. Body Fluid Balance: Exercise and Sport. Boca Raton, FL: CRC Press, 1996: 183-196.
Johnson RE. Nutritional standards for men in tropical climates. Gastroenterology 1943;1:832–840.
Johnston M, Newburgh L. The determination of the total heat eliminated by the human being. Clin Invest 1930;viii:147–160.
Kalhoff H. Mild dehydration: A risk factor of broncho-pulmo-nary disorders? Eur J Clin Nutr 2003;57:S81-S87.
Kayser-Jones J, Schell ES, Porter C, et al. Factors contributing to dehydration in nursing homes: Inadequate staffing and lack of professional supervision. J Am Geriatr Soc 1999; 47:1269-1270.
Keating JP, Schears GJ, Dodge PR. Oral water intoxicationin infants. An American epidemic. AJDC 1991;145:985-990.
Kenney WL, Chiu P. Influence of age on thirst and fluid intake. Med Sci Sports Exerc 2001;33:1524–1532.
Klein CJ, ed. Nutrient requirements for preterm infant formu-las. J Nutr 2002;132:1395s-1577s.
Kositzke J. A question of balance: Dehydration in the elderly. J Gerontol Nurs 1990;16:4-11.
Koulmann N, Jimenez C, Regal D, et al. Use of bioelectrical impedance analysis to estimate body fluid compartments after acute variations of the body hydration level. Med Sci Sports Exerc 2000;32:857–864.
Kugler JP. Hyponatremia and hypernatremia in the elderly. Am Fam Physician 2000;61:3623-363.

36
Kuno Y. Human Perspiration. Springfield, IL: Charles C. Thomas Publisher, 1956.
Laaksonen DE, Nuutinen J, Lahtinen T, Rissanen A, Niskanen LK. Changes in abdominal subcutaneous fat water content with rapid weight loss and long-term weight maintenance in abdominally obese men and women. International Journal of Obesity 2003; 27:677-683.
Lang F, Waldegger S. Regulating cell volume. American Scien-tist 1997;85:456-463.
Lavizzo-Mourey R, Johnson J, Stolley P. Risk factors for dehy-dration among elderly nursing home residents. J Am Geriatr Soc 1988;36:213–218.
Mange K, Matsuura D, Cizman B, et al. Language guiding therapy: The case of dehydration versus volume depletion. Ann Intern Med 1997;127:848-853.
Miller PD, Krebs RA, Neal BJ, McIntyre DO. Hypodipsia in geriatric patients. The American Journal of Medicine 1982; 73:354-356.
Montain SJ, Latzka WA, Sawka MN. Fluid replacement recom-mendations for training in hot weather. Mil Med 1999;164:502-508.
Montain SJ, Sawka MN, et al. Physiological tolerance to un-compensable heat stress: effects of exercise intensity, protec-tive clothing, and climate. J Appl Physiol 1994; 77(1):216-222.
Montain SJ, Sawka MN, Wenger CB. Hyponatremia associated with exercise: risk factors and pathogenesis. Exerc Sport Sci Rev 2001;29:113–117.
Morley JE, Miller DK, Zdrodowski C, Gutierrez B, Perry III HM. Fluid intake, hydration and aging. In: Arnaud MJ, ed. Hydration throughout life. John Libbey Eurotext; 1998:107–115.
Mudge G, Weiner I. Agents affecting volume and composition of body fluids. In: Goodman Gilman A, Rall T, Nies A, Taylor P, eds. Goodman and Gilman’s The Pharmacological Basis of Therapeutics. Elmsford, NY: Pergamon Press, Inc., 1990:682–707.
Murphy DJ, Minaker KL, Fish LC, Rowe JW. Abstract. Impaired osmostimulation of water ingestion delays recovery from hy-perosmolarity in normal elderly. 1988.
Neuhauser-Berthold M, Beine S, Verwied SC, Luhrmann PM. Coffee consumption and total body water homeostasis as mea-

37
sured by fluid balance and bioelectrical impedance analysis. Ann Nutr Metab 1997;41:29-36.
Newburgh L, Johnston M, Falcon-Lesses M. Measurement of total water exchange. J Clin Invest 1930;8:161–196.
Newburgh L, Johnston M. The insensible loss of water. Physiol Rev 1942;22:1–18.
O’Brien C, Freund BJ, Sawka MN, McKay J, Hesslink RL, Jones TE. Hydration assessment during cold-weather military field training exercises. Arct Med Res 1996;55:20–26.
O’Brien KK, Montain SJ, Corr WP, Sawka MN, Knapik JJ, Craig SC. Hyponatremia associated with overhydration in U.S. Army trainees. Mil Med 2001;166:405–410.
Oh MS,Uribarri J. Electrolytes, water, and acid-base balance. Modern Nutrition in Health and Disease (9th Edition). Balti-more: Williams & Wilkins, 1999: 107.
Passmore AP, Kondowe GB, Johnston GD. Renal and cardio-vascular effects of caffeine: a dose-response study. Clin Sci (Lond) 1987;72:749–756.
Phillips P, Rolls B, Ledingham D, et al. Reduced thirst af-ter water deprivation in healthy elderly men. N Engl J Med 1984;311:753–759.
Pollock N, Godfrey R, Reilly T. Evaluation of field measures of urine concentration. Med Sci Sports Exerc 1997;29:iv–300.
Popowski LA, Oppliger RA, Patrick LG, Johnson RF, Kim JA, Gisolf CV. Blood and urinary measures of hydration status during progressive acute dehydration. Med Sci Sports Exerc 2001;33:747–753.
Reese J. Fluid volume deficit, chapters 1 and 2. In Maas M et al., eds. Nursing Diagnoses and Interventions for the elderly. Redwood City, CA: Addison-Wesley Nursing, 1991:131-142.
Robertson D, Frölich J, Carr R, et al. Effects of caffeine on plasma renin activity, catecholamines and blood pressure. N Engl J Med 1978;298:181–186.
Rose BD, Post TW. Clinical Physiology of Acid-Base and Elec-trolyte Disorders, 5th edition. New York: McGraw-Hill Inc, 2001.
Ruby BC, Shriver TC, et al. Total energy expenditure dur-ing arduous wildfire suppression. Med Sci Sports Exerc 2002;34(6):1048-1054.

38
Sansevero AC. Dehydration in the elderly: strategies for pre-vention and management. Nurse Pract 1997;22:41–47, 63.
Sawka MN, Montain SJ. Fluid and Electrolyte Balance: Effects on Thermoregulation and Exercise in the Heat. In: Bowman BA, Russell RM, eds. Present Knowledge in Nutrition, 8th ed. Washington, DC: ILSI Press, 2001:115-124.
Schoeller DA. Hydrometry. In: Roche AF, Heymsfield SB, Lohman TG, eds. Human Body Composition. Champaign: Hu-man Kinetics, 1996:25–43.
Shirreffs SM, Maughan RJ. Urine osmolality and conductivity as indices of hydration status in athletes in the heat. Med Sci Sports Exerc 1998;30:1598–1602.
Shirreffs SM. Markers of hydration status. J Sports Med Phys Fitness 2000;40:80–84.
Siener R, Hesse A. Fluid intake and epidemiology of urolithia-sis. Eur J Clin Nutr 2003;57:S47-S51.
Singer G, Brenner B. Fluid and electrolyte disturbances. In: Fauci A, Braunwald E, Isselbacher K, et al., eds. Harrison’s Principles of Internal Medicine. CD-ROM. NY, NY: McGraw-Hill, 1998.
Smith AJ, Shaw L. Mild dehydration: A risk factor for dental disease? Eur J Clin Nutr 2003;57:S75-S80.
Speedy DB, Noakes TD, Schneider C. Exercise-associated hy-ponatremia: a review. Emerg Med (Fremantle) 2001;13:17–27.
Strydom NB, Van Graan CH, Holdsworth LD. The water require-ments of humans. J Occup Med 1965;7:581–587.
Thomas BJ, Cornish BH, Ward LC, Jacobs A. Bioimped-ance: is it a predictor of true water volume? Ann NY Acad Sci 1999;873:89-93.
Valtin H, Schafer JA. Renal Function Mechanisms Preserv-ing Fluid and Solute Balance in Health, 3rd ed. Boston: Little, Brown, and Co., 1995.
Walsh R, Noakes TD, Hawley JA, Dennis SC. Impaired high-in-tensity cycling performance time at low levels of dehydration. Int J Sports Med 1994;15:392–398.
Weinberg AD, Minaker KL. Dehydration. Evaluation and man-agement in older adults. Council on Scientific Affairs, Ameri-can Medical Association. JAMA 1995;274:1552–1556.

39
Wilmore JH, Costill DL. Physiology of Sport and Exercise. Champaign, IL: Human Kinetics, 1994.
Wong DL. Balance and Imbalance of Body Fluids. In Wilson D, Winkelstein ML, Kline NE, eds. Nursing Care of Infants and Children, 7th ed. Philadelphia: Mosby, 2003.
Yankanich J, Kenney W, Fleck S, Kraemer W. Precompetition weight loss and changes in vascular fluid volume in NCAA Division I college wrestlers. J Strength Cond Res 1998;12:138–145.
Zappe DH, Tankersley CG, Meister TG, Kenney WL. Fluid re-striction prior to cycle exercise: effects on plasma volume and plasma proteins. Med Sci Sports Exerc1993;25:1225–1230.


ILSI North America
North American Branch One Thomas Circle, NWof the International Ninth FloorLife Sciences Institute Washington, DC 20005-5802


![Assessing Hydration Status: The Elusive Gold Standard...fluids. Therefore, accurate and precise laboratory and field techniques are needed to evaluate human hydration status [1]. Table](https://static.fdocuments.us/doc/165x107/5f7381c32a164d1baa00689a/assessing-hydration-status-the-elusive-gold-fluids-therefore-accurate-and.jpg)