
HY 2002 RESULTS - ab-inbev.com · Execution of Four Strategic Themes Strategic themes Rationale...
44
HY 2002 RESULTS HY 2002 RESULTS
Transcript of HY 2002 RESULTS - ab-inbev.com · Execution of Four Strategic Themes Strategic themes Rationale...
HY 2002 RESULTSHY 2002 RESULTS
1
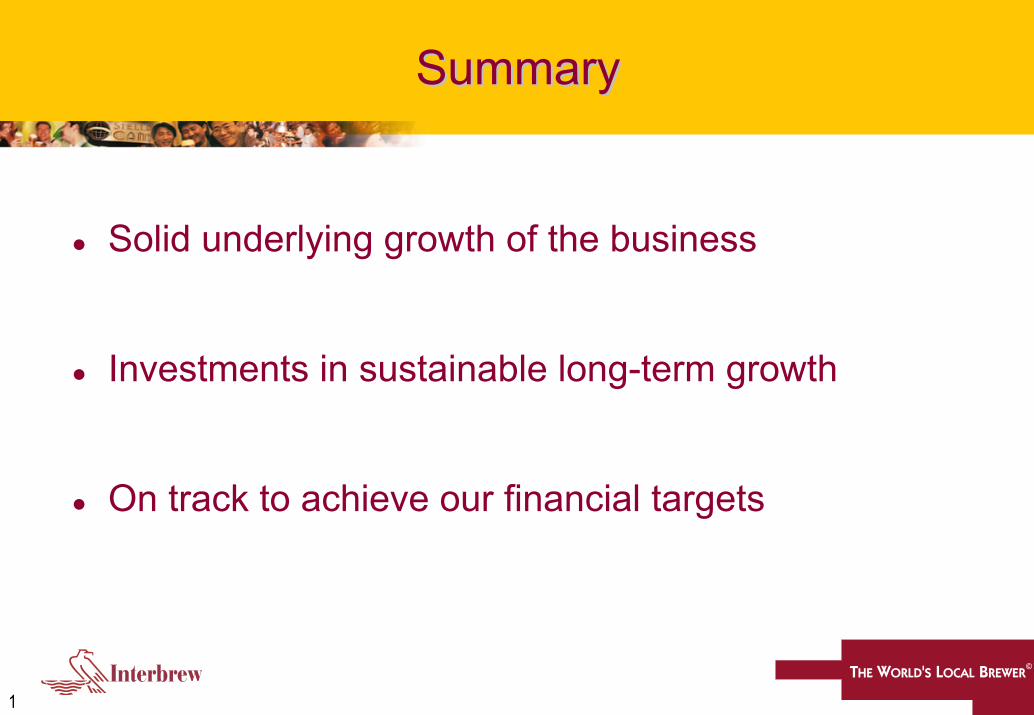
SummarySummary
Solid underlying growth of the business
Investments in sustainable long-term growth
On track to achieve our financial targets

2
Key HighlightsKey Highlights
Post-Restructuring
Pre-Restructuring
HY 2001(3)
(IAS)
HY 2002 (IAS)(1)(2)
%Change(4)
€569m
€0.52
€630m
€0.62
€516m
€0.54
+22%
+15%
EBITDA
EPS Before Goodwill(5)
(1) Excluding Carling(2) Including €19m cost of Canadian lock-out & related pension costs(3) Excluding Bass UK (Carling, Scotland, Northern Ireland)(4) Change between HY 2001 and HY2002 pre-restructuring(5) Calculated using the average outstanding number of shares
3
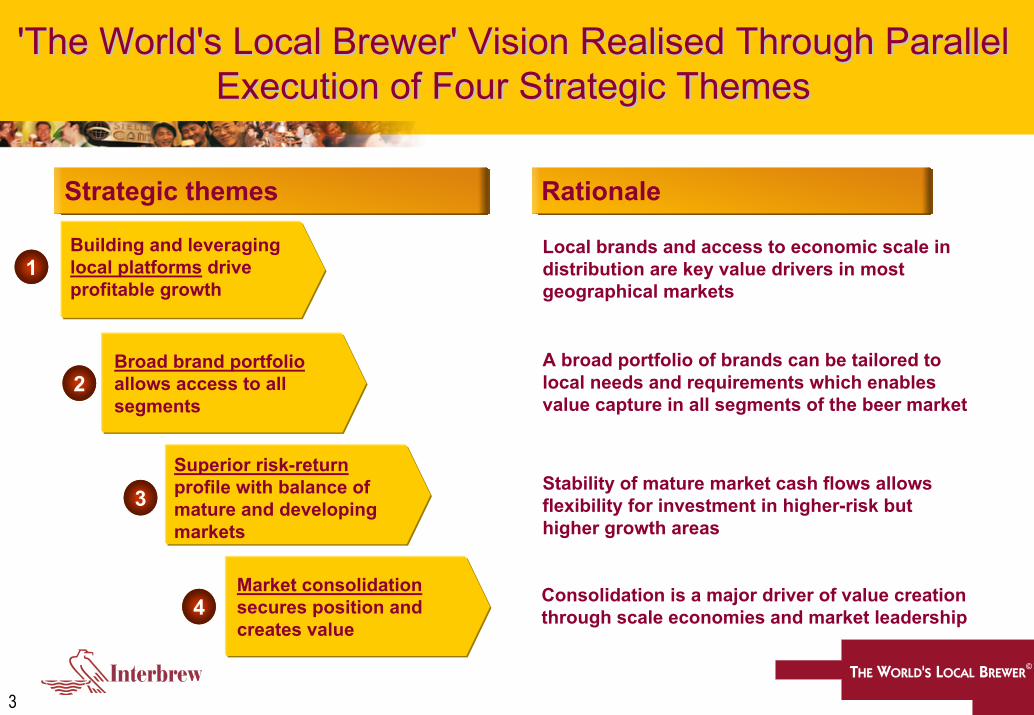
'The World's Local Brewer' Vision 'The World's Local Brewer' Vision RealisedRealised Through Parallel Through Parallel Execution of Four Strategic ThemesExecution of Four Strategic Themes
Strategic themes Rationale
Building and leveraginglocal platforms driveprofitable growth
Local brands and access to economic scale in distribution are key value drivers in most geographical markets
11
Broad brand portfolioallows access to all segments
22A broad portfolio of brands can be tailored to local needs and requirements which enables value capture in all segments of the beer market
Superior risk-returnprofile with balance of mature and developing markets
33Stability of mature market cash flows allows flexibility for investment in higher-risk but higher growth areas
Market consolidationsecures position andcreates value
44 Consolidation is a major driver of value creation through scale economies and market leadership

4
CContinuous Shareholderontinuous Shareholder VValue Creationalue Creation
Achieving operational excellence requires
• Re-engineering of existing operations
• Obtaining integration benefits of previous acquisitions
• Investing in business to successfully achieve change
Sustained OrganicGrowth
Acqu
isitio
n
Operational
Excellence
Continuous shareholder
value creation

5
Presentation OutlinePresentation Outline
1.1. HY 2002 ResultsHY 2002 Results
2. Investing For Sustainable Growth
3. Integrating Beck & Co
4. Outlook & Conclusion

6
Description of Scope ChangesDescription of Scope Changes
Bass Scotland / Northern Ireland (Jan 02)Diebels (Sep 01)Beck & Co (Feb 02)
ScopeInclusions
ScopeExclusions
Heineken UK contract (Jan 02)Service fee changes (Dec 01)
Carling included in reported HY 02 numbers for 5 weeks (sold Feb 02)Bass UK excluded from HY 01 and Carling excluded from HY 02
Bass UK / Carling
RestructuringCharge
UK distribution restructuring charge shown separately for group and Western Europe

7
Breakdown of HY02 ResultsBreakdown of HY02 Results
Net TurnoverNet Turnover€€ millionmillion
VolumeVolume(1)(1)
Hl millionHl million
+122,784 +115 +421 3,332
+4.1% +15.1% +0.4% +19.7%
- 40.9+5.3+0.834.8
+2.3% +15.2% +17.5%
HY01 HY 02 Foreign ExchangeScope(2)Organic
GrowthHY01 HY 02 Foreign ExchangeScope(2)
OrganicGrowth
80.0 81.5Net Turnover/ HNet Turnover/ Hll€ per Hl€ per Hl
(1) Excluding FEMSA Cerveza(2) Inclusions: Bass Scotland / Northern Ireland, Diebels and Beck & Co
Exclusions: Heineken UK contract and service fee changes

8
+1 630516 +17 +96
569-61
Continued Delivery ofContinued Delivery ofUnderlying Organic GrowthUnderlying Organic Growth
+3.3% +18.6% +10.3%+22.1%
HY 01(1) HY 02(1)Foreign ExchangeScope(3)Organic
Growth(2)Restructuring
Charge(4)HY 02(1)
+0.2%
EBITDAEBITDA€€ millionmillion
253-61+38+4272 314
-
-7.0%+1.5% +13.9% +15.4%
EEBITBIT€€ millionmillion
(1) Excluding: Bass UK (HY01) and Carling (HY02)(2) Includes €19m cost of Canadian lock-out(3) Inclusions: Bass Scotland / Northern Ireland, Diebels and Beck & Co.
Exclusions: Heineken UK contract and service fee changes(4) UK distribution restructuring charge
9
272-61+38
272 333-
+1 649516 +96
588-61
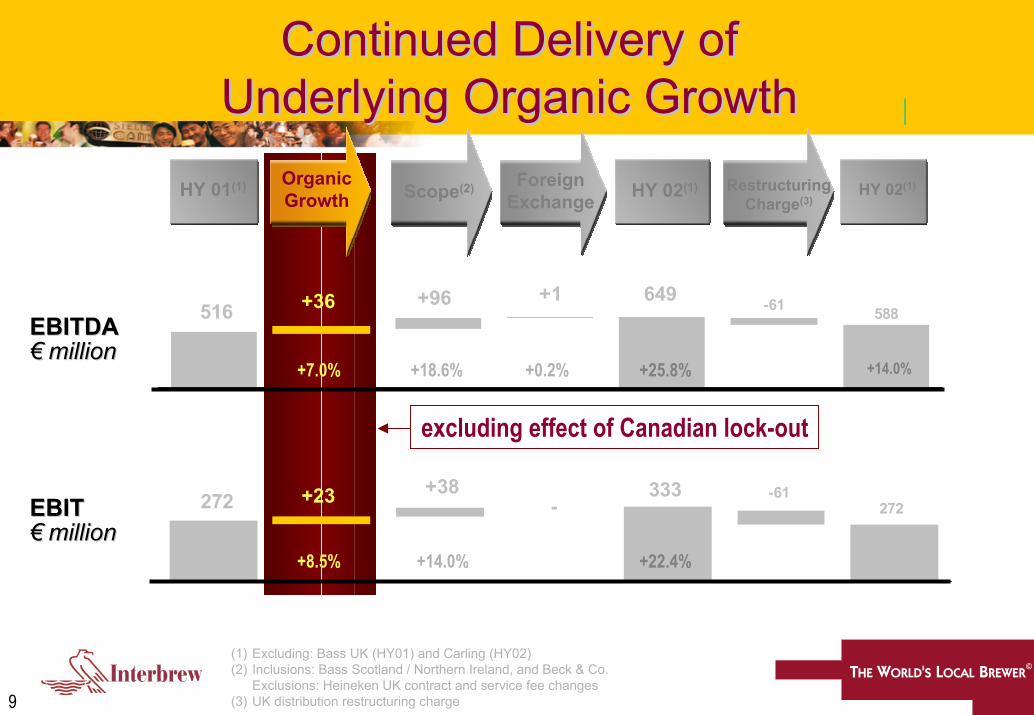
Continued Delivery ofContinued Delivery ofUnderlying Organic GrowthUnderlying Organic Growth
+18.6% +14.0%
+14.0%
+25.8%
+22.4%
HY 01(1) HY 02(1)Foreign ExchangeScope(2)Organic
GrowthRestructuring
Charge(3)HY 02(1)
+0.2%
+36
+7.0%
+23
+8.5%
excluding effect of Canadian lock-out
EBITDAEBITDA€€ millionmillion
EEBITBIT€€ millionmillion
(1) Excluding: Bass UK (HY01) and Carling (HY02)(2) Inclusions: Bass Scotland / Northern Ireland, and Beck & Co.
Exclusions: Heineken UK contract and service fee changes(3) UK distribution restructuring charge
10
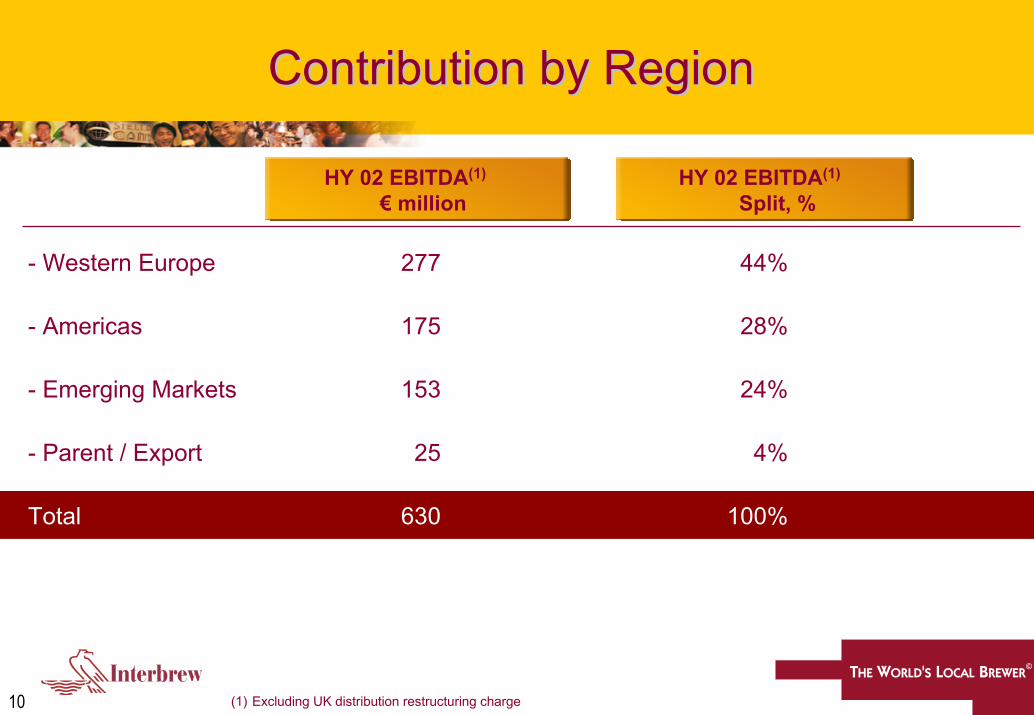
Contribution by RegionContribution by Region
HY 02 EBITDA(1)
€ millionHY 02 EBITDA(1)
Split, %
- Western Europe
- Americas
- Emerging Markets
- Parent / Export
Total
277
175
153
25
630
44%
28%
24%
4%
100%
(1) Excluding UK distribution restructuring charge

11
Breakdown of Growth in Western EuropeBreakdown of Growth in Western Europe
OrganicGrowth Scope(2) FX Organic
Growth Scope(2)HY 01(1) FX HY 02(1) Restr.Chrg.(3)HY 01(1) HY 02(1) HY 02(1)
+29+5
1,241+324 1,599
+0.216.8-+4.7
11.9
Volu
me
Volu
me
Milli
on H
lM
illion
Hl
+39.5% +41.2%
193
277-+18
+66 -61
216
EBIT
DA
EBIT
DA
€ m
illion
€ m
illion
+9.3% +11.9%+34.2%
Net
Tur
nove
rN
et T
urno
ver
€ m
illion
€ m
illion
+2.3% +28.8%
66
-61127-
+10+2196
EBIT
EBIT
€ m
illion
€ m
illion
+21.9% -31.3%+10.4%+26.1% +0.4%
(1) Excluding: Bass UK (HY 01) and Carling (HY 02)(2) Inclusions: Bass Scotland / Northern Ireland, Diebels and Beck & Co
Exclusions: Heineken UK contract and service fee changes(3) UK distribution restructuring charge
+1.7% +43.5%
+32.3%

12
Western EuropeWestern Europe
• Market share stable or growing in all countries
• Continued strong value growth of Stella Artois in the UK (+9.4%)
• Increase of Jupiler crate market share
• Pleasing developments in Germany

13
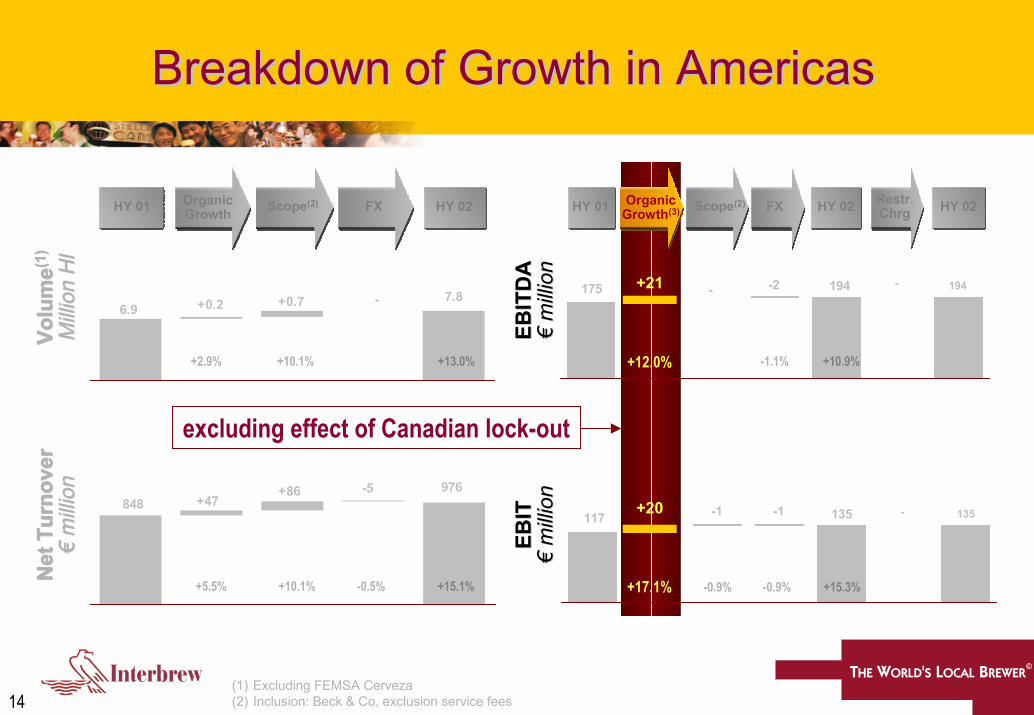
Breakdown of Growth in AmericasBreakdown of Growth in Americas
OrganicGrowth Scope(2) FX HY 02 Organic
Growth(3)HY 01 Scope(2) FX HY 02 Restr. Chrg HY 02HY 01
+47+86 -5 976
848
Net
Tur
nove
rN
et T
urno
ver
€ m
illion
€ m
illion
+5.5% +15.1%
+1 - 116-1-1 116117EB
ITEB
IT€
milli
on€
milli
on
+0.9% -0.9%-0.9%+10.1% -0.5% -0.9% -0.9%
7.8+0.2 -+0.76.9
Volu
me
Volu
me
Milli
on H
lM
illion
Hl
+2.9% +13.0%
+2 175--2 175-175
EBIT
DA
EBIT
DA
€ m
illion
€ m
illion
+1.1% -1.1%+10.1%
(1)
(1)
(1) Excluding FEMSA Cerveza(2) Inclusion: Beck & Co, exclusion service fees(3) Includes €19m cost of Canadian lock-out
14
Breakdown of Growth in AmericasBreakdown of Growth in Americas
+47+86 -5 976
848
7.8+0.2 -+0.76.9
Volu
me
Volu
me(
1)(1)
Milli
on H
lM
illion
Hl
+2.9% +13.0%
194--2 194-175
OrganicGrowth Scope(2) FX HY 02HY 01
+12.0% +10.9%-1.1%
Net
Tur
nove
rN
et T
urno
ver
€ m
illion
€ m
illion
+5.5% +15.1%
135--1-1 135117
+17.1% +15.3%-0.9%+10.1%
+10.1%
-0.5% -0.9%
+21
+20
excluding effect of Canadian lock-out
OrganicGrowth(3) Scope(2) FX HY 02HY 01 Restr.
Chrg HY 02
EBIT
DA
EBIT
DA
€ m
illion
€ m
illion
EBIT
EBIT
€ m
illion
€ m
illion
(1) Excluding FEMSA Cerveza(2) Inclusion: Beck & Co, exclusion service fees
15
AmericasAmericas
• US
• Import depletions up 7.7%
• Repositioning Rolling Rock
• Canada
• Pricing environment remains strong
• Overall market share stable
• Oland Specialty Beer Company - 20% organic volume growth
• Cuba

16
Breakdown of Emerging Markets GrowthBreakdown of Emerging Markets Growth
15.3+0.4 --14.9
Volu
me
Volu
me
Milli
on H
lM
illion
Hl
+2.7% +2.7%
+6 +3 153-2146
EBIT
DA
EBIT
DA
€ m
illion
€ m
illion
+4.1% +4.8%+2.1%
OrganicGrowth Scope FX HY 02HY 01 Organic
Growth Scope(1) FX HY 02HY 01
-1.4%
+41 +11 681-629
Net
Tur
nove
rN
et T
urno
ver
€ m
illion
€ m
illion
+6.5% +8.3%
+258-5 -2
63
EBIT
EBIT
€ m
illion
€ m
illion
-7.9% -7.9%+3.2%+1.8% -3.2%
(1) Exclusion: Service fee changes

17
Central EuropeCentral Europe
• Czech Republic, Croatia and Hungary performance above expectations with a strong core segment
• Romania and Bulgaria: tough economic environment
• Continued loss of market share to value brands
• Montenegro performance impacted by politically driven strike
18
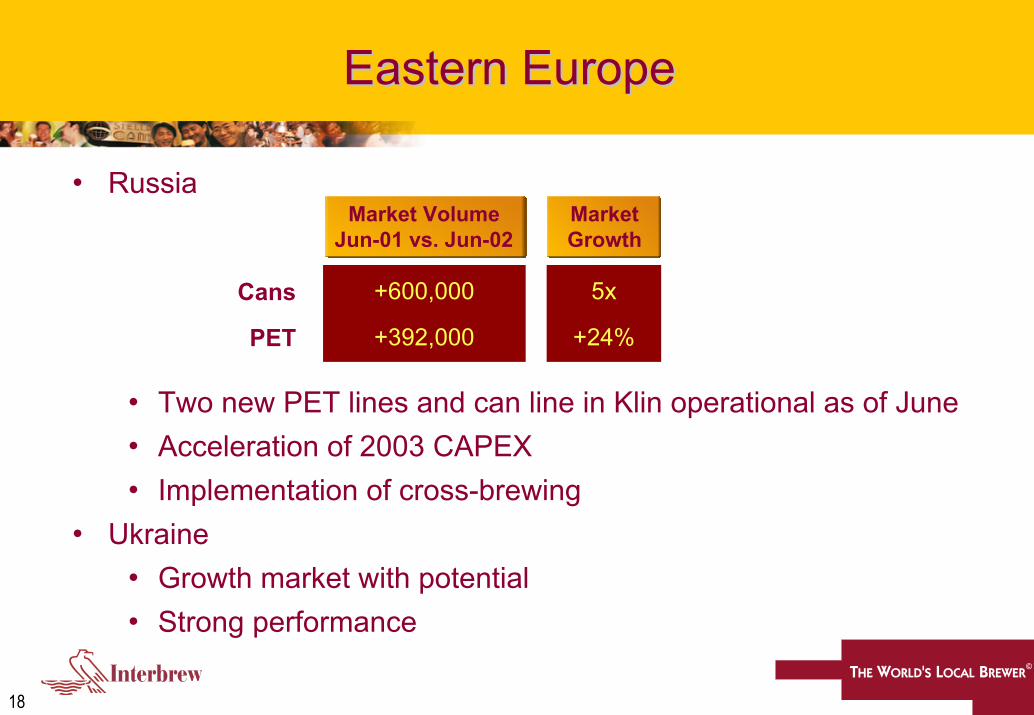
Eastern EuropeEastern Europe
• Russia
• Two new PET lines and can line in Klin operational as of June• Acceleration of 2003 CAPEX• Implementation of cross-brewing
• Ukraine• Growth market with potential• Strong performance
Market VolumeJun-01 vs. Jun-02
MarketGrowth
+600,000
+392,000
5x
+24%
Cans
PET

19
AsiaAsia
• South Korea
• Industry growth of 5% YTD
• Cass reached 19.7% market share
• Rejuvenation of OB brand
• Strong financial performance

20
Return on Invested Capital by RegionReturn on Invested Capital by Region
June 2002Post Scope
Invested Capital
June 2001
ROIC(1)
June 2002Pre-Scope
ROIC
June 2002Post Scope
ROIC(1)
- Western Europe
- Americas(2)
- Emerging Markets
- Parent / Export
Total
2,305
2,028
1,736
541
6,610
18.7%
13.2%
7.9%
-4.9%
10.1%
19.7%
15.3%
9.1%
0.9%
13.2%
8.4%
15.3%
9.1%
4.8%
10.4%
(1) As reported(2) Including investment in FEMSA Cerveza

21
EPS ProgressionEPS Progression
HY 00(1) HY 01(2) HY 02(2)
€0.46
€0.46
€0.46
€0.56
€0.54
€0.54+17%
€0.51
€0.52
€0.62+15%
EPS (excluding goodwill)
EPS (excluding goodwill, Bass UK/Carling)
EPS (excluding goodwill, Bass UK / Carling, restructuring)
€ €1.44
%
(1) Belgian GAAP(2) IAS
22
Presentation OutlinePresentation Outline
1. HY 2002 Results
2.2. Investing For Sustainable GrowthInvesting For Sustainable Growth
3. Integrating Beck & Co
4. Outlook & Conclusion

23
Investing for Sustainable GrowthInvesting for Sustainable Growth
• New Long Range Plan: 2003 – 2005
• New variable compensation
• Re-engineering: optimise global integration
• Build a platform for sustainable long-term, top and bottom-line growth
24
Challenging the Status QuoChallenging the Status Quo
Re-engineering actions taken to date
• UK
• Distribution
• Castlemaine XXXX / Murphy’s
• Canadian workforce negotiations
• Brascan settlement
Further projects to follow

25
Financial Impact of ReFinancial Impact of Re--engineeringengineering
• One off charge £25m Cash / £37.5m (€61m) EBIT
• Impact for Interbrew (€m)UK Distribution
2005 onward
Cash
+10
EBIT
+9
Canada• Negative EBIT impact of €19m in HY 02 • Avoided cost increase of €93m in FY 03 and going forward
Brascan • Cash in/minimal impact on P&L

26
Invested CapitalInvested Capital
Increased CAPEX
• Russia: Packaging + Capacity
• Cuba: Capacity + Distribution
• South Korea: Investment in brands
HY 02 CAPEX €229m, versus HY 01 CAPEX €227m
Link between CAPEX and organic growth

27
Investing in Growth MarketsInvesting in Growth Markets
Top High Growth Beer Markets(1)
10.1
6.75.9
3.0 3.0 2.6
48.4
Chin
a
Braz
il
Mex
ico
Russ
ia
USA
Pola
nd
Ukra
ine
Well-established presence in high growth markets
Continuing investment program
• China
Interbrew presence
% o
f Glo
bal
% o
f Glo
bal
Gro
wth
Gro
wth
(1) Canadean, Fastest Growing Top 20 Beer Markets (2001A-2006F)

28
Presentation OutlinePresentation Outline
1. HY 2002 Results
2. Investing For Sustainable Growth
3.3. Integrating Beck & CoIntegrating Beck & Co
4. Outlook & Conclusion
29
Integrating Beck & CoIntegrating Beck & Co
Detailed financials for Beck’s at year end
21 integration teams with full staff commitment
Focus on core business
Germany• Integration of Beck & Diebels completed in 78 working days

30
Beck’s: GermanyBeck’s: Germany (1)(1)
Sales Volume: Beck’s (Total Brand) Sales Volume: Beck’s (Rtn. Bottles)
1,400
1,500
1,600
1,700
1,800
1,900
2,000
1998 1999 2000 2001 2002380400420440460480500520540560
1998 1999 2000 2001 2002
6.7% Price Increase executed1-Jun-00
8.5% Second Price Increase 1-Jul-02
5.0% Price Increase executed 1-Jun- 00
The new crate
5.0% Second Price Increase1-Jul-02
Announcement ofBeck’s acquisition
6-Aug-01
Announcement ofBeck’s acquisition
6-Aug-01
31
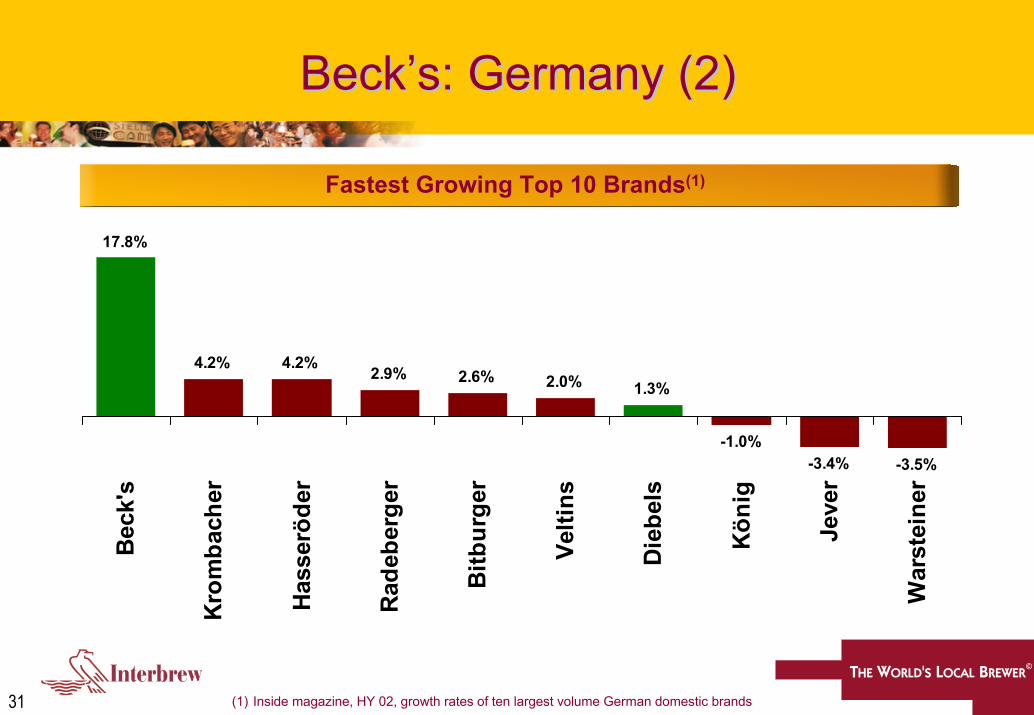
Beck’s: GermanyBeck’s: Germany (2)(2)
Fastest Growing Top 10 Brands(1)
17.8%
4.2% 4.2% 2.9% 2.6% 2.0% 1.3%
-1.0%-3.4% -3.5%
Beck
's
Krom
bach
er
Hass
eröd
er
Rade
berg
er
Bitb
urge
r
Velti
ns
Dieb
els
Köni
g
Jeve
r
War
stei
ner
(1) Inside magazine, HY 02, growth rates of ten largest volume German domestic brands

32
Beck’s: GermanyBeck’s: Germany (3)(3)
Total Beck’s Margin (Indexed to 100)
100
104102
122
100
97/9
8
98/9
9
99/0
0
00/0
1
01/0
2

33
Beck’s: Rest of WorldBeck’s: Rest of World
• Canadian licence
• Total cost of €3.5m over 5 years
• Wider distribution through Oland Specialty Beer Company
• EFES agreement in Turkey
• Export business - strong performance
34
Beck’s: AmericasBeck’s: Americas
• Update on legal situation
• Currently operating independently of Labatt USA
• Uncertainty over integration has had some impact on sales performance
• Encouraging recent trading trends
• Marketing initiatives to reinvigorate brand for US consumers

35
Presentation OutlinePresentation Outline
1. HY 2002 Results
2. Investing For Sustainable Growth
3. Integrating Beck & Co
4.4. Outlook & ConclusionOutlook & Conclusion

36
Current Trading ConditionsCurrent Trading Conditions
• Western Europe
• Americas
• Emerging Markets
37
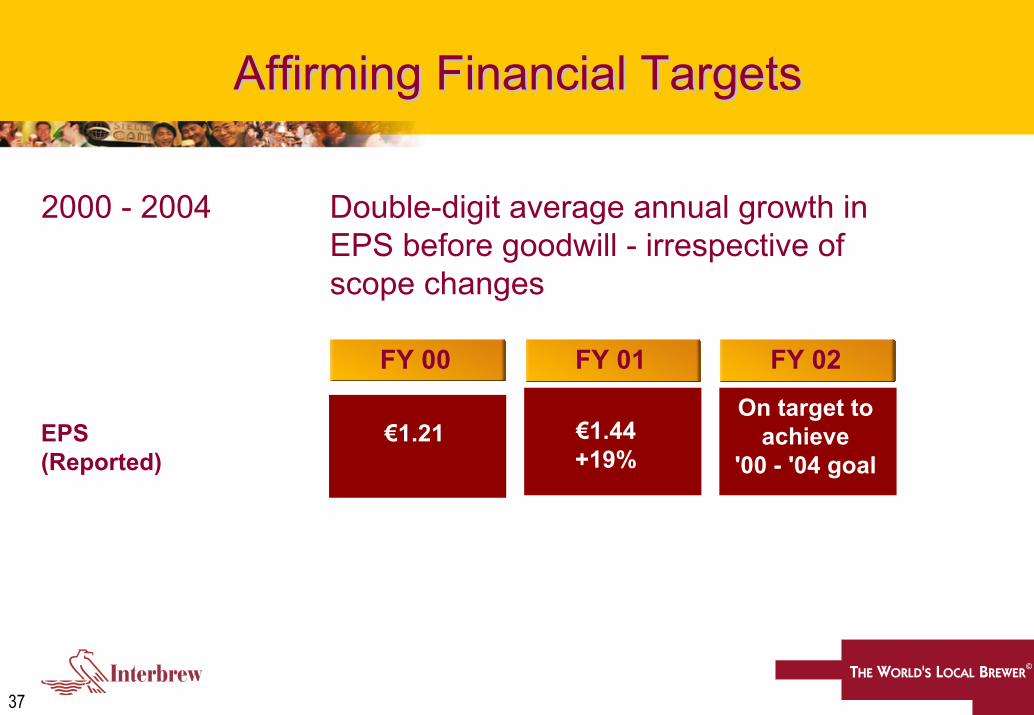
Affirming Financial TargetsAffirming Financial Targets
2000 - 2004 Double-digit average annual growth in EPS before goodwill - irrespective of scope changes
FY 00 FY 01 FY 02
€1.44+19%
On target to achieve
'00 - '04 goal€1.21EPS
(Reported)

Questions & AnswersQuestions & Answers

HY 2002 RESULTSHY 2002 RESULTSAnnexes
40
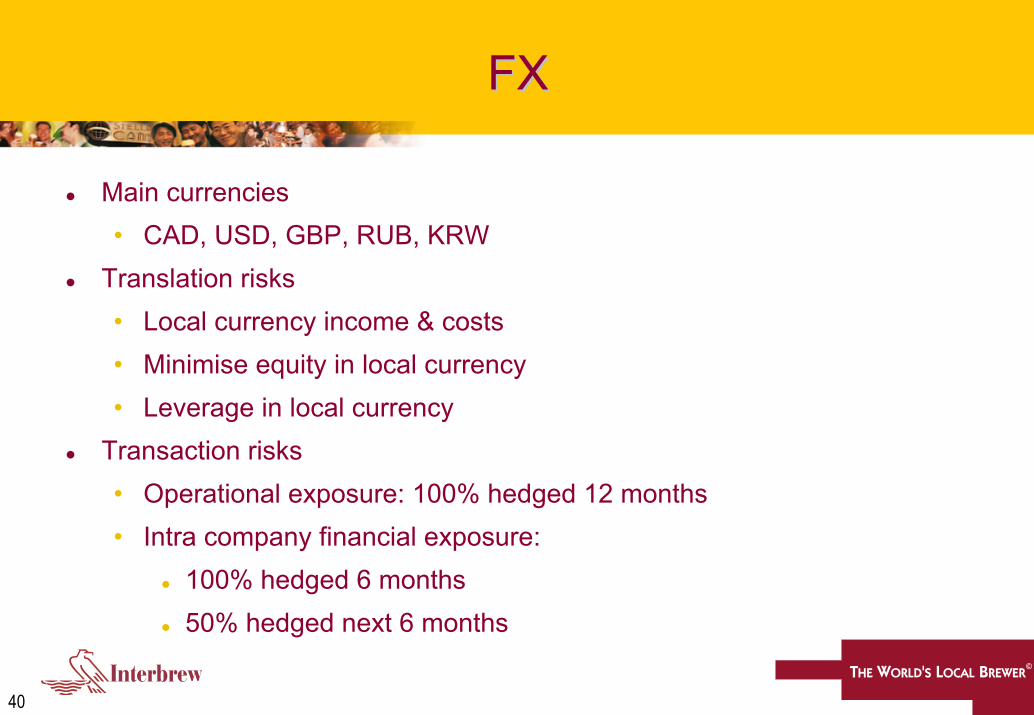
FXFX
Main currencies• CAD, USD, GBP, RUB, KRW
Translation risks• Local currency income & costs• Minimise equity in local currency• Leverage in local currency
Transaction risks• Operational exposure: 100% hedged 12 months• Intra company financial exposure:
100% hedged 6 months50% hedged next 6 months
41
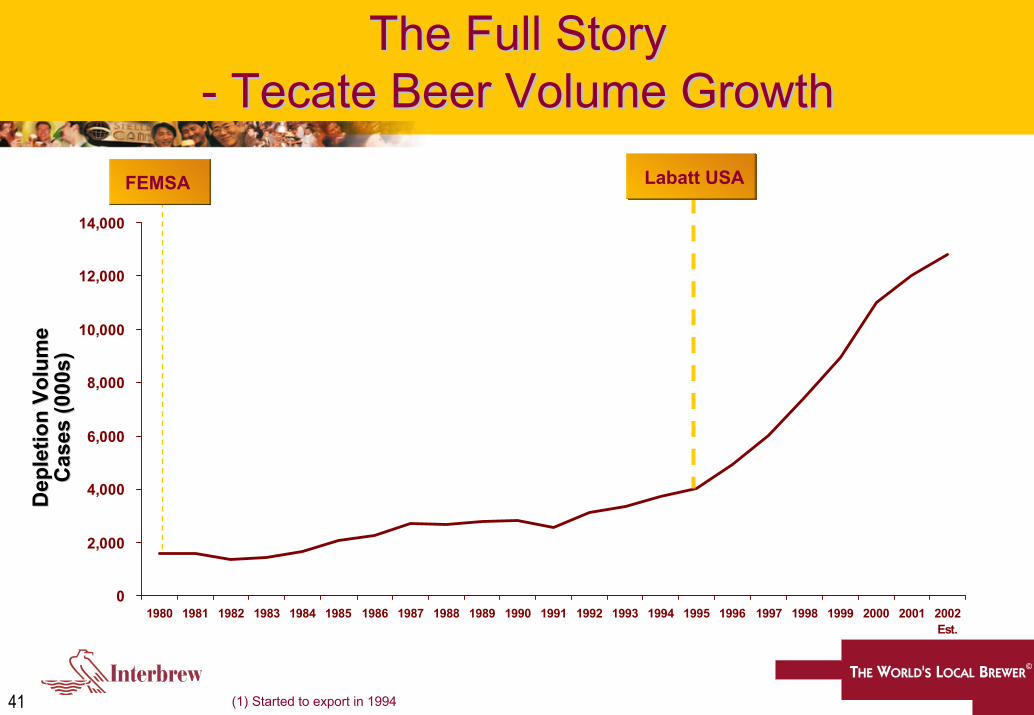
The Full StoryThe Full Story-- TecateTecate Beer Volume GrowthBeer Volume Growth
0
2,000
4,000
6,000
8,000
10,000
12,000
14,000
1980 1981 1982 1983 1984 1985 1986 1987 1988 1989 1990 1991 1992 1993 1994 1995 1996 1997 1998 1999 2000 2001 2002Est.
Labatt USAFEMSA
Dep
letio
n Vo
lum
eD
eple
tion
Volu
me
Cas
es (0
00s)
Cas
es (0
00s)
(1) Started to export in 1994

42
The Full StoryThe Full Story-- Dos Dos EquisEquis Beer Volume GrowthBeer Volume Growth
0
1,000
2,000
3,000
4,000
5,000
6,000
1980 1981 1982 1983 1984 1985 1986 1987 1988 1989 1990 1991 1992 1993 1994 1995 1996 1997 1998 1999 2000 2001 2002Est.
Labatt USAFEMSA
Dep
letio
n Vo
lum
eD
eple
tion
Volu
me
Cas
es (0
00s)
Cas
es (0
00s)

43
Sound Financial StructureSound Financial Structure
HY 02 HY 01
2741
4.8
4.7
€ 2,741m
4.8
4.7
€ 3,158m
4.8
4.8
Net Financial Debt
Net Financial Debt / EBITDA
Cash Interest Coverage