Hx Instrument
43
Capturing the essence of life HX-IA Instrument™ Thorleif Lavold Biomotif AB
-
Upload
thorleif-lavold -
Category
Documents
-
view
587 -
download
1
Transcript of Hx Instrument

Capturing the essence of life
HX-IA Instrument™
Thorleif Lavold
Biomotif AB

The HX-IA Instrument™
1. H/D Exchange to study conformation,
binding sites, Epitope Mapping etc.
2. ElectroCapture technology
3. ”Findtheneedleinthehaystack” for on-line
pI separation of proteins
4. Ligand Screening
5. Compound Fishing-Epitope Imprinting


New HX-IA Instrument

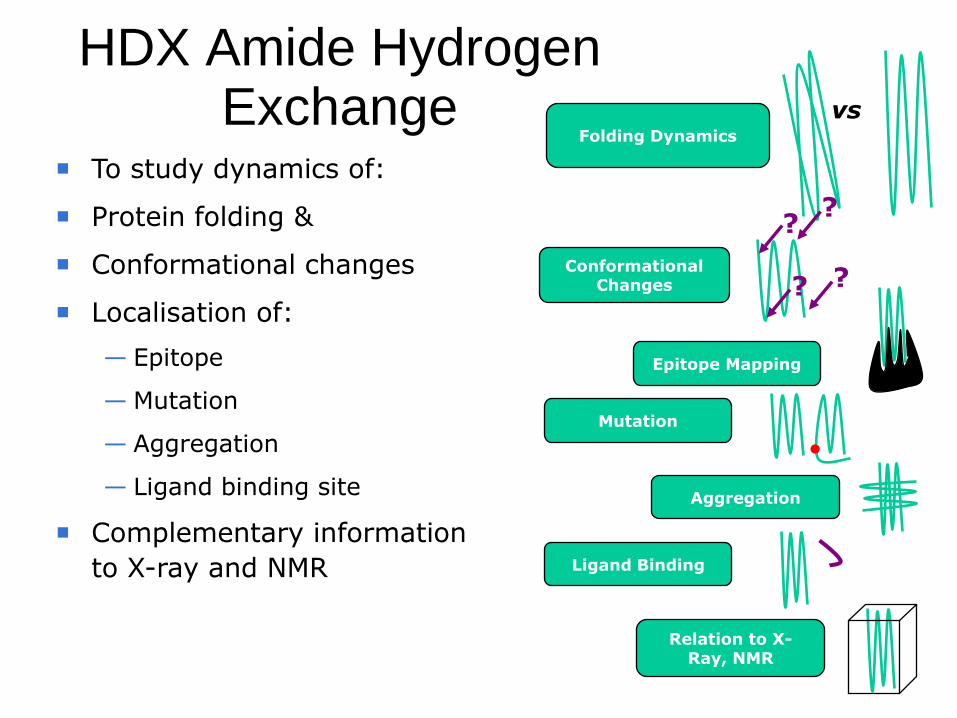
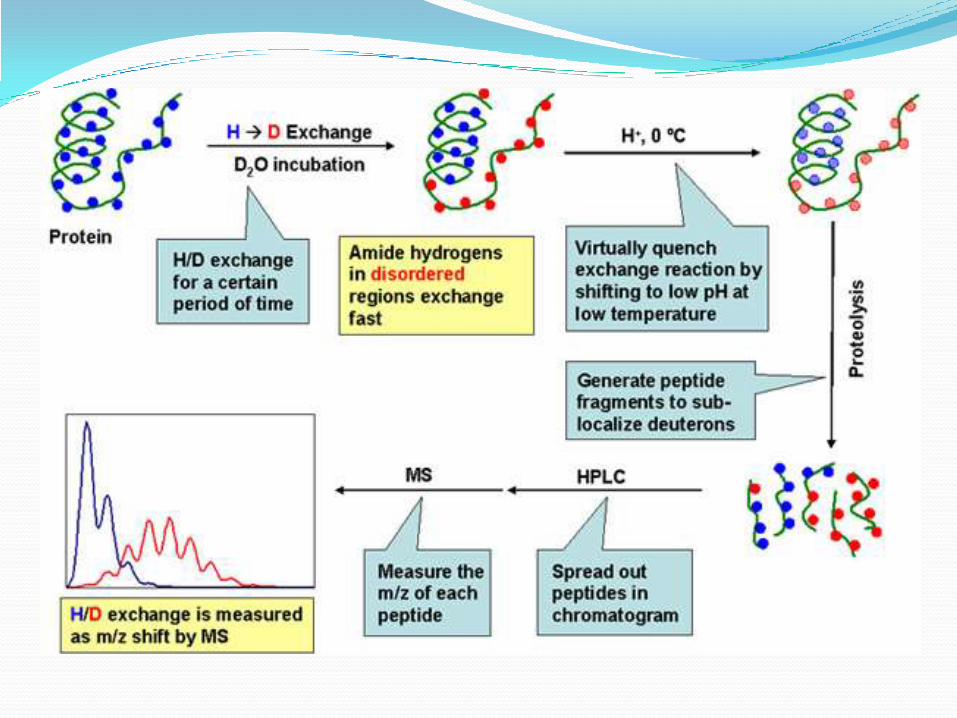
HDX Amide Hydrogen Exchange
D2O
H’s & D’s
at backbone amide positions

H/D Exchange for Monitoring Protein Structural Changes
−D
FOLDED
UNFOLDED
m/z
Inte
nsity
m/z
Inte
nsity
mass shift
more D incorporated
IN HEAVY WATER
IN HEAVY WATER
After 10 min
HDX Amide Hydrogen Exchange
Folding Dynamics
vs
Ligand Binding
Conformational Changes
?
?
?
?
Aggregation
Relation to X-Ray, NMR
Epitope Mapping
To study dynamics of:
Protein folding &
Conformational changes
Localisation of:
— Epitope
— Mutation
— Aggregation
— Ligand binding site
Complementary information
to X-ray and NMR
Mutation
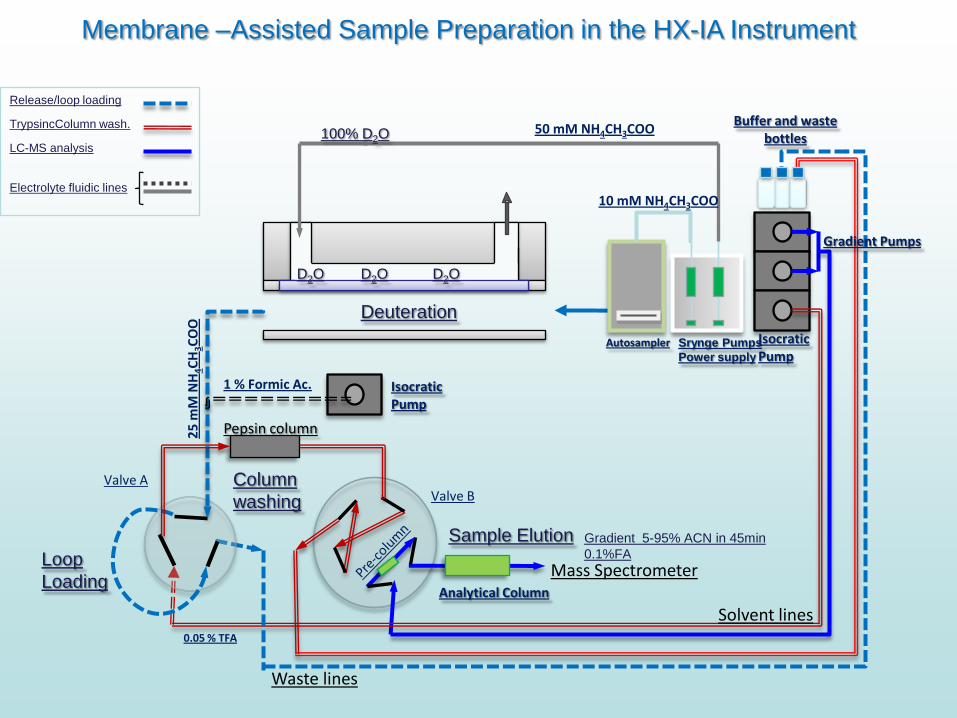
Pepsin column
Valve AValve B
Loop
Loading
Deuteration
Sample Elution
Mass Spectrometer
Waste lines
Solvent lines
Buffer and waste bottles
Gradient Pumps
10 mM NH4CH3COO
1 % Formic Ac.
Isocratic Pump
Autosampler Srynge Pumps
Power supply
0.05 % TFA
50 mM NH4CH3COO
25
mM
NH
4C
H3C
OO
Column
washing
Analytical Column
Isocratic Pump
Release/loop loading
TrypsincColumn wash.
LC-MS analysis
Electrolyte fluidic lines
Membrane –Assisted Sample Preparation in the HX-IA Instrument
Gradient 5-95% ACN in 45min
0.1%FA
D2O D2O D2O
100% D2O

Flow
Flo
wSample
Channel
Second
Solution
Semipermeable membrane separates sample channel from the deuterating
solution
Membrane-Assisted Sample Preparation
Semipermeable
Membrane
Semi-permeable Membranes

FlowSample
Channel
Second
Solution
Semipermeable membrane separates the sample channel from the deuterating
solution
Membrane-Assisted Sample Preparation
Membrane


0 % DeuterationPROTECTED
(Internal Pocket)
60 % DeuterationUnprotected
35 % DeuterationSemi-protected
15 % DeuterationPROTECTED
Different Deuteration Levels According to Protein Conformation

Different Deuteration Levels According to Protein Conformation

INTERLEIKIN 1β / ANTIBOBY H/D EXCHANGE EXPERIMENTS
Deuterated IL1β mass
IL1β alone IL1β +Fab
17451,57 17447,04
17451,85 17446,8
17451,3 17447,08
17452,1 17446,04
17451,33 17446,38
17451,71 17446,05
Average 17451,64 17446,56
Deuterons displaced by Fab binding = 5,08

Intact Mass MS
Literature example of irreversible oxidative modification of Myoglobin
Denature Digestion
Protein
Ligand
Surface Modification
Unmodified Epitope
M
Peptide Analysis
Where does it bind? Epitope mapping by MS using 1H2H exchange (HDX) or covalent modification

ConclusionsOnline Membrane-Assisted HDX
No D2O Dilution No Pippetting
Less sample consumption
Flow Injection Deuteration (no need for automated pipetting stations)
No need of liquid Nitrogen (online )
Acidification on-line with no dilution of sample
Tris or Phosphate buffer can be used
Can be coupled with any API-MS system

• Detection of non-covalently linked protein-ligand complexes
• Kd determination is possible to rank ligands
• Epitope mapping gives positional information
• Protein consumption is low• Gas Phase Ion mobility shows great potential for
investigating PPIs.– BUT…. How representative is the gas phase structure to
that in solution
INTERACTOMICS
Does it bind?How strongly does it bind?Where does it bind?What happens on binding?To what does it bind?What binds?


Electrocapture-based Separations
Charge particle
Capturing the essence of life
Electrocapture conditions will be fulfilled when
Ve ≥ Vf
Electrophoretic velocity is given by,
Ve = ue x E
Ve = Electrophoretic velocity
ue = Electrophoresis mobility
E = Electric field
Positive
Electrode
Negative
Electrode

Figure 1: This Figure is a schematic
of a dual membrane ES probe. Note
how there is no electrically connected
conductive surface in the sample
solution flow channel.
Dual Membrane Electrospray Probe
Electrocapture
Region
Membrane Section 2
Membrane
Section 1 Electrospray
Ion Source
Upstream Electrode
Down stream Electrode

New Flat membrane cell

New cell in PEEK

Protein band
Anodic chamber Cathodic chamber
Flow
Capillary electrophoresis
MALDI & ESI-MS
Micro reactions
Analytical Applications
Separations, μ-LC

Flow
Peek tubing
Conductivemembrane
Captured protein
125 m
Image downstream cathode junction during capture-device operation
Protein captured at 30 nL spot

ESI Total Ion Count of an Electrocapture-concentration Experiment
.
80-fold magnification!

m/z1000 1100 1200 1300 1400 1500 1600 1700 1800 1900 2000 2100 2200 2300 2400 2500 2600 2700 2800 2900
%
0
100
alfa-detergent-a 46 (1.037) Sm (Mn, 2x8.00); Cm (2:46) TOF MS ES+ 1.64e31235
11511084
1236
1388
1387
1237
1237
1238
1239
1239
1241
1257
15401388
1540
1539
1389
1390
1391
1391
1409
1844
1844
1541
1692
1692
1542
1543
1691
1543
1544
1544
16411550
1693
1843
1694
1743
1695
1845
1845
1846
1945
1938
1936
1859
2148
2047
1996
1996
19972127
2061
2452
2249
2225
23762300
2350
2755
2528
2499
2604
2553
2680
26542694
2832
2816
2805
29372907 29982982
n-octyl β-D glucopyranoside
ESI-MS Analysis of α-Lactalbumin in a solution containing 0.5% Non-Ionic Detergent
Detergent clusters

m/z1000 1100 1200 1300 1400 1500 1600 1700 1800 1900 2000 2100 2200 2300 2400 2500 2600 2700 2800 2900
%
0
100
alfa-peak-a 204 (4.871) Sm (Mn, 2x8.00); Cm (200:208) TOF MS ES+ 1152127
2117
2114
2111
2108
1850
1847
1845
12171208
1203
1190
1227
15041379
1861
1864
2130
2480
2136
2139
2470
24592166
2175
2206 23242285
2484
2491
25262974
ESI-MS Analysis of α-Lactalbumin in 0.5% Non-Ionic Detergent after Electrocapture
After Electrocapture
Protein peaks

200
Vf = Ve = ue x E
E (V/cm)
Time
Vf > Ve = ue x E
Flow
Capturing the essence of life
myo-alfa-rybo
m/z600 800 1000 1200 1400 1600 1800 2000 2200 2400 2600 2800 3000 3200 3400 3600 3800
%
0
100
%
0
100
%
0
100
%
0
100
%
0
100
proteinmix-a 3253 (61.724) Cm (3192:3270) TOF MS ES+ 2822041
20401786
17861781
20371791
2046
2049
2052
proteinmix-a 2969 (56.085) Cm (2966:3019) TOF MS ES+ 281794
17021548
15441700
204317961957 2052
22042057
proteinmix-a 2580 (48.429) Cm (2510:2622) TOF MS ES+ 17018931707
17041552
15491549
15561702
1709 1892
1711
18961897
1969
proteinmix-a 2243 (41.759) Cm (2232:2344) TOF MS ES+ 1441707
170415521550
1549
15541709 18961710 1967
1969
proteinmix-a 2049 (37.955) Cm (2001:2120) TOF MS ES+ 8021712
1709
17091522
1519 1524
1714 1953
1717 1953 1959
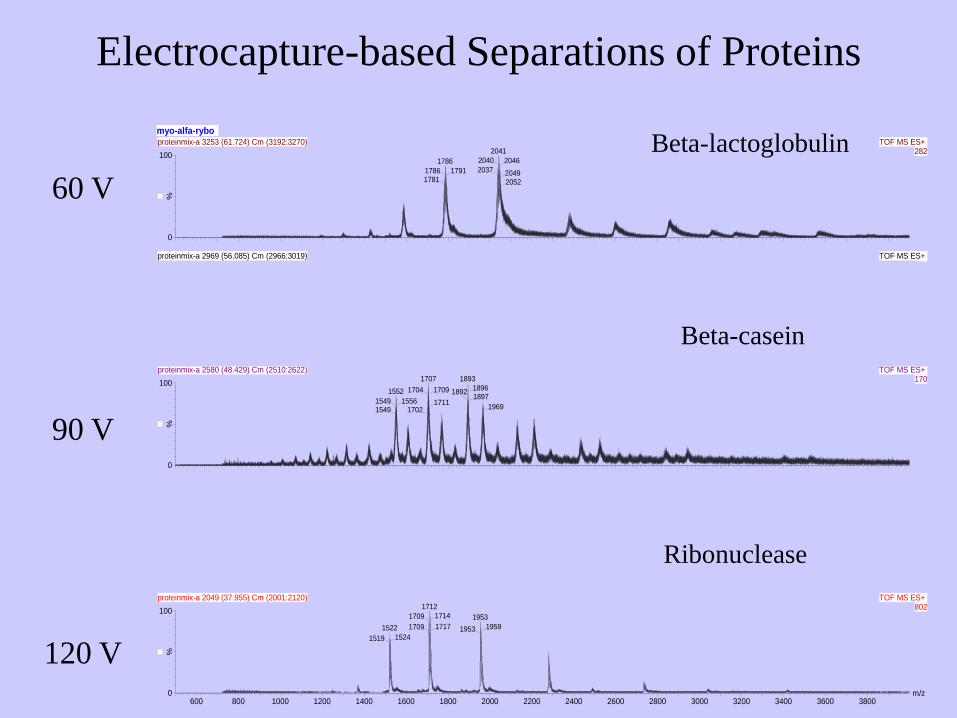
Electrocapture-based Separations of Proteins
120 V
90 V
60 V
Ribonuclease
Beta-casein
Beta-lactoglobulin

Findtheneedleinthehaystack Instrument™

2D-EC “NeedleInTheHaystack”
Cell #1 is held at 170V/cm Cell #2 at 171V/cm
Green, grey and purple fractions
above 171 V/cm goes to waste
Capturing the essence of life
The yellow molecules are the only ones captured between
170V/cm-171V/cm in Cell #2 and further concentrated
And or separated before MS-detection.
Any Voltage fractions can be selected for targeted “Compound
Fishing” experiments with 2D-EC NeedleInTheHaystack.
+ +
--

+ -
Electric Field
Hydrodynamic flow Mass Spec
Inject Ligand Cocktail
Using the protein as an “immobilised stationary phase”
Compounds elute in order of increasing affinity
Ligand screening using Solution Phase Ion Mobility

Flow
Peek tubing
Conductivemembrane
Captured protein
125 m
Image downstream cathode junction during capture-device operation
Protein captured at 30 nL spot

rt 7.5 min
BSAafterrelease of voltage
BSA
SB00396

• Compound Fishing-Epitope Imprinting

The principle on the formation of MIP
phase
1. Mixing a template corresponding to the analyte/handle of interest with a compound (functional monomer) having the optimal bonding sites for the formation of hydrogen donor – acceptor interaction.
2. The functional monomer easily form at polymer in the presence of the template/handle, affording the correct cavity and bonding properties to the handle. Afterwards the template is removed.
This is analogous to a key in a lock.
Template = our handle

Principle of “our” MIP cavity
bonding• The cavity match the functional
group
• The group has strong interaction
due to hydrogen bonding.
• X = reactive group that depending
on its nature can “selectively”
form a covalent bond to a
functional group of the analyte of
interest. Compound fishing .

Compound fishing
If the analyte of interest has a functional group such as following examples:
• -COOH
• -NH2
• -CO-
• and many more
The X can be selected to form a covalent bond with the particular group of
the analyte, as shown in following example.

What is special with our approach?
So far every analyte of interest most often require the formation of a
dedicated MIP phase.
Our approach is generic, only one MIP phase is needed to capture almost
any targeted organic compound .
We can selectively pick a compound or a group of compounds through
derivatisation.
The MIP phase can be employed as a packed column for LC-MS, or
on a surface using MALDI-MS.
MIP as biosensor (QCM, etc.).

Beneficial….
• Open up completely new diagnostic tool to analyze “stuff” not being possible before.
• In addition analyze biomarkers that could not be monitored before at the required low levels.
• New dimension for medical diagnostic purposes.
• For a patients, both urine- and blood- samples can be analysed.
• Urine samples by direct derivatisation.
• Blood samples, by a simple purification step such as ultra
filtration removing the proteins followed by derivatisation.

Fee For Service
• H/D Exchange
• Epitope Mapping
• Patent filing cases
• ElectroCapture pre-concentration
Target is all Pharma and Biotech companies
working with Ab, Proteins, Peptides etc.

THANK YOU!
• Thorleif Lavold CEO, Biomotif AB
• www.biomotif.com