hvs.com HVS India & South Asia India...Chandigarh recorded the highest growth in RevPAR (12.3%) in...
20
The Leela Palace, Udaipur hvs.com HVS India & South Asia
Transcript of hvs.com HVS India & South Asia India...Chandigarh recorded the highest growth in RevPAR (12.3%) in...
The Leela Palace, Udaipur
hvs.comHVS India & South Asia
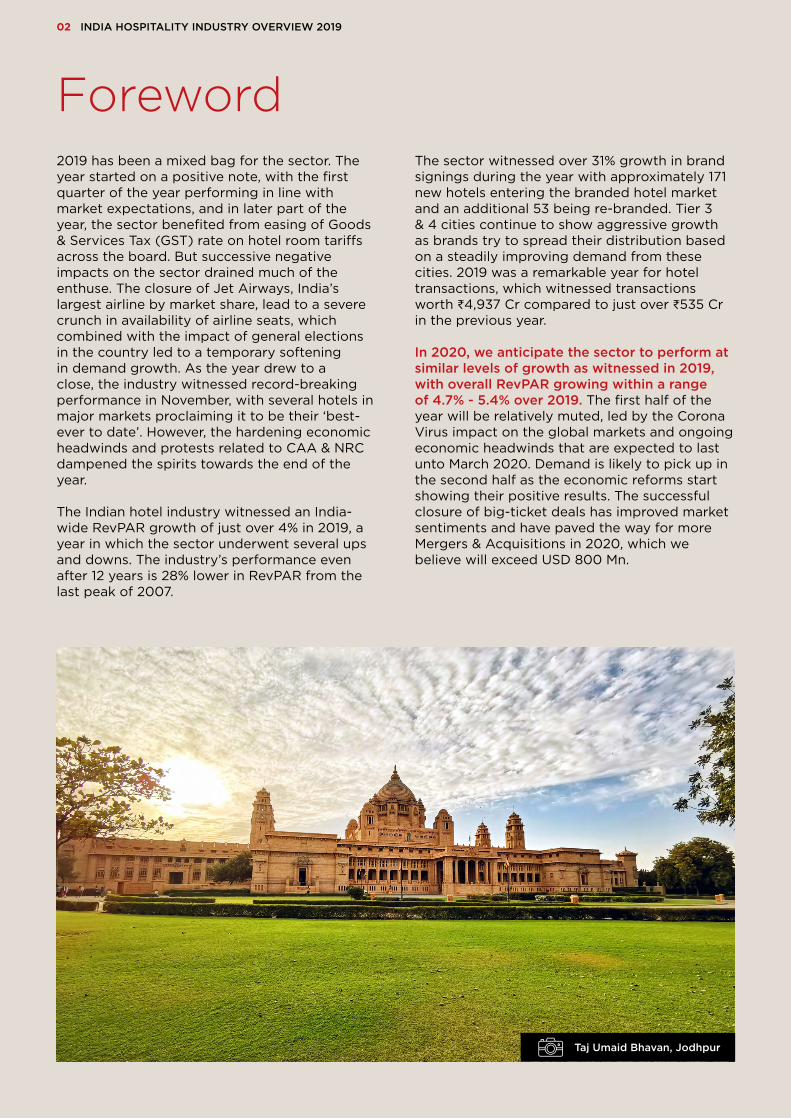
The sector witnessed over 31% growth in brand signings during the year with approximately 171 new hotels entering the branded hotel market and an additional 53 being re-branded. Tier 3 & 4 cities continue to show aggressive growth as brands try to spread their distribution based on a steadily improving demand from these cities. 2019 was a remarkable year for hotel transactions, which witnessed transactions worth ₹4,937 Cr compared to just over ₹535 Cr in the previous year. In 2020, we anticipate the sector to perform at similar levels of growth as witnessed in 2019, with overall RevPAR growing within a range of 4.7% - 5.4% over 2019. The first half of the year will be relatively muted, led by the Corona Virus impact on the global markets and ongoing economic headwinds that are expected to last unto March 2020. Demand is likely to pick up in the second half as the economic reforms start showing their positive results. The successful closure of big-ticket deals has improved market sentiments and have paved the way for more Mergers & Acquisitions in 2020, which we believe will exceed USD 800 Mn.
2019 has been a mixed bag for the sector. The year started on a positive note, with the first quarter of the year performing in line with market expectations, and in later part of the year, the sector benefited from easing of Goods & Services Tax (GST) rate on hotel room tariffs across the board. But successive negative impacts on the sector drained much of the enthuse. The closure of Jet Airways, India’s largest airline by market share, lead to a severe crunch in availability of airline seats, which combined with the impact of general elections in the country led to a temporary softening in demand growth. As the year drew to a close, the industry witnessed record-breaking performance in November, with several hotels in major markets proclaiming it to be their ‘best-ever to date’. However, the hardening economic headwinds and protests related to CAA & NRC dampened the spirits towards the end of the year.
The Indian hotel industry witnessed an India-wide RevPAR growth of just over 4% in 2019, a year in which the sector underwent several ups and downs. The industry’s performance even after 12 years is 28% lower in RevPAR from the last peak of 2007.
Foreword
02 INDIA HOSPITALITY INDUSTRY OVERVIEW 2019
Taj Umaid Bhavan, Jodhpur
The Park, Hyderabad
INDIA HOSPITALITY INDUSTRY OVERVIEW 2019 03
Contents
4 India Travel & Tourism 2019 Performance Review6
2019 Brand Signings8 2019 Brand Openings14
Hotel Investments16 Outlook 202017
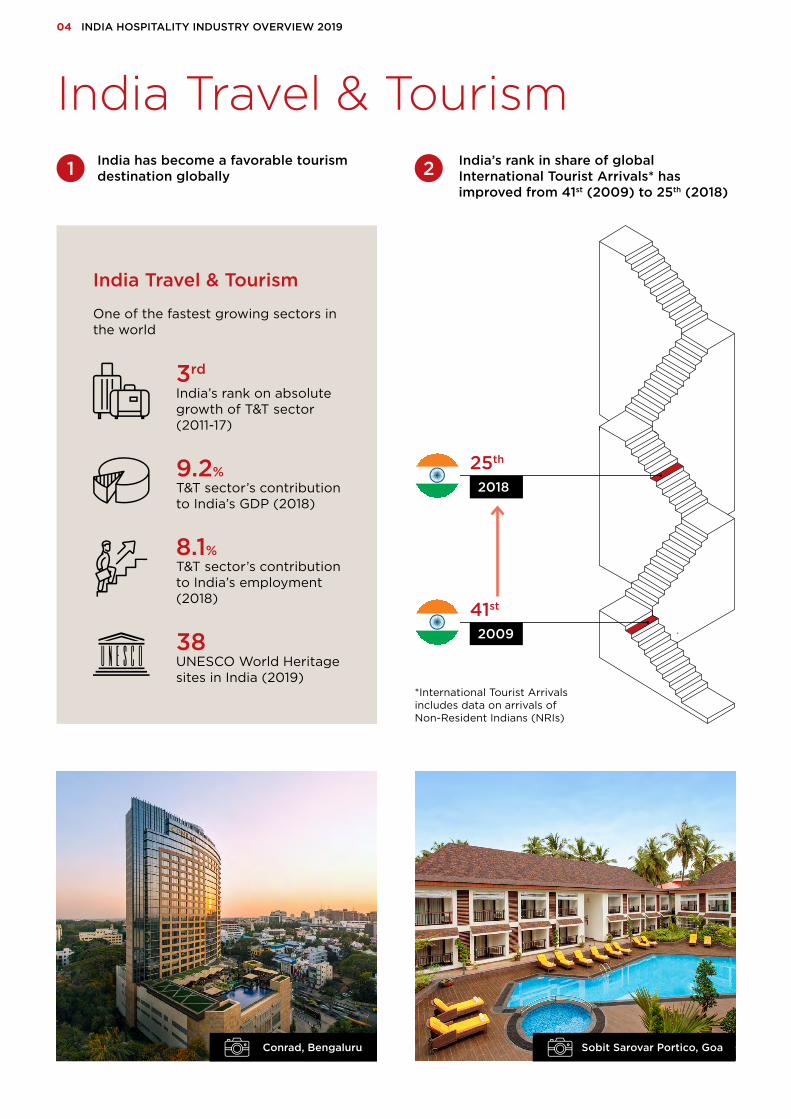
India Travel & TourismIndia has become a favorable tourism destination globally1 India’s rank in share of global
International Tourist Arrivals* has improved from 41st (2009) to 25th (2018)
*International Tourist Arrivals includes data on arrivals ofNon-Resident Indians (NRIs)
2009
41st
2018
25th
2
04 INDIA HOSPITALITY INDUSTRY OVERVIEW 2019
3rd
India’s rank on absolute growth of T&T sector (2011-17)
8.1%T&T sector’s contribution to India’s employment (2018)
9.2%T&T sector’s contribution to India’s GDP (2018)
38UNESCO World Heritage sites in India (2019)
India Travel & Tourism
One of the fastest growing sectors in the world
Sobit Sarovar Portico, GoaConrad, Bengaluru
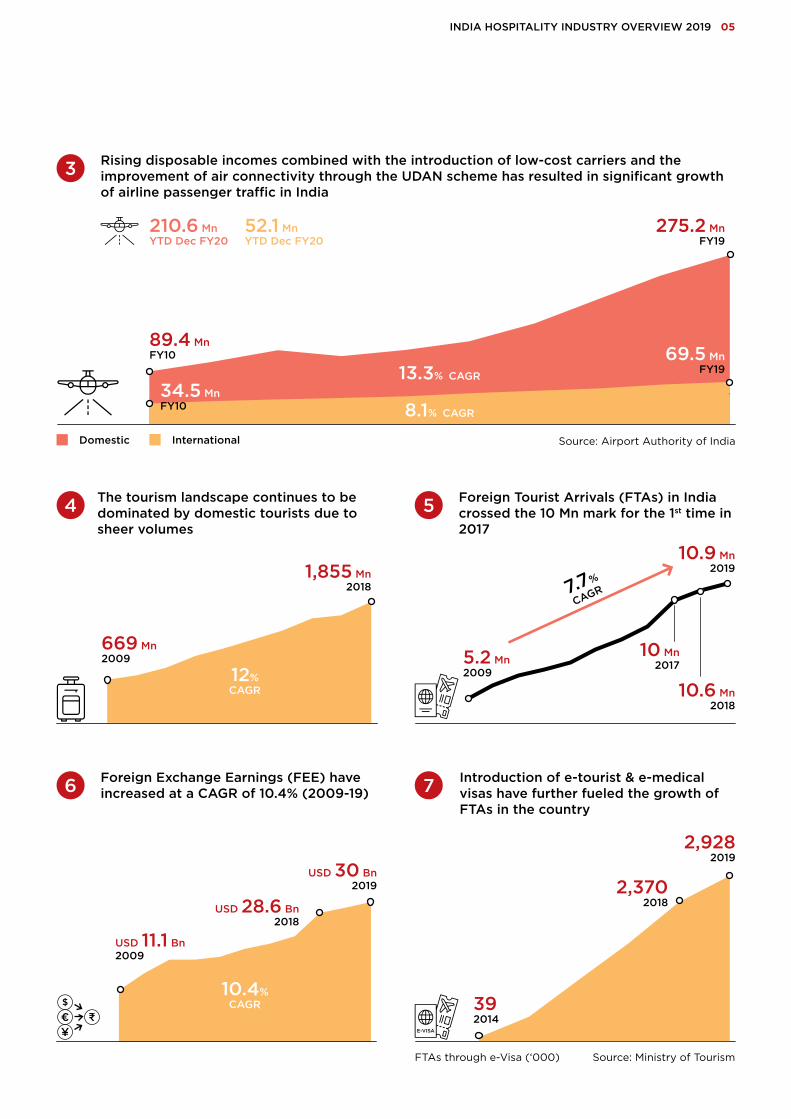
Foreign Exchange Earnings (FEE) have increased at a CAGR of 10.4% (2009-19)
Introduction of e-tourist & e-medical visas have further fueled the growth of FTAs in the country
Source: Ministry of Tourism
USD 11.1 Bn2009
USD 30 Bn2019
392014
2,3702018
2,9282019
6 7
INDIA HOSPITALITY INDUSTRY OVERVIEW 2019 05
FTAs through e-Visa (‘000)
USD 28.6 Bn2018
Rising disposable incomes combined with the introduction of low-cost carriers and the improvement of air connectivity through the UDAN scheme has resulted in significant growth of airline passenger traffic in India
Domestic International
89.4 MnFY10
34.5 MnFY10
3
Source: Airport Authority of India
210.6 MnYTD Dec FY20
52.1 MnYTD Dec FY20
10.4%CAGR
Foreign Tourist Arrivals (FTAs) in India crossed the 10 Mn mark for the 1st time in 2017
5.2 Mn2009
10.9 Mn2019
10 Mn2017
5
7.7%
CAGR
The tourism landscape continues to be dominated by domestic tourists due to sheer volumes
669 Mn2009
1,855 Mn2018
4
12%CAGR 10.6 Mn
2018
69.5 MnFY1913.3% CAGR
8.1% CAGR
275.2 MnFY19
2019 Performance Review
06 INDIA HOSPITALITY INDUSTRY OVERVIEW 2019
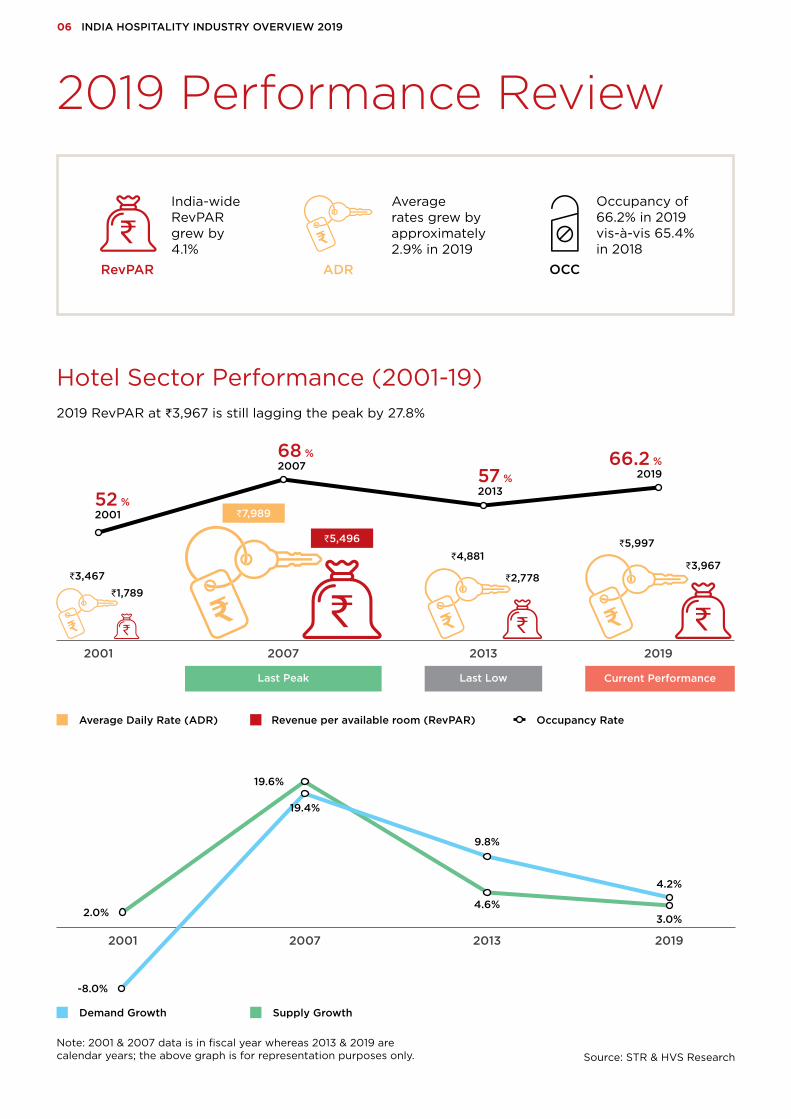
India-wide RevPAR grew by 4.1%
RevPAR
Average rates grew by approximately 2.9% in 2019
ADR
Occupancy of 66.2% in 2019 vis-à-vis 65.4% in 2018
OCC
Demand Growth Supply Growth
Source: STR & HVS ResearchNote: 2001 & 2007 data is in fiscal year whereas 2013 & 2019 are calendar years; the above graph is for representation purposes only.
Hotel Sector Performance (2001-19)2019 RevPAR at ₹3,967 is still lagging the peak by 27.8%
52 %2001
68 %2007 66.2 %
2019
2019
₹5,997
2001
₹3,467₹1,789
2007
₹5,496
₹7,989
Last Peak Last Low
₹3,967
2013
₹4,881
₹2,778
57 %2013
Current Performance
Average Daily Rate (ADR) Revenue per available room (RevPAR) Occupancy Rate
-8.0%
2001
2.0%
2007
19.6%
19.4%
2019
4.2%
3.0%
2013
9.8%
4.6%
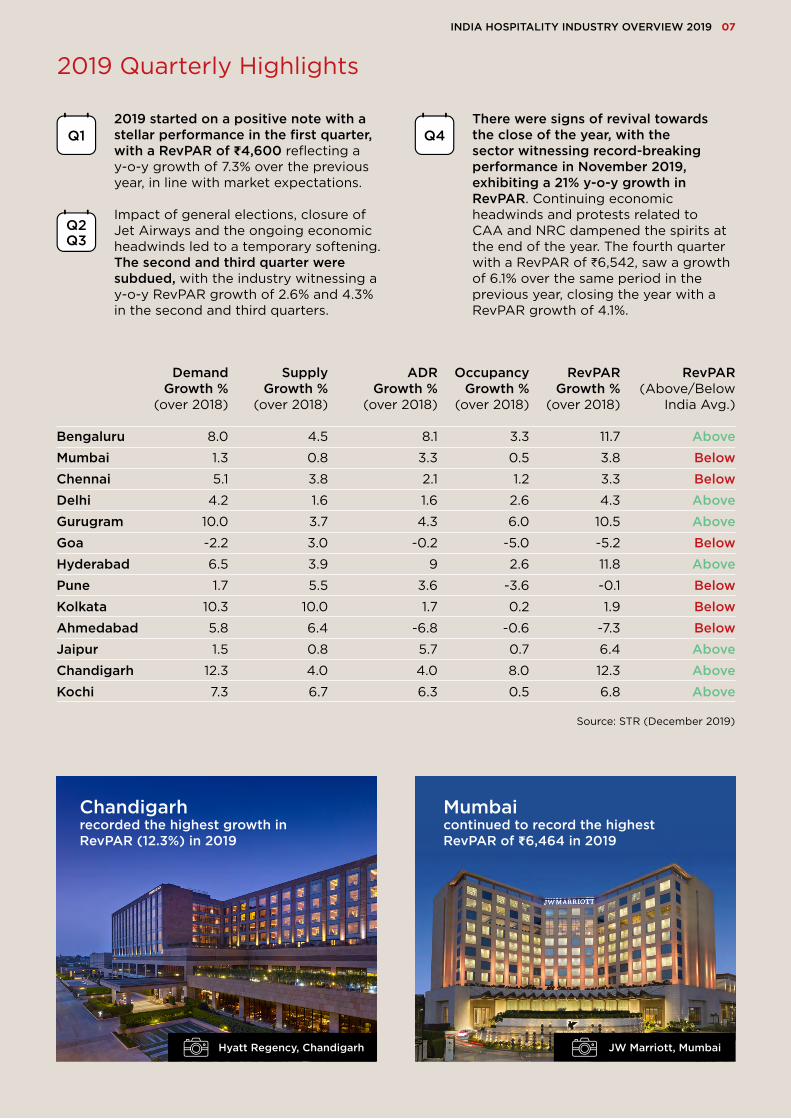
Chandigarhrecorded the highest growth in RevPAR (12.3%) in 2019
Hyatt Regency, Chandigarh JW Marriott, Mumbai
There were signs of revival towards the close of the year, with the sector witnessing record-breaking performance in November 2019, exhibiting a 21% y-o-y growth in RevPAR. Continuing economic headwinds and protests related to CAA and NRC dampened the spirits at the end of the year. The fourth quarter with a RevPAR of ₹6,542, saw a growth of 6.1% over the same period in the previous year, closing the year with a RevPAR growth of 4.1%.
2019 started on a positive note with a stellar performance in the first quarter, with a RevPAR of ₹4,600 reflecting a y-o-y growth of 7.3% over the previous year, in line with market expectations.
Impact of general elections, closure of Jet Airways and the ongoing economic headwinds led to a temporary softening. The second and third quarter were subdued, with the industry witnessing a y-o-y RevPAR growth of 2.6% and 4.3% in the second and third quarters.
Q1 Q4
Q2Q3
2019 Quarterly Highlights
INDIA HOSPITALITY INDUSTRY OVERVIEW 2019 07
Source: STR (December 2019)
BengaluruMumbai ChennaiDelhiGurugramGoaHyderabadPuneKolkataAhmedabadJaipurChandigarhKochi
Demand Growth %
(over 2018)
8.0
1.3
5.1
4.2
10.0
-2.2
6.5
1.7
10.3
5.8
1.5
12.3
7.3
SupplyGrowth %
(over 2018)
4.5
0.8
3.8
1.6
3.7
3.0
3.9
5.5
10.0
6.4
0.8
4.0
6.7
ADRGrowth %
(over 2018)
8.1
3.3
2.1
1.6
4.3
-0.2
9
3.6
1.7
-6.8
5.7
4.0
6.3
OccupancyGrowth %
(over 2018)
3.3
0.5
1.2
2.6
6.0
-5.0
2.6
-3.6
0.2
-0.6
0.7
8.0
0.5
RevPAR(Above/Below
India Avg.)
AboveBelowBelowAboveAboveBelowAboveBelowBelowBelowAboveAboveAbove
RevPARGrowth %
(over 2018)
11.7
3.8
3.3
4.3
10.5
-5.2
11.8
-0.1
1.9
-7.3
6.4
12.3
6.8
Mumbaicontinued to record the highest RevPAR of ₹6,464 in 2019
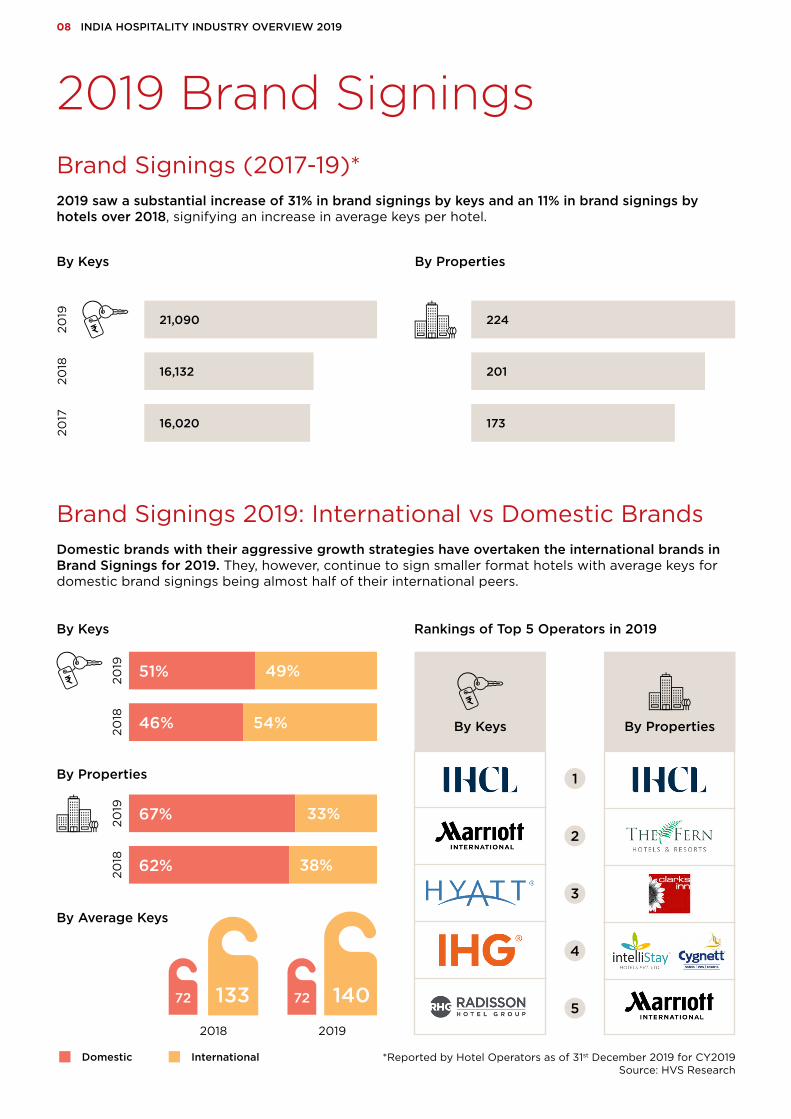
2019 Brand SigningsBrand Signings (2017-19)*2019 saw a substantial increase of 31% in brand signings by keys and an 11% in brand signings by hotels over 2018, signifying an increase in average keys per hotel.
2018
2019
By PropertiesBy Keys
224
201
173
2017
21,090
16,132
16,020
Brand Signings 2019: International vs Domestic BrandsDomestic brands with their aggressive growth strategies have overtaken the international brands in Brand Signings for 2019. They, however, continue to sign smaller format hotels with average keys for domestic brand signings being almost half of their international peers.
*Reported by Hotel Operators as of 31st December 2019 for CY2019Source: HVS Research
Domestic International
By Average Keys
Rankings of Top 5 Operators in 2019
By Properties
1
2
3
4
5
By Keys
08 INDIA HOSPITALITY INDUSTRY OVERVIEW 2019
By Properties
By Keys
51% 49%
2019
46% 54%
2018
67% 33%
2019
62% 38%
2018
20192018
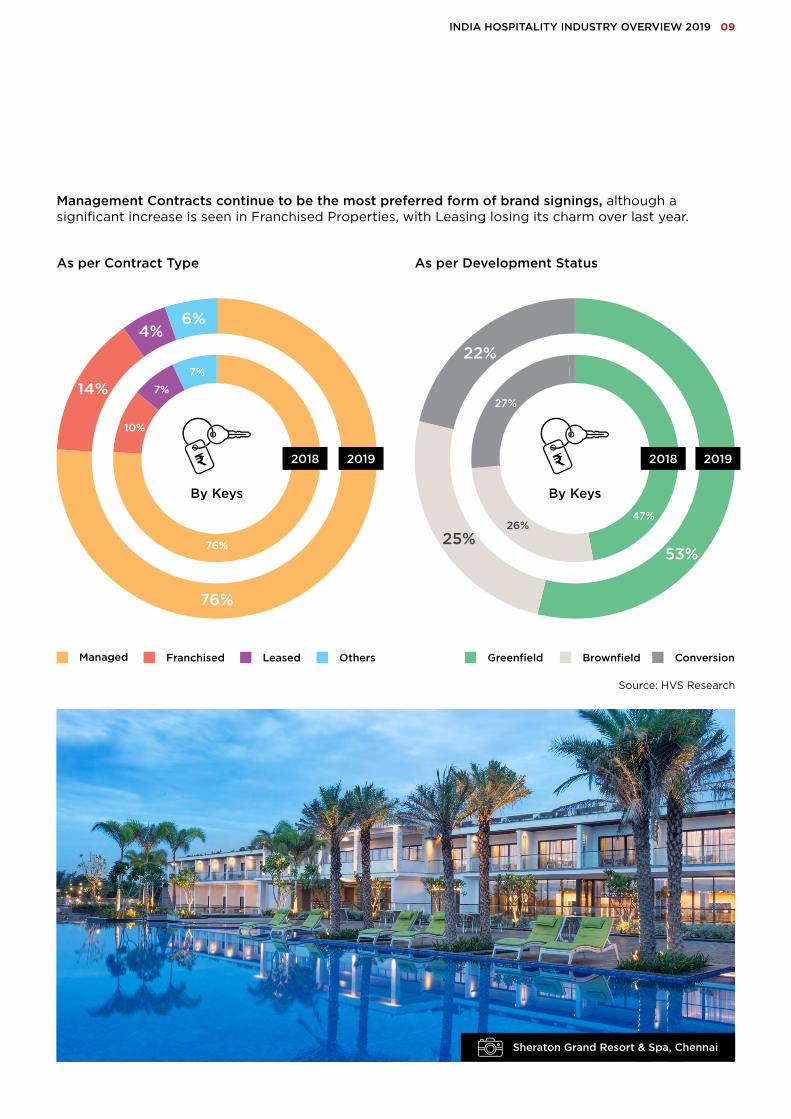
Management Contracts continue to be the most preferred form of brand signings, although a significant increase is seen in Franchised Properties, with Leasing losing its charm over last year.
As per Contract Type As per Development Status
Source: HVS Research
Sheraton Grand Resort & Spa, Chennai
Others
76%
6%4%
14%
53%
22%
25%
INDIA HOSPITALITY INDUSTRY OVERVIEW 2019 09
7%
7%
10%
By Keys
76%
2018 2019
26%47%
27%
2018 2019
By Keys
Managed Franchised Leased ConversionGreenfield Brownfield
Howard Johnson, Bengaluru
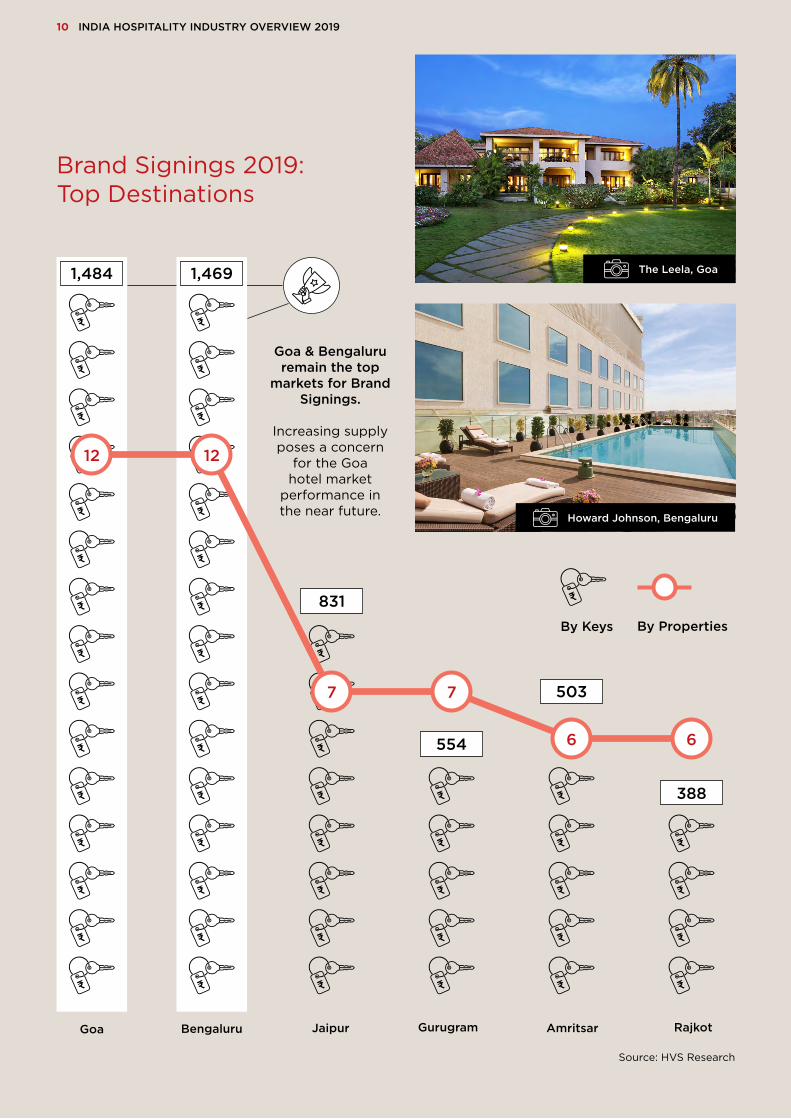
The Leela, Goa1,4691,484
6
Brand Signings 2019: Top Destinations
Goa GurugramBengaluru Jaipur Amritsar Rajkot
12
Source: HVS Research
554
388
12
7 7
6
By PropertiesBy Keys
Goa & Bengalururemain the top
markets for Brand Signings.
Increasing supply poses a concern
for the Goa hotel market
performance in the near future.
10 INDIA HOSPITALITY INDUSTRY OVERVIEW 2019
831
503
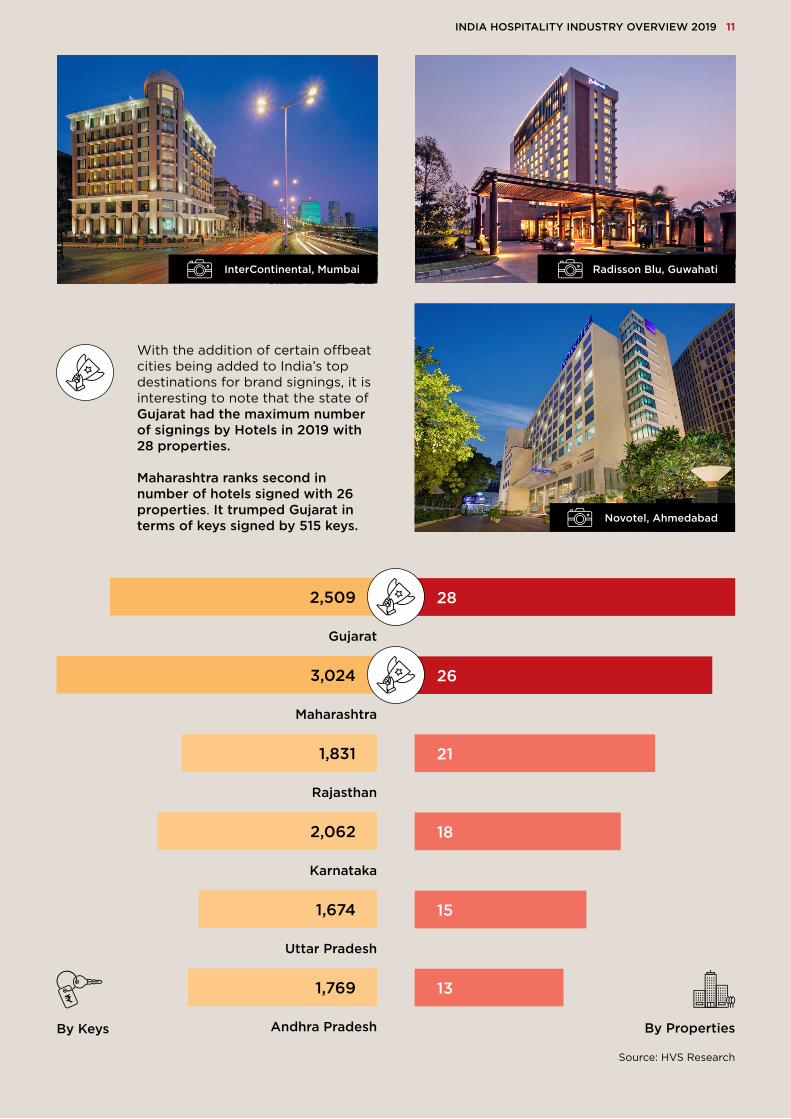
2,509
3,024
1,831
2,062
1,674
1,769
Source: HVS Research
28
26
21
18
15
13
Gujarat
Maharashtra
Rajasthan
Karnataka
Uttar Pradesh
Andhra Pradesh By Properties
INDIA HOSPITALITY INDUSTRY OVERVIEW 2019 11
With the addition of certain offbeat cities being added to India’s top destinations for brand signings, it is interesting to note that the state of Gujarat had the maximum number of signings by Hotels in 2019 with 28 properties.
Maharashtra ranks second in number of hotels signed with 26 properties. It trumped Gujarat in terms of keys signed by 515 keys. Novotel, Ahmedabad
Radisson Blu, GuwahatiInterContinental, Mumbai
By Keys
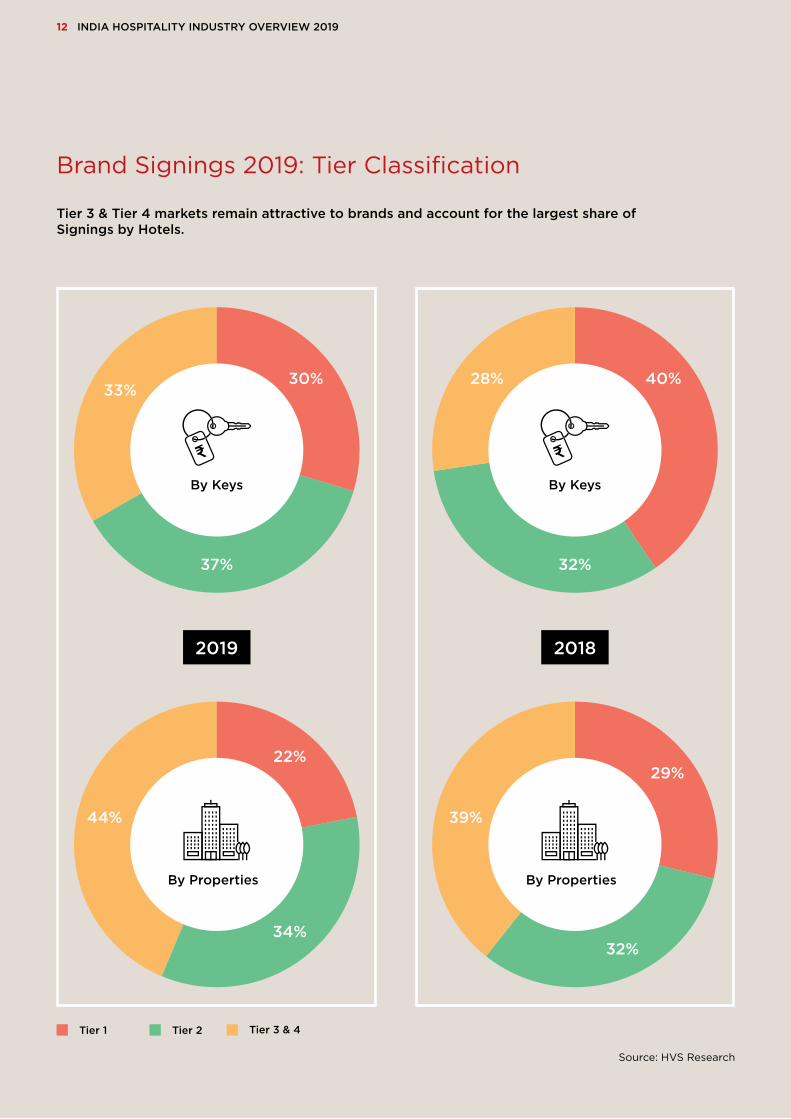
37%
30%33%
By Keys
Brand Signings 2019: Tier Classification
Tier 3 & Tier 4 markets remain attractive to brands and account for the largest share ofSignings by Hotels.
Tier 3 & 4Tier 1 Tier 2
Source: HVS Research
12 INDIA HOSPITALITY INDUSTRY OVERVIEW 2019
32%
40%28%
By Keys
20182019
34%
22%
44%
By Properties By Properties
32%
29%
39%
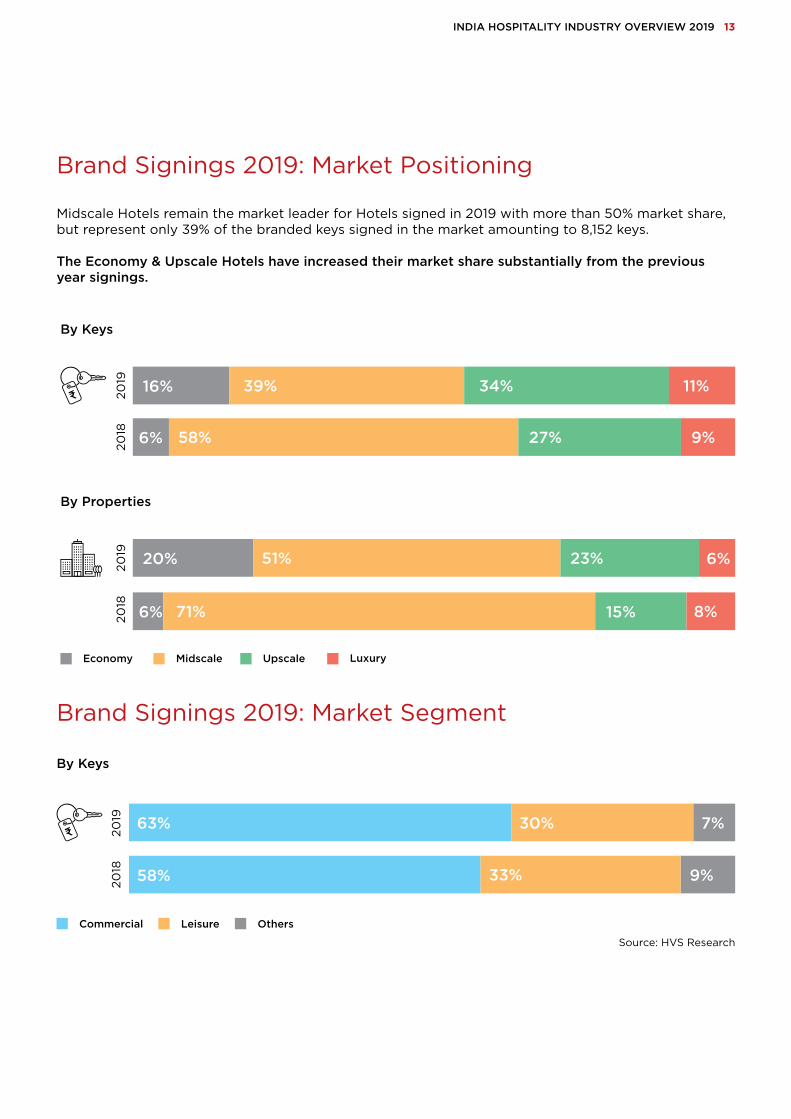
Brand Signings 2019: Market Positioning
Midscale Hotels remain the market leader for Hotels signed in 2019 with more than 50% market share, but represent only 39% of the branded keys signed in the market amounting to 8,152 keys.
The Economy & Upscale Hotels have increased their market share substantially from the previous year signings.
INDIA HOSPITALITY INDUSTRY OVERVIEW 2019 13
Source: HVS Research
7%
9%
Brand Signings 2019: Market Segment
By Keys
Commercial Leisure
63% 30%
Others
58% 33%
2019
2018
By Keys
2019
2018
20% 51%
Economy Midscale LuxuryUpscale
By Properties
2019
2018
23% 6%
16% 39% 34% 11%
6% 58% 27% 9%
6% 71% 15% 8%
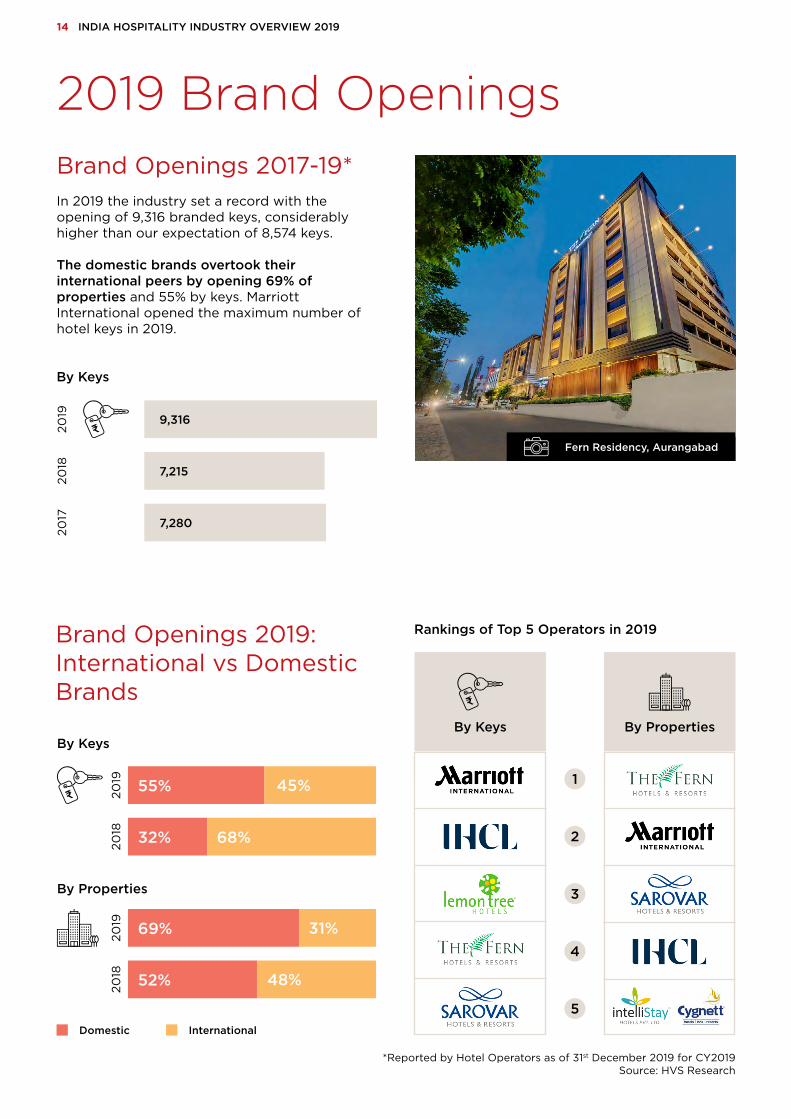
2019 Brand OpeningsBrand Openings 2017-19*In 2019 the industry set a record with the opening of 9,316 branded keys, considerably higher than our expectation of 8,574 keys.
The domestic brands overtook their international peers by opening 69% of properties and 55% by keys. Marriott International opened the maximum number of hotel keys in 2019.
2018
2019
By Keys
2017
9,316
7,215
7,280
Brand Openings 2019: International vs DomesticBrands
Rankings of Top 5 Operators in 2019
By Properties
1
2
3
4
5
By Keys
14 INDIA HOSPITALITY INDUSTRY OVERVIEW 2019
Domestic International
By Properties
By Keys
55% 45%
2019
32% 68%
2018
69% 31%
2019
52% 48%
2018
Fern Residency, Aurangabad
*Reported by Hotel Operators as of 31st December 2019 for CY2019Source: HVS Research
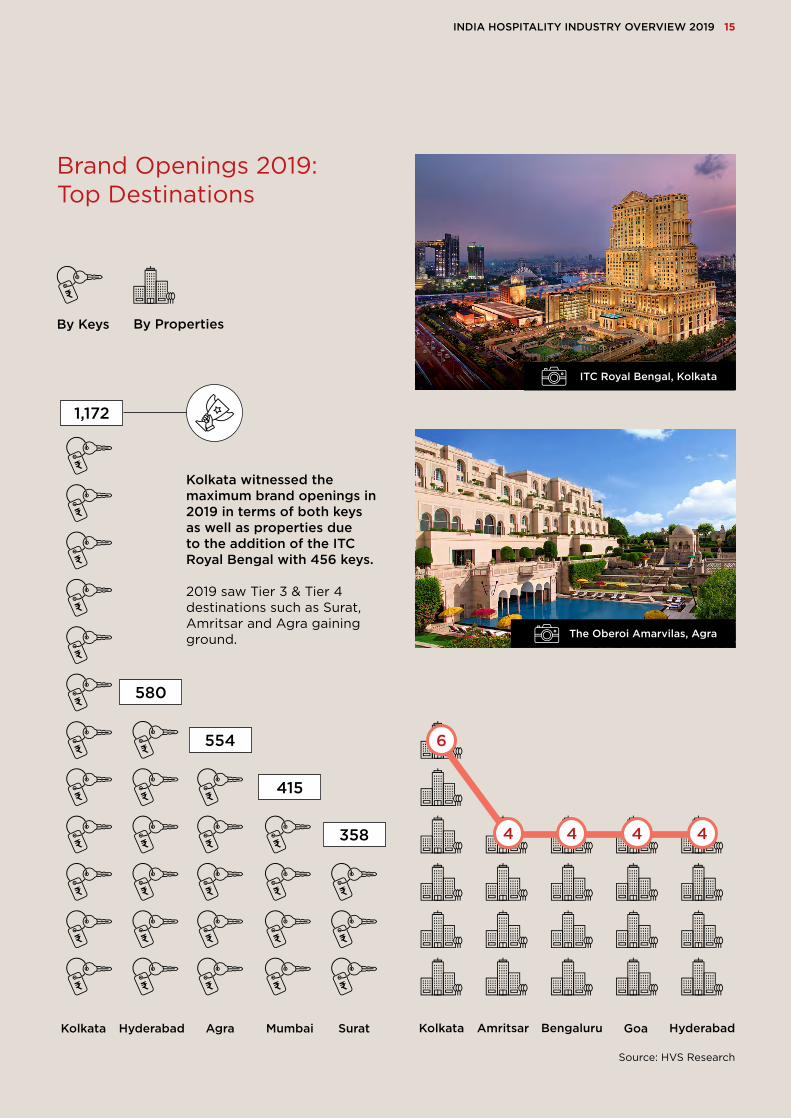
358
415
ITC Royal Bengal, Kolkata
Brand Openings 2019:Top Destinations
Source: HVS Research
Kolkata MumbaiHyderabad
1,172
Agra Surat
580
Kolkata witnessed the maximum brand openings in 2019 in terms of both keys as well as properties due to the addition of the ITC Royal Bengal with 456 keys.
2019 saw Tier 3 & Tier 4 destinations such as Surat, Amritsar and Agra gaining ground.
Bengaluru Goa
4
Amritsar
INDIA HOSPITALITY INDUSTRY OVERVIEW 2019 15
Kolkata Hyderabad
By PropertiesBy Keys
4 4 4
6554
The Oberoi Amarvilas, Agra

Hotel InvestmentsThe year set a record for hotel transactions in the country. Hotel transactions reached₹4,937 Cr (USD 690 Mn) during the year compared to ₹535 Cr in 2018 & the previous high of ₹1,992 Cr in 2015.
Performance of Key Hotel Stocks in Equity Markets
16 INDIA HOSPITALITY INDUSTRY OVERVIEW 2019
Source: HVS Research
₹1,992 CrUSD 306 Mn
2007 20192015
Last Peak
₹4,937 CrUSD 690 Mn
₹686 CrUSD 170 Mn
2019 witnessed two key M&A activities: - Brookfield acquisition of Hotel Leelaventure (value ₹3,950 Cr)- Lemon Tree Hotels’ acquisition of the Keys Hotels portfolio (value ₹600 Cr)
2019 witnessed two key listings on the stock exchange:
- Chalet Hotels IPO in January 2019 raised ₹1,641 Cr and was subscribed 1.57 times- Successful listing of the 1st REIT by Embassy and Blackstone also included hotel assets
Source: BSE*Data as on 7th February 2020
Market Cap (₹Cr)*
16,679.4
IHCL
8,159.2
EIH
6,988.2
Chalet
4,282.1
Lemon Tree Hotels
3,058.4
Mahindra Holidays & Resorts India Ltd.
Quarterly EPS
ChaletIHCL EIH
Lemon Tree Hotels Mahindra Holidays & Resorts India Ltd.
Dec 18
2.0
1.5
1.0
0.5
0
-0.5
Mar 19 Jun 19 Sep 19 Dec 19
Hotel Transaction Volumes
The Oberoi Gurugram
2020 Outlook
INDIA HOSPITALITY INDUSTRY OVERVIEW 2019 17
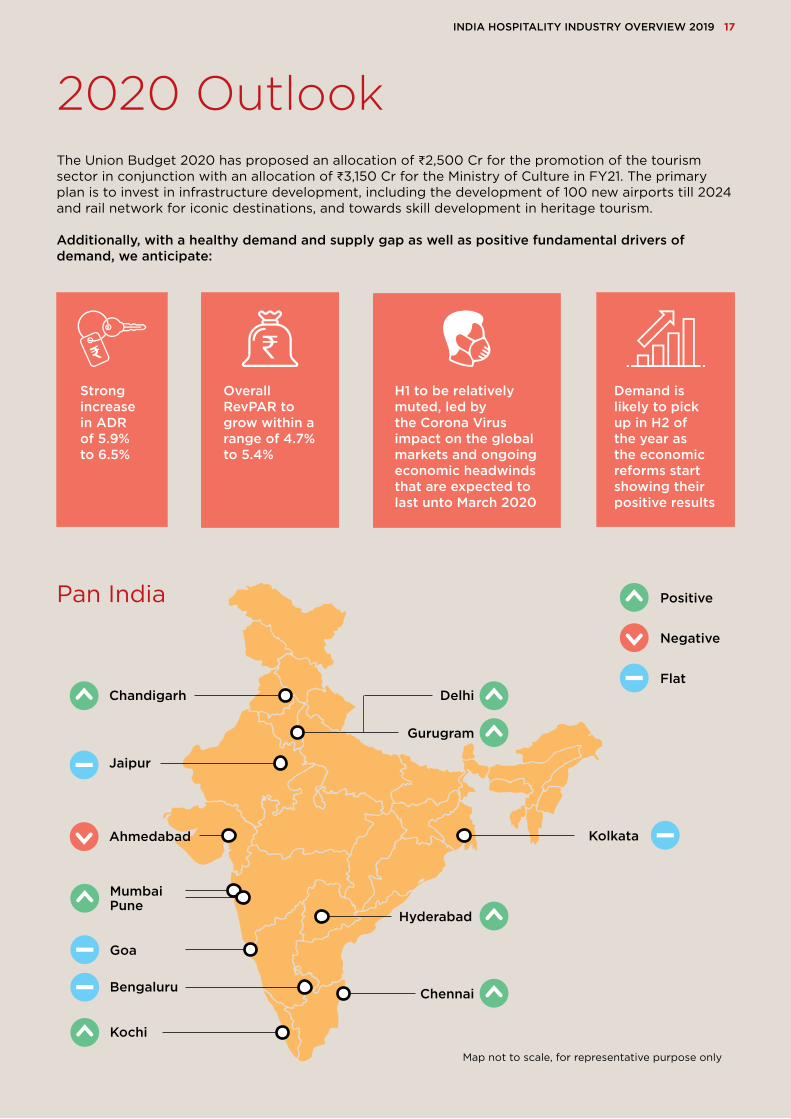
The Union Budget 2020 has proposed an allocation of ₹2,500 Cr for the promotion of the tourism sector in conjunction with an allocation of ₹3,150 Cr for the Ministry of Culture in FY21. The primary plan is to invest in infrastructure development, including the development of 100 new airports till 2024 and rail network for iconic destinations, and towards skill development in heritage tourism.
Additionally, with a healthy demand and supply gap as well as positive fundamental drivers of demand, we anticipate:
Map not to scale, for representative purpose only
Mumbai
Positive
Negative
Flat
Chennai
Gurugram
Delhi
Bengaluru
Goa
HyderabadPune
KolkataAhmedabad
Jaipur
Chandigarh
Strong increase in ADR of 5.9% to 6.5%
Overall RevPAR to grow within a range of 4.7% to 5.4%
H1 to be relatively muted, led by the Corona Virus impact on the global markets and ongoingeconomic headwinds that are expected to last unto March 2020
Demand is likely to pick up in H2 of the year as the economic reforms start showing their positive results
Kochi
Pan India
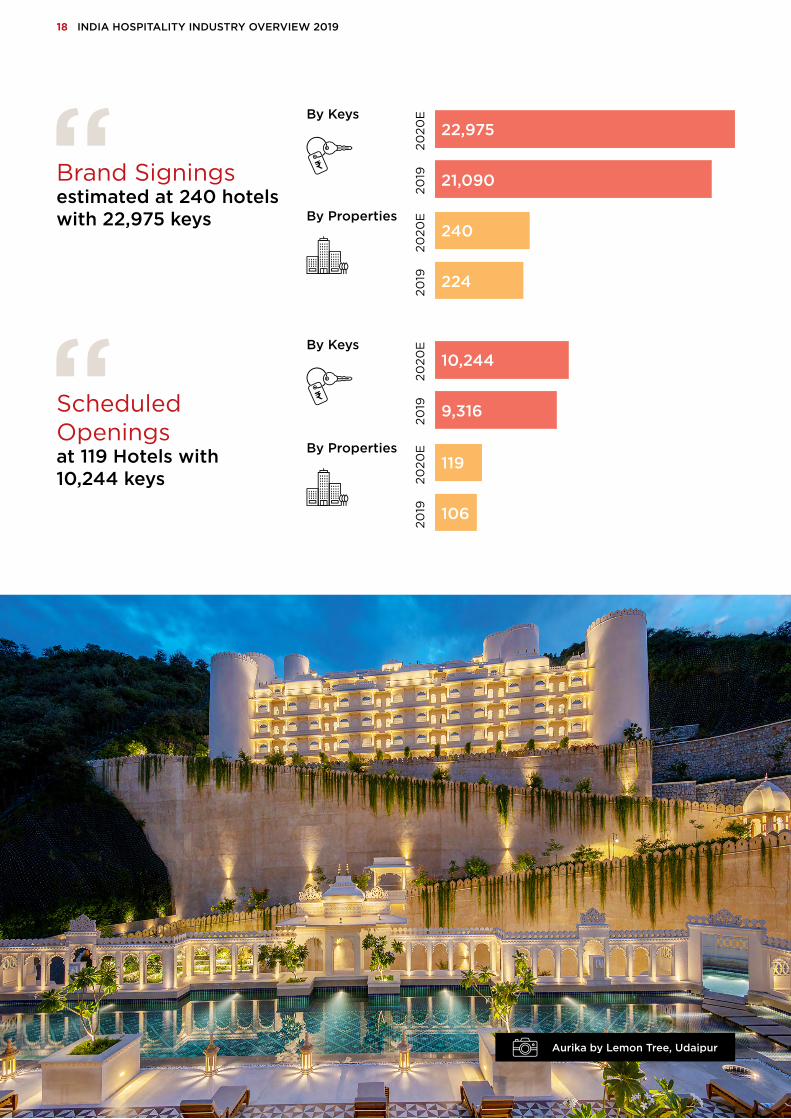
Aurika by Lemon Tree, Udaipur
18 INDIA HOSPITALITY INDUSTRY OVERVIEW 2019
Brand Signingsestimated at 240 hotels with 22,975 keys By Properties
By Keys
2020
E20
1920
20E
2019
22,975
21,090
240
224
Scheduled Openingsat 119 Hotels with10,244 keys
By Properties
By Keys
2020
E20
1920
20E
2019
10,244
9,316
119
106
INDIA HOSPITALITY INDUSTRY OVERVIEW 2019 19
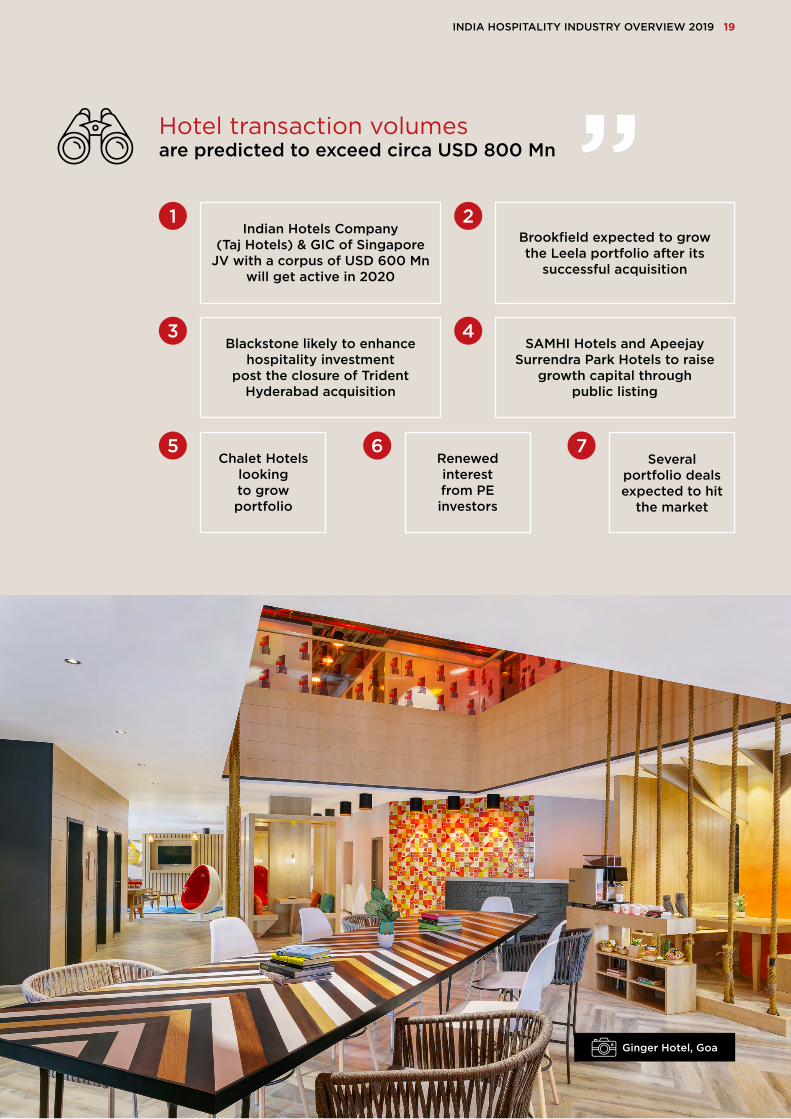
Hotel transaction volumesare predicted to exceed circa USD 800 Mn
Ginger Hotel, Goa
1 2Indian Hotels Company
(Taj Hotels) & GIC of Singapore JV with a corpus of USD 600 Mn
will get active in 2020
Brookfield expected to grow the Leela portfolio after its
successful acquisition
3 4Blackstone likely to enhance
hospitality investment post the closure of Trident
Hyderabad acquisition
SAMHI Hotels and Apeejay Surrendra Park Hotels to raise
growth capital throughpublic listing
Chalet Hotels looking to grow portfolio
Renewed interest from PE investors
Severalportfolio deals expected to hit
the market
5 6 7
© 2020 HVS ANAROCK Hotel Advisory Services Pvt. Ltd. All rights reserved.
Disclaimer: All information in this report is provided solely for internal circulation and reference purposes. HVS ANAROCK makes no statement, representation, warranty or guarantee as to the accuracy, reliability or timeliness of the information provided. No part of this report may be reproduced, distributed, or transmitted in any form or by any means, including photocopying, recording, or other electronic or mechanical methods without the expressed written consent of the organisation. STR republication or other re-use of this data without the express written permission of STR is strictly prohibited.
Superior results through unrivalled hospitality intelligence. Everywhere.HVS is the only global consulting firm focused exclusively on the hospitality industry. We provide comprehensive solutions through our single – minded focus; helping you succeed in the complex hospitality area through our global reach and in depth understanding of the local market. HVS has over 50+ offices in 5 continents, with 300+ industry specialists having delivered 60,000+ assignments in over 6,000+ markets.
ANAROCK is India’s leading independent real estate services company with a presence across India and the Middle East. The Chairman, Mr. Anuj Puri, is a highly respected industry veteran and India’s most prominent real estate thought leader. The Company has diversified interests across the real estate lifecycle and deploys its proprietary technology platform to accelerate marketing and sales. ANAROCK’s services include Residential Broking and Technology, Retail, Commercial, Investment Banking, Hospitality (via HVS ANAROCK), Land Services, Warehousing and Logistics, Investment Management, Research and Strategic Advisory & Valuations.
The Company has a unique business model, which is an amalgamation of traditional product sales supported by a modern technology platform with automated analytical and reporting tools. This offers timely solutions to its clients, while delivering financially favourable and efficient results.
ANAROCK has a team of over 2,000 certified and experienced real estate professionals who operate across all major Indian (Mumbai, Navi Mumbai, Pune, Ahmedabad, NCR – Delhi, Gurugram, Noida, Ghaziabad, Chennai, Bengaluru, Hyderabad, Kolkata, Lucknow) and GCC markets, and within a period of two years, has successfully completed over 300 exclusive project mandates. ANAROCK also manages over 80,000 established channel partners to ensure global business coverage.
Our assurance of consistent ethical dealing with clients and partners reflects our motto - Values Over Value.
Our Services
Brokerage & Transaction Advisory
Consulting & Valuation
Asset Management
Executive Search
HVS ANAROCK Hotel Advisory Services Pvt. Ltd.
GURUGRAM
Level 7, Tower BBuilding No. 9 DLF Cyber City, Phase IIIGurugram 122 002
+91 124 488 5580
MUMBAI
1002, 10th Floor, B WingONE BKC, Plot No. C-66, G BlockBandra Kurla Complex, Bandra (E)Mumbai 400 051
+91 22 4293 4293
Key Contributors
Mandeep S. LambaPresident(South Asia)
Akash DattaSr. Vice President(South Asia) Consulting & [email protected]
Ajay MehtaniSr. Vice President(South Asia) Asset Management & Executive [email protected]
Dipti MohanSenior Manager [email protected]
Surbhi GargAsst. Manager Consulting & [email protected]
Dr. Paridhi GuptaAsst. Vice PresidentDesign, ANAROCK [email protected]
hvs.com | anarock.com