HVS Market Feasibility Study - City of Modesto
131
FEASIBILITY STUDY Proposed Convention Center Hotel MODESTO, CALIFORNIA SUBMITTED TO : PREPARED BY: Ms. Laurie Smith HVS Convention, Sports & Entertainment City of Modesto Facilities Consulting 1010 10th Street, Suite 4400 205 West Randolph, Suite 1650 Modesto, California, 95353 Chicago, Illinois 60606 +1 (209) 577-5347 +1 (312) 587-9900 [email protected] October 1, HVS
Transcript of HVS Market Feasibility Study - City of Modesto
FEASIBILITY STUDY
Proposed Convention Center Hotel MODESTO, CALIFORNIA
SUBMITTED TO : PREPARED BY:
Ms. Laurie Smith HVS Convention, Sports & Entertainment City of Modesto Facilities Consulting 1010 10th Street, Suite 4400 205 West Randolph, Suite 1650 Modesto, California, 95353 Chicago, Illinois 60606 +1 (209) 577-5347 +1 (312) 587-9900 [email protected]
October 1,
HVS
January 22, 2019
Ms. Laurie Smith City of Modesto 1010 10th Street, Suite 4400 Modesto, California, 95353
Re: Proposed Convention Center Hotel
Modesto, California
Dear Ms. Smith:
Attached you will find our Feasibility Study of the Proposed Convention Center Hotel in Modesto, California.
We certify that we have no undisclosed interest in the property, and our employment and compensation are not contingent upon our findings. This study is subject to the comments made throughout this report and to all assumptions and limiting conditions set forth herein.
It has been a pleasure working with you. Please let us know if you have any questions.
Sincerely,
HVS Convention, Sports & Entertainment
Facilities Consulting
Tom Hazinski
Managing Director
Brian Harris
Senior Director
205 West Randolph
Suite 1650
Chicago, Illinois 60606
+1 312-587-9900
+1 312-488-3631 FAX
www.hvs.com
Atlanta
Boston
Boulder
Chicago
Dallas
Denver
Las Vegas
México City
Miami
Nassau
New York
Newport
San Francisco
Toronto
Vancouver
Washington
Athens
Buenos Aires
Dubai
Hong Kong
Lima
London
Madrid
Mumbai
New Delhi
Sao Paulo
Shanghai
Singapore

Table of Contents
SECTION TITLE
1. Executive Summary 1-1
2. Description of Site and Proposed Hotel 2-1
3. Modesto Market Overview 3-1
4. Supply and Demand Analysis 4-1
5. Modesto Centre Plaza Demand Analysis 5-1
6. Projection of Occupancy and Average Rate 6-1
7. Projection of Income and Expenses 7-1
8. Proposed Hotel Feasibility Analysis 8-1
9. Economic Impact 9-1
10. Public Private Partnerships 10-1
11. Statement of Assumptions and Limiting Conditions 11-1
12. Certification 12-1

January 22, 2019 Executive Summary Proposed Convention Center Hotel - Modesto, California 1-1
1. Executive Summary
The City of Modesto (the “City”) engaged HVS Convention, Sports, and Entertainment Facilities Consulting (“HVS”) to conduct a Feasibility Study of a Proposed Hotel (“Proposed Hotel”) connected to the Modesto Centre Plaza (“MCP”). The site for the Proposed Hotel is in downtown Modesto, California.
For this study, HVS analyzed the development of 1) a full-service hotel with banquet and meeting space, restaurant and lounge, and 2) a select-service hotel with minimal function space and limited food service. Based on a preliminary analysis, we concluded that the select-service hotel option is more likely to be feasible. Consequently, this report primarily focuses the analysis on the performance of a select-service hotel. Select-service properties typically do not contain extensive meeting, recreational, and retail facilities. But, recent developments in the building programs of select service hotels have blurred the distinction between full-service and select-service brands. Larger dining and lounge facilites have been added to some select-service brands along with improved bedding, furnishings, public spaces, and bathrooms. The primary remaining distinctions are the amounts of function space and customer services such as concierge, valet, and room services that hotel brands required in a full-sevice product.
HVS assumes the Proposed Hotel will open on January 1, 2021, as a 200-room select-service hotel, featuring a restaurant, lounge, 3,800 square feet of meeting space, outdoor pool, outdoor whirlpool, fitness center, business center, gift shop, and guest laundry room. The hotel would also include the appropriate back-of-the-house space necessary to support hotel operations. Parking would be provided in a nearby public parking garage. The operator of the garage would retain all associated parking revenues except for the premium component of any valet parking operated by the Proposed Hotel.
The Proposed Hotel would attract the commercial, meeting and group, and leisure market segments because of the national brand affiliation, downtown locations, and proximity to the MCP. Hotel guests would include value seeking independent travelers who are willing to pay a higher rate for a new product, groups that negotiate lower group rates for large room blocks and banquet space, and more price-sensitive leisure travelers that seek discounted room rates offered on shoulder days and weekends.
Subject of the Feasibility Study

January 22, 2019 Executive Summary Proposed Convention Center Hotel - Modesto, California 1-2
This study employs the methodology illustrated in Figure 1-1.
FIGURE 1-1 HOTEL FEASIBILITY STUDY METHODOLOGY
Research Potential
Competitive Hotels
Feasibility Analysis using
Discounted Cash Flows
Comparable Hotel
Operating Data
Proposed Hotel Market
Penetration
Occupancy and ADR
Forecasts by Market
Segment
Estimate of Proposed
Hotel Financial
Operations
Market ADR and
Occupancy Estimates
Inflation and Market
Growth Assumptions
Economic Indicators
Competitive Set Analysis
Induced Demand
Unaccommodated
Demand
Room Supply Changes
HVS 1) analyzed the historical performance of a competitive set of hotels, 2) estimated the amounts of induced and unaccommodated demand in the market, and 3) researched potential changes in room supply. Based on these hotel market trends and economic and demographic indicators of future changes in hotel demand, HVS projected the future performance of a competitive set of hotel properties. Through a market penetration analysis, we estimated the average daily room rate and occupancy of the Proposed Hotel in each of the three market segments—commercial, leisure, and meeting and group. An estimate of average daily room rates and occupancies generates a projection of room revenues, which,
Methodology

January 22, 2019 Executive Summary Proposed Convention Center Hotel - Modesto, California 1-3
when combined with the operating data on comparable hotels, yields a ten-year estimate of financial operations. The feasibility analysis of this study converts the net income from the 10-year pro forma and assumed sale of the hotel after ten years of operation into a net present value at opening based on the assumptions set-forth for the debt and equity components of the financing.
The methodology used to develop this study is based on market research and valuation techniques set forth in the textbooks authored by Hospitality Valuation Services for the American Institute of Real Estate Appraisers and the Appraisal Institute, entitled The Valuation of Hotels and Motels,1 Hotels, Motels and Restaurants: Valuations and Market Studies,2 The Computerized Income Approach to Hotel/Motel Market Studies and Valuations,3 Hotels and Motels: A Guide to Market Analysis, Investment Analysis, and Valuations,4 and Hotels and Motels – Valuations and Market Studies.5 All information was collected and analyzed by the staff of HVS Convention, Sports & Entertainment Facilities Consulting.
The effective date of the study is January 22, 2019. Tom Hazinski and Brian Harris inspected the site for the Proposed Hotel on October 23, 2018. All projections are expressed in inflated dollars.
The approximate 1.50-acre site for the Proposed Hotel is located in downtown Modesto adjacent to the MCP. The site is currently a surface parking lot for the MCP. The developer selected by the City will purchase at market value, all or a portion of the available site, which is currently a public surface parking lot. See page 2-1 for a more thorough description of the site.
The hotel ownership structure has not been determined as of the date of this study, except to rule out any public ownership or financing.
The management agreement will need to be negotiated after a development plan for the Proposed Hotel has been finalized with the selected developer. We have included a market appropriate management fee of 3.0% of gross operating
1 Stephen Rushmore, The Valuation of Hotels and Motels. (Chicago: American Institute of
Real Estate Appraisers, 1978). 2 Stephen Rushmore, Hotels, Motels and Restaurants: Valuations and Market Studies.
(Chicago: American Institute of Real Estate Appraisers, 1983). 3 Stephen Rushmore, The Computerized Income Approach to Hotel/Motel Market Studies and
Valuations. (Chicago: American Institute of Real Estate Appraisers, 1990). 4 Stephen Rushmore, Hotels and Motels: A Guide to Market Analysis, Investment
Analysis, and Valuations (Chicago: Appraisal Institute, 1992). 5 Stephen Rushmore and Erich Baum, Hotels and Motels – Valuations and Market Studies.
(Chicago: Appraisal Institute, 2001).
Pertinent Dates
Site
Ownership and Management

January 22, 2019 Executive Summary Proposed Convention Center Hotel - Modesto, California 1-4
revenues. Other charges related to the future hotel’s brand affiliation, such as frequent guest programs, are reflected in the appropriate departmental expenses, consistent with the Uniform System of Accounts for the Lodging Industry (“USALI”).
We recommend that the Proposed Hotel operates as an upper-upscale, select-service hotel. While we have placed heavy consideration on the Hilton Garden Inn or Courtyard by Marriott brands, a specific franchise affiliation would be determined as part of a future hotel project. Our projections reflect a Hilton, Marriott or similar brand affiliation. We assume that the Proposed Hotel will obtain a brand from a national brand and will retain its brand affiliation throughout the 10-year holding period. Inherent in this assumption is the expectation that the property will be operated in accordance with brand standards, including requirements for services and cleanliness; that the hotel will be maintained in good condition, with all building systems in good working order; and that any necessary refurbishments or renovations will be completed in a timely manner and in accordance with the requirements of the brand.
HVS analyzed the performance of a set of hotels that would compete with the Proposed Hotel (“Competitive Hotels” see page 4-4, Figure 4-2). Based on an evaluation of the occupancy, rate structure, market orientation, location, facilities, amenities, reputation, and quality, as well as the comments of management representatives, we have identified four properties that would compete with the Proposed Hotel on a primary basis, and eight properties that would compete on a secondary basis, for a total of 12 competitors. Due to location, brand quality, and service levels, primary competitors vie for the same customers and are 100 percent competitive with the Proposed Hotel. Secondary competitors have partially overlapping customer bases and their competitiveness with the Proposed Hotel is weighted at less than 100 percent. Section 4 of this study, Supply and Demand Analysis, provides a detailed discussion of the weighting of the secondary competitors.
Figure 1-2 provides a long-term perspective on the supply and demand trends of the Competitive Hotels, with data provided by Smith Travel Research (“STR”). STR is an independent research firm that compiles proprietary data on the lodging industry.
Summary of Hotel Market Trends

January 22, 2019 Executive Summary Proposed Convention Center Hotel - Modesto, California 1-5
FIGURE 1-2 HISTORICAL COMPETITIVE HOTELS ADR, OCCUPANCY, AND REVPAR TRENDS
0%
10%
20%
30%
40%
50%
60%
70%
80%
90%
100%
$0
$20
$40
$60
$80
$100
$120
$140
2008 2009 2010 2011 2012 2013 2014 2015 2016 2017
ADR RevPAR Occupancy
Source: STR
Average daily room rate (“ADR”) is the annual revenue of the hotel divided by the number of occupied room nights. Occupancy is a percentage calculated by dividing the annual number of occupied room nights by the annual number of available room nights. Revenue per available room, (“RevPAR”) is a common hotel industry metric, calculated by multiplying the occupancy rate by ADR and provides a combined measure of rate and occupancy.
In 2017, the ADR of Competitive Hotels increased by 5.1% and occupancy increased by 0.9%, causing RevPAR to increase by 6.0%. Demand grew by 5.6% in 2017. This increase was partially offset by an increase in available room nights with the opening of the 85-room Hampton Inn Turlock of 4.7%, causing the occupancy rate to rise to 77.7%.

January 22, 2019 Executive Summary Proposed Convention Center Hotel - Modesto, California 1-6
Figure 1-3 reflects HVS’s estimates of operating data of the Competitive Hotels for the years 2015 through 2017. Description of the Competitive Hotels is provided on page 4-3.
FIGURE 1-3 WEIGHTED HISTORICAL SUPPLY, DEMAND, OCCUPANCY, ADR, & REVPAR
(2015 - 2017)
YearRoom Nights
Available
Room Nights
Sold
Competitive
Hotels
Occupancy
Competitive
Hotels ADR
Competitive
Hotels RevPAR
Amount
2015 385,000 293,000 76.1% $116.89 $88.96
2016 393,000 304,000 77.4% $126.22 $97.64
2017 410,000 320,000 78.0% $131.84 $102.90
Percent Change
2016 2.1% 3.8% 1.6% 8.0% 9.8%
2017 4.3% 5.3% 0.9% 4.4% 5.4%
Since 2015, accommodated room nights increased by 9.2%, while the number of available room nights increased by 6.5%. As a result, market occupancy increased 2.6% during the same period. Average daily room rate grew 12.8% since 2015. The combined effect of changes in occupancy and ADR caused RevPAR to grow 15.7% over the three-year period analyzed here. The Competitive Hotels have shown strong growth in demand with occupancy rates rising despite the increase in supply from the opening of the Hampton Inn Turlock.
HVS analyzed changes in the Competitive Hotels over the last 12 months as reported to STR.
Monthly Room Night Demand

January 22, 2019 Executive Summary Proposed Convention Center Hotel - Modesto, California 1-7
FIGURE 1-4 UNWEIGHTED HISTORICAL 12 MONTH COMPETITIVE DEMAND TRENDS
MonthOccupied
Room Nights Prior Year Difference
Oct-17 32,352 31,533 819 2.6%
Nov-17 28,532 28,477 55 0.2%
Dec-17 25,597 24,497 1,100 4.5%
Jan-18 27,240 26,776 464 1.7%
Feb-18 26,975 27,204 -229 -0.8%
Mar-18 31,037 31,171 -134 -0.4%
Apr-18 31,033 28,179 2,854 10.1%
May-18 32,827 32,181 646 2.0%
Jun-18 32,385 31,867 518 1.6%
Jul -18 31,113 32,163 -1,050 -3.3%
Aug-18 32,230 33,244 -1,014 -3.1%
Sep-18 31,380 31,590 -210 -0.7%
12 Month Total 362,701 358,882 3,819 1.1%
Change in Demand
Source: STR
Demand within the competitive set showed growth of 1.1% over the last 12 months. Interviews with four hotel managers indicate that the high occupancy rate constrained demand growth during spring, summer and weekend days due to a lack of available rooms to meet demand.
To forecast the occupancy of the Proposed Hotel, HVS performed a market penetration analysis of three market segments, commercial, meeting and group, and leisure. The purpose of segmenting the lodging market is to define each major type of demand, identify customer characteristics, and estimate future growth trends. HVS divided demand into the three market segments based on the nature of travel. Figure 1-5 summarizes estimates of accommodated room night demand by market segment, assuming the Proposed Hotel begins operation on a calendar year starting January 1, 2021.
Summary of Forecast Occupancy and Average Rate

January 22, 2019 Executive Summary Proposed Convention Center Hotel - Modesto, California 1-8
FIGURE 1-5 PROPOSED HOTEL OCCUPANCY FORECAST
Calendar Year 2021 2022 2023 2024
Avai lable Room Nights 73,000 73,000 73,000 73,000
Absorption by Segment
Commercia l 25,500 27,000 28,200 28,200
Meeting and Group 6,200 8,100 9,300 9,300
Leisure 16,000 16,900 17,500 17,500
Total Absorption 47,700 52,000 55,000 55,000
Projected Occupancy 66% 71% 75% 75%
Percent Segmentation
Commercia l 53% 52% 51% 51%
Meeting and Group 13% 16% 17% 17%
Leisure 34% 33% 32% 32%
Figure 1-6 compares the projected occupancy of the Proposed Hotel with the Competitive Hotels for the first four years of operation.
FIGURE 1-6 COMPETITIVE HOTELS AND PROPOSED HOTEL OCCUPANCY FORECAST
0%
10%
20%
30%
40%
50%
60%
70%
80%
2021 2022 2023 2024
Competitive Hotels Proposed Hotel

January 22, 2019 Executive Summary Proposed Convention Center Hotel - Modesto, California 1-9
The Proposed Hotel would open on January 1, 2021, and for this analysis we assume would take three years to stabilize. Based on our analysis presented in chapter four, in a stabilized year of demand, the property could absorb room nights and achieve a stabilized occupancy level of 75%.
In positioning the ADR, we consider the ADR of Competitive Hotels as well as the location of the Proposed Hotel, its brand and quality, and its adjacency to the MCP. Figure 1-7 compares the estimated ADR of the Proposed Hotel with the ADR of Competitive Hotels during four calendar years starting January 1, 2021.
FIGURE 1-7 COMPETITIVE HOTELS & PROPOSED HOTEL AVERAGE RATE FORECAST
$0
$20
$40
$60
$80
$100
$120
$140
$160
$180
$200
2021 2022 2023 2024
Competitive Hotels Proposed Hotel
We positioned the ADR in the base year 2017 at an average rate of $145.46. This rate would grow with inflation and in proportion to the rate of growth in the competitive set. The positioned ADR is further discounted by 3.0% in 2021 and 1.0% in 2022 to reflect typical management practices during the years before the hotel stabilizes in the market.
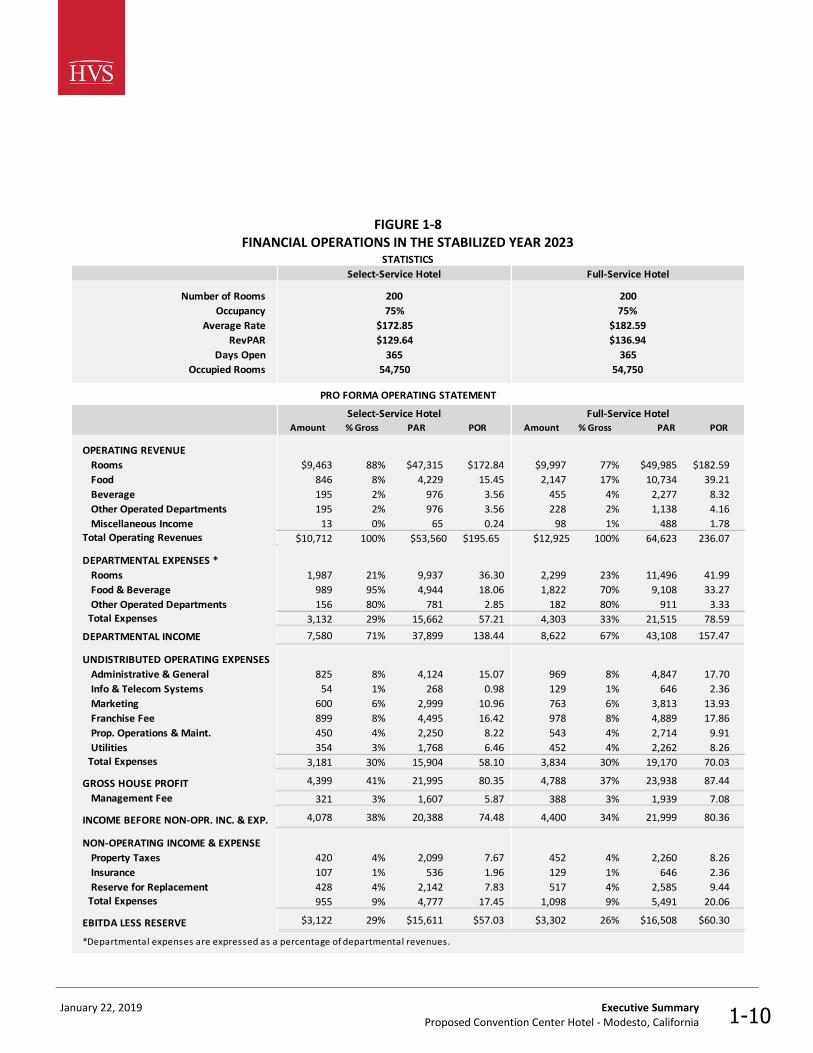
HVS supports its estimates of revenue and expense levels using data on the operations of comparable hotels and factors specific to this market. Three common measures of hotel financial performance are 1) ratio to sales (“RTS”), 2) amounts per available room (“PAR”), and 3) amounts per occupied room night (“POR”) which are used to present the financial data. Figure 1-8 presents the HVS forecast of income and expense for a stabilized year of operation for the Proposed Hotel. HVS has also studied a full-service hotel, which is included for comparison purposes.
Summary of Forecast Income and Expense Statement
January 22, 2019 Executive Summary Proposed Convention Center Hotel - Modesto, California 1-10
FIGURE 1-8 FINANCIAL OPERATIONS IN THE STABILIZED YEAR 2023
STATISTICS
Select-Service Hotel Full-Service Hotel
Number of Rooms 200 200
Occupancy 75% 75%
Average Rate $172.85 $182.59
RevPAR $129.64 $136.94
Days Open 365 365
Occupied Rooms 54,750 54,750
PRO FORMA OPERATING STATEMENT
Select-Service Hotel Full-Service HotelAmount % Gross PAR POR Amount % Gross PAR POR
OPERATING REVENUE
Rooms $9,463 88% $47,315 $172.84 $9,997 77% $49,985 $182.59
Food 846 8% 4,229 15.45 2,147 17% 10,734 39.21
Beverage 195 2% 976 3.56 455 4% 2,277 8.32
Other Operated Departments 195 2% 976 3.56 228 2% 1,138 4.16
Miscellaneous Income 13 0% 65 0.24 98 1% 488 1.78Total Operating Revenues $10,712 100% $53,560 $195.65 $12,925 100% 64,623 236.07
DEPARTMENTAL EXPENSES *
Rooms 1,987 21% 9,937 36.30 2,299 23% 11,496 41.99
Food & Beverage 989 95% 4,944 18.06 1,822 70% 9,108 33.27
Other Operated Departments 156 80% 781 2.85 182 80% 911 3.33 Total Expenses 3,132 29% 15,662 57.21 4,303 33% 21,515 78.59
DEPARTMENTAL INCOME 7,580 71% 37,899 138.44 8,622 67% 43,108 157.47
UNDISTRIBUTED OPERATING EXPENSES
Administrative & General 825 8% 4,124 15.07 969 8% 4,847 17.70
Info & Telecom Systems 54 1% 268 0.98 129 1% 646 2.36
Marketing 600 6% 2,999 10.96 763 6% 3,813 13.93
Franchise Fee 899 8% 4,495 16.42 978 8% 4,889 17.86
Prop. Operations & Maint. 450 4% 2,250 8.22 543 4% 2,714 9.91
Utilities 354 3% 1,768 6.46 452 4% 2,262 8.26 Total Expenses 3,181 30% 15,904 58.10 3,834 30% 19,170 70.03
GROSS HOUSE PROFIT 4,399 41% 21,995 80.35 4,788 37% 23,938 87.44
Management Fee 321 3% 1,607 5.87 388 3% 1,939 7.08
INCOME BEFORE NON-OPR. INC. & EXP. 4,078 38% 20,388 74.48 4,400 34% 21,999 80.36
NON-OPERATING INCOME & EXPENSE
Property Taxes 420 4% 2,099 7.67 452 4% 2,260 8.26
Insurance 107 1% 536 1.96 129 1% 646 2.36
Reserve for Replacement 428 4% 2,142 7.83 517 4% 2,585 9.44 Total Expenses 955 9% 4,777 17.45 1,098 9% 5,491 20.06
EBITDA LESS RESERVE $3,122 29% $15,611 $57.03 $3,302 26% $16,508 $60.30
*Departmental expenses are expressed as a percentage of departmental revenues.

January 22, 2019 Executive Summary Proposed Convention Center Hotel - Modesto, California 1-11
A full-service hotel operation varies from a select-service operation in the following ways.
• Due to brand quality and a greater concentration of high rated commercial and meeting and group guests, a full-service hotel generates a higher ADR.
• Higher ADR and comparable levels of occupancy generate more rooms revenue.
• With larger amounts of function space, a full-service hotel generates more catering revenue.
• The ratio of rooms department expense to rooms revenue is higher due to service standards,
• The ratio of food and beverage department expenses to revenues is due because catering sales have better profit margins than the food outlets,
Given these considerations, a full-service hotel would generate approximately, $200,000 more in earnings before interest, tax, depreciation, and amortization (“EBITDA”) in a stabilized year of operation. Please refer to Section 8 of this study, Projection of Income and Expense, for a detailed explanation of the methodology used in deriving our forecast of financial operations.
In a stabilized year of operations, approximately $3.12 million would be available to pay debt service and provide a return on equity on a select-service hotel. If the full-service option was developed $3.3 million would be available to pay debt service and provide a return on equity. While the full-service hotel would generate more income, its capital costs would be substantially higher than a select-service hotel. Consequently, the full-service hotel would have a financing gap as explained in the following discussion.
We used a discounted cash flow analysis to estimate the present value of hotel net operating income using the assumptions shown in Figure 1-9.
Opinion of Net Present Value of the Proposed Hotel

January 22, 2019 Executive Summary Proposed Convention Center Hotel - Modesto, California 1-12
FIGURE 1-9 PRELIMINARY ESTIMATE OF VALUE
Select-Service
(Proposed Hotel)Full-Service
Loan/Value 65% 65%
Amortization 25 25Term 10 10
Interest Rate 5.0% 5.0%Terminal Cap Rate 8.5% 8.0%Transaction Costs 2.0% 2.0%
Equity Yields 16.0% 16.0%Tax Rate 1.086% 1.086%
Tax Inflation Rate 2.0% 2.0%
Value per room $186,000 $200,000
The financing assumptions for the Proposed Hotel reflect current credit market conditions for hotel financing. HVS relied on its survey of hotel transactions to determine debt–equity splits, yield requirements, and capitalization rates. The discounted cash flow analysis includes a calculation of a reversionary value of the hotel after ten-years of operations. The reversionary value is estimated by dividing the tenth year of operating income by a capitalization rate and subtracting transactions costs as if the hotel were sold. Due to the Proposed Hotel's California location and the higher property tax implications upon the hypothetical sale at the end of ten years, the terminal capitalization rate is loaded with the tax rate and applied to the net operating income estimate before property taxes.
The full-service hotel estimated value per room of $200,000 per room is $14,000 higher than the select-service hotel estimated value of $186,000 per room.
But the costs of construction of a full-service hotel are significantly higher than a select service property. Factors contributing to the higher cost per room for the full-service hotel option include,
• Larger ballroom and meeting space
• Larger and more upscale restaurant and lounge,
• Upgraded furnishing in the guest rooms and public spaces,
• Larger public spaces, and
• More expensive fit and finish to both the rooms and the public spaces.

January 22, 2019 Executive Summary Proposed Convention Center Hotel - Modesto, California 1-13
A 200-room select-service hotel would have a value of approximately $37.2 million or $186,000 per room. Development costs including land could range from $185,000 to $215,000 per room. Consequently, the funding gap could range from slightly above breakeven to $5.8 million. In the absence of a specific project plan, these estimates should be considered rough approximations of value and costs.
A 200-room full-service hotel would have a value of approximately $40.0 million or $200,000 per room. Development costs including land could range from $225,000 to $275,000 per room. Consequently, the funding gap could range from ($5.0) million to ($15.0) million. These cost estimates should be considered rough approximations.
The higher funding gap for the full-service hotel makes this option infeasible without a significant financial contribution by the City to the project. The select-service hotel is the preferred option for hotel development because it would:
• Require a significantly lower funding gap with the lower range of potential development costs slightly above breakeven,
• Provide the ability to offer two different hotel options to MCP users, the full-service DoubleTree Hotel and the select-service Proposed Hotel, and
• Respond to the overall market demand for high-quality select-service hotels with potential commercial and leisure travelers.
The City should identify practical next steps to determine whether the Proposed Hotel can be developed which may include the following.
• Updating the appraisal of the MCP to determine the fair market value of the site.
• Evaluating physical attributes of the site through American Land Title Association (“ALTA”) survey or other methods to determine possible impact to development (i.e. utilities, fee title ownership, paper streets, etc.).
• Ascertaining the City’s ability to negotiate a property purchase and hotel development project with a single party (adjacent hotel owner) and preferred path forward, which may include preparing and issuing a Request for Qualifications and Proposals concerning the Proposed Hotel.
• The City should determine the options for providing parking for both the needs for the Proposed Hotel and the surrounding downtown area, and to

January 22, 2019 Executive Summary Proposed Convention Center Hotel - Modesto, California 1-14
replace the lost surface public parking that would be displaced by the Proposed Hotel.
• The City should determine what tools it is willing to consider that would ensure an economically viable hotel project, an updated and efficiently operated convention center, and ample infrastructure.
• Exploring the sale or long-term lease of the MCP to the ownership of the DoubleTree or developer of the Proposed Hotel as part of a negotiated agreement. Debt is still owned on the MCP.
An extraordinary assumption is one which relates directly to the Proposed Hotel development and which, if found to be false, could alter our opinions or conclusions. Extraordinary assumptions presume as fact otherwise uncertain information about physical, legal, or economic characteristics of the Proposed Hotel, or about conditions external to the property such as market conditions or trends, or about the integrity of data used in an analysis. An extraordinary assumption may be used in the analysis only if it is required to develop credible options and conclusions; a reasonable basis exists for the assumption, use of the extraordinary assumption results in a credible analysis. HVS discloses the use of any extraordinary assumption.
• The development of a parking facility that will serve the parking demand generated by the Proposed Hotel along with other downtown parking demand and replace the public surface parking lost due to the construction of the Proposed Hotel.
• The MCP would be improved to meet the standards of the adjacent hotels either by the City or the developer of the Proposed Hotel through a public-private partnership.
• Through common ownership or cooperative marketing and sales efforts, the DoubleTree, MCP and the Proposed Hotel would attract new group room night demand to Modesto as discussed later in this study.
Our analysis does not address unforeseeable events that could alter the financial performance of the proposed project and the market conditions reflected in the analyses. We assume that no significant changes, other than those anticipated and explained in this study, would take place from the date of HVS’ site visit or from the date of this study. Our findings are subject to all the assumptions and limiting conditions described herein. The reader should contact the authors with any questions after reading the study.
Extraordinary Assumptions

January 22, 2019 Description of Site and Proposed Hotel Proposed Convention Center Hotel - Modesto, California 2-1
2. Description of Site and Proposed Hotel
The suitability of the land for the operation of a lodging facility is an important consideration affecting the economic viability of a property and its ultimate marketability. The key site characteristics that affect the viability of a hotel property include its capacity to accommodate the project, accessibility, visibility, and supporting road and utility infrastructure, as well as land use policies such as zoning criteria, design guidelines, and building standards. The quality of a lodging facility's physical improvements has a direct influence on marketability, occupancy, and average room rate. The design and functionality of the structure can also affect operating efficiency and overall profitability.
The site for the Proposed Hotel is in downtown Modesto at the site of the MCP in the temporary surface parking on 11th street between L Street and K Street, as shown on the following site plan.
SITE PLAN FOR DOUBLETREE HOTEL, MCP, AND TEMPORARY PARKING
For the purposes of this study, HVS assumes that the hotel will be a select-service hotel conforming to the brand-specific guidelines, including construction and operational brand standards. Our forecast assumes that the property will be
Site Description
Description of the Proposed Hotel
L STREETr'
rOu j1
^WuCtKOlLL/COCK
Proposedi
Hotel Site•_CONFERENCE / CONVENTIONa HOTEL tcrtuCENTERK -
E I IUU«OC«-'vctriNS JPi« XC
.ST*.AN
~ i d at^«cw-.ZWITO* -UJNMT
K STREET

January 22, 2019 Description of Site and Proposed Hotel Proposed Convention Center Hotel - Modesto, California 2-2
maintained in a competitive condition, undergoing regular renovations of soft goods and case goods funded primarily by a reserve for replacement.
Figure 2-1 shows the features of the Proposed Hotel.
FIGURE 2-1 PROPOSED HOTEL FACILITIES
Guestroom Configuration Keys
Kings 110
Queen/Queen 80
One-Bedroom Suite 10
Tota l (ADA-Compl iant Rooms per Loca l Code) 200
Food & Beverage FacilitiesSeating
Capacity
Restaurant 70
Lounge 30
Indoor Meeting & Banquet FacilitiesSquare Feet
Combined
Bal l room 2,400Meeting Room 800Board Room 600
Total Square Feet of Meeting Space 3,800
Amenities & Services
Outdoor Pool Bus iness Center
Outdoor Whirlpool Gi ft Shop
Fitness Center Guest Laundry Room
Infrastructure
Parking Spaces Hotel 200
Elevators 2 Guest/1 Service
Li fe Safety Systems Sprinklers , Smoke Detectors
Construction Deta i ls Steel/Concrete
The lobby will be appropriate for a select-service hotel with limited meeting space. The Proposed Hotel will offer a restaurant, lounge, room service, and banquet operations. The hotel will feature standard and suite-style guestroom configurations. Guestroom bathrooms will be of a standard size, with a shower-in-tub, commode, and single sink with vanity area, featuring a stone countertop. The property will be attached to the MCP. The hotel structure is a single building, which

January 22, 2019 Description of Site and Proposed Hotel Proposed Convention Center Hotel - Modesto, California 2-3
will be constructed of steel and poured concrete with a minimum of five stories and a maximum of 15 stories. The Proposed Hotel is expected to become one of the premier lodging and meeting facilities in the City of Modesto.
The site does not have the capacity to support the development of the Proposed Hotel and adequate parking to serve the hotel’s parking demand, without costly construction of underground or structured parking. A limited number of surface parking spaces could be available on the site of the Proposed Hotel depending on the final development plan. But a minimum of 200 spaces are necessary to support the Proposed Hotel and the existing parking supply displaced by the project would most likely need to be replaced. For the purposes of this study, we assume that parking would be available in an adjacent parking garage.
Figure 2-2 shows the Proposed Hotel’s ballroom and meeting space which will allow the property to host small events.
FIGURE 2-2 PROPOSED HOTEL MEETING SPACE CAPACITY
Approximate Guest Capacity
Banquet Classroom Reception
Bal l room 2,400 150 96 180
Meeting Room 800 50 32 60
Floor Area
(square feet)Function Space
The proposed hotel would be part of a larger hotel and convention center complex that includes the DoubleTree Hotel and the MCP. Our projections assume that cooperative efforts to attract group business to this complex would generate room night demand for the Proposed Hotel.
Figure 2-3 shows the combined meeting space for the DoubleTree Hotel, the MCP, and the Proposed Hotel.
FIGURE 2-3 COMBINED MEETING SPACE
DoubleTree Hotel, MCP, and Proposed Hotel
DoubleTree
Hotel
Modesto
Centre Plaza
Proposed
HotelTotal
Square Feet
per Room
Bal l rooms 5,152 16,000 2,400 23,552 51
Meeting Space 2,895 7,000 800 10,695 23
Boardrooms 460 600 1,060 2
Total Meeting Space 8,507 23,000 3,800 35,307 77
Hotel and MCP Complex

January 22, 2019 Description of Site and Proposed Hotel Proposed Convention Center Hotel - Modesto, California 2-4
For this study, we assume the Proposed Hotel would include the following:
• A well-designed, functional layout of support areas, restaurant & lounge, ballroom & meeting space, and guestrooms.
• The hotel staff would be adequately trained to allow for a successful opening.
• Pre-marketing efforts would have introduced the product to major local accounts for at least six months in advance of the opening date.
• Meet all pertinent codes and brand standards.
• Open and operational on the assumed opening date,
• Construction would not create any environmental hazards.
After its opening, the Proposed Hotel would require ongoing upgrades and periodic renovations to maintain its competitive level in this market. The forecasted reserve for replacement should adequately fund these costs if the hotel’s staff employs a successful, ongoing maintenance program.
The topography of the site is generally flat, and the shape permits efficient use of the site for building and site improvements, including ingress and egress. The site will not contain any significant portion of undeveloped land that could be sold, entitled, and developed for alternate use. Building and site improvements will occupy the entire site.
According to the City of Modesto, the site is served by all necessary utilities.
Geological and soil reports were not provided to us or made available for our review during the preparation of this study. We are not qualified to evaluate soil conditions other than by visual inspection of the surface; no extraordinary conditions were apparent.
The City of Modesto did not inform HVS of any site-specific nuisances or hazards at the proposed site, and there were no visible signs of toxic ground contaminants at the time of our inspection. Because we are not experts in this field, we do not warrant the absence of hazardous waste and urge the reader to obtain an independent analysis of these factors.
State Route 99 is a north–south state highway, stretching almost the entire length of the Central Valley. From its southern end at Interstate 5 near Wheeler Ridge to its northern end at State Road 36 near Red Bluff, State Road 99 goes through the densely populated eastern parts of the valley. Cities served include Bakersfield, Delano, Tulare, Visalia, Kingsburg, Selma, Fresno, Madera, Merced, Turlock,
Capital Expenditures
Site Utility
Soil and Subsoil Conditions
Nuisances and Hazards
Access and Visibility

January 22, 2019 Description of Site and Proposed Hotel Proposed Convention Center Hotel - Modesto, California 2-5
Modesto, Stockton, Sacramento, Yuba City, and Chico. The site for the Proposed Hotel in downtown Modesto is easily accessible and visible from State Route 99.
REGIONAL ACCESS
Norman Y. Mineta San Jose International Airport, which is located approximately 80 miles by car to the west of the Site for the Proposed Hotel, provides the closest air service. Sacramento International Airport is located approximately 85 miles by car to the north of the Site. Additional airport options include San Francisco International Airport, Oakland International Airport, Stockton Metropolitan Airport, and Fresno Yosemite International Airport.
The neighborhood surrounding a lodging facility often has an impact on a hotel's status, image, class, style of operation, and sometimes its ability to attract and properly serve a market segment.
The site for the Proposed Hotel is adjacent to the MCP and near the DoubleTree Hotel. Downtown Modesto has numerous dining and entertainment options, the McHenry Mansion and Museum, the Gallo Center for the Arts, the City/CountyAdministration Building, office buildings, and public transit facilities. The Altamont Commuter Express is expected to expand to Modesto by 2023.
Airport Access
Neighborhood
uroisom KirkwoodHealdsburgo ©Sacramento
o r nL J
Santa Rosa Elk GroveoVacaville o
o
BridgeportStanislausNational Forest
©Lee Vining
O
Concord SonoraStockton oo O oTuolumne Yosemite
National ParkSan Franciscoipo °Mam Inyo Na
ForMol^stoo ^Oakdale o
YosemiteValley O
MammLakeTurlock Mariposa Fish CampPalo Alto
o
fgijSan Joseo
Oakhurst Sierra NationalForestMercedo oo
Chowchillao
Los BanosO
Maderao
Hollistero
Google MonHn+a r----- ''--p* fMap data ©2018 Google Terms of Use Report a map errorr'-i;

January 22, 2019 Description of Site and Proposed Hotel Proposed Convention Center Hotel - Modesto, California 2-6
NEIGHBORHOOD
According to the Federal Emergency Management Agency map illustrated on the following page, the site is in flood zone X (shaded).
Flood Zone

January 22, 2019 Description of Site and Proposed Hotel Proposed Convention Center Hotel - Modesto, California 2-7
COPY OF FLOOD ZONE MAP
The flood zone definition for the X designation is as follows: areas of minimal flood hazard, which are the areas outside the Special Flood Hazard Area and higher than the elevation of the 0.2% annual-chance flood, are labeled Zone C or Zone X
(unshaded).
The site is zoned CD Central Downtown. This zone is intended to foster the most intensive and active urban environment in the downtown while ensuring an overall human scale to development. This is accomplished with large, but unobtrusive building envelopes that accommodate a mixture of uses, including residential, with an interface that promotes a very strong public-private connection and lively streetscape. A hotel is a permitted use in the CD zone.
We are not aware of any easements attached to the possible sites that would significantly affect the utility of the property or marketability of this project.
Zoning
Easements and Encroachments
National Flood Hazard Layer FIRMette LegendFEMA37'38'43 83"N SEE FIS REPORT FOR DETAILED LEGEND US INDEX M*P FOR FIRM PANEL LAYOUT
Without Base Flood Elevation (BFE)A.v.Ata
With BFE or Depth *E to AH «.AR
Regulatory FloodwaySPECIAL FLOODHAZARD AREAS
0.2*Annual Chance Flood Hazard.Areasof 1* annual chance flood with averagedepth less than one foot or with drainageareas of less than one square mile z««« xFuture Conditions1*AnnualChance Flood Hazard axitx
Area with ReducedFloodRisk due toLevee.See Notes. X
Area with Flood Risk due to Leveezsn* oOTHER AREAS OF
FLOOD HAZARD
IO SCREEN! Area of MinimalFlood Hazard zo»* xEffective LOMRs
OTHER AREAS Area of Undetermined Flood Hazard zw»
- channel, Culvert, or storm Sewer
111111 Levee.Dike, or FloodwallGENERAL
STRUCTURES
Q ;°: Cross Sections w ith1*Annual Chance—H2 water surface Elevation© Coastal Transect—n— Base Flood Elevation Line (BFE)
Limit of StudyJurisdiction BoundaryCoastal Transect Baseline
- - Profile BaselineHydrographic Feature
OTHERFEATURES
Digital Data Available
No Digital Data AvailableMAP PANaS Unmapped
The pin displayed on the map is an approximatepoint selected bythe user and does not representan authoritative property location.
This map complies with FEMA's standards for the use ofdigital flood maps if it is not void as described below.The basemap shown complies with FEMA's basemapaccuracy standardsThe flood hazard information is derived directly from theauthoritative NFHL web services provided by FEMA.This mapwas exported on1J/5/2018 at3:07:11PM and does notreflect changes or amendments subsequent to this date andtime The NFHL and effective information may change orbecome superseded by new data over time.This map image is void if the one or more of the following mapelements do not appear: basemap imagery, flood zone labels,legend,scale bar.map creation date,community identifiers,FIRM panel number, and FIRM effective date. Map images forunmapped and unmodemized areas cannot be used forregulatory purposes.1,000 1,500 2,000

January 22, 2019 Description of Site and Proposed Hotel Proposed Convention Center Hotel - Modesto, California 2-8
The ownership structure for the Proposed Hotel has not been determined as of the date of this study, except to rule out any public ownership or financing. A hotel management agreement would be negotitated upon the future sale of the site and approval of a hotel development. We have included a market-appropriate management fee of 3.0% of gross operating revenues. Other charges related to the affiliation, such as frequent guest programs, are reflected in the appropriate departmental expenses, consistent with the Uniform System of Accounts for the Lodging Industry (“USALI”).
We recommend that the Proposed Hotel operates as an AAA three diamond upper-upscale or upscale, select-service hotel. While we have placed heavy consideration on the Hilton or Marriott brand, a specific franchise affiliation has yet to be finalized. Our projections reflect a Hilton, Marriott or similar brand affiliation. We assume that the Proposed Hotel will obtain a brand from a national brand and will retain its brand affiliation throughout the holding period. Inherent in this assumption is the expectation that the property will be operated in accordance with brand standards, including requirements for services and cleanliness; that the hotel will be maintained in good condition, with all building systems in good working order; and that any necessary refurbishments or renovations will be completed in a timely manner and in accordance with the requirements of the brand.
For this analysis, we assume that the Proposed Hotel would be financed and designed sometime in 2019 and after a one-year construction period, the hotel would open on January 1, 2021.
Ownership, Franchise, and Management Assumptions

January 22, 2019 Modesto Market Overview Proposed Convention Center Hotel - Modesto, California 3-1
3. Modesto Market Overview
HVS explored economic and demographic factors that affect the level of lodging demand in the market including population, income, employment, retail sales, business presence, major tourism attractions, and transportation access. We relied on third party data sources to review historical trends and provide forecasts of the rate of growth or decline of the local economy. We also assessed whether the neighborhood surrounding the site would support the development of the Proposed Hotel. This market overview provides a framework for projections of lodging demand and revenue growth in the local market.
Our analysis of the outlook for this specific market also considers the broader context of the national economy. The U.S. economy expanded during the last three years, with a relatively low point in growth occurring during the fourth quarter of 2015. Most recently, the U.S. economy expanded by 2.2% and 4.2% in the first two quarters of 2018, respectively. The recent growth is the highest level since the third quarter of 2014. In the second quarter of 2018, non-residential fixed investment increased more than anticipated, primarily boosted by software and information processing equipment; conversely, imports fell, mainly related to petroleum.
National Economic Trends

January 22, 2019 Modesto Market Overview Proposed Convention Center Hotel - Modesto, California 3-2
FIGURE 3-1 UNITED STATES GDP GROWTH RATES
2010 Q1 1.6%
Q2 3.9%
Q3 2.8%
Q4 2.8%
2011 Q1 -1.3%
Q2 3.2%
Q3 0.8%
Q4 4.6%
2012 Q1 2.3%
Q2 1.6%
Q3 2.5%
Q4 0.1%
2013 Q1 1.9%
Q2 1.1%
Q3 3.1%
Q4 4.0%
2014 Q1 -1.2%
Q2 4.0%
Q3 5.0%
Q4 2.0%
2015 Q1 3.2%
Q2 2.7%
Q3 1.0%
Q4 0.4%
2016 Q1 1.5%
Q2 2.3%
Q3 1.9%
Q4 1.8%
2017 Q1 1.8%
Q2 3.0%
Q3 2.8%
Q4 2.3%
2018 Q1 2.2%
Q2 4.2%
Source: Bureau of Economic Analysis
U.S. economic growth continues to support expansion of lodging demand. In 2018, demand growth through July registered 2.9%, stronger than the 2.7% level recorded in 2017. The economic growth, low unemployment, higher levels of personal income, and stability in the U.S. economy as of mid-year 2018 is helping to maintain strong interest in hotel investments by a diverse array of market participants.
The market area includes all of Modesto, California and the surrounding area, as illustrated in the following map.
Market Area Definition

January 22, 2019 Modesto Market Overview Proposed Convention Center Hotel - Modesto, California 3-3
MAP OF MARKET AREA
HVS used the Complete Economic and Demographic Data Source published by Woods & Poole Economics, Inc., a well-regarded forecasting service based in Washington, D.C. as a source of economic and demographic data. Using a database containing more than 900 variables for each county in the nation, Woods & Poole employs a sophisticated regional model to forecast economic and demographic trends. Census data and information published by the Bureau of Economic Analysis provide the basis for historical statistics. Woods & Poole formulates the projections, and all dollar amounts have been adjusted for inflation, thus reflecting real change. Figure 3-2 summarizes this data.
Economic and Demographic Review
© © aan Miiuieas
LockefordRio Vista © r nL JLodi
Angels CampMorada Columbia© Antioch
Copperopolis Sonorajncord
t Creek ^Mt Diablo Discovery Bay G)TuolumneStockton
©(© Groveland Buck
Meadows_ Manteca @)Oakdale<3* Tracy
f® Modesto ®Ceres
(?32) CoultervilleSalidaLa GrangePleasanton
Vernalis
iwards —nciscoitional HornitosTurlockife... MariPatterson
Catheys Valleytain Livingston #w
AtwaterSan JoseNewman
^ Gustine
(165) ® Merced Planada
Goggle Map data ©2018 Google Terms of Use , Report a map error

Jan
uar
y 2
2, 2
01
9
Mo
de
sto
Mar
ket
Ove
rvie
w
P
rop
ose
d C
on
ven
tio
n C
ente
r H
ote
l - M
od
esto
, Cal
ifo
rnia
3-4
FIG
UR
E 3
-2
ECO
NO
MIC
AN
D D
EMO
GR
AP
HIC
DA
TA S
UM
MA
RY
E
con
om
ic I
nd
ica
tor/
Are
aB
eg
inn
ing
A
mo
un
t2
00
02
01
02
01
82
02
5E
nd
ing
A
mo
un
tR
esi
de
nt
Po
pu
lati
on
(m
illi
on
s)S
tan
isla
us
Co
un
ty0
.45
0.5
91
.0%
Mo
de
sto
, C
A M
SA
0.4
0.6
1.0
%M
od
es
to-M
erc
ed
, C
A C
SA
0.7
0.9
1.0
%S
tate
of
Ca
l ifo
rnia
33
.99
42
.93
1.0
%U
nit
ed
Sta
tes
28
2.1
63
50
.94
0.9
%P
er-
Ca
pit
a P
ers
on
al
Inco
me
* (
tho
usa
nd
s)S
tan
isla
us
Co
un
ty$
28
.92
$4
1.1
1.1
%M
od
es
to,
CA
MS
A$
28
.92
$4
1.1
1.1
%M
od
es
to-M
erc
ed
, C
A C
SA
$2
7.2
7$
39
.61
.1%
Sta
te o
f C
al i
forn
ia$
39
.81
$5
6.8
1.1
%U
nit
ed
Sta
tes
$3
6.8
1$
50
.21
.2%
W&
P W
ea
lth
In
de
xS
tan
isla
us
Co
un
ty$
78
.22
$8
1.7
5-0
.1%
Mo
de
sto
, C
A M
SA
$7
8.2
2$
81
.75
-0.1
%M
od
es
to-M
erc
ed
, C
A C
SA
$7
4.2
0$
78
.88
-0.1
%S
tate
of
Ca
l ifo
rnia
$1
07
.97
$1
12
.69
-0.1
%U
nit
ed
Sta
tes
$1
00
.00
$1
00
.00
0.0
%F
oo
d a
nd
Be
ve
rag
e S
ale
s* (
bil
lio
ns)
Sta
nis
lau
s C
ou
nty
$0
.46
$0
.84
1.6
%M
od
es
to,
CA
MS
A$
0.4
6$
0.8
41
.6%
Mo
de
sto
-Me
rce
d,
CA
CS
A$
0.6
1$
1.1
51
.7%
Sta
te o
f C
al i
forn
ia$
46
.67
$8
4.6
51
.5%
Un
ite
d S
tate
s$
36
8.8
3$
66
2.6
11
.5%
To
tal
Re
tail
Sa
les*
(b
illi
on
s)S
tan
isla
us
Co
un
ty$
5.6
6$
7.9
01
.5%
Mo
de
sto
, C
A M
SA
$5
.66
$7
.90
1.5
%M
od
es
to-M
erc
ed
, C
A C
SA
$7
.52
$1
0.5
11
.5%
Sta
te o
f C
al i
forn
ia$
44
6.4
8$
65
4.1
41
.5%
Un
ite
d S
tate
s$
3,9
02
.83
$5
,59
8.2
41
.4%
* In
fla
tio
n A
dju
ste
d
Est
ima
ted
An
nu
al
Co
mp
ou
nd
Ch
an
ge
2
01
8 t
o 2
02
5
So
urc
e: W
oo
ds
& P
oo
le E
con
om
ics,
Inc.
Th
e ch
arac
teri
stic
s o
f an
are
a's
wo
rkfo
rce
ind
icat
e th
e ty
pe
and
am
ou
nt
of t
ran
sien
t vi
sita
tio
n l
ikel
y to
be
gen
erat
ed b
y lo
cal
bu
sin
esse
s.
Sect
ors
su
ch
as f
inan
ce,
insu
ran
ce,
and
re
al
esta
te
(“F
IRE
”);
wh
ole
sale
tr
ade;
an
d
serv
ices
p
rod
uce
a
con
sid
erab
le
nu
mb
er
of
visi
tors
w
ho
ar
e n
ot
par
ticu
larl
y
rate
-sen
siti
ve.
Th
e go
ver
nm
ent
sect
or
oft
en
gen
erat
es
tran
sien
t ro
om
n
igh
ts,
bu
t p
er-d
iem
re
imb
urs
emen
t al
low
ance
s o
ften
lim
it t
he
acco
mm
od
atio
ns
sele
ctio
n t
o b
ud
get
and
Wo
rkfo
rce
Ch
arac
teri
stic
s
p
*
1

January 22, 2019 Modesto Market Overview Proposed Convention Center Hotel - Modesto, California 3-5
mid-priced lodging facilities. Contributions from manufacturing, construction, transportation, communications and public utilities (“TCPU”) employers can also be important, depending on the company type.
Figure 3-3 shows the estimated change in employment in the top ten sectors in the Stanislaus County workforce distribution by the various business sectors in 2000, 2010, and 2018, and a forecast for 2025.
FIGURE 3-3 TOP TEN EMPLOYMENT SECTORS IN STANISLAUS COUNTY
Sector/Geographic Area Employment
Beginning
Amount
(thousands)
2000 2010 2018 2025
Ending
Amount
(thousands)
Stanislaus County
Health Care And Socia l Ass is tance 19.7 41.3
Retai l Trade 25.4 33.2
State And Local Government 23.8 32.0
Manufacturing 25.0 24.0
Accommodation And Food Services 12.1 22.0
Other Services , Except Publ ic Adminis tration 11.8 16.4
Construction 13.5 15.1
Adminis trative And Waste Services 11.0 13.9
Transportation And Warehous ing 5.7 13.6
Real Estate And Rental And Lease 6.0 11.5
Other 51.3 59.8
Total Stanislaus County 205.3 282.9
U.S. 165,372 223,254
Source: Woods & Poole Economics, Inc.
The health care and social assistance, retail trade, state and local government, accommodation and food service, other services except public administration, construction, administrative and waste services, transportation and warehousing, and real estate and rental and lease sectors of the economy should continue to expand along with the overall growth in the local economy. From 2018 to 2025 Health Care And Social Assistance are expected to expand at the faster rate for a total increase of 20.4%. The only top ten sector projected to decline from 2018 to 2025 is Manufacturing, for a total decline of -0.8%. The construction sector has continued to recover from the significant decline due to the last recession.

January 22, 2019 Modesto Market Overview Proposed Convention Center Hotel - Modesto, California 3-6
Figure 3-4 presents historical unemployment rates for the Proposed Hotel’s market area.
FIGURE 3-4 UNEMPLOYMENT STATISTICS
Year Modesto MSA California USA
2008 9.5 % 11.1 % 7.3 % 5.8 %
2009 13.4 15.5 11.2 9.3
2010 16.6 16.9 12.2 9.6
2011 16.2 16.5 11.7 8.9
2012 14.6 14.9 10.4 8.1
2013 12.7 12.9 8.9 7.4
2014 10.9 11.2 7.5 6.2
2015 9.3 9.5 6.2 5.3
2016 7.8 8.6 5.5 4.9
2017 6.8 7.5 4.8 4.4
Recent Month - Oct
2017 5.8 % 6.0 % 4.2 % 4.1 %
2018 5.5 5.5 4.0 3.8
Source: U.S. Bureau of Labor Statistics
Locally, the unemployment rate was 6.8% in 2017; for this same area in 2018, the most recent month’s unemployment rate was registered at 5.5%, versus 5.8% for the same month in 2017. Unemployment rates in the Modesto, CA MSA have historically exceeded those of the state and nation. Farming and agriculture, as well as food distribution and related industries, make up a sizeable portion of the total area employment; these sectors are traditionally labor-intensive and seasonal.
Figure 3-5 shows the largest employers in the region.
Unemployment Statistics
Major Business and Industry

January 22, 2019 Modesto Market Overview Proposed Convention Center Hotel - Modesto, California 3-7
FIGURE 3-5 TOP EMPLOYERS IN MODESTO
Employer Industry
Save Mart Supermarkets Retail Grocer
E. & J. Gallo Winery Winery, Manufacturing and Distribution
Stanislaus County Community Service/Local Government
Modesto City Schools School District
Doctors Medical Center Hospital
Memorial Medical Center Hospital
Foster Farms Food Manufacturing
Del Monte Foods Food Manufacturing
Stanislaus Food Products Food Manufacturing
Ceres Unified School District School District
Source: City of Modesto
A significant number of the largest employers in Stanislaus County are in the wine, food products, poultry, and food processing companies. Agricultural related activities are the foundation of the local economy.
The following bullet points highlight major demand generators for this market:
• Agriculture is the primary industry in the region due to the fertile lands in the surrounding area. The Modesto area is home to Blue Diamond Growers, one of the largest suppliers of nuts in the county, as well as other agriculture-related companies such as Foster Farms, Royal Robbins, Fiscalini Cheese, and Sciabica Olive Oil.
• Modesto is the home of the corporate headquarters and primary facilities of E & J Gallo Winery. Founded in 1933 by brothers Ernest and Julio Gallo, E & J Gallo Winery is the largest family-owned winery in the United States. The Gallo Glass Company, an affiliate of Gallo Winery, is also located in the area and is considered the largest wine-bottle manufacturing company in the world.
• Due to the large concentration of agriculture companies in the area that produce food products, the food processing industry is also a significant sector in the region. Food processing companies in the area include Del Monte, Ceres, and Frito-Lay.
The agriculture industry and wineries, as well as the area's proximity to Yosemite National Park, have created a strong base of tourism and employment. From 2007 through mid-year 2009, however, the market realized a slowdown consistent with that of the national economy. The market has recovered from the recession with increasing activity in agricultural related product with an emphasis on nuts, and

January 22, 2019 Modesto Market Overview Proposed Convention Center Hotel - Modesto, California 3-8
wine production & processing. The prevalence of food processing and agriculture firms, as well as the wineries, places the area in an advantageous position for economic development and growth in the future.
Norman Y. Mineta San Jose International Airport, which is approximately 82 miles by car from the site, is located at the north end of San Jose, near the intersections of three major freeways. San Jose International is the smallest of the three Bay Area airports offering scheduled service. Like Oakland International Airport, this airport attracts suburban residents who find SFO to be inconveniently distant from their homes. The airport also serves as a “reliever” airport in the Bay Area; discount carriers prefer this airport to San Francisco International because of better weather conditions and a lack of fog. The airport is serviced by a variety of commercial airlines. Phase I of the facility’s $1.3-billion terminal upgrade project, which was completed in June 2010, included the reconstruction of Terminal B, upgrades to Terminal A, and the addition of a new rental car and parking garage. An $82-million, 240,000-square-foot terminal (designed specifically to serve corporate planes owned by Google) opened in 2016. In January 2018, the aviation director announced plans for another expansion at the airport to accommodate the recent surge in demand. The new $1-billion expansion is anticipated to extend Terminal B to the south and increase the number of gates from 31 to at least 40 by 2024.
The airport has recently experienced rapid growth with new international flights from the expansion of Alaska Airlines following the acquisition of Virgin America. Jet Blue, Frontier Airlines, Delta Air Lines, and United Airlines have all added service to additional cities.
Airport Traffic

January 22, 2019 Modesto Market Overview Proposed Convention Center Hotel - Modesto, California 3-9
FIGURE 3-6 AIRPORT PASSENGERS
NORMAN Y. MINETA SAN JOSE INTERNATIONAL AIRPORT
YearPassenger
Traffic
Annual Percentage
Change
2008 9,717,717
2009 8,321,750 -14.4%
2010 8,246,064 -0.9%
2011 8,357,384 1.3%
2012 8,296,174 -0.7%
2013 8,783,319 5.9%
2014 9,385,212 6.9%
2015 9,799,427 4.4%
2016 10,796,725 10.2%
2017 12,480,232 15.6%
YTD through November
2017 11,387,495
2018 13,130,215 15.3%
Source: Norman Y. Mineta San Jose International Airport
Passenger traffic has increased for the last five years after a decline in 2009 and three years of stagnation. Through the most recent monthly data of 2018, passenger traffic has grown to 13,130,215 from 11,387,49 an increase of 15.3%.
Oakland International Airport (OAK) is located eight miles south of Downtown Oakland in Alameda County, California, and is one of three international airports in the San Francisco Bay Area. Major commercial airlines, specifically low-cost carriers, service the airport. The Bay Area Rapid Transit (BART) line to Oakland International Airport opened to the public on November 2014. Interior construction is underway to modernize the Terminal 1 complex and to make needed seismic retrofitting improvements; most of the project has been completed, with only improvements to the areas around the Terminal 1 security checkpoint remaining. In June 2017, the airport received a $37.4-million grant from the Federal Aviation Administration to rehabilitate the airport's main runway. The $67-million renovation of 8,300 feet of runway asphalt was completed in September 2017. Aside from the runway renovations, the airport also debuted the first phase of its expanded International Arrivals Building in December 2017, a $45-million project doubling the building’s capacity.

January 22, 2019 Modesto Market Overview Proposed Convention Center Hotel - Modesto, California 3-10
FIGURE 3-7 AIRPORT PASSENGERS
OAKLAND INTERNATIONAL AIRPORT
YearPassenger
Traffic
Annual Percentage
Change
2008 11,474,456
2009 9,505,281 -17.2%
2010 9,542,333 0.4%
2011 9,266,570 -2.9%
2012 10,040,864 8.4%
2013 9,742,887 -3.0%
2014 10,336,788 6.1%
2015 11,205,063 8.4%
2016 12,070,967 7.7%
2017 13,072,245 8.3%
YTD thru November
2017 11,985,857
2018 12,504,182 4.3%
Source: Oakland International Airport
Passenger traffic has increased for the last five years after a decline in 2009 and three years of stagnation. Through the most recent monthly data of 2018, passenger traffic has grown to 12,504,182 from 11,985,857an increase of 4.3%.
Sacramento International Airport is the gateway to Northern California and serves the greater Sacramento region, including Stockton, Chico, and Napa. This four-runway facility services multiple international and national carriers, offering 145 nonstop flights to 30 destinations. Completed in 2012, The Big Build was a $1.08-billion airport modernization project to replace the airport’s almost 40-year-old Terminal B to meet the rising demand for passenger services and improve the airport’s ability to attract new carriers and routes. The new 680,000-square-foot Terminal B facility was completed in the fall of 2011, including offices for airline support services, parking, and an automated people mover to connect the two terminals. Demolition of the old Terminal B and construction of new overnight aircraft parking space were completed in August 2012. The 17,000-square-foot food court in Terminal A was remodeled in 2015, and new local restaurants were added. Sacramento became one of nine airports to join the Global Entry program by the U.S. Customs and Border Protection Department in July 2016; the program currently includes 75 airports worldwide.

January 22, 2019 Modesto Market Overview Proposed Convention Center Hotel - Modesto, California 3-11
The recent increase in passenger traffic can be attributed in large part to expanded service by major air carriers in response to stronger economic conditions and a rise in demand. Within the last few years, airlines have added new direct flights to cities including Seattle, Boston, Chicago, Baltimore, Mexico City, Orlando, St. Louis, and Cabo.
FIGURE 3-8 AIRPORT PASSENGERS
SACRAMENTO INTERNATIONAL AIRPORT
YearPassenger
Traffic
Annual Percentage
Change
2008 9,982,427
2009 8,914,510 -10.7%
2010 8,850,239 -0.7%
2011 8,929,289 0.9%
2012 8,910,570 -0.2%
2013 8,685,368 -2.5%
2014 8,972,756 3.3%
2015 9,609,880 7.1%
2016 10,118,794 5.3%
2017 10,912,079 7.8%
YTD through August
2017 7,065,416
2018 7,872,054 11.4%
Source: Sacramento International Airport
Passenger traffic has increased for the last five years after a decline in 2009 and three years of stagnation. Through the most recent monthly data of 2018, passenger traffic has grown to 7,872,054 from 7,065,416 an increase of 11.4%.
San Francisco International Airport (SFO) is situated about 90 miles by car from the Site. SFO is one of the busiest airports in the country, with extensive international and national service. The airport features ample amenities and services, which include various restaurants, shops, spa treatments, business centers, an aviation library, and a children's area. In May 2013, airport officials unveiled a ten-year, $4.1-billion capital improvement plan to upgrade the airport's facilities, creating more than 36,000 jobs over the next ten years. A new air-traffic-control tower, which replaced a control tower located atop Terminal 2, was completed in January 2014. In November 2015, the airport unveiled a 53,000-square-foot expansion of its Terminal 3 East Concourse, which connects boarding areas E and F; this project also

January 22, 2019 Modesto Market Overview Proposed Convention Center Hotel - Modesto, California 3-12
included three new boarding gates, a new United Club location, and a larger central security checkpoint. In June 2016, a groundbreaking ceremony was held for the renovation of Terminal 1, the airport’s oldest facility. The $2.4-billion project, slated to be completed in phases between 2016 and 2024, will create an interim boarding area to accommodate passenger activity while a new structure takes shape; once completed, Boarding Area B will feature a total of 24 gates. Furthermore, a 351-room Grand Hyatt is currently under construction on the site of the former Hilton Hotel. The hotel will feature direct access to the airport’s AirTrain light-rail system when it opens in July 2019.
FIGURE 3-9 AIRPORT PASSENGERS
SAN FRANCISCO INTERNATIONAL AIRPORT
YearPassenger
Traffic
Annual Percent
Change
2008 37,403,000
2009 37,454,000 0.1%
2010 39,117,000 4.4%
2011 40,810,000 4.3%
2012 44,477,000 9.0%
2013 45,012,000 1.2%
2014 47,155,000 4.8%
2015 50,067,000 6.2%
2016 53,096,000 6.0%
2017 55,815,000 5.1%
YTD through November
2017 51,171,825
2018 53,129,871 3.8%
Source: San Francisco International Airport
Passenger traffic has increased every year since 2008. Through the most recent monthly data of 2018, passenger traffic has grown to 53,129,871 from 51,171,825, an increase of 3.8%.
The City of Modesto offers a variety of affordable attractions throughout the region; from the local ranch tours to water sports on Don Pedro to Tuolumne range excursions. Primary attractions in the area include the following:
• According to the Modesto Convention and Visitors Bureau, the Bloomingcamp Ranch, Modesto Certifies Farmer’s Market, Hilmar Cheese Company, and
Tourist Attractions

January 22, 2019 Modesto Market Overview Proposed Convention Center Hotel - Modesto, California 3-13
Oakdale Cheese & Specialties are among the most frequented attractions by leisure travelers visiting Modesto. Due to the large amount of acreage required to contain the facilities necessary to produce the area’s agricultural products, these attractions are situated around Modesto's periphery.
• John Thurman Field is home to the Class A–Advanced team in the California League Modesto Nuts baseball team (minor league farm team for the Seattle Mariners) and hosts annual concerts and tradeshows.
• Rainbow Fields, a privately-owned sports complex, offers six ball fields total; four fields are equipped with lights and 300-foot fences. The two additional fields are non-lit youth-fields; with fences reaching 200 feet, plus a 6,000-square-foot clubhouse, and a large children's playground area outdoors.
• Mary Grogan Park, a 42-acre community park located in Modesto has seven fields. Three of the fields are synthetic turf and the entire complex is lighted.
• Downtown tourism attractions include museums and historical sites. Once the home of a prominent local banker and rancher, the Robert McHenry Mansion was constructed in 1883 and shows the Victorian and Italianate architectural styles of the late 1800s. Works of art depicting life in Modesto’s early days are on display at the Robert McHenry Museum. Crystal Creamery, EJ Gallo, Fiscallini, Sciabica and Ratto Bros Farm all offer pre-arranged private tours.
• The Gallo Center for the Performing Arts opened in October of 2007. The performing arts center is in Downtown Modesto, adjacent to the Tenth Street Place, a mixed-use development that features a 1,200-seat concert theatre, a 400-seat performance theatre, concession stands, and a landscaped outdoor plaza. The concert hall is home to the Modesto Symphony.
• The 1,200 square mile Yosemite National Park in the Sierra Nevada mountains is located 85 miles from Modesto. The park features giant, ancient sequoia trees, and Tunnel View, the iconic vista of towering Bridal Veil Falls and the granite cliffs of El Capitan and Half Dome. Yosemite Village offers shops, restaurants, lodging, the Yosemite Museum, and the Ansel Adams Gallery.
• Agricultural Attractions: According Yelp, the region offers 46 farm stands that offer a variety of fresh produce and nuts. These range from Modesto Certified Farmers Market to Loretelli Farms and from Stewart & Jasper to the Strawberry Stand on North McHenry. There are also 5 U-Pick farms within a short drive from Modesto.

January 22, 2019 Modesto Market Overview Proposed Convention Center Hotel - Modesto, California 3-14
• Sports & Recreation; The Modesto Marathon draws a large attendance as a qualifier for the Boston and NYC Marathons. Ride-for-Mom draws cycling enthusiasts throughout northern California every May. Other sports attractions include several private and public golf courses, tennis tournament facilities at Brenda Athletic Clubs, and a swim master’s program at Modesto Junior College. The area supports eight shooting ranges and Gun Clubs. Modesto offers two popular bowling alleys.
• Natural Recreation Facilities; Fly and Bass fishing in the region regularly draw anglers from the Bay Area. Water sports and reservoir boating activities bring in regulars from Silicon Valley’s Tech Companies as well as local families. Though skiing, hiking, fishing, camping, and high-country fishing are in Tuolumne County, many who participate travel to Modesto for a ‘base’ to take in these activities. Calaveras Big Trees are some of the world’s largest trees.
• Shopping; Modesto offers a large variety of local shops, chain stores, and the region’s busiest shopping mall - Vintage Faire Mall. Shops range from an Apple Store to DWS and from Pier 1 to the eclectic range of stores at McHenry Village.
The regional economy was significantly affected by the recent recession, as noted by the high level of unemployment. Given that the agricultural industry is the cornerstone of this region, the local economy is not as diversified as other markets; however, diversification has increased over the last couple of decades. The services, food processing, and manufacturing sectors do help to balance out the economic make-up of the area. While the local economy is expected to remain somewhat suppressed in the near term, an increase in the area's population, coupled with the City's expanding role as a regional center for the surrounding counties, should support moderate growth over the long term as the local and national economies recover in earnest. The outlook for the area is optimistic.
Conclusion

January 22, 2019 Supply and Demand Analysis Proposed Convention Center Hotel - Modesto, California 4-1
4. Supply and Demand Analysis
Changes in the national lodging market indirectly affect local markets. HVS reviewed national lodging trends to provide context for the forecast of the supply and demand for the Proposed Hotel’s competitive set.
Figure 4-1 presents annual hotel occupancy and average rate data since 1987. RevPAR, the product of occupancy and average rate provides a combined measure of rate and occupancy.
Figure 4-1 shows the hotel occupancy, average rate, and RevPAR throughout the U.S.
FIGURE 4-1 U.S. OCCUPANCY, AVERAGE RATE, AND REVPAR TRENDS
0%
10%
20%
30%
40%
50%
60%
70%
80%
90%
100%
$0
$20
$40
$60
$80
$100
$120
$140
ADR RevPAR Occupancy
Source: STR
Following the significant RevPAR decline experienced during the last recession, demand growth resumed in 2010, led by select markets that had recorded growth trends in the fourth quarter of 2009. A return of business travel and some group activity contributed to these positive trends. The resurgence in demand was partly fueled by the significant price discounts that were widely available in the first half of 2010. These discounting policies were largely phased out in the latter half of the
National Hotel Market Trends

January 22, 2019 Supply and Demand Analysis Proposed Convention Center Hotel - Modesto, California 4-2
year, balancing much of the early rate loss. Demand growth remained strong, but decelerated from 2011 through 2013, increasing at rates of 4.7%, 2.8%, and 2.0%, respectively. Demand growth then surged to 4.0% in 2014, driven by a strong economy, a robust oil and gas sector, and limited new supply of hotels, among other factors. By 2014, occupancy had surpassed the 64% mark. Average rate rebounded similarly during this time, bracketing 4.0% annual gains from 2011 through 2014.
In 2015, demand growth continued to outpace supply growth, a relationship that has been in place since 2010. With a 2.9% increase in room nights, the nation's occupancy level reached a record high of 65.4% in 2015. Supply growth intensified modestly in 2015 (at 1.1%), following annual supply growth levels of 0.7% and 0.9% in 2013 and 2014, respectively. Average rate posted another strong year of growth, at 4.7% in 2015, in pace with the annual growth of the last four years. Robust job growth, heightened group and leisure travel, and waning price-sensitivity all contributed to the gains. In 2016, occupancy showed virtually no change, as demand growth kept pace with supply additions. Occupancy then moved even higher in 2017, to a new peak of 65.9%. Average rate increased roughly 3% and 2% in 2016 and 2017, respectively. By year-end 2017, the net change in RevPAR was 3.0%, reflecting a healthy lodging market overall. Year-to-date statistics through August reflect a 0.5-point occupancy increase, while average rate increased by just over $3.00, resulting in a 3.5% upward change in RevPAR.
HVS selected a set of competitive local hotels. Four properties would compete with the Proposed Hotel on a primary basis and eight properties on a secondary basis, for a total of 12 competitors (“Competitive Hotels” see Figure 4-2 on page 4-4). We weighted the room count of each secondary competitor based on its projected competitiveness with the Proposed Hotel.
The following map illustrates the locations of the Proposed Hotel and its primary and secondary competitors.
Defining the Competitive Set

January 22, 2019 Supply and Demand Analysis Proposed Convention Center Hotel - Modesto, California 4-3
MAP OF PRIMARY AND SECONDARY COMPETITION BY HVS
HVS relied on STR data and market research to determine the room count of each hotel. The weighted competitive set currently includes 639 rooms in primary competitors and 633rooms in the secondary competitors with a weighted room count of 484. The total number of primary and weighted secondary competitors is 1,123 rooms as shown in Figure 4-2.
INCUHJSan Andreas© © r n
L JLockefordRio Vista ©Lodi ®
Angels Camp
VMorada Columbia© Antioch © SonoraCopperopolisConcord
alnut Creek 9Mt Diablo Discovery Bay ©TuolumneStockton
(j© Groveland9Oakdale
BuclMeadeQ20)
%Modesto (©
Tracy(122) Coulterville
f^jl La GrangePleasanton©Vernalis
©© Hornitos
PattersonAlto Catheys VaountainView Livingston
AtwaterSan Jose&Newman
Gustine
Merced PlanadaMap data ©2019 Google Terms of Use Report a map errorGoogle^
Vf Hampton Inn & Suites Manteca (Secondary)Proposed Hotel
V VDoubleTree by Hilton Modesto (Primary) Hampton Inn Turlock (Secondary)
V 9Hampton Inn & Suites Modesto-Salida (Primary) Holiday Inn Express & Suites Manteca City Center (Secondary)
9 9Hilton Stockton (Primary) Holiday Inn Express & Suites Modesto-Salida (Secondary)
9 9SpringHill Suites by Marriott Modesto (Primary) Holiday Inn Express Oakdale (Secondary)
9 9Fairfield Inn & Suites by Marriott Modesto Salida (Secondary) Holiday Inn Expresss Turlock (Secondary)
9 Fairfield Inn & Suites by Marriott Turlock (Secondary)

January 22, 2019 Supply and Demand Analysis Proposed Convention Center Hotel - Modesto, California 4-4
FIGURE 4-2 THE WEIGHTED COMPETITIVE SET
Hotel
Number
of
Rooms
Competitive
Level
Weighted
Room
Count
Primary Competitors
DoubleTree by Hi l ton Modesto 260 100% 260
Hampton Inn & Suites Modesto-Sal ida 70 100% 70
Hi l ton Stockton 198 100% 198
SpringHi l l Sui tes by Marriott Modesto 111 100% 111
Four Primary Competitors 639 100% 639
Secondary Competitors
Fairfield Inn & Suites by Marriott Modesto Sa l ida 69 80% 55
Fairfield Inn & Suites by Marriott Turlock 81 80% 65
Hampton Inn & Suites Manteca 101 70% 71
Hampton Inn Turlock 85 80% 68
Hol iday Inn Express & Suites Manteca Ci ty Center 72 70% 50
Hol iday Inn Express & Suites Modesto-Sal ida 95 80% 76
Hol iday Inn Express Oakdale 52 70% 36
Hol iday Inn Express Turlock 78 80% 62
Eight Secondary Competitors Total/Weighted 633 76% 484
12 Primary & Secondary Competitors Total/Weighted 1,272 88% 1,123
Sources: STR and HVS
Figure 4-3 shows the age of Competitive Hotels.

Janu
ary 22
, 20
19
Su
pp
ly and
De
man
d A
nalysis
P
rop
osed
Co
nven
tion
Cen
ter H
otel - M
od
esto, C
aliforn
ia 4-5
FIGU
RE 4
-3
THE A
GE O
F THE C
OM
PETITIV
E HO
TELS P
rop
erty
ST
R C
lassifica
tion
Hilto
n S
tock
ton
Up
pe
r Up
sca
le C
las
s3
8.6
71
98
Do
ub
leT
ree
by H
ilton
Mo
de
sto
Up
sca
le C
las
s2
8.6
72
60
Fa
irfield
Inn
& S
uite
s b
y Ma
rriott M
od
es
to S
alid
aU
pp
er M
ids
cale
Cla
ss
19
.82
69
Ho
lida
y Inn
Exp
res
s O
ak
da
leU
pp
er M
ids
cale
Cla
ss
17
.32
52
Ha
mp
ton
Inn
& S
uite
s M
od
es
to-S
alid
aU
pp
er M
ids
cale
Cla
ss
16
.49
70
Ho
lida
y Inn
Exp
res
s &
Su
ites
Ma
nte
ca C
ity Ce
nte
rU
pp
er M
ids
cale
Cla
ss
15
.07
72
Ho
lida
y Inn
Exp
res
s &
Su
ites
Tu
rlock
Up
pe
r Mid
sca
le C
las
s1
3.6
57
8
Ho
lida
y Inn
Exp
res
s &
Su
ites
Mo
de
sto
-Sa
lida
Up
pe
r Mid
sca
le C
las
s1
1.7
49
5
Sp
ring
hill S
uite
s b
y Ma
rriott M
od
es
toU
ps
cale
Cla
ss
11
.49
11
1
Fa
irfield
Inn
& S
uite
s T
urlo
ckU
pp
er M
ids
cale
Cla
ss
9.8
18
1
Ha
mp
ton
Inn
& S
uite
s M
an
teca
Up
pe
r Mid
sca
le C
las
s8
.57
10
1
Ha
mp
ton
Inn
Tu
rlock
Up
pe
r Mid
sca
le C
las
s2
.23
85
16
.13
Av
era
ge
Ag
e
Ye
ars O
ldR
oo
ms
So
urces: STR
and
HV
S
Ou
r survey
of th
e local m
arket sh
ow
s a range o
f lod
ging typ
es and
facilities. We
insp
ected th
e prim
ary com
petito
rs and
evalu
ated all th
e Co
mp
etitive H
otels. T
he
two
full-service in
the co
mp
etitive set, the H
ilton
Stock
ton
and
the D
ou
bleT
ree M
od
esto, are th
e old
est ho
tels.
Figu
re 4-4
presen
ts a sum
mary o
f the o
peratin
g perfo
rman
ce o
f the p
rimary
com
petito
rs for th
e past tw
o years. T
wo
full-service h
otels are in
clud
ed in
the set o
f p
rimary co
mp
etitors. T
he co
nn
ection
of th
e Do
ub
leTree H
otel an
d th
e Pro
po
sed
Ho
tel to th
e MC
P creates jo
int su
pp
ort fo
r even
ts at the M
CP
. Th
e Hilto
n Sto
ckto
n is
the clo
sest facility that co
uld
com
pete w
ith th
e com
bin
ation
of th
e MC
P, D
ou
bleT
ree H
otel an
d th
e Pro
po
sed H
otel.
FIGU
RE 4
-4
20
16
& 2
01
7 P
ERFO
RM
AN
CE O
F THE P
RIM
AR
Y C
OM
PETITIV
E SET
AD
RR
ev
PA
RA
DR
Re
vP
AR
Do
ub
leT
ree
by H
ilton
2
60
75
- 80
%$
13
0 - $
14
0$
10
0 - $
10
57
5 - 8
0%
$1
30
- $1
40
$1
05
- $1
10
Ha
mp
ton
Inn
& S
uite
s
70
75
- 80
11
0 - 1
15
85
- 90
75
- 80
12
0 - 1
25
90
- 95
Hilto
n S
tock
ton
19
87
5 - 8
01
30
- 14
01
00
- 10
57
5 - 8
01
30
- 14
01
05
- 11
0
Sp
ring
Hill S
uite
s b
y Ma
rriott
11
18
0 - 8
51
25
- 13
01
05
- 11
08
0 - 8
51
30
- 14
01
10
- 11
5
To
tals
63
97
9.0
%$
12
8$
10
18
0.2
%$
13
4$
10
7
Pro
pe
rty
Estim
ate
d 2
01
6E
stima
ted
20
17
Occ.
Occ.
Nu
mb
er
of R
oo
ms
So
urces: STR
and
HV
S
Prim
ary Co
mp
etitors

January 22, 2019 Supply and Demand Analysis Proposed Convention Center Hotel - Modesto, California 4-6
HVS ranked the primary competitors on four criteria related to the attractiveness of the property to potential customers.
1. Access – the ease with which customers can gain vehicular or pedestrian access to the property. Simple and direct access routes are rated higher than more complicated routes.
2. Visibility – particularly important to hotels that attract walk-in customers who do not have prior reservations. Signage and building facades typically provide visibility.
3. Neighborhood – means the quality of the surrounding neighborhood, the compatibility of adjacent land uses, the perceived safety of the neighborhood.
4. Physical condition – refers to the overall physical condition of the hotel. Based on an inspection of each property, HVS rated the physical condition of each hotel in comparison to other hotels of a similar scale or class.
Each criterion was rated from one to five, with one indicating very poor compliance with the criteria and five meaning excellent compliance. Figure 4-5 summarizes the results of the rankings for each criterion and shows an aggregate rating that is the average of all criteria.
FIGURE 4-5 RANK OF PRIMARY COMPETITORS ON CUSTOMER SELECTION CRITERIA*
Access Access VisibilityNeighbor-
hood
Physical
Condition
Aggregate
Rating
Proposed Hotel 4 5 5 5 4.75
DoubleTree by Hi l ton Modesto 4 5 5 4 4.50
SpringHi l l Suites by Marriott Modesto 5 5 3 4 4.25
Hampton Inn & Suites Modesto-Sal ida 5 5 3 4 4.25
Hi l ton Stockton 4 4 4 4 4.00
*Ranked on a Scale of 1 to 5 where: 1 = Very Poor, 2 = Poor, 3 = Average, 4 = Good, 5 = Excellent
The Proposed Hotel ranks superior or equal to all of the primary competitors on customer selection criteria. The Proposed Hotel ranks well on physical condition due to new construction.
The secondary competitors consist of eight hotels with 633 rooms and a weighted room count of 484 rooms. Figure 4-6 sets forth the pertinent operating characteristics of the combined secondary competitors.

January 22, 2019 Supply and Demand Analysis Proposed Convention Center Hotel - Modesto, California 4-7
FIGURE 4-6 RECENT PERFORMANCE OF THE SECONDARY COMPETITIVE SET
% Occupancy ADR RevPAR
Fairfield Inn & Suites by Marriott Modesto 69 80% 55 70 - 75 $115 - $120 $80 - $85
Fairfield Inn & Suites by Marriott Turlock 81 80% 65 70 - 75 125 - 130 90 - 95
Hampton Inn & Suites Manteca 101 70% 71 75 - 80 150 - 160 115 - 120
Hampton Inn Turlock 85 80% 68 75 - 80 120 - 125 90 - 95
Hol iday Inn Express & Suites Manteca City 72 70% 50 70 - 75 130 - 140 95 - 100
Hol iday Inn Express & Suites Modesto-Sal ida 95 80% 76 75 - 80 130 - 140 100 - 105
Hol iday Inn Express Oakdale 52 70% 36 65 - 70 110 - 115 70 - 75
Hol iday Inn Express Turlock 78 80% 62 80 - 85 125 - 130 100 - 105
Total 633 484 75.4% $129 $97
Estimated 2017Number of
Rooms
Competitive
Weight
Weighted
RoomsProperty
STR data have certain limitations. Hotels are occasionally added to or removed from the sample and not every property reports data in a consistent and timely manner. These factors can influence the overall quality of the information. These inconsistencies may also cause the STR data to differ from the results of our competitive survey. Nonetheless, STR data provide the best indication of aggregate growth or decline in existing supply and demand; thus, our analysis considers these trends.
Figure 4-7 shows the historical performance of the competitive set including the occupancy rates, ADR, and RevPAR.
Historical Market Performance
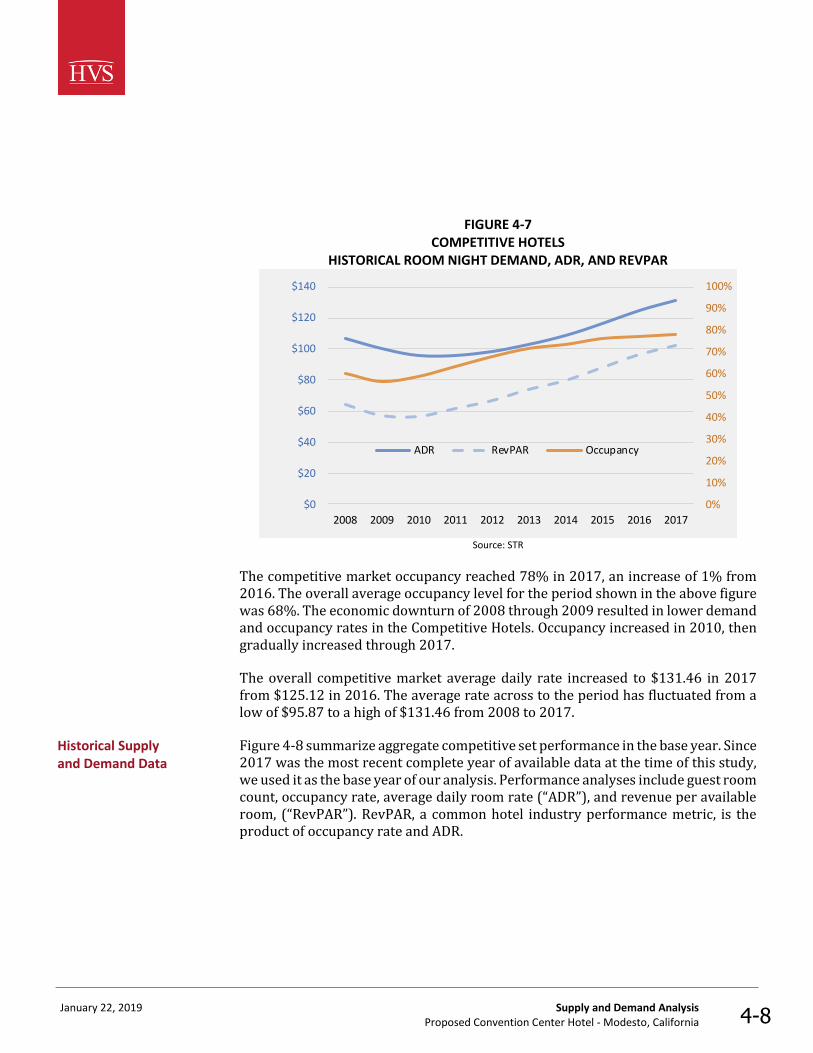
January 22, 2019 Supply and Demand Analysis Proposed Convention Center Hotel - Modesto, California 4-8
FIGURE 4-7 COMPETITIVE HOTELS
HISTORICAL ROOM NIGHT DEMAND, ADR, AND REVPAR
0%
10%
20%
30%
40%
50%
60%
70%
80%
90%
100%
$0
$20
$40
$60
$80
$100
$120
$140
2008 2009 2010 2011 2012 2013 2014 2015 2016 2017
ADR RevPAR Occupancy
Source: STR
The competitive market occupancy reached 78% in 2017, an increase of 1% from 2016. The overall average occupancy level for the period shown in the above figure was 68%. The economic downturn of 2008 through 2009 resulted in lower demand and occupancy rates in the Competitive Hotels. Occupancy increased in 2010, then gradually increased through 2017.
The overall competitive market average daily rate increased to $131.46 in 2017 from $125.12 in 2016. The average rate across to the period has fluctuated from a low of $95.87 to a high of $131.46 from 2008 to 2017.
Figure 4-8 summarize aggregate competitive set performance in the base year. Since 2017 was the most recent complete year of available data at the time of this study, we used it as the base year of our analysis. Performance analyses include guest room count, occupancy rate, average daily room rate (“ADR”), and revenue per available room, (“RevPAR”). RevPAR, a common hotel industry performance metric, is the product of occupancy rate and ADR.
Historical Supply and Demand Data

Janu
ary 22
, 20
19
Su
pp
ly and
De
man
d A
nalysis
P
rop
osed
Co
nven
tion
Cen
ter H
otel - M
od
esto, C
aliforn
ia 4-9
FIGU
RE 4
-8
THE W
EIGH
TED C
OM
PETITIV
E SET HISTO
RIC
AL P
ERFO
RM
AN
CE
Ro
om
Co
un
t
Se
con
da
ry Co
mp
etito
rs4
84
Do
ub
leT
ree
by H
ilton
Mo
de
sto
26
0
Hilto
n S
tock
ton
19
8
Sp
ring
Hill S
uite
s b
y Ma
rriott M
od
es
to1
11
Ha
mp
ton
Inn
& S
uite
s M
od
es
to-S
alid
a7
0
Occu
pa
ncy
Sp
ring
Hill S
uite
s b
y Ma
rriott M
od
es
to8
0 - 8
5%
Do
ub
leT
ree
by H
ilton
Mo
de
sto
75
- 80
%
Hilto
n S
tock
ton
75
- 80
%
Ha
mp
ton
Inn
& S
uite
s M
od
es
to-S
alid
a7
5 - 8
0%
Se
con
da
ry Co
mp
etito
rs7
5%
AD
R
Hilto
n S
tock
ton
$1
30
- $1
40
Sp
ring
Hill S
uite
s b
y Ma
rriott M
od
es
to$
13
0 - $
14
0
Do
ub
leT
ree
by H
ilton
Mo
de
sto
$1
30
- $1
40
Se
con
da
ry Co
mp
etito
rs$
12
9
Ha
mp
ton
Inn
& S
uite
s M
od
es
to-S
alid
a$
12
0 - $
12
5
Re
vP
AR
Sp
ring
Hill S
uite
s b
y Ma
rriott M
od
es
to$
11
0 - $
11
5
Do
ub
leT
ree
by H
ilton
Mo
de
sto
$1
05
- $1
10
Hilto
n S
tock
ton
$1
05
- $1
10
Se
con
da
ry Co
mp
etito
rs$
97
Ha
mp
ton
Inn
& S
uite
s M
od
es
to-S
alid
a$
90
- $9
5
Sou
rces: STR an
d H
VS
Figu
re 4-9
sho
ws year-to
-date th
rou
gh Ju
ne o
ccup
ancy
and
average d
aily roo
m
rates com
pared
to th
e prio
r year for th
e Co
mp
etitive Ho
tels.

January 22, 2019 Supply and Demand Analysis Proposed Convention Center Hotel - Modesto, California 4-10
FIGURE 4-9 CURRENT YEAR DEMAND, OCCUPANCY, ADR, AND REVPAR
Year-to-Date Through September
2017 2018 Percent Change
Room Night Demand 274,375 276,220 0.7%
Avai lable Room Nights 347,256 347,256 0.0%
Occupancy 79.0% 79.5% 0.7%
ADR $131.19 $137.73 5.0%
RevPAR $103.66 $109.55 5.7%
Source: STR
The Competitive Hotel’s occupancy increased, and ADR increased from 2017 levels for the same period, resulting in a higher RevPAR.
Market penetration measures how an individual hotel property performs in comparison to the market. Occupancy penetration is the occupancy of the hotel divided by the market occupancy. Yield penetration is the RevPAR of a hotel divided by the RevPAR of the market. A penetration factor of greater than one indicates a property is performing better than the market. A penetration factor of less than one indicates that a property is underperforming the market. Figure 4-10 shows the occupancy and yield penetrations of the hotels in the competitive set.
FIGURE 4-10 COMPETITIVE HOTEL’S OCCUPANCY AND YIELD PENETRATION
Occupancy Penetration
SpringHi l l Sui tes by Marriott Modesto 100 - 110%
DoubleTree by Hi l ton Modesto 100 - 110%
Hi l ton Stockton 100 - 110%
Hampton Inn & Suites Modesto-Sa l ida 95 - 100%
Secondary Competitors 97%
Yield Penetration
SpringHi l l Sui tes by Marriott Modesto 110 - 120%
DoubleTree by Hi l ton Modesto 100 - 110%
Hi l ton Stockton 100 - 110%
Secondary Competitors 95%
Hampton Inn & Suites Modesto-Sa l ida 85 - 90%
Sources: STR and HVS
Occupancy and Yield Penetration

January 22, 2019 Supply and Demand Analysis Proposed Convention Center Hotel - Modesto, California 4-11
The competitive hotel market shows significant seasonal variation, with October displaying the highest ADR, June the highest occupancy, December with the lowest ADR, and December the lowest occupancy as shown in Figure 4-11.
FIGURE 4-11 SEASONALITY GRAPH OF THE UNWEIGHTED COMPETITIVE SET
$0
$20
$40
$60
$80
$100
$120
0%
10%
20%
30%
40%
50%
60%
70%
80%
Jan Feb Mar Apr May Jun Jul Aug Sep Oct Nov Dec
Occupancy ADR
Source: STR
The high October ADR and June occupancy are attributable to high levels of leisure travel during the summer and fall primarily related to visitation to Yosemite National Park and Stanislaus National Forest. Commercial travel related to seasonal agricultural business also contributes to higher occupancy rates and ADR in the summer and fall seasons. As is typical of many hotel markets, reduced travel around the holidays causes low levels of ADR and occupancy in November and December.
A review of the trends in occupancy, average rate, and RevPAR by the night of the week over the past three years provides some insight into the impact that the current economic conditions have had on the competitive lodging market. Figure 4-12 shows the data provided by Smith Travel Research.
Seasonality
Weekly Patterns of Lodging Demand

January 22, 2019 Supply and Demand Analysis Proposed Convention Center Hotel - Modesto, California 4-12
FIGURE 4-12 OCCUPANCY AND AVERAGE RATE BY DAY OF WEEK
$0
$25
$50
$75
$100
$125
$150
0%
10%
20%
30%
40%
50%
60%
70%
80%
90%
100%
Sun Mon Tue Wed Thu Fri Sat
Occupancy ADR
Source: STR
Leisure travelers and non-business-related groups generate high occupancy on Saturday nights and the peak rate. Commercial travel generates strong demand on Tuesday and Wednesday nights. Figure 4-13 shows the daily and monthly occupancy rates. Green shaded areas indicate above average occupancy rates, and red shaded areas indicate below average occupancy rates.

January 22, 2019 Supply and Demand Analysis Proposed Convention Center Hotel - Modesto, California 4-13
FIGURE 4-13 DAY-OF WEEK OCCUPANCY BY MONTH
Month Sun Mon Tue Wed Thu Fri SatTotal
Month
Oct - 17 48.7% 82.8% 91.2% 95.4% 82.5% 84.3% 95.2% 82.0%
Nov - 17 42.6% 75.2% 83.8% 83.7% 75.2% 76.4% 84.1% 74.8%
Dec - 17 50.8% 77.0% 81.3% 76.8% 61.0% 54.6% 60.2% 64.9%
Jan - 18 43.7% 69.0% 83.9% 86.6% 64.6% 58.0% 69.7% 69.1%
Feb - 18 48.4% 83.4% 93.6% 91.2% 77.4% 67.7% 68.6% 75.7%
Mar - 18 52.7% 88.4% 96.3% 95.1% 71.3% 71.0% 79.7% 78.7%
Apr - 18 50.9% 89.0% 97.0% 96.6% 73.7% 77.5% 90.3% 81.3%
May - 18 55.3% 77.8% 95.3% 95.1% 78.1% 82.5% 94.0% 83.2%
Jun - 18 53.0% 91.2% 97.6% 96.1% 83.1% 80.2% 92.2% 84.9%
Jul - 18 56.7% 85.0% 85.6% 82.5% 77.6% 76.8% 90.4% 78.9%
Aug - 18 59.0% 92.2% 97.7% 94.3% 75.7% 69.2% 85.4% 81.7%
Sep - 18 61.2% 78.0% 94.4% 95.5% 78.0% 75.6% 95.0% 82.2%
Total Year 52.1% 82.3% 91.3% 90.7% 74.9% 72.5% 83.6% 78.1%
Below Average 33.0%Average
Above Average 100.0% Source: STR
The Competitive Hotels show definite patterns of demand, with higher spring & summer demand and lower winter demand, high demand on the weekends & midweek demand and lower demand on Sunday. The occupancy rate on Friday and Saturday exceeds 80% approximately 46% of the time, and on Tuesday and Wednesday, it exceeds 80% approximately 96% of the time.
The combination of high spring and summer demand with already high weekend demand allows properties to charge a premium during certain periods of high occupancy, as shown in Figure 4-14.

January 22, 2019 Supply and Demand Analysis Proposed Convention Center Hotel - Modesto, California 4-14
FIGURE 4-14 DAY OF WEEK AVERAGE RATE BY MONTH
Month Sun Mon Tue Wed Thu Fri SatTotal
Month
Oct - 17 $123 $138 $147 $146 $129 $129 $138 $137
Nov - 17 119 132 140 141 126 125 134 132
Dec - 17 114 129 134 136 128 120 120 126
Jan - 18 117 132 140 140 124 121 122 131
Feb - 18 122 139 145 145 131 120 121 134
Mar - 18 125 140 150 150 133 125 126 136
Apr - 18 124 145 155 153 134 127 134 140
May - 18 124 141 147 147 133 131 140 139
Jun - 18 122 144 153 151 132 131 134 139
Jul - 18 123 144 154 150 133 127 132 139
Aug - 18 123 146 153 149 132 125 131 138
Sep - 18 125 145 154 155 135 130 139 141
Average 122 140 148 147 131 126 132 136
Below Average 33.0%
Average
Above Average 100.0%
Source: STR
Figure 4-15 presents data on the performance of the weighted competitive set. HVS estimated performance results and in some cases weighted data on secondary competitors. In this respect, this information differs from the previously presented STR data.
FIGURE 4-15 WEIGHTED COMPETITIVE SET RECENT MARKET PERFORMANCE
YearRoom Nights
Available
Room Nights
Sold
Competitive
Hotels
Occupancy
Competitive
Hotels ADR
Competitive
Hotels RevPAR
Amount
2015 385,000 293,000 76.1% $116.89 $88.96
2016 393,000 304,000 77.4% $126.22 $97.64
2017 410,000 320,000 78.0% $131.84 $102.90
Percent Change
2016 2.1% 3.8% 1.6% 8.0% 9.8%
2017 4.3% 5.3% 0.9% 4.4% 5.4%
Demand

January 22, 2019 Supply and Demand Analysis Proposed Convention Center Hotel - Modesto, California 4-15
In 2017, growth in demand (5.3%) grew faster than available room nights (4.3%), causing occupancy to rise to 78.0%.
The purpose of segmenting the lodging market is to define each major type of demand, identify customer characteristics, and estimate future growth trends. For the demand analysis, the overall market is divided into three segments based on the nature of travel. Based on our fieldwork and knowledge of the local lodging market, we estimate the 2017 distribution of accommodated room night demand as shown in Figure 4-16.
FIGURE 4-16 WEIGHTED COMPETITIVE HOTELS
ACCOMMODATED ROOM NIGHT DEMAND
Market Segment Room Nights
Commercia l 170,672 53%
Leisure 107,352 34%
Meeting and Group 42,198 13%
Total 320,223 100%
Percent of Total Demand
Commercial demand is the largest market segment, generating 53% of total room night demand.
Commercial demand (53% of total demand) is mainly individual business people passing through the local market or visiting area businesses, in addition to high-volume corporate accounts generated by local firms. Brand loyalty (particularly frequent-traveler programs), as well as location and convenience concerning businesses and amenities, influence lodging choices in this segment. Companies typically designate hotels as “preferred” accommodations in return for more favorable rates. Commercial demand is strongest Monday through Thursday nights, declines significantly on Friday and Saturday, and increases somewhat on Sunday night. In markets where the weekday occupancy often exceeds 90%, some unaccommodated commercial demand is likely to be present. It is relatively constant throughout the year, with marginal declines in late December and during other holiday periods.
Commercial demand in the market is primarily generated by the corporate and manufacturing business parks in Modesto. Some of the companies within the area include CVS, Del Monte Foods, Grainger, Stanislaus Food Products, PetSmart, and Silgan Containers. The Blue Diamond Growers, producers of many soy and nut products, have significant operations in the Modesto area. E & J Gallo Winery is based in Modesto and is considered the largest exporter of California wine; the
Demand Analysis Using Market Segmentation
Commercial Demand

January 22, 2019 Supply and Demand Analysis Proposed Convention Center Hotel - Modesto, California 4-16
company's corporate office and its glass-making division are in the area. The company owns thousands of acres of land throughout the valley used for the production of the grapes used for its numerous brands. The healthcare industry also has a presence in the market, with Kaiser Permanente having a significant workforce in the region. Overall, the market is supported by agriculture-related groups with a strong secondary market from food processing and health care. As the economy continues to recover, demand for area food products is expected to increase, which will result in growth in room demand. If tariffs are expanded by the federal government, this could result in a lower growth rate as other countries retaliate with higher tariffs on agricultural products. This demand is expected to be a strong foundation of commercial demand growth.
Leisure demand (34% of total demand) is from individuals and families spending time in an area or passing through in route to other destinations. Travel purposes include sightseeing, recreation, or visiting friends and relatives. Leisure demand also includes room nights booked through Internet sites such as Expedia, Hotels.com, and Priceline; however, leisure may not be the purpose of the stay. This demand may also include business travelers and group and convention attendees who use these channels to take advantage of any discounts that may be available on these sites. Leisure demand is strongest on Friday and Saturday nights and all week during holiday periods and the spring months. Future leisure demand is related to the overall economic health of the region and the nation. Trends showing changes in state and regional unemployment and disposable personal income correlate strongly with leisure travel levels.
The typical length of stay ranges from one to four days, depending on the destination and travel purpose, and the rate of double occupancy typically ranges from 1.8 to 2.5 people per room. Price sensitivity tends to vary with the product type. All-suite properties with inclusive food and beverage would tend to drive strong leisure room rates while highway properties with limited amenities typically offer more discounted leisure room rates.
Leisure demand in the area is primarily generated by the presence of various wineries in the region and the nearby Napa Valley. Additionally, the Modesto area has several large events including the annual Graffiti Parade and car show. Modesto's central location in California is a convenient destination for travelers to stop on their way to San Francisco, Sacramento, or Yosemite National Park. Leisure demand is also generated by the area universities and sporting events.
The meeting and group demand (13% of total demand) includes meetings, seminars, conventions, trade shows, and similar gatherings of ten or more people. Peak convention demand typically occurs in the spring and fall. Although there are numerous classifications within the meeting and group segment, the primary
Leisure Demand
Meeting and Group Demand

January 22, 2019 Supply and Demand Analysis Proposed Convention Center Hotel - Modesto, California 4-17
categories considered in this analysis are corporate groups, associations, and SMERFE (social, military, educational, religious, fraternal, and ethnic) groups. Corporate groups typically meet during the business week most commonly in the spring and fall months. These groups often are the most profitable for hotels, as they typically pay higher rates and usually generate ancillary revenues including food, beverage, and banquet revenue. SMERFE groups are typically price-sensitive and tend to meet on weekends or during the summer months or holiday season when greater discounts are usually available. They generate limited ancillary revenues. The profile and revenue potential of associations varies depending on the group and the purpose of their meeting or event.
Factors related to group demand considered in our development of growth rates for this segment include the market’s local corporate sources, which generate some group business. In the greater market area, the SMERFE sub-segment within the meeting and group segment is the strongest. The same companies that create commercial demand also generate meeting and group demand through training activities and corporate social events. High school and collegiate sports teams, SMERFE groups, and social events, such as weddings and family reunions, also contribute to this demand segment. The property will benefit from room night demand generated by events held at the MCP.
Like commercial demand, meeting and group demand in the market area is driven by the local corporate entities in the area, such as Blue Diamond Growers, as well as regional SMERFE-related sources. Furthermore, recruiting and training activities associated with E & J Gallo Winery, Pacific Gas & Electric, Kaiser Permanente Medical Center, Sutter Gould Medical Foundation, and Doctors Medical Center provides group demand in the market. The presence of numerous wineries in the region that feature scenic grounds and reception areas, but lack on-site lodging facilities, makes the area attractive for weddings and reunions. We expect modest growth to occur in this segment.
Figure 4-17 shows a summary of the historical performance of the competitive set. Although local demand has grown, supply has grown at a faster rate, causing a modest decline in occupancy.
Summary of the Competitive Properties
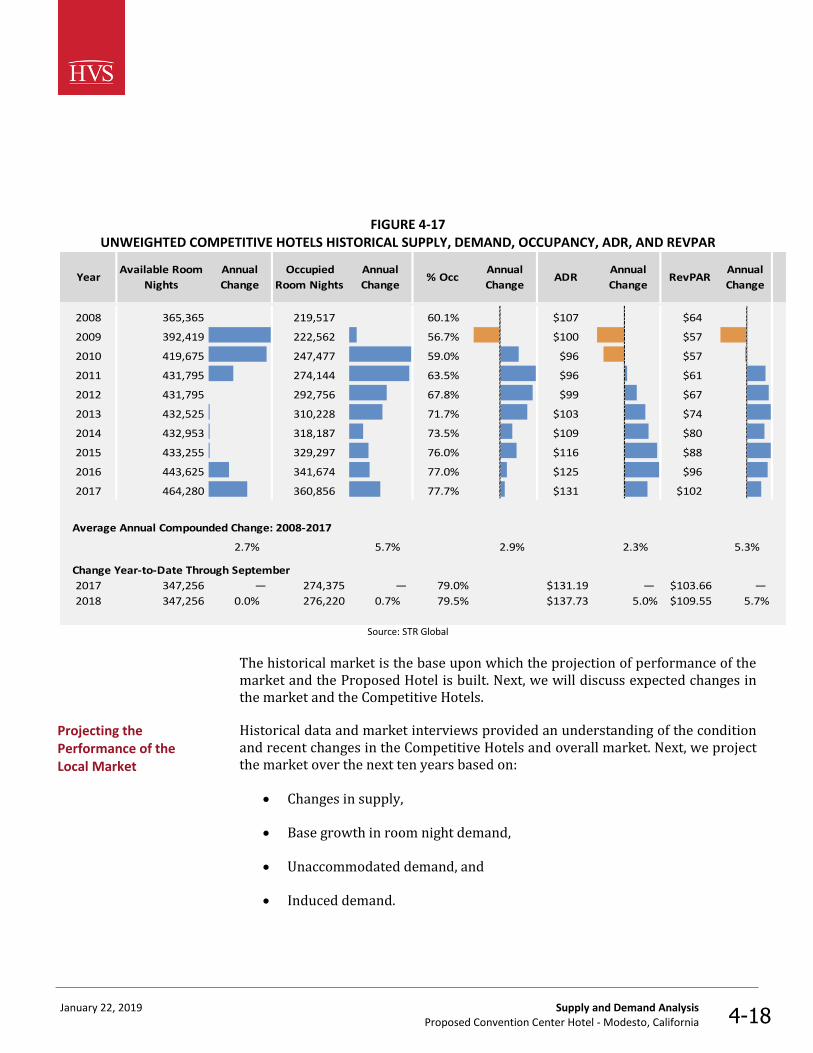
January 22, 2019 Supply and Demand Analysis Proposed Convention Center Hotel - Modesto, California 4-18
FIGURE 4-17 UNWEIGHTED COMPETITIVE HOTELS HISTORICAL SUPPLY, DEMAND, OCCUPANCY, ADR, AND REVPAR
YearAvailable Room
Nights
Annual
Change
Occupied
Room Nights
Annual
Change% Occ
Annual
ChangeADR
Annual
ChangeRevPAR
Annual
Change
2008 365,365 219,517 60.1% $107 $64
2009 392,419 222,562 56.7% $100 $57
2010 419,675 247,477 59.0% $96 $57
2011 431,795 274,144 63.5% $96 $61
2012 431,795 292,756 67.8% $99 $67
2013 432,525 310,228 71.7% $103 $74
2014 432,953 318,187 73.5% $109 $80
2015 433,255 329,297 76.0% $116 $88
2016 443,625 341,674 77.0% $125 $96
2017 464,280 360,856 77.7% $131 $102
Average Annual Compounded Change: 2008-2017
2.7% 5.7% 2.9% 2.3% 5.3%
Change Year-to-Date Through September
2017 347,256 — 274,375 — 79.0% $131.19 — $103.66 —
2018 347,256 0.0% 276,220 0.7% 79.5% $137.73 5.0% $109.55 5.7%
Source: STR Global
The historical market is the base upon which the projection of performance of the market and the Proposed Hotel is built. Next, we will discuss expected changes in the market and the Competitive Hotels.
Historical data and market interviews provided an understanding of the condition and recent changes in the Competitive Hotels and overall market. Next, we project the market over the next ten years based on:
• Changes in supply,
• Base growth in room night demand,
• Unaccommodated demand, and
• Induced demand.
Projecting the Performance of the Local Market
I
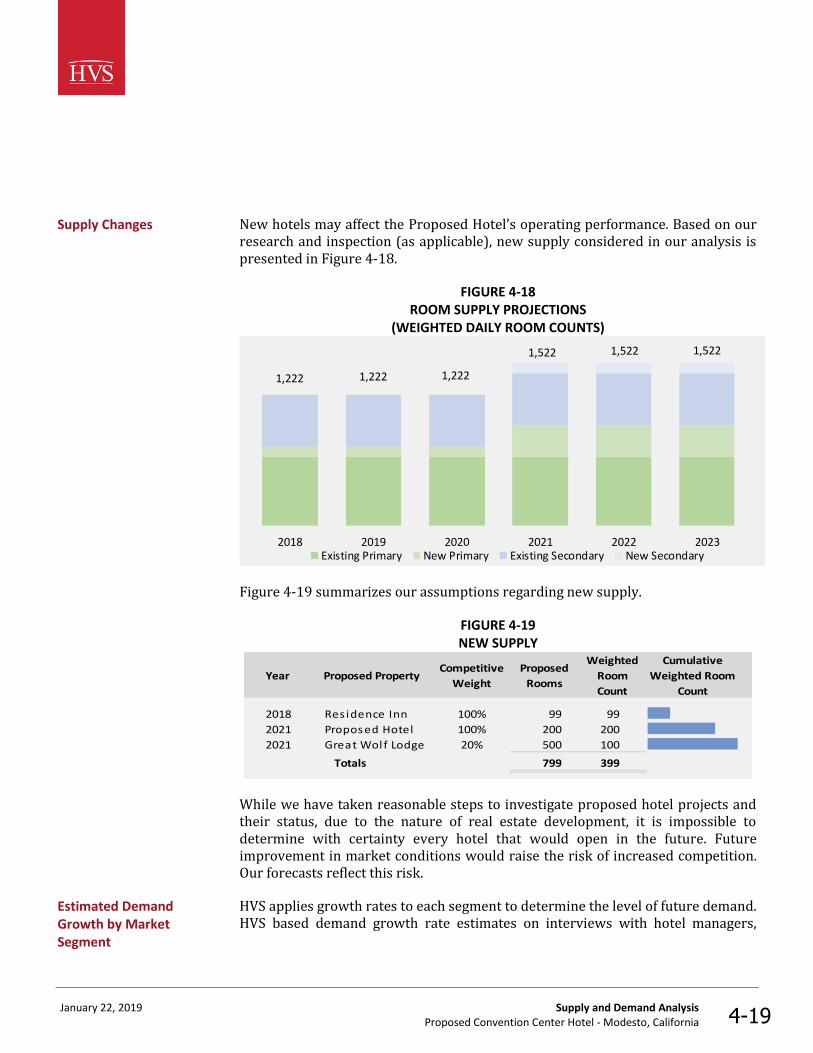
January 22, 2019 Supply and Demand Analysis Proposed Convention Center Hotel - Modesto, California 4-19
New hotels may affect the Proposed Hotel’s operating performance. Based on our research and inspection (as applicable), new supply considered in our analysis is presented in Figure 4-18.
FIGURE 4-18 ROOM SUPPLY PROJECTIONS
(WEIGHTED DAILY ROOM COUNTS)
1,222 1,222 1,222
1,522 1,522 1,522
2018 2019 2020 2021 2022 2023Existing Primary New Primary Existing Secondary New Secondary
Figure 4-19 summarizes our assumptions regarding new supply.
FIGURE 4-19 NEW SUPPLY
Year Proposed PropertyCompetitive
Weight
Proposed
Rooms
Weighted
Room
Count
Cumulative
Weighted Room
Count
2018 Res idence Inn 100% 99 99
2021 Proposed Hotel 100% 200 200
2021 Great Wolf Lodge 20% 500 100
Totals 799 399
While we have taken reasonable steps to investigate proposed hotel projects and their status, due to the nature of real estate development, it is impossible to determine with certainty every hotel that would open in the future. Future improvement in market conditions would raise the risk of increased competition. Our forecasts reflect this risk.
HVS applies growth rates to each segment to determine the level of future demand. HVS based demand growth rate estimates on interviews with hotel managers,
Supply Changes
Estimated Demand Growth by Market Segment

January 22, 2019 Supply and Demand Analysis Proposed Convention Center Hotel - Modesto, California 4-20
assessment of occupancy trends, economic and demographic data, and identification of demand generators.
Figure 4-20 shows estimated base growth rates by market segment through the stabilization of demand.
FIGURE 4-20 ESTIMATED ANNUAL BASE GROWTH RATES BY MARKET SEGMENTS
0.00%
0.50%
1.00%
1.50%
2.00%
2.50%
3.00%
3.50%
4.00%
2018 2019 2020 2021 2022 2023
Commercial Meeting and Group Leisure Base Demand Growth
Base demand is increased in 2019 due to the opening of the Residence Inn in Modesto. The opening of the Proposed Hotel and the Great Wolf Lodge causes an increase in base demand in 2021.
Latent demand reflects potential room night demand that has not been realized by the existing competitive supply. Unaccommodated demand and induced demand make up latent demand.
Unaccommodated demand refers to individuals who are unable to secure accommodations in the market because all the local hotels are filled. These travelers must defer their trips, settle for less desirable accommodations, or stay in properties located outside the market area. Because this demand did not yield occupied room nights, it is not included in the estimate of historically accommodated room night demand. If additional lodging facilities are expected to enter the market, it is reasonable to assume that these guests would be able to secure hotel rooms in the future, and it is, therefore, necessary to quantify this demand.
Latent Demand
Unaccommodated Demand

January 22, 2019 Supply and Demand Analysis Proposed Convention Center Hotel - Modesto, California 4-21
The seasonality of the market indicates that although year-end occupancy may not average more than 70%, the market sells out many nights during the year, indicating unaccommodated demand. The primary source of unaccommodated demand is the popular spring season, which has historically had the highest occupancy rates. Figure 4-21 presents our estimate of unaccommodated demand.
FIGURE 4-21 UNACCOMMODATED DEMAND ESTIMATE
Market SegmentTotal Room
Nights
% of
Total
Leisure 107,352 16.4% 17,616
Commercia l 170,672 3.7% 6,284
Meeting and Group 42,198 5.8% 2,434
Total 320,223 8.2% 26,334
Unaccommodated
Room Nights
Utilizing monthly and weekly peak demand and sell-out trends, we estimate that 8.2% of the base-year demand is unaccommodated.
Induced demand represents the additional room nights attracted to the market following the introduction of a new demand generator. Situations that can result in induced demand include the opening of a new manufacturing plant, the opening or expansion of a convention center, or the addition of a new hotel with a distinct chain affiliation or unique facilities.
Figure 4-22 shows estimated induced demand for room nights that would enter the competitive set over a three-year ramp-up period.
FIGURE 4-22 TIMING OF INDUCED DEMAND
YearMeeting and
GroupLeisure
2021 6,585 6,240 12,825
2022 11,288 7,800 19,088
2023 14,178 7,800 21,978
2024 14,178 7,800 21,978
Total Induced Room
Nights
The facilities at the Proposed Hotel and the improvements to the MCP induce the meeting and group demand into the competitive set. The opening of the Great Wolf
Induced Demand

January 22, 2019 Supply and Demand Analysis Proposed Convention Center Hotel - Modesto, California 4-22
Lodge in Manteca is expected to induce the leisure demand into the competitive set due to its extensive dining, lounge, entertainment, and large waterpark.
Four variables make up accommodated demand: 1) base demand—sources currently generating room nights, 2) previously unaccommodated demand absorbed due to growth in room supply, and 3) induced demand that is new to the market. These estimates are adjusted by 4) residual demand—the estimated number of room nights not accommodated due to supply constraints. Figure 4-23 breaks down room night demand by these sources.
FIGURE 4-23 ANNUAL ROOM NIGHT DEMAND BY SOURCE FOR THE COMPETITIVE HOTELS
Source 2017 2018 2019 2020 2021 2022 2023
Base Accommodated 320,000 323,000 331,000 336,000 347,000 353,000 357,000
Previous ly Unaccommodated 26,000 26,000 26,000 26,000 26,000 26,000 26,000
Induced 0 0 0 0 13,000 19,000 22,000
Total Avai lable Demand 346,000 349,000 357,000 362,000 386,000 398,000 405,000
(Less Res idual Demand) (26,000) (25,000) (20,000) (21,000) 0 0 0Total Accommodated Demand 320,000 324,000 337,000 341,000 386,000 398,000 405,000
Accommodated Demand Change 5.4% 1.3% 4.0% 1.4% 13.3% 3.5% 1.7%
Avai lable Room Night Change 4.2% 1.5% 7.2% 0.0% 24.6% 0.0% 0.0%
Marketwide Occupancy 78% 78% 76% 77% 70% 72% 74%
The growth in accommodated demand in 2019 is due to the opening of the Residence Inn in Modesto, which will provide needed rooms to the market. The growth in accommodated demand in 2021 is due to both the opening of the Great Wolf Lodge in Manteca and the Proposed Hotel in Modesto. The high occupancy rates in the market provide the basis for accommodated demand to grow when new rooms are added to the market.
Over the projection period for demand growth, which ends in the first stabilized year, room night demand is estimated to grow at a compound average annual rate of 4.4%. HVS used these demand projections to forecast the Proposed Hotel's occupancy and average rate.
The projected growth in room night demand within Competitive Hotels provides the foundation for the development of additional hotel rooms. Three new hotels, the Residence Inn in Modesto, the Great Wolf Lodge in Manteca, and the Proposed Hotel will enter the competitive set. Market demand growth and supply growth are balanced resulting in little change in occupancy rates after the Proposed Hotel has
Accommodated Demand and Market-wide Projected Occupancy
Conclusion

January 22, 2019 Supply and Demand Analysis Proposed Convention Center Hotel - Modesto, California 4-23
stabilized. In the next chapter, the Proposed Hotel will be positioned by market demand segment to determine the stabilized occupancy rate for the Proposed Hotel.

Convention, Sports & Entertainment Facilities Consulting Chicago, Illinois
January 22, 2019 Modesto Centre Plaza Demand Analysis Proposed Convention Center Hotel Modesto, California 5-1
5. Modesto Plaza Centre Demand Analysis
The proposed convention hotel would allow the Modesto Centre Plaza (“MCP”) to compete more effectively for state and regional conferences. The availability of lodging adjacent to a convention center is a key selection criterion for meeting planners and a primary point of comparison among competing venues. As conference centers across the U.S. have developed hotel properties to meet this demand, the lack of sufficient lodging in Modesto to serve conference meetings space has decreased the desirability of the MCP and impeded its efforts to book quality events.
In addition to assessing the effects of new hotel development on the MCP, we reviewed the operating policies of the MCP, current tenant agreements, and the overall condition of the MCP.
The MCP houses approximately 23,000 square feet of function space, including the 16,000-square-foot Harvest Hall, the 3,000 square-foot Arbor Theater, and two meeting rooms.
MCP LOBBY
Modesto Centre Plaza

Convention, Sports & Entertainment Facilities Consulting Chicago, Illinois
January 22, 2019 Modesto Centre Plaza Demand Analysis Proposed Convention Center Hotel Modesto, California 5-2
HARVEST HALL
LOWER LEVEL MEETING ROOMS
Convention, Sports & Entertainment Facilities Consulting Chicago, Illinois
January 22, 2019 Modesto Centre Plaza Demand Analysis Proposed Convention Center Hotel Modesto, California 5-3
OUTDOOR PLAZA
The MCP staff provided HVS with a summary of the number of events and corresponding total attendance that occurred at the facility for calendar years 2013 through 2017. Figure 5-1 presents the event and attendance history at the MCP for the past five years. Data does not include events hosted by the DoubleTree Hotel.
Historical Modesto Centre Plaza Demand

Convention, Sports & Entertainment Facilities Consulting Chicago, Illinois
January 22, 2019 Modesto Centre Plaza Demand Analysis Proposed Convention Center Hotel Modesto, California 5-4
FIGURE 5-1 SUMMARY OF MCP DEMAND HISTORY
2013 2014 2015 2016 2017
Events
Conferences 5 7 4 7 8
Meetings 224 223 184 183 206
Trade Shows 5 3 3 4 5
Consumer Shows 21 12 17 15 22
Assembl ies 16 31 48 34 51
Banquets & Socia l 49 47 37 34 35
Testing 2 5 10 7 6
Sports & Competitions 4 6 4 4 3
Concerts & Enterta inment 13 11 3 11 6
Other 18 4 2 1 2
Total 357 349 312 300 344
Attendees
Conferences 3,620 6,200 3,950 5,492 5,880
Meetings 27,515 25,324 16,402 19,156 28,517
Trade Shows 3,950 2,050 1,800 3,550 2,950
Consumer Shows 32,350 19,000 22,460 23,950 36,150
Assembl ies 13,649 16,830 14,216 15,676 8,853
Banquets & Socia l 16,420 14,230 11,345 8,940 11,040
Testing 1,850 1,604 2,017 1,134 965
Sports & Competitions 675 1,715 1,375 1,375 745
Concerts & Enterta inment 4,292 4,722 3,080 7,798 2,780
Other 3,212 840 5,000 1,000 1,150
Total 107,533 92,515 81,645 88,071 99,030
Source: Modesto Centre Plaza
In recent years, event demand and attendance levels have been varying between 200 and 357 events per year. The MCP currently hosts a variety of events, including conferences and trade shows that attract both local and non-local attendees. Meetings and banquets produce the greatest number of events at the MCP and are primarily hosted by local corporations and civic organizations. Other local-based events include consumer shows, testing, sports competitions, and entertainment events.
With well over 300 annual events, the MCP is an active venue with an overall occupancy rate of nearly 70%. Most events attract attendees from Modesto and surrounding markets, and attendees typically do not require overnight lodging. Under the MCP’s current booking policy, outside of 13 months MCP spaces are reserved for conferences and other events that would generate overnight lodging in the market. Within 13 months of the event date, local events can book the venue. This booking policy has resulted in an event profile that is skewed towards local

Convention, Sports & Entertainment Facilities Consulting Chicago, Illinois
January 22, 2019 Modesto Centre Plaza Demand Analysis Proposed Convention Center Hotel Modesto, California 5-5
events filling event dates and making them unavailable for conferences. Currently, this policy is under review to allow for more booking of non-local events.
The MCP competes with a variety of local meeting and banquet venues for local meetings, banquets, and other events. Figure 5-2 presents the total amount of function space and the maximum banquet capacity of venues within the local market.
FIGURE 5-2 LOCAL COMPETITORS IN MODESTO
Venue NameMax. Banquet
Capacity
Total
Function
Space (sf)
Princeton Event Center * 800 11,000
Clarion Inn & Conference Center 600 10,800
Greens Events 500 7,000
The Seasons Catering & McHenry Event Center 475 5,500
Cal i fornia Ba l l room 300 7,500
The Century 300 6,000
Monsoon Indian Restaurant & Banquet Hal l 300 6,000
Red Event Center 300 6,000
Chari ty Way Banquet Hal l 300 6,000
Modesto Masonic Hal l 200 7,500
* Formerly Modesto Banquet Hal l
Source: Respective Venues
Most of the above facilities contain a single banquet hall, suitable for weddings, parties, and large assemblies. In addition to a large banquet hall, the Century, Clarion Inn, and Charity Way Banquet Hall also offer meetings rooms, available as breakout meeting space or smaller meetings and banquets. In addition to the above venues, several other local restaurants offer private banquet rooms for smaller parties and meetings.
The MCP also competes with convention centers throughout the Central Valley. This analysis of comparable venues provides a basis for developing program recommendations and forecasts of event demand. HVS compared the function spaces, adjacent hotel capacities, and characteristics of the market relevant to the success of a convention center.
Event planners select host cities for their events based on a wide range of criteria. These factors include the attributes of the convention facilities, lodging supply, the economic and demographic profile of the community, transportation access, tourism amenities, and overall destination appeal. At a minimum, a city must offer an event venue that meets user needs and for events that require lodging, providing
Competitive and Comparable Venues

Convention, Sports & Entertainment Facilities Consulting Chicago, Illinois
January 22, 2019 Modesto Centre Plaza Demand Analysis Proposed Convention Center Hotel Modesto, California 5-6
enough hotel rooms near the venue. The prices of venue rentals and hotel rooms are also important to event planners. Cities that meet these threshold criteria must then compete based on their destination appeal.
HVS analyzed two sets of venues and destinations.
• Convention and conference centers in the Central Valley that could compete with the Modesto Centre Plaza for state and regional events and
• Convention and conference center markets throughout the U.S. that are of similar population size to Modesto, California.
The venues and their locations are listed in Figure 5-3 along with their location and the amount of rentable function space of various types.
FIGURE 5-3 COMPETITIVE AND COMPARABLE VENUES
Name of Venue Location
Total
Function
Space
(sf)
Exhibiton
Space
Ballroom
Space
Meeting
Space
In-State Competitors
Santa Clara Convention Center Santa Clara 157,461 90,016 44,968 121,409
Fresno Convention Center Fresno 131,919 66,371 32,400 33,148
Ontario Convention Center Ontario 115,187 69,325 19,626 26,236
Visa l ia Convention Center Visa l ia 52,754 31,675 8,316 12,763
Rabobank Arena and Convention Center Bakers field 39,099 29,450 0 9,649
Monterey Conference Center Monterey 31,633 0 28,880 2,753
Modesto Centre Plaza Modesto 23,000 16,000 0 7,000
South San Francisco Conference Center S San Francisco 20,500 0 13,500 7,000
Stockton Memoria l Civic Auditorium Stockton 14,836 0 10,248 4,588
Centre Concord Concord 11,978 0 8,833 3,145
National Comparables
Lancaster Convention Center Lancaster 75,287 46,508 18,420 10,359
Century Center South Bend 70,437 24,472 28,267 17,698
Augusta Convention Center Augusta 61,215 37,791 10,758 12,666
Old National Events Plaza Evansvi l le 59,932 36,252 13,312 10,368
Bayfront Convention Center Erie 56,323 28,800 13,500 14,023
RiverCenter Davenport 53,751 32,400 13,130 8,221
John S. Knight Convention Center Akron 53,393 28,640 11,678 13,075
Utah Val ley Convention Center Provo 46,545 19,620 16,894 10,031
KI Convention Center Green Bay 41,801 17,640 17,797 6,364
Durham Convention Center Durham 31,762 0 15,496 16,266
Salem Convention Center Salem 24,290 0 11,400 12,890
Modesto Centre Plaza Modesto 23,000 16,000 0 7,000
Source: Respective Venues

Convention, Sports & Entertainment Facilities Consulting Chicago, Illinois
January 22, 2019 Modesto Centre Plaza Demand Analysis Proposed Convention Center Hotel Modesto, California 5-7
The above analysis of function space does not include meeting and banquet spaces within an adjacent hotel if any. With around 23,000 square feet of function space, the MCP is below average among in-state competitors. Many venues offer significantly more rentable space in all categories. Among metropolitan markets of similar size, Modesto’s convention center is the smallest, suggesting more limited ability to book larger events and simultaneous smaller events.
The quality and proximity of hotel supply are important selection factors for conference organizers. To attract out-of-town groups, an adequate supply of nearby hotel rooms should support the lodging needs of delegates, exhibitors, and other attendees. Event planners consider proximity and connectivity as critical factors when evaluating the overall hotel package. The number of rooms offered at adjacent or connected hotels is a key point of comparison. Other important factors include hotel brands, service levels, building conditions, quality of service, ease of access, and available meeting and banquet spaces in these hotels.
Figure 5-4 compares the number of adjacent hotel rooms in the comparable and competitive venues.
Adjacent Hotel Capacity

Co
nve
nti
on
, Sp
ort
s &
En
tert
ain
men
t
Faci
litie
s C
on
sult
ing
Ch
icag
o, I
llin
ois
Jan
uar
y 2
2, 2
01
9
Mo
de
sto
Ce
ntr
e P
laza
De
man
d A
nal
ysis
Pro
po
sed
Co
nve
nti
on
Cen
ter
Ho
tel M
od
esto
, Cal
ifo
rnia
5-8
FIG
UR
E 5
-4
AD
JAC
ENT
HO
TEL
RO
OM
S IN
CO
MP
AR
AB
LE V
ENU
ES
In-S
tate
Co
mp
eti
tors
Na
me
Loca
tio
nA
dja
cen
t H
ote
l R
oo
ms
Mo
nte
rey
Co
nfe
ren
ce C
en
ter
Mo
nte
rey
82
5
Sa
nta
Cla
ra C
on
ven
tio
n C
en
ter
Sa
nta
Cla
ra5
05
On
tari
o C
on
ven
tio
n C
en
ter
On
tari
o4
84
Fre
sn
o C
on
ven
tio
n &
En
tert
ain
me
nt
Ce
nte
rF
res
no
32
1
Mo
de
sto
Ce
ntr
e P
laza
Mo
de
sto
26
0
Ra
bo
ba
nk
Are
na
Th
ea
ter
an
d C
on
ven
tio
n C
en
ter
Ba
ke
rsfi
eld
25
9
So
uth
Sa
n F
ran
cis
co C
on
fere
nce
Ce
nte
rS
Sa
n F
ran
cis
co2
36
Vis
ali
a C
on
ven
tio
n C
en
ter
Vis
ali
a1
95
Sto
ckto
n M
em
ori
al
Civ
ic A
ud
ito
riu
mS
tock
ton
17
9
Ce
ntr
e C
on
cord
Co
nco
rd0
Ave
rag
e3
63
Na
tio
na
l C
om
pa
rab
les
Na
me
Loca
tio
nA
dja
cen
t H
ote
l R
oo
ms
Ce
ntu
ry C
en
ter
So
uth
Be
nd
47
4
Old
Na
tio
na
l E
ven
ts P
laza
Eva
ns
vill
e4
71
Uta
h V
all
ey
Co
nve
nti
on
Ce
nte
rP
rovo
46
3
KI
Co
nve
nti
on
Ce
nte
rG
ree
n B
ay
35
6
Au
gu
sta
Co
nve
nti
on
Ce
nte
rA
ug
us
ta3
49
Lan
cas
ter
Co
nve
nti
on
Ce
nte
rLa
nca
ste
r3
00
Mo
de
sto
Ce
ntr
e P
laza
Mo
de
sto
26
0
Riv
erC
en
ter
Da
ven
po
rt2
21
Ba
yfro
nt
Co
nve
nti
on
Ce
nte
rE
rie
20
0
Sa
lem
Co
nve
nti
on
Ce
nte
rS
ale
m1
93
Du
rha
m C
on
ven
tio
n C
en
ter
Du
rha
m1
90
Joh
n S
. K
nig
ht
Co
nve
nti
on
Ce
nte
rA
kro
n0
Ave
rag
e3
16
So
urc
e: R
esp
ecti
ve V
enu
es
Th
e n
um
ber
of
ho
tel
roo
ms
adja
cen
t to
th
e M
CP
is
bel
ow
av
erag
e am
on
g b
oth
co
mp
arab
le v
enu
e se
ts b
ut
is a
pp
rop
riat
e w
ith
th
e am
ou
nt
of
fun
ctio
n s
pac
e in
th
e D
ou
ble
Tre
e H
ote
l an
d M
CP
un
der
th
e cu
rren
t o
per
atin
g m
od
el.
Mar
ket
fa
cto
rs,
such
as
p
op
ula
tio
n,
med
ian
h
ou
seh
old
in
com
e,
and
b
usi
nes
s es
tab
lish
men
ts h
elp
det
erm
ine
the
rela
tive
str
engt
h o
f th
e lo
cal e
con
om
y, it
s ab
ilit
y to
gen
erat
e lo
cal e
ven
ts, a
nd
att
end
ance
po
ten
tial
. A s
tro
ng
loca
l co
rpo
rate
pre
sen
ce
ind
icat
es a
gre
ater
ab
ilit
y to
bo
ok
co
rpo
rate
mee
tin
gs a
nd
att
ract
in
du
stry
-wid
e ev
ents
. Co
mm
un
itie
s w
ith
larg
er p
op
ula
tio
ns
hav
e a
grea
ter
po
ten
tial
fo
r w
edd
ings
, p
arti
es a
nd
oth
er s
oci
al e
ven
ts a
nd
fo
r la
rger
att
end
ance
at
pu
bli
c ev
ents
. W
e co
mp
are
Mo
des
to t
o t
he
com
pet
itiv
e an
d c
om
par
able
mar
ket
s to
ass
ess
the
rela
tive
ab
ilit
y to
su
pp
ort
eve
nts
an
d t
o g
ener
ate
loca
l eve
nts
an
d a
tten
dan
ce.
Mar
ket
Co
mp
aris
on
s
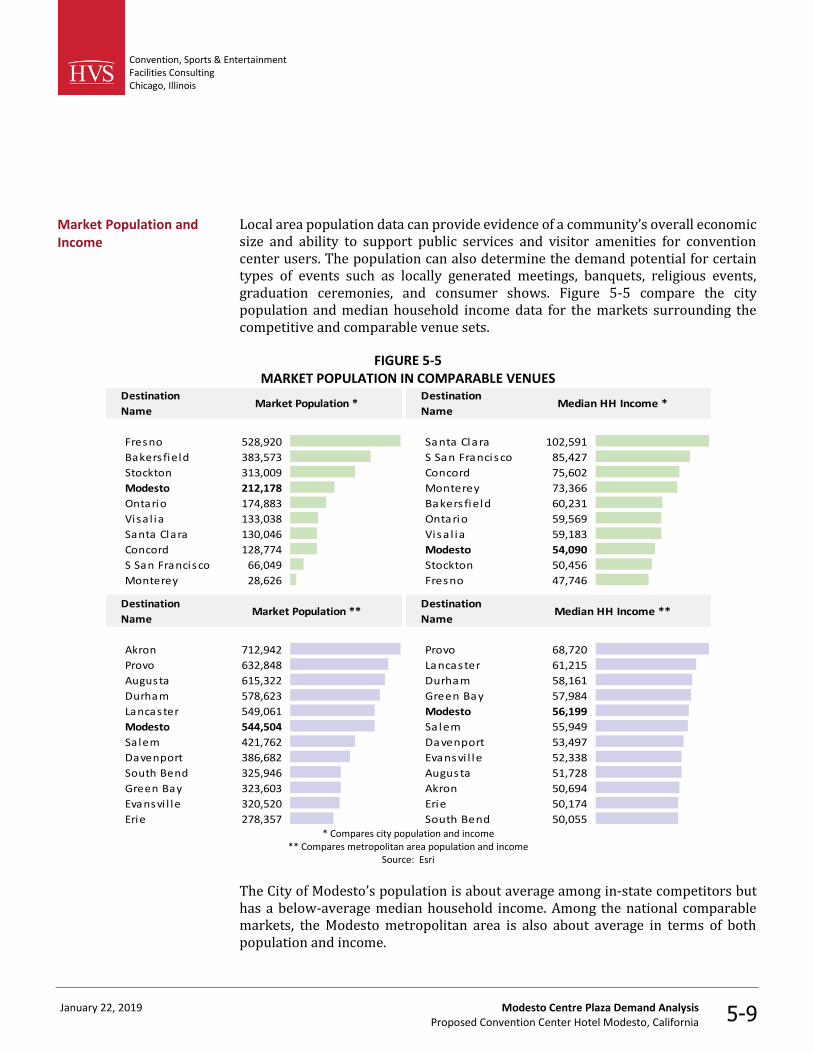
Convention, Sports & Entertainment Facilities Consulting Chicago, Illinois
January 22, 2019 Modesto Centre Plaza Demand Analysis Proposed Convention Center Hotel Modesto, California 5-9
Local area population data can provide evidence of a community’s overall economic size and ability to support public services and visitor amenities for convention center users. The population can also determine the demand potential for certain types of events such as locally generated meetings, banquets, religious events, graduation ceremonies, and consumer shows. Figure 5-5 compare the city population and median household income data for the markets surrounding the competitive and comparable venue sets.
FIGURE 5-5 MARKET POPULATION IN COMPARABLE VENUES
Destination
NameMarket Population *
Fresno 528,920
Bakers field 383,573
Stockton 313,009
Modesto 212,178
Ontario 174,883
Visa l ia 133,038
Santa Clara 130,046
Concord 128,774
S San Francisco 66,049
Monterey 28,626
Destination
NameMarket Population **
Akron 712,942
Provo 632,848
Augusta 615,322
Durham 578,623
Lancaster 549,061
Modesto 544,504
Salem 421,762
Davenport 386,682
South Bend 325,946
Green Bay 323,603
Evansvi l le 320,520
Erie 278,357
Destination
NameMedian HH Income *
Santa Clara 102,591
S San Francisco 85,427
Concord 75,602
Monterey 73,366
Bakers field 60,231
Ontario 59,569
Visa l ia 59,183
Modesto 54,090
Stockton 50,456
Fresno 47,746
Destination
NameMedian HH Income **
Provo 68,720
Lancaster 61,215
Durham 58,161
Green Bay 57,984
Modesto 56,199
Salem 55,949
Davenport 53,497
Evansvi l le 52,338
Augusta 51,728
Akron 50,694
Erie 50,174
South Bend 50,055 * Compares city population and income
** Compares metropolitan area population and income Source: Esri
The City of Modesto’s population is about average among in-state competitors but has a below-average median household income. Among the national comparable markets, the Modesto metropolitan area is also about average in terms of both population and income.
Market Population and Income

Convention, Sports & Entertainment Facilities Consulting Chicago, Illinois
January 22, 2019 Modesto Centre Plaza Demand Analysis Proposed Convention Center Hotel Modesto, California 5-10
The density and breadth of a city’s corporate base indicate demand potential in the meetings industry. Businesses generate demand for conventions, conferences, training, and other industry-specific events. Figure 5-6 demonstrate how the area compares with the competitive and comparable markets with respect to the total number of business establishments.
FIGURE 5-6 NUMBER OF BUSINESS ESTABLISHMENTS IN COMPARABLE MARKETS
Destination
NameBusiness Establishments *
Fresno 19,028
Bakers field 10,552
Stockton 8,089
Santa Clara 6,721
Ontario 6,383
Modesto 6,370
Concord 4,734
Visa l ia 4,576
S San Francisco 3,029
Monterey 2,766
Destination
NameBusiness Establishments **
Akron 20,912
Lancaster 19,610
Durham 18,935
Augusta 18,674
Provo 15,247
Modesto 14,918
Davenport 14,031
Sa lem 12,951
Green Bay 11,750
Evansvi l le 10,845
South Bend 10,478
Erie 9,830 * Compares city population and income
** Compares metropolitan area population and income Source: Esri
Modesto’s business presence is in the mid-range among in-state competitors, suggesting an average ability to generate local corporate demand for events. Compared to the national comparable markets, Modesto compares favorably with an average number of businesses.
Corporate Comparison
Convention, Sports & Entertainment Facilities Consulting Chicago, Illinois
January 22, 2019 Modesto Centre Plaza Demand Analysis Proposed Convention Center Hotel Modesto, California 5-11
The availability of amenities that support visitation and the overall attractiveness of a destination play important roles in event planner decisions. To assess the suitability of a city for convention center events, we defined the destination as the city in which the venue is located.
HVS used Esri Business Analyst Online (“Esri”) to compare the suitability of an event destination to competitive cities. Esri is a well-regarded forecasting service that applies geographic information system technology (“GIS”) to produce extensive demographic, consumer spending, and business data analyses. Esri employs a sophisticated location-based model to forecast economic and demographic trends. Esri models rely on U.S. census data, the American Community Survey, and other primary research.
Using ESRI data, HVS ranked the in-state convention centers in the competitive set on six indicators of destination quality.
• 2017 Median Household Income—Median household income provides an overall measure of a community's well-being. It indicates a community’s ability to support and sustain a venue and its surrounding neighborhood and market.
• Total Daytime Population—Daytime population indicates the number of people who are in the area during the day. This includes those who work and those who live in the area but are too young to work, unemployed or not in the labor force. It indicates an area's ability to handle an influx of visitors and provide adequate food, beverage, and entertainment options.
• Hotel and Lodging Businesses—The quality and proximity of hotel supply represents one of the most important selection factors for facility users in recent years. To attract out-of-town groups, an adequate supply of nearby hotel rooms should support the lodging needs of delegates, exhibitors, and other attendees.
• Food Service and Drinking Businesses—The presence of ample restaurants, bars and other outlets that support local and tourism visitation is an important feature of an attractive destination.
• Arts, Entertainment, and Recreation Businesses —Arts, entertainment, and recreation venues enhance the quality and attractiveness of a destination.
• Storefront Businesses—Visitors value access to food and beverage stores, clothing and accessory stores, sports, hobby and music stores.
Destination Analysis
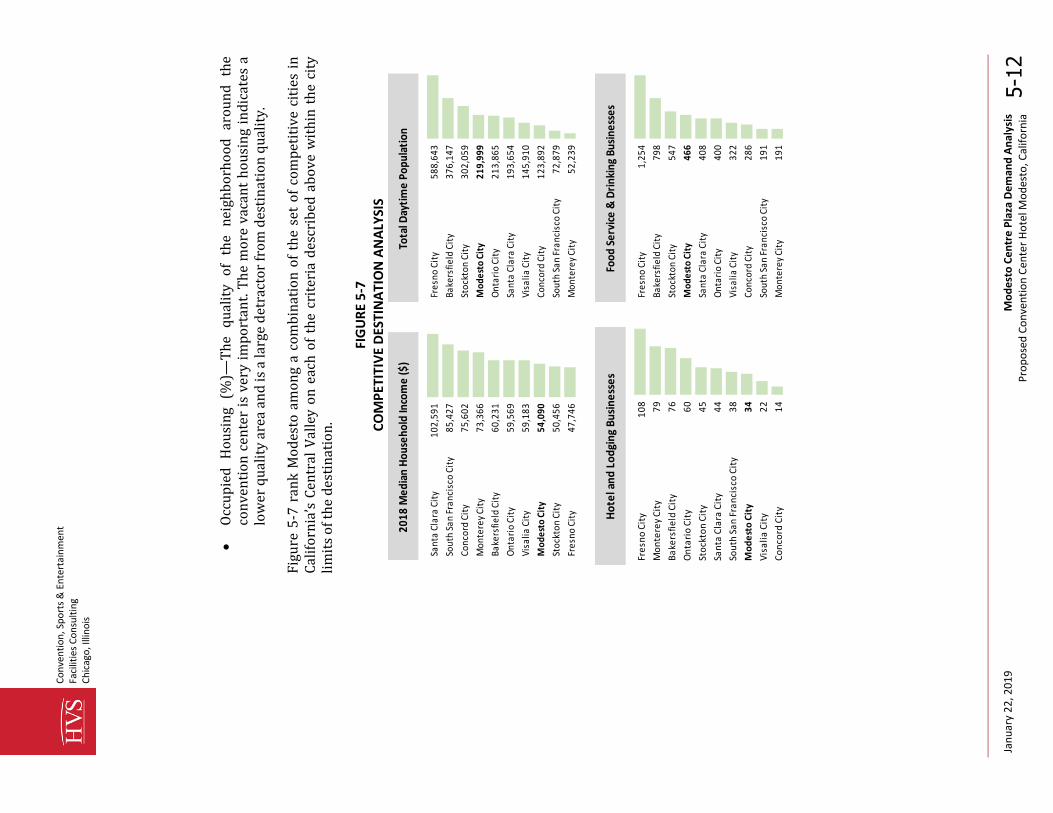
Co
nve
nti
on
, Sp
ort
s &
En
tert
ain
men
t
Faci
litie
s C
on
sult
ing
Ch
icag
o, I
llin
ois
Jan
uar
y 2
2, 2
01
9
Mo
de
sto
Ce
ntr
e P
laza
De
man
d A
nal
ysis
Pro
po
sed
Co
nve
nti
on
Cen
ter
Ho
tel M
od
esto
, Cal
ifo
rnia
5-1
2
•
Occ
up
ied
H
ou
sin
g (%
)—T
he
qu
alit
y o
f th
e n
eigh
bo
rho
od
ar
ou
nd
th
e co
nve
nti
on
cen
ter
is v
ery
imp
ort
ant.
Th
e m
ore
vac
ant
ho
usi
ng
ind
icat
es a
lo
wer
qu
alit
y ar
ea a
nd
is a
larg
e d
etra
cto
r fr
om
des
tin
atio
n q
ual
ity.
Fig
ure
5-7
ran
k M
od
esto
am
on
g a
com
bin
atio
n o
f th
e se
t o
f co
mp
etit
ive
citi
es i
n
Cal
ifo
rnia
’s C
entr
al V
alle
y o
n e
ach
of
the
crit
eria
des
crib
ed a
bo
ve w
ith
in t
he
city
li
mit
s o
f th
e d
esti
nat
ion
.
FIG
UR
E 5
-7
CO
MP
ETIT
IVE
DES
TIN
ATI
ON
AN
ALY
SIS
2018
Med
ian
Hou
seho
ld In
com
e ($
)H
otel
and
Lod
ging
Bus
ines
ses
San
ta C
lara
Cit
y1
02
,59
1
Sou
th S
an
Fra
nci
sco
Cit
y8
5,4
27
Co
nco
rd C
ity
75
,60
2
Mo
nte
rey
Cit
y7
3,3
66
Ba
kers
field
Cit
y6
0,2
31
On
tari
o C
ity
59
,56
9
Vis
alia
Cit
y5
9,1
83
Mo
de
sto
Cit
y5
4,0
90
Sto
ckto
n C
ity
50
,45
6
Fre
sno
Cit
y4
7,7
46
Tota
l Day
tim
e Po
pula
tion
2018
Med
ian
Hou
seho
ld In
com
e ($
)
Fre
sno
Cit
y5
88
,64
3
Ba
kers
field
Cit
y3
76
,14
7
Sto
ckto
n C
ity
30
2,0
59
Mo
de
sto
Cit
y2
19
,99
9
On
tari
o C
ity
21
3,8
65
San
ta C
lara
Cit
y1
93
,65
4
Vis
alia
Cit
y1
45
,91
0
Co
nco
rd C
ity
12
3,8
92
Sou
th S
an
Fra
nci
sco
Cit
y7
2,8
79
Mo
nte
rey
Cit
y5
2,2
39
Ho
tel a
nd
Lo
dgi
ng
Bu
sin
ess
es
Foo
d S
erv
ice
& D
rin
kin
g B
usi
ne
sse
s
Fre
sno
Cit
y1
08
Mo
nte
rey
Cit
y7
9
Ba
kers
fie
ld C
ity
76
On
tari
o C
ity
60
Sto
ckto
n C
ity
45
San
ta C
lara
Cit
y4
4
Sou
th S
an
Fra
nci
sco
Cit
y3
8
Mo
de
sto
Cit
y3
4
Vis
ali
a C
ity
22
Co
nco
rd C
ity
14
Food
Ser
vice
& D
rink
ing
Busi
ness
es
Fre
sno
Cit
y1
,25
4
Ba
kers
field
Cit
y7
98
Sto
ckto
n C
ity
54
7
Mo
de
sto
Cit
y4
66
San
ta C
lara
Cit
y4
08
On
tari
o C
ity
40
0
Vis
alia
Cit
y3
22
Co
nco
rd C
ity
28
6
Sou
th S
an
Fra
nci
sco
Cit
y1
91
Mo
nte
rey
Cit
y1
91

Convention, Sports & Entertainment Facilities Consulting Chicago, Illinois
January 22, 2019 Modesto Centre Plaza Demand Analysis Proposed Convention Center Hotel Modesto, California 5-13
Arts, Entertainment & Recreation Businesses Storefront Businesses
Fresno City 317
Bakersfield City 175
Stockton City 147
Santa Clara City 115
Monterey City 99
Modesto City 93
Concord City 92
Visalia City 70
Ontario City 60
South San Francisco City 52
Storefront Businesses Occupied Housing (%)
Fresno City 13,890
Bakersfield City 7,645
Stockton City 6,020
Ontario City 5,235
Modesto City 4,985
Visalia City 3,610
Santa Clara City 3,345
Concord City 3,190
Monterey City 1,885
South San Francisco City 1,800
Source: ESRI
In addition to the above criteria, we also evaluated the relative costs of travel using the Corporate Travel Index (“CTI”). CTI compares the typical costs incurred by business travelers: lodging, meals, and auto rentals in several metropolitan markets throughout the country.
To assess the relative strength of each destination, HVS calculated a score for each competitive market’s ranking within the criteria. Destination quality criteria were weighted to reflect their importance to event planners.
Hotels and food service and drinking businesses were weighted higher than the other categories due to their importance among event planners in choosing a destination. Figure 5-8 shows the overall rank among the competitive cities and the weights for each criterion.
Destination Ranking

Convention, Sports & Entertainment Facilities Consulting Chicago, Illinois
January 22, 2019 Modesto Centre Plaza Demand Analysis Proposed Convention Center Hotel Modesto, California
5-14
FIGURE 5-8 COMPETITIVE DESTINATION ANALYSIS
Weight (1 to 5) 3 4 5 5 4 3 2 4
Rank CityTotal Daytime
Population
2018 Median
Household
Income ($)
Hotel and
Lodging
Businesses
Food Service &
Drinking
Businesses
Arts,
Entertainment
& Recreation
Businesses
Storefront
Businesses
Occupied
Housing (%)Cost Index
Weighted
Destination
Score
1 Monterey 0.00 0.47 0.69 0.00 0.18 0.01 0.00 0.92 3.000
2 Fresno 1.00 0.00 1.00 1.00 1.00 1.00 0.32 0.92 0.700
3 Bakers field 0.60 0.23 0.66 0.57 0.46 0.48 0.25 0.91 0.484
4 Modesto 0.31 0.12 0.21 0.26 0.15 0.26 0.46 0.86 0.379
5 Santa Clara 0.26 1.00 0.32 0.20 0.24 0.13 0.87 0.00 0.349
6 Stockton 0.47 0.05 0.33 0.33 0.36 0.35 0.24 0.80 0.326
7 Ontario 0.30 0.22 0.49 0.20 0.03 0.28 0.76 0.53 0.306
8 Concord 0.13 0.51 0.00 0.09 0.15 0.11 0.73 0.06 0.259
9 Visa l ia 0.17 0.21 0.09 0.12 0.07 0.15 0.41 1.00 0.248
10 South San Francisco 0.04 0.69 0.26 0.00 0.00 0.00 1.00 0.06 0.220

Convention, Sports & Entertainment Facilities Consulting Chicago, Illinois
January 22, 2019 Modesto Centre Plaza Demand Analysis Proposed Convention Center Hotel Modesto, California 5-15
Based on the above analysis, Modesto ranks fourth in destination appeal among competitive cities in the Central Valley. Improved meeting and event infrastructure should allow Modesto to compete more effectively and capture a greater share of the group meetings industry.
In developing the demand projections, HVS assumes that a proposed 200-room convention hotel is completed and in operation by January 1, 2021. We estimate that event demand would stabilize in the third year of operation—calendar year 2023. We also assume the continued presence of a highly qualified, professional sales and management team for the MCP.
HVS based event demand projections for MCP on the following research and analysis:
• The introduction of a 200-room hotel on a nearby site,
• Historical MCP event and attendance data,
• Comparable venue program and demand data,
• Competitive market analysis, and
• Discussions with representatives of the City of Modesto and MCP management.
HVS’s analysis of historical MCP demand and an analysis of comparable and competitive venues suggest that the development of the proposed hotel should allow Modesto to expand its convention and other group business from state associations, local corporations, and other groups.
In preparing demand projections, we considered the following assumptions:
1) Proposed hotel development is accompanied by modification to the MCP’s booking policy to reduce the booking lead time for local events to 12 months and expand MCP availability for conferences and other events that would generate rooms nights in the market.
2) Proposed hotel development is accompanied by major improvements to the MCP, including the repurposing of some rooms and renovations to existing spaces.
3) The operator of the DoubleTree Hotel or the proposed new convention hotel assumes management responsibility of the MCP through a management agreement with the City of Modesto. As a part of this management agreement, the City would be entitled to use the MCP for a certain number
Demand Projections

Convention, Sports & Entertainment Facilities Consulting Chicago, Illinois
January 22, 2019 Modesto Centre Plaza Demand Analysis Proposed Convention Center Hotel Modesto, California 5-16
of days in order to host various civic events. Outside of these dates, the hotel operator would be allowed to focus MCP booking efforts on events that generate lodging demand and supplement open dates with local events as available. While the City would maintain access to the MCP for its events, the result of this management scenario would be a reduction in the number of local events and increased use of MCP function spaces for conferences and other room night generating meetings.
HVS projects the following demand for the MCP from a base year of demand, defined as the average demand for the past five years of operation through stabilized demand which would occur three years after the opening of the proposed hotel in January 2021. Figure 5-9 breaks out event projections by type of event. Total and average attendance figures represent individual event attendees. Room night projections represent the total number of rooms nights generated in the local market by events renting MCP function spaces.
HVS intends for demand projections to show the expected levels of event numbers and attendance. Projections show smooth growth over time. However, event demand and booking cycles do not always run smoothly. Unpredictable local and national economic factors can affect businesses. Event demand often moves in cycles based on rotation patterns and market conditions. Therefore, HVS recommends interpreting the demand projections as a mid-point of a range of possible outcomes and over a multi-year period, rather than relying on projections for any one specific year.
A summary of event types follows the projections.

Convention, Sports & Entertainment Facilities Consulting Chicago, Illinois
January 22, 2019 Modesto Centre Plaza Demand Analysis Proposed Convention Center Hotel Modesto, California 5-17
FIGURE 5-9 SUMMARY OF MCP DEMAND PROJECTIONS
Base Year Opening Stabilized
2018 2019 2020 2021 2022 2023
Events
Conferences 6 6 6 10 15 18
Meetings 204 204 204 210 215 220
Trade Shows 4 4 4 5 6 6
Consumer Shows 17 17 17 15 15 15
Assembl ies 36 36 36 20 20 20
Banquets & Socia l 40 40 40 35 35 35
Testing 6 6 6 3 3 3
Sports & Competitions 4 4 4 4 4 4
Concerts & Enterta inment 9 9 9 6 6 6
Other 5 5 5 5 5 5
Total 331 331 331 313 324 332
Attendees
Conferences 4,940 4,940 4,940 8,250 12,380 14,850
Meetings 23,260 23,260 23,260 29,400 30,100 30,800
Trade Shows 2,840 2,840 2,840 3,550 4,260 4,260
Consumer Shows 26,130 26,130 26,130 23,060 23,060 23,060
Assembl ies 16,740 16,740 16,740 9,300 9,300 9,300
Banquets & Socia l 12,200 12,200 12,200 10,680 10,680 10,680
Testing 2,120 2,120 2,120 1,060 1,060 1,060
Sports & Competitions 1,110 1,110 1,110 1,110 1,110 1,110
Concerts & Enterta inment 5,330 3,550 3,550 3,550 3,550 3,550
Other 4,470 4,470 4,470 4,470 4,470 4,470
Total 99,140 97,360 97,360 94,430 99,970 103,140
Occupied Room Nights
Conferences 3,950 3,950 3,950 7,920 11,880 14,260
Meetings 1,860 1,860 1,860 4,710 4,820 4,930
Trade Shows 910 910 910 1,130 1,360 1,360
Consumer Shows 870 870 870 770 770 770
Banquets & Socia l 410 410 410 360 360 360
Total 8,000 8,000 8,000 14,890 19,190 21,680
HVS classified events in the following categories.
Conferences— Conferences are multi-day events that require a mix of banquet and breakout space set-up and occasionally assembly and exhibit space. The source of conferences would be primarily state and regional associations and corporations. This demand category also includes religious and other SMERF groups that would rotate to Modesto for their annual events.
Event Types

Convention, Sports & Entertainment Facilities Consulting Chicago, Illinois
January 22, 2019 Modesto Centre Plaza Demand Analysis Proposed Convention Center Hotel Modesto, California 5-18
Meetings—Meetings require breakout meeting space but would not use banquet or exhibit space. Food service is limited to coffee breaks, breakfasts, or luncheons in meeting rooms. A variety of groups host meetings, including associations, corporations, civic organizations, religious groups, and government agencies.
Tradeshows—Tradeshows provide a means for wholesalers and retailers to transact business with industry buyers. As such, tradeshows are typically exhibit-oriented events in which people display and demonstrate products. Tradeshows require some meeting and meal space; however, they require much less space than conferences.
Consumer Shows—Consumer shows are ticketed public events that attract local and regional attendees, such as home and garden shows, car shows, and auctions. These events require some meeting space for support and back of house uses. Food and beverage services would be limited to concessions.
Assemblies—Assemblies include graduations, religious services, and lectures. Produced by any type of organization, assemblies are always public events. Additionally, assemblies only require a plenary set-up.
Banquets & Social—Banquets are stand-alone social events, luncheons, and other meals typically booked by local corporations, social and civic organizations, and private clients. Banquets can include wedding receptions, fundraisers, proms, and private parties.
Testing—Testing includes college entrance exams, corporate exams, and other civic testing.
Sports & Competitions—Sporting events cheerleading and dance competitions. It also includes robotics, card game, and video competitions.
Concerts & Entertainment—This event category includes concerts, dance recitals, pageants, and family entertainment.
Other—Other events include blood drives, health screenings, and other civic events.
MCP demand projections indicate an increase in room night-generating events with the development of a new convention hotel. A combined operation with a hotel would alleviate most of the scheduling conflicts with local events. While most events would remain in Modesto, some may leave the market to find suitable venues. Improvements to and modernization of MCP spaces would make the venue more
Demand Projection Summary

Convention, Sports & Entertainment Facilities Consulting Chicago, Illinois
January 22, 2019 Modesto Centre Plaza Demand Analysis Proposed Convention Center Hotel Modesto, California 5-19
attractive to meeting planners, but overall size constraints would still limit its ability to compete for some events.
Figure 5-10 provides a summary comparison of events, attendance, and room nights in a stabilized year of operation for the do-nothing and hotel development scenarios.
FIGURE 5-10 COMPARISON OF MCP DEMAND IN STABILIZED YEAR
Do NothingHotel
DevelopmentDo Nothing
Hotel
DevelopmentDo Nothing
Hotel
Development
Conferences 6 18 4,940 14,850 3,950 14,260
Meetings 204 220 23,260 30,800 1,860 4,930
Trade Shows 4 6 2,840 4,260 910 1,360
Consumer Shows 17 15 26,130 23,060 870 770
Assemblies 36 20 16,740 9,300 0 0
Banquets & Social 40 35 12,200 10,680 410 360
Testing 6 3 2,120 1,060 0 0
Sports & Competitions 4 4 1,110 1,110 0 0
Concerts & Entertainment 9 6 5,330 3,550 0 0
Other 5 5 4,470 4,470 0 0
Total 331 332 99,140 103,140 8,000 21,680
Event TypeEvents Total Attendance Room Nights

January 22, 2019 Projection of Occupancy and Average Rate Proposed Convention Center Hotel - Modesto, California
6-1
6. Projection of Occupancy and Average Rate
Along with average rate results, the occupancy levels achieved by the Proposed Hotel would be the foundation of the property's financial performance. To a certain degree, management can manipulate the level of occupancy. For example, hotel operators may choose to lower rates to maximize occupancy. Our forecasts reflect an operating strategy that we believe would be implemented by a typical professional hotel management team to achieve an optimal mix of occupancy and average rate.
The Proposed Hotel's forecasted market share and occupancy levels are based upon its anticipated competitive position within the market, as quantified by its penetration rate. The penetration rate is the ratio of a property's market share to its fair share. A hotel achieves a fair share when its share of occupied room nights equals its share of available room nights.
HVS analyzed the market penetration of each of the properties in the competitive set. Figure 6-1 ranks the occupancy penetration of each hotel by market segment. The secondary competition is the weighted average occupancy penetration of the secondarily competitive hotels.
Penetration Rate Analysis
Market Penetration
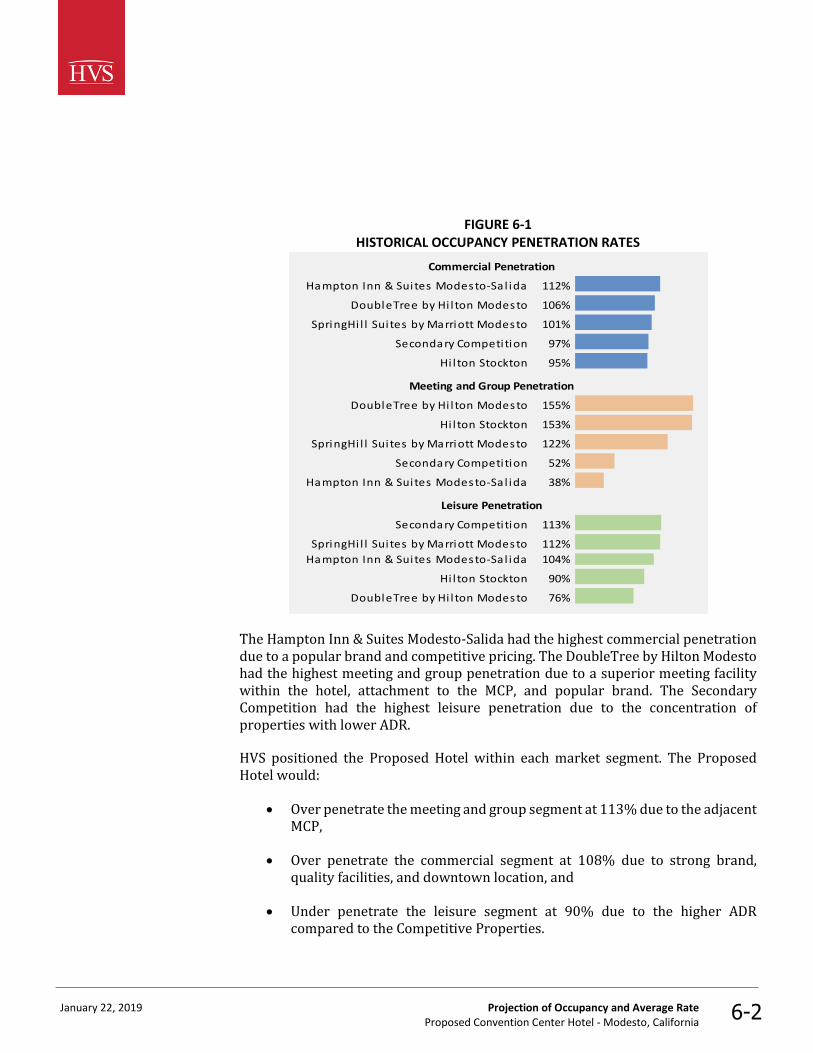
January 22, 2019 Projection of Occupancy and Average Rate Proposed Convention Center Hotel - Modesto, California
6-2
FIGURE 6-1 HISTORICAL OCCUPANCY PENETRATION RATES
Commercial Penetration
Hampton Inn & Suites Modesto-Sa l ida 112%
DoubleTree by Hi l ton Modesto 106%
SpringHi l l Sui tes by Marriott Modesto 101%
Secondary Competition 97%
Hi l ton Stockton 95%
Meeting and Group Penetration
DoubleTree by Hi l ton Modesto 155%
Hi l ton Stockton 153%
SpringHi l l Sui tes by Marriott Modesto 122%
Secondary Competition 52%
Hampton Inn & Suites Modesto-Sa l ida 38%
Leisure Penetration
Secondary Competition 113%
SpringHi l l Sui tes by Marriott Modesto 112%
Hampton Inn & Suites Modesto-Sa l ida 104%
Hi l ton Stockton 90%
DoubleTree by Hi l ton Modesto 76%
The Hampton Inn & Suites Modesto-Salida had the highest commercial penetration due to a popular brand and competitive pricing. The DoubleTree by Hilton Modesto had the highest meeting and group penetration due to a superior meeting facility within the hotel, attachment to the MCP, and popular brand. The Secondary Competition had the highest leisure penetration due to the concentration of properties with lower ADR.
HVS positioned the Proposed Hotel within each market segment. The Proposed Hotel would:
• Over penetrate the meeting and group segment at 113% due to the adjacent MCP,
• Over penetrate the commercial segment at 108% due to strong brand, quality facilities, and downtown location, and
• Under penetrate the leisure segment at 90% due to the higher ADR compared to the Competitive Properties.

January 22, 2019 Projection of Occupancy and Average Rate Proposed Convention Center Hotel - Modesto, California
6-3
• The Proposed Hotel would over penetrate the competitive hotels for a total penetration of 102%.
Figure 6-2 shows our estimates of market penetration of the Proposed Hotel.
FIGURE 6-2 OCCUPANCY PENETRATION OF THE PROPOSED HOTEL
Meeting and Group 113%
Commercia l 108%
Leisure 90%
Total Penetration 102%
We estimate that the Proposed Hotel would achieve 102.5% overall occupancy penetration in a stabilized year of operation in 2023. As is typical of new hotels, it may take several years to ramp-up to its stabilized occupancy level. HVS assumes a three-year ramp up after the opening of the Proposed Hotel. At stabilization in 2023, the Proposed Hotel could achieve an occupancy rate as shown in Figure 6-3. The occupancy rate is rounded to the nearest percentage when projecting room revenues in the Pro Forma.
FIGURE 6-3 PROPOSED HOTEL OCCUPANCY PROJECTION
0%
10%
20%
30%
40%
50%
60%
70%
80%
2021 2022 2023 2024
Competitive Hotels Proposed Hotel
Figure 6-4 shows the segmented forecast of occupancy for the Proposed Hotel.

January 22, 2019 Projection of Occupancy and Average Rate Proposed Convention Center Hotel - Modesto, California
6-4
FIGURE 6-4 PROPOSED HOTEL
ROOM NIGHT ABSORPTION AND OCCUPANCY ESTIMATES
Calendar Year 2021 2022 2023 2024
Avai lable Room Nights 73,000 73,000 73,000 73,000
Absorption by Segment
Commercia l 25,500 27,000 28,200 28,200
Meeting and Group 6,200 8,100 9,300 9,300
Leisure 16,000 16,900 17,500 17,500
Total Absorption 47,700 52,000 55,000 55,000
Projected Occupancy 66% 71% 75% 75%
Percent Segmentation
Commercia l 53% 52% 51% 51%
Meeting and Group 13% 16% 17% 17%
Leisure 34% 33% 32% 32%
The stabilized occupancy reflects the anticipated results of the property over its remaining economic life, given all changes in the life cycle of the hotel. Thus, the stabilized occupancy excludes from consideration any abnormal relationship between supply and demand, as well as any nonrecurring conditions that may result in unusually high or low occupancies. Although the Proposed Hotel may operate at occupancies above this stabilized level, new competition, and temporary economic downturns could force the occupancy below our stabilized projection.
The average rate is calculated by dividing the total rooms revenue achieved during a specified period by the number of rooms sold during the same period. The projected average rate and the anticipated occupancy percentage are used to forecast revenue from room rentals, which in turn provides the basis for estimating most other income and expense categories.
Although average rate and occupancy are highly correlated, one cannot project occupancy without making specific assumptions regarding average rate. Revenue per available room (“RevPAR”) reflects a property's ability to maximize rooms revenue with the optimal balance of rate and occupancy. Figure 6-5 summarizes the historical average rate and the RevPAR of the Proposed Hotel’s future primary competitors.
Average Rate Analysis
Competitive Position

January 22, 2019 Projection of Occupancy and Average Rate Proposed Convention Center Hotel - Modesto, California
6-5
FIGURE 6-5 BASE-YEAR AVERAGE RATE AND REVPAR OF THE COMPETITORS
Property2017 Average
Room Rate
ADR
PenetrationRevPAR
RevPAR
Penetration
DoubleTree by Hi l ton Modesto $130 - $140 102% $108.00 105%
Hampton Inn & Suites Modesto-Sal ida 110 - 115 91% 93.60 91%
Hi l ton Stockton 130 - 140 103% 107.44 104%
SpringHi l l Suites by Marriott Modesto 125 - 130 102% 113.40 110%
Average - Primary Competitors $133.71 101% $107.19 104%
Average - Secondary Competitors 129.21 98% 97.48 95%
Overall Average $131.84 $103.00
The primary competitors realized an overall average rate of $133.71 in the 2017 base year, improving from the 2016 level of $127.87.
Figure 6-6 illustrates the projected ADR in a calendar year. As a context for the average rate growth factors, note that we have applied a base underlying inflation rate of 2.5% in 2018, and 3.0% thereafter throughout our projection period.
FIGURE 6-6 COMPETITIVE HOTELS AND PROPOSED HOTEL
AVERAGE RATE FORECAST
Average
Rate
Growth
Weighted
Average
Rate
Growth
Weighted
Average
Rate
Penetration
Base Year — $131.84 —
2018 5.0% 138.43
2019 3.0% 142.58
2020 3.0% 146.86
2021 3.0% 151.26 $162.93 107.7
2022 3.0% 155.80 167.81 3.0% 107.7
2023 3.0% 160.48 172.85 3.0% 107.7
2024 3.0% 165.29 178.03 3.0% 107.7
2025 3.0% 170.25 183.37 3.0% 107.7
2026 3.0% 175.36 188.88 3.0% 107.7
Year
Proposed Hotel ADR
Weighted
Average
Rate
Average
Rate
Competitive Hotels
ADR

January 22, 2019 Projection of Occupancy and Average Rate Proposed Convention Center Hotel - Modesto, California
6-6
The Proposed Hotel would achieve an ADR penetration rate of 107.7% by stabilization which is superior to the average of the Competitive Hotels.
The positioning of the ADR for the Proposed Hotel is supported by extensive features of the property including:
• Ballroom and meeting space,
• Connection to the meeting space in the MCP,
• New construction,
• Strong brand,
• Convenient location, and
• Restaurant and lounge.
Figure 6-7 presents the forecasts for ADR and occupancy for the Proposed Hotel during the first ten years of operation.
FIGURE 6-7 PROPOSED HOTEL
FORECAST OF OCCUPANCY, ADR, AND REVPAR
Year Occupancy ADR RevPARAnnual
Increase
2021 66% $158.04 $104.30
2022 71% 166.14 117.96 13.1%
2023 75% 172.85 129.64 9.9%
2024 75% 178.03 133.52 3.0%
2025 75% 183.37 137.53 3.0%
2026 75% 188.88 141.66 3.0%
2027 75% 194.54 145.91 3.0%
2028 75% 200.38 150.28 3.0%
2029 75% 206.39 154.79 3.0%
2030 75% 212.58 159.44 3.0%
.

January 22, 2019 Projection of Income and Expenses Proposed Convention Center Hotel - Modesto, California 7-1
7. Projection of Income and Expenses
Estimates of average rate and occupancy allow the projection of room revenue, which forms the basis of income and expense projections. The number of guests drives other revenue sources of the Proposed Hotel such as food, beverages, and telephone income. Many expense levels also vary with occupancy.
We assume operation would begin on January 1, 2021. The forecast of income and expense is stated in current dollars for each operating year. We expect hotel operations to ramp up for three years after opening. The stabilized year reflects the anticipated operating results of the property over its remaining economic life. Thus, income and expense estimates from the stabilized year forward exclude from consideration any abnormal relationship between supply and demand, as well as any nonrecurring conditions that may result in unusual revenues or expenses.
The projections of revenue (other than room revenue) and expense for the Proposed Hotel rely on comparable hotel operating statements from the HVS database. We carefully selected comparable hotel operating statements based on similarities with the Proposed Hotel including room count, property type, location in urban markets, amounts of function space, occupancy rates, and average daily room rates. A full year’s data on each property is available within the last four years.
Figure 7-1 shows the room count, meeting space, occupancy, average rate, and RevPAR of the comparable hotels and compares them with the Proposed Hotel.
Methodology

January 22, 2019 Projection of Income and Expenses Proposed Convention Center Hotel - Modesto, California 7-2
FIGURE 7-1 OVERVIEW OF COMPARABLE HOTELS OPERATING STATEMENTS
Comp A Comp B Comp C Comp D Comp ESubject
Hotel
Year 2018/19 2017/18 2016/17 2015/16 2015/16 *
Number of Rooms: 100 to 140 120 to 160 180 to 230 100 to 140 140 to 180 200
Sq Ft of Meeting Space: 5,130 4,888 6,500 4,392 1,322 3,800
Sq Ft Meetng Space per Room: 43 35 32 37 8 19
Occupied Rooms: 11,361 28,948 62,863 29,659 52,349 54,750
Average Rate: $129 $130 $172 $136 $149 $145
RevPAR: $99 $93 $145 $93 $137 $109
*A stabilized year of operation. Dollar amounts shown in 2017 dollars. Sources: Respective Venues and HVS
Further analysis of the comparable hotels provides benchmarks used in our forecast of income and expense. The three most common measures of industry performance: ratio to sales (“RTS”), amounts per available room (“PAR”), and amounts per occupied room night (“POR”) are used to present the financial data. Figure 7-2 compares our forecasts for the Proposed Hotel to the comparable properties on each of these metrics.

January 22, 2019 Projection of Income and Expenses Proposed Convention Center Hotel - Modesto, California 7-3
FIGURE 7-2 COMPARABLE HOTELS OPERATING STATEMENTS--RATIO TO SALES RANK - PERCENTAGES 1 2 3 4 5 6
REVENUE
Rooms 93.1 88.3 88.3 87.8 86.7 86.4
Food & Beverage 12.2 11.0 10.1 9.7 9.0 5.2
Other Operated Departments 4.6 1.8 1.7 1.6 1.0 0.9
Miscel laneous Income 0.3 0.2 0.1 0.1 0.0 0.0
DEPARTMENTAL EXPENSES*
Rooms 27.5 21.1 21.0 18.4 18.1 17.4
Food & Beverage 122.7 112.6 103.4 97.6 95.0 72.5
Other Operated Departments 80.0 76.3 58.9 48.5 22.3 10.2
Total Department Expenses 34.4 29.2 29.0 26.6 26.3 25.0
OPERATING EXPENSES **
Adminis trative & General 10.3 8.5 8.3 7.7 7.6 6.9
Info. and Telecom. Systems 0.6 0.5 0.5 0.4 0.1 0.0
Marketing 7.3 5.6 5.6 5.6 4.4 4.2
Franchise Fee 8.8 8.4 8.1 8.1 8.1 7.0
Property Operations & Maintenance 5.4 4.9 4.2 3.5 2.7 2.1
Uti l i ties 5.2 3.9 3.3 3.0 2.5 2.0
Total Operating Expenses 29.9 29.7 29.7 29.4 28.3 28.3
HOUSE PROFIT 46.7 45.4 43.5 41.6 41.1 35.9
* Ratio to Department Revenue indicates position of Proposed Hotel
** Ratio to Total Revenue indicates position of comparable hotels
House profit ranged from 46.7% to 35.9% of operating revenues for the comparable properties. Other Operated Departments is higher than the comparable hotels due to the expected expenses of valet parking.

January 22, 2019 Projection of Income and Expenses Proposed Convention Center Hotel - Modesto, California 7-4
FIGURE 7-3 COMPARABLE HOTELS OPERATING STATEMENTS - AMOUNTS PER AVAILABLE ROOM
RANK - INCOME PER ROOM 1 2 3 4 5 6
REVENUE
Rooms 53,021 49,987 39,821 33,972 27,151 12,201
Food & Beverage 5,501 4,772 4,380 3,396 2,795 1,392
Other Operated Departments 2,816 892 821 334 306 221
Miscel laneous Income 106 57 55 30 0 0
Total 61,339 53,703 45,077 39,185 30,911 13,814
DEPARTMENTAL EXPENSES
Rooms 14,589 10,535 8,362 6,163 4,729 2,251
Food & Beverage 6,195 4,161 3,459 3,313 2,891 1,708
Other Operated Departments 680 657 287 180 162 49
Total Department Expenses 21,070 14,106 13,180 9,784 8,223 4,008
OPERATING EXPENSES
Adminis trative & General 4,550 4,210 3,471 3,171 2,964 1,140
Info. and Telecom. Systems 246 231 225 161 18 0
Marketing 3,465 2,870 2,524 2,358 1,743 579
Franchise Fee 4,946 3,783 3,780 3,184 2,711 1,114
Property Operations & Maintenance 2,991 2,906 1,893 834 829 483
Uti l i ties 2,385 1,598 1,488 983 724 621
Total Operating Expenses 18,229 15,193 13,384 11,076 9,240 4,058
HOUSE PROFIT 24,404 22,040 18,512 18,325 13,448 5,748
indicates position of Proposed Hotel
indicates position of comparable hotels
House profit ranged from $24,404 to $5,748 per room for the comparable properties.

January 22, 2019 Projection of Income and Expenses Proposed Convention Center Hotel - Modesto, California 7-5
FIGURE 7-4 COMPARABLE HOTELS OPERATING STATEMENTS - AMOUNTS PER OCCUPIED ROOM NIGHT
RANK - PER OCCUPIED ROOM 1 2 3 4 5 6
REVENUE
Rooms 172 149 145 136 130 129
Food & Beverage 19 18 16 16 15 8
Other Operated Departments 9 3 3 2 1 1
Total 199 165 160 157 148 146
DEPARTMENTAL EXPENSES
Rooms 47 31 31 25 24 23
Food & Beverage 20 18 16 15 14 9
Other Operated Departments 2 2 1 1 1 1
Total Department Expenses 68 48 42 42 39 39
OPERATING EXPENSES
Adminis trative & General 15 14 14 13 12 12
Info. and Telecom. Systems 1 1 1 1 0 0
Marketing 12 11 9 8 7 6
Franchise Fee 16 14 13 13 12 11
Property Operations & Maintenance 10 9 7 5 4 3
Uti l i ties 8 8 5 5 4 3
Total Operating Expenses 59 49 45 44 44 43
HOUSE PROFIT 74 73 72 68 65 61
indicates position of Proposed Hotel
indicates position of comparable hotels
House profit ranged from $74 to $61 per occupied room for the comparable properties.
HVS uses a fixed and variable component model to project a lodging facility's revenue and expense levels. The following figure illustrates the revenue and expense categories that can be projected using this fixed and variable component model.
Fixed and Variable Component Analysis

January 22, 2019 Projection of Income and Expenses Proposed Convention Center Hotel - Modesto, California 7-6
FIGURE 7-5 PROPOSED HOTEL - RANGE OF FIXED AND VARIABLE RATIOS
Category Index of Variability
Revenues
Food 25 - 50 % 50 - 75 % Occupancy 25 %
Beverage 0 - 30 70 - 100 Occupancy 25
Other Operated Departments 30 - 70 30 - 70 Occupancy 70
Rentals & Other Income 30 - 70 30 - 70 Occupancy 70
Departmental Expenses
Rooms 50 - 70 30 - 50 Occupancy 60
Food & Beverage 35 - 60 40 - 65 Food & Beverage Revenue 60
Other 30 - 70 30 - 70 Other Operated Departments Revenue 70
Undistributed Operating Expenses
Adminis trative & General 65 - 85 15 - 35 Total Revenue 75
Marketing 65 - 85 15 - 35 Total Revenue 75
Info & Telecom Systems 65 - 85 15 - 35 Total Revenue 75
Prop. Operations & Maint. 55 - 75 25 - 45 Total Revenue 75
Uti l i ties 75 - 95 5 - 25 Total Revenue 75
Percent
Fixed
Percent
Variable
Fixed
Ratio
HVS uses a fixed and variable component model to project a lodging facility's revenue and expense levels. Hotel revenues and expenses have one component that is fixed and another that varies directly with occupancy and facility usage. A projection can be made by taking a known level of revenue or expense and calculating its fixed and variable components. The fixed component is then increased in tandem with the underlying rate of inflation, while the variable component is adjusted for a specific measure of volume such as total revenue.
The actual forecast is derived by adjusting each year’s revenue and expense by the amount fixed (the fixed expense multiplied by the inflated base-year amount) plus the variable amount (the variable expense multiplied by the inflated base-year amount) multiplied by the ratio of the projection year’s occupancy to the base-year occupancy (in the case of departmental revenue and expense) or the ratio of the projection year’s revenue to the base year’s revenue (in the case of undistributed operating expenses). Fixed expenses remain fixed, increasing only with inflation. Our discussion of the revenue and expense forecast in this study is based on the output derived from the fixed and variable model. This forecast of revenue and expense is accomplished through a systematic approach, following the format of the Uniform System of Accounts for the Lodging Industry. Each category of revenue and

January 22, 2019 Projection of Income and Expenses Proposed Convention Center Hotel - Modesto, California 7-7
expense is estimated separately and combined in the final statement of income and expense.
The Proposed Hotel would reach a stabilized level of operation in 2023. The forecast is based on calendar years beginning January 1, 2021, for each year.
The estimated number of occupied room nights and the average daily room rate determine room revenue in any given year. The Proposed Hotel would stabilize at an occupancy level of 75%, with an average daily rate of $178.03 in 2023, the first stabilized year. Following the stabilized year, the Proposed Hotel’s average rate would increase with the rate of inflation.
A hotel's restaurants, lounges, coffee shops, snack bars, banquet rooms, and room service generate the food and beverage income. In addition to providing a source of revenue, these outlets serve as an amenity that assists in the sale of guestrooms. In the case of the Proposed Hotel, the food and beverage department will include a restaurant and lounge.
Function space in the Proposed Hotel includes 3,800 square feet of ballroom and meeting space as shown in Figure 7-6.
FIGURE 7-6 MEETING SPACE
Square
Feet
Bal l room 2,400
Meeting Room 800
Board Room 600
Total 3,800
Indoor Meeting & Banquet
Facilities
Although a portion of food and beverage revenue varies directly with changes in occupancy, the portion generated by banquet sales from local social events does not depend on hotel room occupancy.
The estimated food and beverage sales in the first stabilized year of 2023 is shown in Figures 7-7, 7-8, and 7-9.
Forecast of Income and Expense
Rooms
Food and Beverage Revenue

January 22, 2019 Projection of Income and Expenses Proposed Convention Center Hotel - Modesto, California 7-8
FIGURE 7-7 HOTEL FOOD AND BEVERAGE SALES (000’S)
Food Sales $846
Beverage Sales 195
Total Food & Beverage Sales $1,041
Percentage of Total Sa les 9.7%
Average Comparable Hotels 9.5%
The Proposed Hotel’s average food and beverage sales will be higher than the comparable hotels due to sales related to the MCP.
Other operated departments (“OOD”) include any major or minor operated department other than rooms and food and beverage. Telephone revenue and expense are now considered a component of other operated departments. Based on our review of operations with similar other department operations, we have determined an appropriate revenue level for the Proposed Hotel at 1.8% of gross revenues by the first stabilized year of 2023.
The in-room movie and game charges will generate the Proposed Hotel’s rentals and other income revenue. Based on our review of operations with a similar extent of offerings, we determined an appropriate revenue level for the Proposed Hotel at 0.1% of gross revenues by the first stabilized year of 2023.
Rooms expense consists of items related to the sale and upkeep of guestrooms and public space. Salaries, wages, and employee benefits account for a substantial portion of this category. Although payroll varies somewhat with occupancy and managers can scale the level of service with staff on hand to meet an expected occupancy level, much of a hotel's payroll is fixed. Hotel operations require a base level of front desk personnel, housekeepers, and supervisors always. As a result, salaries, wages, and employee benefits are only moderately sensitive to changes in occupancy. The rooms department is projected to average 21.0% of department revenues by the first stabilized year of 2023.
Food and beverage departmental expenses consist of items necessary for the primary operation of a hotel's food and banquet facilities. Most of the cost of food and beverage sales and related payroll vary with the level of food revenues; however, this departmental operation has a fixed component. We have projected a stabilized expense ratio of 95.0% in the Proposed Hotel’s food & beverage by the first stabilized year of 2023.
OOD expense includes all expense for the OOD divisions associated with these categories. The other operated department's expense would average 80.0% of department revenues in the first stabilized year of 2023.
Other Operated Departments Revenue
Miscellaneous Income
Department Expenses
January 22, 2019 Projection of Income and Expenses Proposed Convention Center Hotel - Modesto, California 7-9
In 2023, department level expenses average 29.2% of gross revenues, which would generate a department income of $7.6 million.
Administrative and general expense includes the salaries and wages of all administrative personnel not directly associated with a department. Other costs include management and operation of the property. These expenses would average 7.7% of gross revenues in the first stabilized year of 2023 for the Proposed Hotel.
Information and telecommunications systems expense consists of all costs associated with a hotel’s technology infrastructure. The costs include cell phones, telephone, and Internet services. Expenses in this category are typically organized by type of technology, or the area benefitting from the technology solution. These expenses would average 0.5% of gross revenues by the first stabilized year of 2023 for the Proposed Hotel.
Marketing expense consists of costs associated with advertising, sales, and promotion; these activities focus on attracting and retaining customers. Marketing creates an image, develops customer awareness, and stimulates patronage of a property's various facilities. Management controls the level of marketing expenditures. These expenses would average 5.6% of gross revenues by the first stabilized year of 2023 for the Proposed Hotel.
The Proposed Hotel would have a select-service hotel brand. For purposes of this study a franchise fee of 5.50% of gross room revenues, plus a marketing fee of 4.00% of gross room revenues, are included in the expenses of operation.
Property operations and maintenance expenditures maintain the functionality and appearance of the property. Management has certain discretion over this expense category due to the ability to delay certain maintenance. These expenses would average 4.2% of gross revenues by the first stabilized year of 2023 for the Proposed Hotel.
The consumption of various utilities by a lodging facility takes several forms, including water and space heating, air conditioning, lighting, cooking fuel, and other miscellaneous power requirements. The most common sources of hotel utilities are electricity, natural gas, fuel oil, and steam. This category also includes the cost of water service. These expenses would average 3.3% of gross revenues by the first stabilized year of 2023 for the Proposed Hotel.
Undistributed Operating Expenses
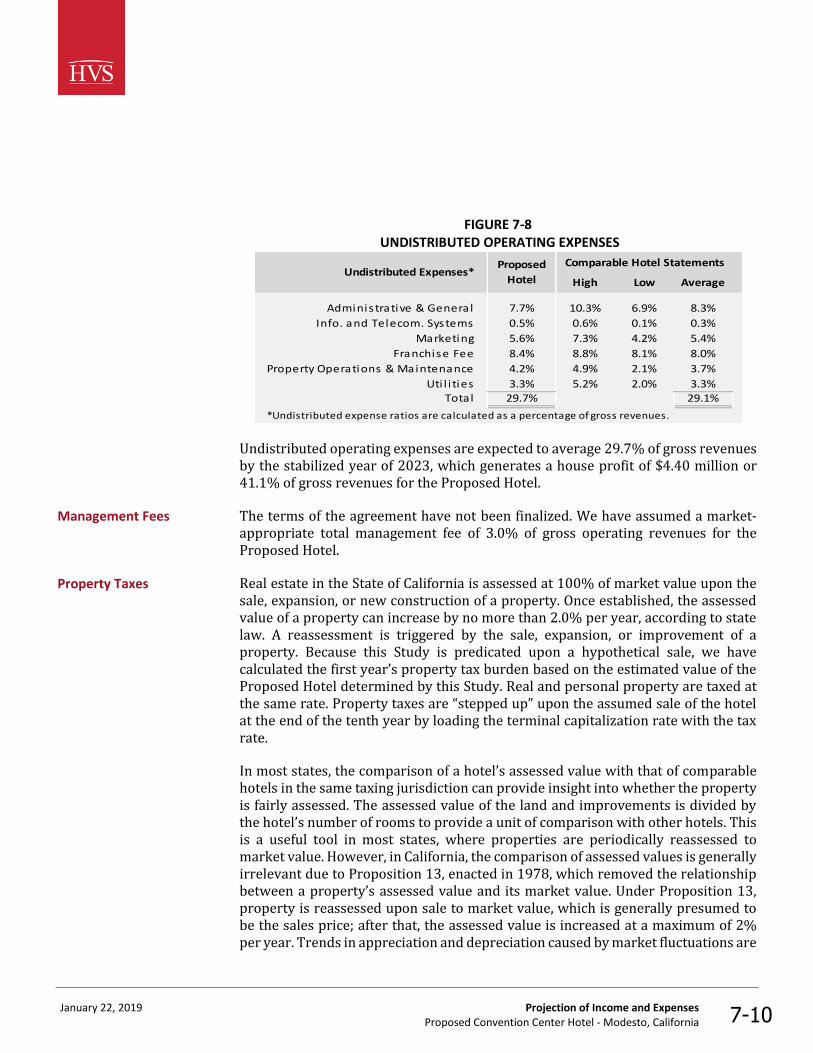
January 22, 2019 Projection of Income and Expenses Proposed Convention Center Hotel - Modesto, California 7-10
FIGURE 7-8 UNDISTRIBUTED OPERATING EXPENSES
Comparable Hotel Statements
High Low Average
Administrative & General 7.7% 10.3% 6.9% 8.3%
Info. and Telecom. Systems 0.5% 0.6% 0.1% 0.3%
Marketing 5.6% 7.3% 4.2% 5.4%
Franchise Fee 8.4% 8.8% 8.1% 8.0%
Property Operations & Maintenance 4.2% 4.9% 2.1% 3.7%
Uti l i ties 3.3% 5.2% 2.0% 3.3%Total 29.7% 29.1%
*Undistributed expense ratios are calculated as a percentage of gross revenues.
Undistributed Expenses*Proposed
Hotel
Undistributed operating expenses are expected to average 29.7% of gross revenues by the stabilized year of 2023, which generates a house profit of $4.40 million or 41.1% of gross revenues for the Proposed Hotel.
The terms of the agreement have not been finalized. We have assumed a market-appropriate total management fee of 3.0% of gross operating revenues for the Proposed Hotel.
Real estate in the State of California is assessed at 100% of market value upon the sale, expansion, or new construction of a property. Once established, the assessed value of a property can increase by no more than 2.0% per year, according to state law. A reassessment is triggered by the sale, expansion, or improvement of a property. Because this Study is predicated upon a hypothetical sale, we have calculated the first year’s property tax burden based on the estimated value of the Proposed Hotel determined by this Study. Real and personal property are taxed at the same rate. Property taxes are “stepped up” upon the assumed sale of the hotel at the end of the tenth year by loading the terminal capitalization rate with the tax rate.
In most states, the comparison of a hotel’s assessed value with that of comparable hotels in the same taxing jurisdiction can provide insight into whether the property is fairly assessed. The assessed value of the land and improvements is divided by the hotel’s number of rooms to provide a unit of comparison with other hotels. This is a useful tool in most states, where properties are periodically reassessed to market value. However, in California, the comparison of assessed values is generally irrelevant due to Proposition 13, enacted in 1978, which removed the relationship between a property’s assessed value and its market value. Under Proposition 13, property is reassessed upon sale to market value, which is generally presumed to be the sales price; after that, the assessed value is increased at a maximum of 2% per year. Trends in appreciation and depreciation caused by market fluctuations are
Management Fees
Property Taxes

January 22, 2019 Projection of Income and Expenses Proposed Convention Center Hotel - Modesto, California 7-11
not reflected in a property’s assessed value in California unless there is a sales transaction. Thus, comparable hotels in California can have markedly different assessed values, depending upon when the last sales transaction occurred. For this reason, we have not researched the assessed values of comparable hotels to assess the reasonableness of the Proposed Hotel’s assessed value
FIGURE 7-9 LOCAL TAX RATES
Real Property
Millage Rate
2015/16 1.08726 1.08726
2016/17 1.08556 1.08556
2017/18 1.08506 1.08506
2018/19 1.08598 1.08598
YearPersonal Property
Millage Rate
Source: Stanislaus County Tax Collector
The estimated assessed value is multiplied by the current tax rate to provide an estimate of property taxes in current dollars, as shown in Figure7-10.
FIGURE 7-10 ESTIMATED PROPERTY TAXES PROPOSED HOTEL
$37,153,370 x $403,478
Estimated Market Value Tax RateFirst Year's Tax
Burden
1.08598%
Property tax payments are due twice yearly in the Proposed Hotel’s county. We estimate that property taxes for the Proposed Hotel will equal approximately $403,000 in the first forecast year of our projection period, increasing by 2.0% annually thereafter, the maximum allowed by state law.
The insurance expense covers the hotel and its contents against damage or destruction by fire, weather, sprinkler leakage, boiler explosion, plate glass breakage, and so forth. General insurance costs also include premiums relating to liability, fidelity, and theft coverage. Insurance rates consider many factors, including building design and construction, fire detection and extinguishing equipment, fire district, distance from the firehouse, and the area's fire experience. Insurance and related expenses projected at 1.0% of gross revenues for the Proposed Hotel by the first stabilized year of 2023.
Insurance

January 22, 2019 Projection of Income and Expenses Proposed Convention Center Hotel - Modesto, California 7-12
The reserve for replacement for furniture, fixtures, and equipment are essential to the operation of a lodging facility, and their quality often influences a property's class. The furniture, fixtures, and equipment of a hotel experience heavy use and need replacement at regular intervals. The reserve for replacement expenses projected at 2.0% of gross revenues for the Proposed Hotel in the first year of operation, 3.0% in the second year of operation and 4.0% annually thereafter.
Figures 7-11 and 7-12 present a forecast of earnings before interest, tax, depreciation, and amortization (“EBITDA”) for the first stabilized year, followed by a detailed forecast of the first ten years of operation for the Proposed Hotel, including amounts per available room and per occupied room. The forecasts pertain to years beginning January 1, 2021, in inflated dollars for each year.
Reserve for Replacement
Summary of Projections

January 22, 2019 Projection of Income and Expenses Proposed Convention Center Hotel - Modesto, California 7-13
FIGURE 7-11 FIRST STABILIZED YEAR (2023)
STATISTICS
Number of Rooms 200Occupied Room Nights 54,750
Occupancy 75%
Average Rate $178.03
RevPAR $133.52
$000 % Gross
Operating Revenue
Rooms $9,463 88.3%
Food 846 7.9%
Beverage 195 1.8%
Other Operated Departments 195 1.8%Miscel laneous Income 13 0.1%
Total Operating Revenues $10,712 100%
Departmental Expenses*
Rooms $1,987 21.0%
Food & Beverage 989 95.0%Other Operated Departments 156 80.0%
Sub-total $3,132 29.2%
Departmental Income $7,580 70.8%
Undistributed Operating Expenses
Adminis trative & Genera l $825 7.7%
Marketing 600 5.6%
Franchise Fee 899 8.4%
Prop. Operations & Maint. 450 4.2%
Uti l i ties 354 3.3%
Info & Telecom Systems 54 0.5%
Sub-total $3,181 29.7%
Gross House Profit $4,399 41.1%
Management Fee $321 3.0%
Income Before Non-Opr. Inc. & Exp. $4,078 38.1%
Non-Operating Income & Expenses
Property Taxes $420 3.9%
Insurance $107 1.0%Reserve for Replacement $428 4.0%
Sub-total $955 8.9%
EBITDA Less Reserve $3,122 29.1%0.0%
*Departmental expense ratios are calculated as a percentage of
departmental revenue.

January 22, 2019 Projection of Income and Expenses Proposed Convention Center Hotel - Modesto, California 7-14
FIGURE 7-12 PROPOSED HOTEL 10 YEAR PRO FORMA (000’S)
2021 2022 2023 2024 2025 2026 2027 2028 2029 2030
STATISTICS
Number of Rooms 200 200 200 200 200 200 200 200 200 200
Occupied Room Nights 48,180 51,830 54,750 54,750 54,750 54,750 54,750 54,750 54,750 54,750
Occupancy 66% 71% 75% 75% 75% 75% 75% 75% 75% 75%
Average Rate $158.04 $166.14 $172.85 $178.03 $183.37 $188.88 $194.54 $200.38 $206.39 $212.58
RevPAR $104.30 $117.96 $129.64 $133.52 $137.53 $141.66 $145.91 $150.28 $154.79 $159.44
$000% of
Gross$000
% of
Gross$000
% of
Gross$000
% of
Gross$000
% of
Gross$000
% of
Gross$000
% of
Gross$000
% of
Gross$000
% of
Gross$000
% of
Gross
Operating Revenue
Rooms $7,614 87.5 $8,611 88.0 $9,463 88.3 $9,747 88.3 $10,040 88.3 $10,341 88.3 $10,651 88.3 $10,971 88.3 $11,300 88.3 $11,639 88.3
Food 725 8.3 788 8.1 846 7.9 871 7.9 897 7.9 924 7.9 952 7.9 980 7.9 1,010 7.9 1,040 7.9
Beverage 172 2.0 184 1.9 195 1.8 201 1.8 207 1.8 213 1.8 220 1.8 226 1.8 233 1.8 240 1.8
Other Operated Departments 177 2.0 186 1.9 195 1.8 201 1.8 207 1.8 213 1.8 220 1.8 226 1.8 233 1.8 240 1.8
Miscel laneous Income 12 0.1 12 0.1 13 0.1 13 0.1 14 0.1 14 0.1 15 0.1 15 0.1 16 0.1 16 0.1
Total Operating Revenues $8,700 100.0 $9,782 100.0 $10,712 100.0 $11,034 100.0 $11,365 100.0 $11,706 100.0 $12,057 100.0 $12,419 100.0 $12,791 100.0 $13,175 100.0
Departmental Expenses*
Rooms $1,783 23.4 $1,888 21.9 $1,987 21.0 $2,047 21.0 $2,108 21.0 $2,172 21.0 $2,237 21.0 $2,304 21.0 $2,373 21.0 $2,444 21.0
Food & Beverage 896 99.9 944 97.1 989 95.0 1,019 95.0 1,049 95.0 1,081 95.0 1,113 95.0 1,146 95.0 1,181 95.0 1,216 95.0
Other Operated Departments 146 82.1 151 80.9 156 80.0 161 80.0 166 80.0 171 80.0 176 80.0 181 80.0 186 80.0 192 80.0
Sub-total $2,825 32.5 $2,983 30.5 $3,132 29.2 $3,226 29.2 $3,323 29.2 $3,423 29.2 $3,525 29.2 $3,631 29.2 $3,740 29.2 $3,852 29.2
Departmental Income $5,875 67.5 $6,799 69.5 $7,580 70.8 $7,807 70.8 $8,042 70.8 $8,283 70.8 $8,531 70.8 $8,788 70.8 $9,051 70.8 $9,323 70.8
Undistributed Operating Expenses
Adminis trative & General $751 8.6 $789 8.1 $825 7.7 $850 7.7 $875 7.7 $901 7.7 $928 7.7 $956 7.7 $985 7.7 $1,014 7.7
Marketing 546 6.3 574 5.9 600 5.6 618 5.6 636 5.6 656 5.6 675 5.6 695 5.6 716 5.6 738 5.6
Franchise Fee 723 8.3 818 8.4 899 8.4 926 8.4 954 8.4 982 8.4 1,012 8.4 1,042 8.4 1,074 8.4 1,106 8.4
Prop. Operations & Maint. 409 4.7 430 4.4 450 4.2 463 4.2 477 4.2 492 4.2 506 4.2 522 4.2 537 4.2 553 4.2
Uti l i ties 322 3.7 338 3.5 354 3.3 364 3.3 375 3.3 386 3.3 398 3.3 410 3.3 422 3.3 435 3.3
Info & Telecom Systems 49 0.6 51 0.5 54 0.5 55 0.5 57 0.5 59 0.5 60 0.5 62 0.5 64 0.5 66 0.5
Sub-total $2,800 32.2 $3,000 30.6 $3,181 29.7 $3,276 29.7 $3,375 29.7 $3,476 29.7 $3,580 29.7 $3,687 29.7 $3,798 29.7 $3,912 29.7
Gross House Profit $3,075 35.3 $3,799 38.9 $4,399 41.1 $4,531 41.1 $4,668 41.1 $4,807 41.1 $4,951 41.1 $5,100 41.1 $5,253 41.1 $5,411 41.1
Management Fee $261 3.0 $293 3.0 $321 3.0 $331 3.0 $341 3.0 $351 3.0 $362 3.0 $373 3.0 $384 3.0 $395 3.0
Income Before Non-Opr. Inc. & Exp. $2,814 32.3 $3,505 35.9 $4,078 38.1 $4,200 38.1 $4,327 38.1 $4,456 38.1 $4,590 38.1 $4,728 38.1 $4,870 38.1 $5,016 38.1
Non-Operating Income & Expenses
Property Taxes $403 4.6 $412 4.2 $420 3.9 $428 3.9 $437 3.8 $445 3.8 $454 3.8 $463 3.7 $473 3.7 $482 3.7
Insurance 101 1.2 104 1.1 107 1.0 110 1.0 114 1.0 117 1.0 121 1.0 124 1.0 128 1.0 132 1.0
Reserve for Replacement 174 2.0 293 3.0 428 4.0 441 4.0 455 4.0 468 4.0 482 4.0 497 4.0 512 4.0 527 4.0
Sub-total $678 7.8 $809 8.3 $955 8.9 $980 8.9 $1,005 8.8 $1,031 8.8 $1,057 8.8 $1,084 8.7 $1,112 8.7 $1,141 8.7
EBITDA Less Reserve $2,136 24.6% $2,696 27.6% $3,122 29.1% $3,220 29.2% $3,322 29.2% $3,425 29.3% $3,532 29.3% $3,643 29.3% $3,757 29.4% $3,875 29.4%
*Departmental expense ratios are calculated as a percentage of departmental revenue.
Convention, Sports & Entertainment Facilities Consulting Chicago, Illinois
January 22, 2019 Projection of Income and Expenses Proposed Convention Center Hotel - Modesto, California 7-15
Our analysis projects a profitable hotel operation. The stabilized total revenue is comprised primarily of rooms and food and beverage revenue, with a relatively small portion derived from other income sources. On the cost side, departmental expenses total 29.2% of revenue in a stabilized year for the Proposed Hotel, while undistributed operating expenses total 29.7% of total revenues; this assumes that the property would be operated competently by a well-known hotel operator. After a 3.0% of total revenues management fee, and 8.9% of total revenues in fixed expenses, a net income ratio of 29.1% is forecast by 2023 for the Proposed Hotel.
Pro Forma Conclusion

Convention, Sports & Entertainment Facilities Consulting Chicago, Illinois
January 22, 2019 Proposed Hotel Feasibility Analysis Proposed Convention Center Hotel - Modesto, California 8-1
8. Proposed Hotel Feasibility Analysis
Return on investment (“ROI”) compares future benefits of an income-producing property compared to its acquisition or construction cost. The first step in performing a return on investment analysis is to determine the required investment. For a proposed property, this amount is the development cost of the Proposed Hotel. Investors utilize a return on investment analysis to determine if the future cash flow from current cash outlay meets his or her investment criteria.
The required return on investment (“yield”) relates primarily to the level of perceived development risk for any specific project. The higher the risk, the greater the required return. These risks may involve general market risks such as a general economic downturn, project completion risks, or other risks that are specific to the Proposed Hotel.
To determine a reasonable range of required ROI for this analysis, HVS sampled hotels that recently sold as shown in Figure 8-1. The sales data indicate that they generated total property yields ranging from 8.1% to 14.9%, which is a blend of both the equity and debt yields.
Return on Investment
Equity Component & Equity Yield Rate

Convention, Sports & Entertainment Facilities Consulting Chicago, Illinois
January 22, 2019 Proposed Hotel Feasibility Analysis Proposed Convention Center Hotel - Modesto, California 8-2
FIGURE 8-1 SAMPLE OF HOTELS SOLD – SELECT-SERVICE HOTEL
Hotel LocationNumber of
Rooms
Date of
Sale
Courtyard by Marriott Myrtle Beach, SC 157 Jun-18 11.3 % 19.4 % 8.9 % 9.2 %
SpringHi l l Sui tes Fa irfax, VA 140 Jun-18 9.3 17.9 6.7 7.0
Hampton Inn & Suites Harrison, NJ 165 May-18 10.1 18.1 7.9 7.1
Aloft Si l i con Val ley Newark, CA 174 May-18 10.0 17.0 7.3 7.6
SpringHi l l Sui tes Centrevi l le, VA 136 May-18 10.3 18.6 7.3 8.0
Staybridge Suites Wi lmington, NC 93 Apr-18 11.5 21.4 9.6 9.6
Aloft Harlem New York, NY 124 Mar-18 9.8 15.5 6.0 3.8
Hampton Inn Financia l Dis trict New York, NY 81 Mar-18 8.3 12.7 4.5 5.0
Res idence Inn by Marriott Sacramento, CA 126 Feb-18 10.5 18.9 8.7 9.6
Hampton Inn Denver Southwest Lakewood, CO 150 Feb-18 12.7 21.3 10.7 13.9
Hyatt Place Chandler, AZ 129 Jan-18 9.4 15.7 7.5 6.8
Wyndham Garden Greenvi l le, SC 139 Jan-18 14.2 24.2 6.0 7.7
Hampton Inn Cincinnati Fa i rfield, OH 100 Jan-18 12.2 20.9 10.5 10.7
Hampton Inn Atlanta Col lege Park, GA 127 Jan-18 9.3 15.0 10.1 10.0
Hampton Inn Atlanta Northwest Atlanta, GA 127 Jan-18 14.9 26.1 11.0 10.0
Hi l ton Garden Inn Al lentown West Breinigsvi le, PA 111 Nov-17 10.8 18.9 8.1 8.6
Courtyard by Marriott Tucson Airport Tucson, AZ 149 Nov-17 9.7 16.1 8.9 8.3
Hampton Inn Sa int Augustine I-95 Saint Augustine, FL 67 Sep-17 11.9 21.0 11.3 10.8
Hampton Inn & Suites Pa lm Coast Palm Coast, FL 94 Sep-17 12.5 21.2 10.2 10.6
Element Denver Park Meadows Lone Tree, CO 123 Aug-17 10.3 18.7 5.9 8.1
SpringHi l l Sui tes by Marriott Savannah, GA 79 Aug-17 12.1 20.8 4.0 9.3
TownePlace Suites by Marriott Waco, TX 93 Aug-17 11.2 20.7 8.5 7.8
Courtyard SeaWorld Lackland San Antonio, TX 96 Aug-17 11.0 18.9 7.9 7.8
Courtyard Kaua'i at Coconut Beach Kapa'a , HI 311 Aug-17 11.5 19.4 6.4 4.1
Hampton Inn by Hi l ton Norfolk Virginia Beach, VA 120 Jul -17 11.4 21.2 12.4 12.6
TownePlace Suites by Marriott Ta l lahassee, FL 94 Jul -17 10.5 16.1 14.5 7.9
Hyatt Place US Capitol Washington, D.C. 200 Jun-17 10.3 20.0 6.1 7.2
Hyatt Place San Jose Downtown San Jose, CA 234 Jun-17 12.2 21.4 8.1 8.5
Courtyard by Marriott Boston Cambridge, MA 207 Jun-17 9.0 14.9 5.5 6.0
Hi l ton Garden Inn Phi ladelphia Fort Washington, PA 146 May-17 10.9 19.7 7.6 8.3
Hampton Inn Northlake Atlanta, GA 121 May-17 11.5 20.0 9.4 9.6
Hyatt House Denver Airport Denver, CO 123 May-17 11.5 21.9 7.0 8.7
Courtyard by Marriott Maui Kahului , HI 138 May-17 8.1 12.7 6.0 6.0
Courtyard by Marriott Rock Hi l l , SC 90 Apr-17 12.5 23.6 15.2 11.1
Hampton Inn DeKalb, IL 80 Mar-17 10.7 19.1 6.9 8.1
Average 133 11.0 19.1 8.4 8.4
Overall Rate
Based on Sales Price
Total Property
Yield
Equity
Yield
Historical
Year
Projected
Year One
Source: HVS
The total property yield ranged from 8.1% to 14.9% for the sampled hotels with an average yield of 11.0%. Equity yield ranged from 12.7% to 26.1%, with an average yield of 19.1%

Convention, Sports & Entertainment Facilities Consulting Chicago, Illinois
January 22, 2019 Proposed Hotel Feasibility Analysis Proposed Convention Center Hotel - Modesto, California 8-3
For purposes of valuing the Proposed Hotel, we project a sale after ten years of operation from the opening of the property. Consequently, it is necessary to estimate the value of the property upon sale in the 10th year. The value of the hotel at the sale is estimated by dividing the projected 11th-year net income by the terminal capitalization rate.
We have reviewed several recent investor surveys, and Figure 8-2 summarizes the data to determine the terminal capitalization rate at which to price the sale of the Proposed Hotel. Note that survey data lag the market and do not necessarily reflect the most current market conditions.
FIGURE 8-2 EQUITY, DISCOUNT, TERMINAL, AND OVERALL RATES DERIVED FROM INVESTOR SURVEYS
Equity Yield Rate Discount Rate Terminal Rate Overall Rate
Average Average Average Average
HVS/Hotel Sa les 12.7% - 22.9% 8.2% - 13.1% NR 2.3% - 10.8%
Ful l -Service & Luxury Hotels 17.2% 10.3% 7.0%
HVS/Hotel Sa les 12.7% - 26.1% 8.1% - 14.9% NR 4% - 15.2%
Select-Service & Extended-Stay 19.1% 10.9% 8.4%
HVS Broker Survey 7.0% - 12.0% 4.5% - 10.0% 5.0% - 8.5%
Ful l -Service Hotels - NR 9.4% 7.7% 7.1%
Fal l 2018
HVS Broker Survey NR 6.0% - 12.0% 5.0% - 10.0% 4.0% - 8.5%
Luxury/Upper-Upscale Hotels - 8.8% 7.0% 6.2%
Fal l 2018
HVS Broker Survey NR 7.0% - 15.0% 4.5% - 10.0% 5.0% - 9.0%
Select-Service Hotels - 10.1% 8.3% 7.8%
Fal l 2018
PWC Real Estate Investor Survey 0 8.0% - 13.0% 7.0% - 10.0% 6.0% - 10.0%
Ful l -Service Hotels - 10.2% 8.4% 7.7%
Fal l 2018
PWC Real Estate Investor Survey NR 6.25% - 12.0% 5.5% - 9.5% 4.0% - 9.0%
Luxury/Upper-Upscale Hotels - 9.5% 7.3% 7.1%
3rd Quarter 2018
PWC Real Estate Investor Survey
Source
Terminal Capitalization Rate

Convention, Sports & Entertainment Facilities Consulting Chicago, Illinois
January 22, 2019 Proposed Hotel Feasibility Analysis Proposed Convention Center Hotel - Modesto, California 8-4
These surveys produce a wide range of terminal cap rates from 4.5% to 10.0% for select-service hotels and overall rate average from 4.0% to 10.0% for select-service hotels.
HVS gathered data on the costs of 36 recently developed select-service hotels projects during the years 2016 through 2018. Projects costs were reported by the respective developers and include hard construction costs, site improvements, furniture fixtures and equipment (“FF&E”), pre-opening and working capital, soft costs, site costs including land, and development fees. HVS selected properties located in similary markets for construction costs, hotels in the upper midscale class (as defined by STR), properties with significant amounts of function space, and nationally branded hotels.
Figure 8-3 shows the range of cost per rooms for those projects as adjusted for 2019 construction costs.
FIGURE 8-3 SELECT-SERVICE HOTELS COST OF DEVELOPMENT PER ROOM
IN 2019 DOLLARS
$0
$50,000
$100,000
$150,000
$200,000
$250,000
$300,000
The average cost per rooms was approximately $202,000 with a low of $160,000 and a high of $271,000. The costs per room varies with the room count of the hotels as shown in Figure 8-4.
Comparable Hotels Cost of Construction
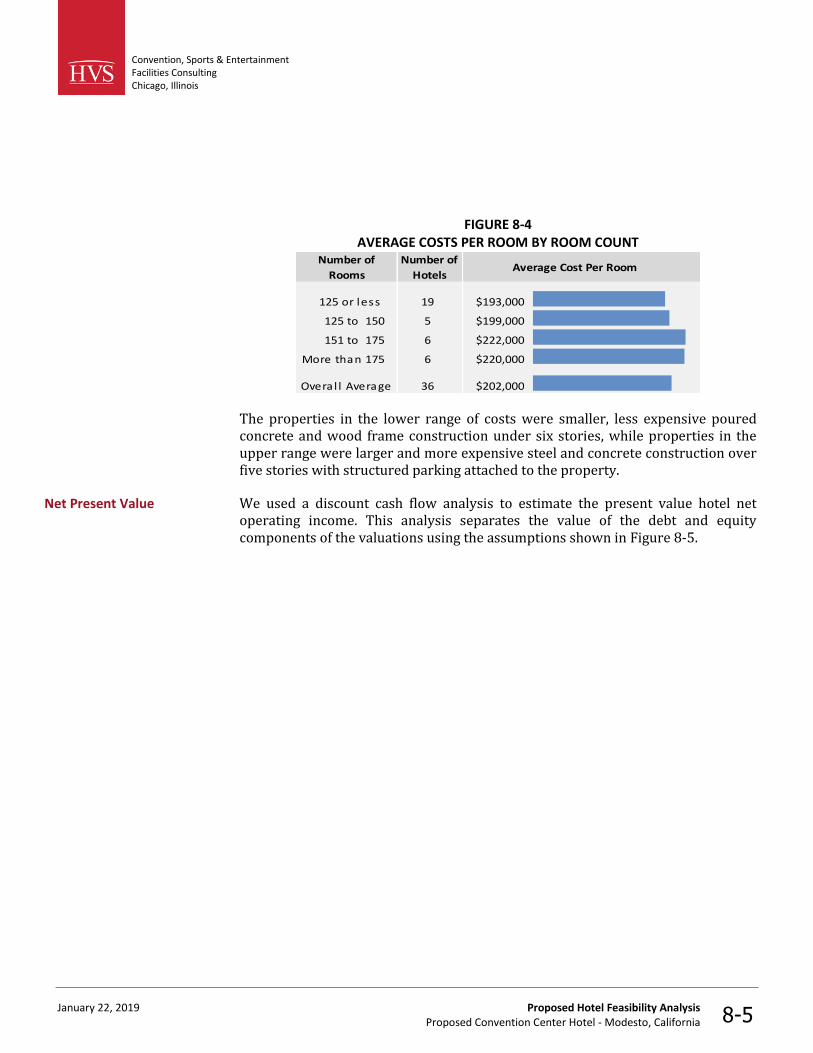
Convention, Sports & Entertainment Facilities Consulting Chicago, Illinois
January 22, 2019 Proposed Hotel Feasibility Analysis Proposed Convention Center Hotel - Modesto, California 8-5
FIGURE 8-4 AVERAGE COSTS PER ROOM BY ROOM COUNT
Number of
Rooms
Number of
HotelsAverage Cost Per Room
125 or less 19 $193,000
125 to 150 5 $199,000
151 to 175 6 $222,000
More than 175 6 $220,000
Overa l l Average 36 $202,000
The properties in the lower range of costs were smaller, less expensive poured concrete and wood frame construction under six stories, while properties in the upper range were larger and more expensive steel and concrete construction over five stories with structured parking attached to the property.
We used a discount cash flow analysis to estimate the present value hotel net operating income. This analysis separates the value of the debt and equity components of the valuations using the assumptions shown in Figure 8-5.
Net Present Value

Convention, Sports & Entertainment Facilities Consulting Chicago, Illinois
January 22, 2019 Proposed Hotel Feasibility Analysis Proposed Convention Center Hotel - Modesto, California 8-6
FIGURE 8-5 PRELIMINARY ASSESSMENT OF FEASIBILITY
Assumptions
Rooms 200
Loan-To-Value Ratio 65%
Blended Yield Senior and Mezz. 5.00%
Equity Yield 16.00%
Transaction Costs for Sa le 2.00%
Sale End of Year 10
Terminal Capita l i zation Rate 8.50%
Property Tax Rate 1.09%
Loaded Terminal Capita l i zation Rate 9.59%
Total Property Yield 9.94%
Estimated Value at Opening January 1, 2021
Mortgage Component $24,149,691
Equity Component 13,003,680
Total $37,153,370
Value per Room $185,767
Assumptions Range of Costs
$185 thousand per Room $37,000,000
$200 thousand per Room $40,000,000
$215 thousand per Room $43,000,000
Possible Funding Surplus (Gap)
$185 thousand per Room $153,370
$200 thousand per Room ($2,846,630)
$215 thousand per Room ($5,846,630)
Due to the Proposed Hotel's California location and the higher property tax implications upon the sale at the end of the hold, the terminal capitalization rate is loaded with the tax rate and is applied to the NOI estimate before property taxes.
The financing assumptions reflect current credit market conditions for financing select-service hotels. HVS relied on its survey of hotel transactions to determine debt–equity splits, yield requirements, and capitalization rates.
Based on these assumptions, a 200-room select-service hotel would have a value of approximately $37.2 million or $186,000 per room. Development costs including

Convention, Sports & Entertainment Facilities Consulting Chicago, Illinois
January 22, 2019 Proposed Hotel Feasibility Analysis Proposed Convention Center Hotel - Modesto, California 8-7
land could range from $185,000 to $215,000 per room. Consequently, the funding gap could range from slightly above breakeven to a $5.8 million gap. In the absence of a specific project plan, these estimates should be considered rough approximations of value and costs.
The discount cash flow calculation for the Proposed Hotel is shown in Figure 8-6.
FIGURE 8-6 DISCOUNTED CASH FLOW ANALYSIS FOR THE PROPOSED HOTEL
Discount Rate 9.94%
Terminal Cap 8.50%
Loaded Cap 9.59%
Transaction Costs 2.0%
Term in Years 10
@ 9.94%
YearEBITDA Less
ReservesDiscount
Factor
Discounted
Cash Flow
2021 $2,135,973 0.90960 $1,942,875
2022 2,696,340 0.82737 2,230,864
2023 3,122,296 0.75257 2,349,750
2024 3,220,249 0.68454 2,204,379
2025 3,321,599 0.62265 2,068,203
2026 3,425,458 0.56636 1,940,054
2027 3,532,497 0.51516 1,819,810
2028 3,643,383 0.46859 1,707,255
2029 3,757,218 0.42623 1,601,434
2030 49,752,180 0.38770 19,288,747
Estimated Market Value $37,153,370
(Say) $37,200,000
Reversion Analysis
11th Year's EBITDA Less Reserves $3,979,173
Capita l i zation Rate 8.50%
Total Sa les Proceeds $46,813,795
Less : Transaction Costs @ 2.0% 936,276
Net Sa les Proceeds $45,877,519
Significant uncertainties exist concerning the cost of developing the Proposed Hotel on the site including the following.
• The amount the developer pays for the site will be determined after negotiations with the City. We assume price will be fair market value.

Convention, Sports & Entertainment Facilities Consulting Chicago, Illinois
January 22, 2019 Proposed Hotel Feasibility Analysis Proposed Convention Center Hotel - Modesto, California 8-8
• Selection of the brand – franchise fees and capital costs requirements vary based on the brand standards.
• Ownership – The experience and resources of the owner will affect the timing, quality, ad expense of delivering the project.
• Potential for sharing of the MCP with the DoubleTree Hotel, which may change the size and configuration of the meeting facilities needed at the Proposed Hotel.
• Small site size – the limited footprint for the hotel may require more expensive vertical construction which would negatively impact the feasibility of the project. Physical planning beyond the scope of this study will be necessary to determine the most cost-effective design solution.
• Cost of the connection to the MCP – An enclosed connection from the Proposed Hotel to the MCP would be attractive to convention and conference groups but constructing this connection could be an added financial burden to the project.
• Location of parking – for the purposes of this study, we have assumed 200 parking spaces required for the hotel plus parking displaced by the project would be provided on an adjacent site or by other City parking. Providing on-site parking would be a costly addition to the project due to the small site size.
These uncertainties about project costs will become more defined as the City moves forward with developer selection and negotiation process.

Convention, Sports & Entertainment Facilities Consulting Chicago, Illinois
January 22, 2019 Economic Impact Proposed Convention Hotel- Modesto, California 9-1
9. Economic Impact
Based on the demand projections presented in this report, HVS identified the new spending that would occur in the local economy due to the development of the proposed convention hotel adjacent to the Modesto Centre Plaza (“MCP”). HVS estimated the amounts of income and employment that new visitors and event organizers would generate in the City of Modesto, California.
Figure 9-1 illustrates our methodology.
FIGURE 9-1 METHODOLOGY FOR ECONOMIC AND FISCAL IMPACT ANALYSIS
Percent Newto Market
Net NewDemandNet Demand
l
NetDirect
HotelSpending
Spending
Spending GrossDirect
Spending
JobIMPLAN IMPLANIndirectSpending
per ImpactsOtherVisitor
Spending
Attendee
InducedSpending
I
*Detailed
Net EffectiveTax Rate
Net FiscalImpactsSpending
by Sector(Tax Base)
Convention, Sports & Entertainment Facilities Consulting Chicago, Illinois
January 22, 2019 Economic Impact Proposed Convention Hotel- Modesto, California 9-2
In preparing this economic impact analysis, we considered the development scenario presented in Section 4, which includes the following assumptions
1) The Proposed Hotel is accompanied by modification to the MCP’s booking policy to reduce the booking window for local events to 12 months and expand MCP availability for conferences and other events that would generate rooms nights in the market.
2) The Proposed Hotel is accompanied by major improvements to the MCP, including the repurposing of some rooms and renovations to existing spaces.
3) The operator of the DoubleTree Hotel or the proposed new convention hotel assumes management responsibility and possibly ownership of the MCP through a management agreement or purchase and sale agreement with the City of Modesto (via its successor agency).
Spending falls into three categories:
• Direct spending includes the new spending of hotel guests, event attendees, and organizers. For example, an event attendee’s expenditure on a restaurant meal is a direct spending impact. Direct spending includes only new spending that originates from outside. Spending by attendees who live within the market area is a transfer of income from one sector of the area’s economy to another; therefore, this analysis does not count spending by residents as a new economic impact.
• Indirect spending follows from the business spending resulting from the initial direct spending. For example, an event attendee’s direct expenditure on a restaurant meal causes the restaurant to purchase food and other items from suppliers. The portion of these restaurant purchases that remain within Modesto count as indirect impacts.
• Induced spending represents the change in local consumption due to personal spending by employees whose incomes change from direct and indirect spending. For example, a waiter at a local restaurant may have more personal income because of an event attendee dining at the restaurant. The amount of the increased income that the waiter spends in the local economy is an induced impact.
To generate direct spending estimates, HVS applied assumptions about the amounts of new spending generated by events. HVS used the IMPLAN input-output model of the local economy to estimate indirect and induced spending. The sum of direct, indirect, and induced spending estimates make up the total estimated spending impact of the proposed development of the convention hotel.
Direct, Indirect, and Induced Spending

Convention, Sports & Entertainment Facilities Consulting Chicago, Illinois
January 22, 2019 Economic Impact Proposed Convention Hotel- Modesto, California 9-3
Some refer to indirect and induced impacts as multiplier effects. The relationship between direct spending and the multiplier effects vary based upon the specific size and characteristics of a local area’s economy.
HVS identified three sources of new direct spending impact:
• Overnight Guests: Visitors to Modesto who require overnight lodging, including event attendees and other hotel guests. Overnight guest spending includes spending on lodging, meals, shopping, local transportation, recreation and entertainment, and other goods and services while in town.
• Daytrip Attendees: Visitors to the MCP who do not require paid lodging. In most markets, day-trippers typically spend money on meals, shopping, local transportation, recreation and entertainment, and other goods and services while in town.
• Event Organizers: Individuals, associations, or other organizations that plan, sponsor, organize, and coordinate events that take place at the MCP. In addition to facility spending, event organizers also spend on lodging, meals, local transportation, facility rentals, equipment rentals, and other goods and services required to plan and organize a successful event.
Estimation of new spending of each of these sources involves three sets of assumptions: 1) the number of new visitors to the market, 2) the geographic location of their spending, and 3) the amounts typically spent by each of the sources.
HVS estimated the percentage of each visitor type that would come from outside the market rather than from the local area. The spending estimates only include new visitor spending because non-residents import income, whereas residents transfer income already in the market area.
• Overnight Guests - HVS assumes that 100% of overnight guests attending MCP events are new to Modesto. We determined the new overnight visitation to Modesto by determining which events could occur at other venues in Modesto and which could only occur at the MCP.
• Day Trips – Estimates are based on the percentage of the population for the market area as a percentage of the total drive time population, defined as the market within a 45-minute drive of the MCP. HVS found that 85% of day trippers would be new to the market.
• Meeting and Event - Organizer spending on Attendees/Delegates – HVS based estimates on the percentage of attendees by events organized by companies and planners that would otherwise not hold or participate in an
Sources of Direct Spending
New Visitors

Convention, Sports & Entertainment Facilities Consulting Chicago, Illinois
January 22, 2019 Economic Impact Proposed Convention Hotel- Modesto, California 9-4
event in Modesto. HVS assumed 100% of event organizer spending would be new to Modesto.
• In addition to attracting new events to the MCP, the development of the proposed hotel would draw overnight corporate and leisure demand that is currently booking properties outside of Modesto into the City. Based on the percentage of competitive guest rooms within the City limits, we project that approximately 62% of corporate and leisure demand at the proposed hotel would be new to Modesto.
The product of the visitor forecasts and the percent of demand new to the market yields an estimate of the sources of impact shown in the table below. That is:
Total Overnight Guests X Percent New = New Overnight Stays
Total Day Trips X Percent New = New Day Trips
Total Delegate Days X Percent New = New Delegate Days
Figure 9-2 shows the number of new visitors to Modesto that generate new spending. We include only those MCP event types that increase due to the presence of the convention hotel. Any displaced events that could generate visitor spending would be accommodated by other venues in the local market.
FIGURE 9-2 SUMMARY OF NET NEW SPENDING GENERATORS
Demand TypeOvernight
Visitor DaysDay Trips
Delegate-
Days *
City of Modesto
Conferences 12,900 5,900 19,800
Meetings 3,800 0 7,500
Trade Shows 600 1,000 1,400
Hotel Bus iness 6,400 0 0
Hotel Leisure 12,300 0 0
Tota l 36,000 6,900 28,700
*Used to estimate organizer spending.
Delegates, attendees, and event organizers spend locally on lodging, meals, local transportation, facility rentals, vendor services, meeting room rentals, equipment rentals, and other goods and services.
To estimate the spending for overnight and day trip visitors, HVS used results from several tourism spending data sources. Our primary source is the Travel USA study by Longwoods International. This survey is conducted annually with a sample size
Spending Parameters

Convention, Sports & Entertainment Facilities Consulting Chicago, Illinois
January 22, 2019 Economic Impact Proposed Convention Hotel- Modesto, California 9-5
of approximately 350,000 trips and assesses origin, spending, party size, and the primary purpose of the trip. HVS supplements this with the Destination International (“DI”) Convention Expenditure & Impact Study which surveyed event organizers across over 1,000 events to gather daily spending parameters on overnight convention attendees, day-trip event attendees, exhibiting companies, and event organizers. HVS applies parameters from the Corporate Travel Index (“CTI”) to account for local spending patterns. Adjusted data from DI provides estimates of organizer spending per visitor day.
All spending parameters are stated as the daily spending by individual overnight guests and day-trippers in 2018 dollars. Figures 9-3 and 9-4 present the direct spending estimates for each spending category.
FIGURE 9-3 VISITOR SPENDING PER DAY – MCP EVENTS
Overnight Convention Attendees $304.10
Hotel Average Dai ly Room Rate 38%
Food & Beverage 22%
Other Hotel Charges 13%
Retai l 10%
Transportation at Destination 9%
Recreation 8%
Daytrip Convention Attendees $150.27
Food & Beverage 45%
Retai l 20%
Transportation at Destination 19%
Recreation 16%
Organizer Spending per Delegate Day $4.72
Retai l Stores - General Merchandise 27%
Advertis ing and Related Services 21%
Hotels and Motels , Including Cas ino Hotels 25%
Hotel Room Rate 25%
Automotive Equipment Rental and Leas ing 1%
State and Local Government Passenger Trans i t 1%
Trans i t and Ground Passenger Transportation 0%
Food Services and Drinking Places 0%
Sources: Longwood International, DI, STR, CTI
II

Convention, Sports & Entertainment Facilities Consulting Chicago, Illinois
January 22, 2019 Economic Impact Proposed Convention Hotel- Modesto, California 9-6
FIGURE 9-4 VISITOR SPENDING PER DAY – HOTEL GUESTS
Business Overnight Attendees $274.94
Hotel Average Dai ly Room Rate 42%
Food & Beverage 20%
Other Hotel Charges 14%
Transportation at Destination 12%
Retai l 8%
Recreation 5%
Leisure Overnight Attendees $176.20
Hotel Average Dai ly Room Rate 56%
Other Hotel Charges 19%
Food & Beverage 9%
Retai l 6%
Recreation 6%
Transportation at Destination 4%
Sources: Longwood International, STR, CTI
In Figure 9-5, HVS applies the previous sources of spending impacts and spending parameters to estimate gross direct spending for a stabilized year.
FIGURE 9-5 NET NEW GROSS DIRECT SPENDING
City of Modesto
Convention Delegate Overnight Spending = 17,270 overnight vis i tors x $304.10 = $5.25 M
Convention Delegate Daytrip Spending = 6,900 daytrip vis i tors x 150.27 = 1.04
Event Organizer Spending per attendee = 28,800 attendees x 4.72 = 0.14
Business Overnight Guests = 6,400 overnight vis i tors x 274.94 = 1.76
Leisure Overnight Guests = 12,300 overnight vis i tors x 176.20 = 2.17
Total Gross Direct Spending = $10.35 M
HVS uses the IMPLAN input-output model to estimate indirect and induced spending and employment impacts. IMPLAN is a nationally recognized model developed at the University of Minnesota and commonly used to estimate economic impacts. An input-output model generally describes the commodities and income that normally flow through the various sectors of a given economy. The indirect and induced spending and employment effects represent the estimated changes in the flow of income, goods, and services caused by the estimated direct spending. The
Gross Direct Spending
IMPLAN Impact Modeling

Convention, Sports & Entertainment Facilities Consulting Chicago, Illinois
January 22, 2019 Economic Impact Proposed Convention Hotel- Modesto, California 9-7
IMPLAN model accounts for the specific characteristics of the local area economy and estimates the share of indirect and induced spending that it would retain.
HVS categorized new direct expenditures into spending categories that we provide inputs into the IMPLAN model. Specifically, the IMPLAN model relies on spending categories defined by the U.S. Census according to the NAICS. Because the spending data from the spending surveys used by HVS do not match the NAICS spending categories, HVS translates the spending categories into the NAICS spending categories that most closely match.
Not all of the gross direct spending counts as an economic impact because some of the spending does not generate income within the market. HVS adjusts gross direct spending to account for income that leaks out of the local economy by estimating retail margins and local purchase parentages. As a result, the realized direct spending (“net direct spending”) is lower than the gross direct spending in the market area.
Spending at retailers creates a smaller economic impact compared to spending in other industries. Retailers add value equal to the margin or price increase of the good above the original price paid to obtain the good. The IMPLAN model is product based, so HVS uses IMPLAN margin numbers to account for the discrepancy between retail purchaser prices and producer prices.
To accurately measure spending impacts, HVS counts spending on products and services located in the market area. Some of the direct spending demand in the market area cannot be accommodated. For example, an event organizer may need to buy novelty items for all attendees but find that the market area does not produce these items. This effect occurs for direct, indirect, and induced spending. HVS uses the IMPLAN SAM model values to track the percentage of a good purchased within the market area.
The relationship between direct spending and the multiplier effects can vary based on the specific size and characteristics of a local area’s economy. HVS enters the gross direct spending estimate into the IMPLAN input-output model of the local economy to estimate the net direct, indirect and induced spending. HVS obtained the most recent available data from IMPLAN for Modesto.
The following figures present the output of the IMPLAN model–the net new direct, indirect, and induced economic impacts and that are attributable to the proposed development of the convention hotel. HVS also used IMPLAN to estimate the jobs created based on the direct, indirect, and induced spending estimates.
Annual Net Direct Spending
Retail Margins
Local Purchase Percentage
Indirect and Induced Spending

Convention, Sports & Entertainment Facilities Consulting Chicago, Illinois
January 22, 2019 Economic Impact Proposed Convention Hotel- Modesto, California 9-8
Figure 9-6 shows the annual net direct, indirect and induced spending generated in Modesto.
FIGURE 9-6 ANNUAL ECONOMIC IMPACT ESTIMATES
Impact ($ millions)City of
Modesto
Spending Estimates
Net Direct $8.6
Indirect 2.5
Induced 2.2
Total $13.3
The proposed capital investment in the development of the hotel and improvements to the MCP would likely be repaid over a 25-year period that coincides with the useful life of the assets. As a point of comparison with the capital investment, HVS calculated the present value of the net spending that it would generate over a 25-year period. We assumed a 5% discount rate that approximates the weighted cost of public sector capital. Figure 9-7 shows the present value of spending impacts.
FIGURE 9-7 NET PRESENT VALUE
$ Millions
City of Modesto $213
*Stated in constant 2018 dollars.
Over a 25-year period, the present value of net spending impact exceeds $200 million. The amounts of impact should be compared to the potential capital investment in the project.
HVS calculated the full-time equivalent jobs supported by the spending in each economic sector. Figure 9-8 summarizes the results.
Annual Net Spending Impacts
Present Value of Net Spending
Employment Impacts

Convention, Sports & Entertainment Facilities Consulting Chicago, Illinois
January 22, 2019 Economic Impact Proposed Convention Hotel- Modesto, California 9-9
FIGURE 9-8 EMPLOYMENT IMPACT IN A STABILIZED YEAR
Full-Time Equivalent JobsCity of
Modesto
Direct 80
Indirect 14
Induced 12
Total Permanent Jobs 106
By a stabilized year of operation, the project would support over 100 permanent full-time-equivalent jobs though many jobs would be part-time Employment impact projections reflect job created throughout Modesto.
Fiscal impacts represent the public-sector share of the economic impacts from tax collections on new spending. The previously discussed spending estimates provide a basis for estimating potential tax revenue, as Modesto would collect some of the spending through taxation.
The IMPLAN analysis results in direct, indirect, and induced spending classified into hundreds of detailed spending categories. HVS evaluated each of these spending categories to determine which taxes would apply to each type of spending output. HVS applied effective tax rates to a detailed breakdown of new spending and income categories that result from the development of the convention hotel. HVS then estimated the potential annual revenue from each tax source.
For other City tax sources, such as corporate profits tax, we relied on IMPLAN estimates of annual collections. Fiscal impacts on the City of Modesto also include the new property taxes paid by the convention hotel.
Figure 9-9 provides a summary of the fiscal impacts in 2018 dollars.
Fiscal Impacts

Convention, Sports & Entertainment Facilities Consulting Chicago, Illinois
January 22, 2019 Economic Impact Proposed Convention Hotel- Modesto, California 9-10
FIGURE 9-9 SUMMARY OF FISCAL IMPACTS ON CITY OF MODESTO – STABILIZED YEAR
Tax Category Tax BaseEffective Tax
Rate
Annual
Estimated Tax
Revenue
State Sales Tax to Local Revenue Fund $11,250,406 1.56% $175,800
Local Sales Tax 11,250,406 1.00% $112,500
Local Transportation Measure L 11,250,406 0.25% $28,100
Local Public Safety Fund 11,250,406 0.50% $56,300
Transient Occupancy Tax $4,968,300 9.00% $447,100
Corporate Income Taxes * $22,200
Hotel Property Tax ** $362,300
Total $1,204,300
* Based on Implan tax estimates
** Based on HVS hotel analys is
Sources: IMPLAN and HVS
Seven tax sources would generate approximately $1.2million in annual tax revenue to the City of Modesto in a stabilized year of operation.
Figure 9-10 summarizes recurring annual economic and fiscal impacts in a stabilized year.
FIGURE 9-10 SUMMARY OF ECONOMIC AND FISCAL IMPACTS
Summary of Impacts*City of
Modesto
Economic Impact (mi l l ions) $8.6
Fisca l Impact (mi l l ions) $1.20
Jobs 106
*In a stabilized year.
These economic and fiscal impact estimates are subject to the assumptions and limiting conditions described throughout the report. Numerous assumptions about future events and circumstances form the basis for these estimates. Although we consider these assumptions reasonable, we cannot provide assurances that the project will achieve the forecasted results. Actual events and circumstances are likely to differ from the assumptions in this report and some of those differences may be material. The readers should consider these estimates as a mid-point in a range of potential outcomes.
r

Convention, Sports & Entertainment Facilities Consulting Chicago, Illinois
January 22, 2019 Public Private Partnerships Proposed Convention Center Hotel - Modesto, California 10-1
10. Public Private Partnerships
Public sector involvement in convention center hotel projects is common due to the high cost of development and lack of private capital for such investments. Event planners expect the presence of a hotel adjacent to a convention center. Consequently, proximate hotels are essential for many convention centers to remain competitive in the convention center industry. Hotels provide both long- and short-term economic and fiscal benefits to a community in the form of visitor spending, temporary and permanent job creation, and the resulting tax collections. As most communities desire the economic impact of group events and the spending of the visitors they attract, many are providing public subsidies to projects that are not feasible with only private investment.
Public involvement in hotel development may be divided into two general categories: 1) public-private partnerships (“P3s”), and 2) public financings. In a public-private partnership, the hotel is typically owned and developed by the private partner, and public involvement takes the form of a public subsidy or “bridging the gap” between the cost of constructing and financing a hotel project and the combination of equity and loans a private developer can secure for the project. In the category of public financing, the sponsoring municipality issues taxable or tax-exempt debt to cover the cost of constructing and financing the hotel project, accessing the municipal bond market rather than conventional sources of hotel debt and equity. The net operating revenues of the hotel are pledged as the first source of funds for the repayment of the bonds.
The City of Modesto wishes to pursue a public-private partnership, which will be the focus of this chapter.
The maturation of a highly competitive convention market has placed increasing pressure on cities to improve their appeal by adding hotel supply proximate to their convention venues. A change in tax law in 1996, which expanded the ability of governments to publicly finance hotels with municipal debt, also caused public sector investment in hotels to become more frequent. Most convention hotel developments have required some form of public support, either through public financing and ownership or a through a public-private partnership.
The amount of public support required to finance a hotel through a public-private partnership is dependent upon the gap between the capital cost of the project and the amount of debt and equity that can be raised in the capital markets. Public-private partnerships in hotel development are more frequently used for projects in
Hotel P3 Deal Terms

Convention, Sports & Entertainment Facilities Consulting Chicago, Illinois
January 22, 2019 Public Private Partnerships Proposed Convention Center Hotel - Modesto, California 10-2
which a reasonable amount of public equity investment can make the difference between a feasible and infeasible project.
Figure 10-1 summarized typical deal terms in public-private partnerships.
FIGURE 10-1 SUMMARY OF P3 DEAL TERMS
Issue Terms
Ownership
A privately-owned s ingle purpose enti ty, typica l ly a l imited l iabi l i ty corporation
("LLC") holds ti tle to the hotel . The owner i s respons ible for engaging the developer
and operator.
Operations
The hotel may be managed by a hotel brand company (e.g. Marriott, Hi l ton, Hyatt,
Intercontinental , Lowes). Or the hotel may be operated by a third party with a
franchise agreement to brand the property. Compensation of the manager i s
typica l ly based on a percentage of gross revenue, net operating income or both.
Financing
Privately-owned hotels are typica l ly financed with a mix of debt and equity. In the
current markets , lenders wi l l lend 65% to 70% of the va lue of the project and equity
investors or mezzanine lenders provide the balance of the funding. Typica l ly the
developer obtains a variable rate construction loan, which is later replaced with
permanent financing when hotel operations s tabi l i ze. Equity investment i s
obtained by sel l ing s tock in the LLC and the development group may have a
control l ing interest in the LLC. In publ ic/private partnerships , a governmental enti ty
may a lso provide an equity contribution to the project with l i ttle or no expectation
of obtaining a return on their equity investment.
Cost of Funds
Interest rates on permanent debt may range from 5% to 6% in the current financia l
markets . Private equity investors may require 15% to 20% return on equity due.
These parameters vary depending on credit market conditions and the avai labi l i ty
of capita l for hotel investment.
Forms of
Public
Subsidies
Publ ic subs idies may take the form of land contributions , infrastructure and parking
development, tax abatements , tax turn-backs , tax-sharing agreements , and cash
subs idies . Publ ic subs idies must be tied to the publ ic benefi ts the project wi l l
del iver.
Project
Income
Sharing
The investors in the LLC usual ly cla im the res idual project income from operations
and the sa le of the asset. Municipa l i ties may negotiate a share of project income
in exchange for providing publ ic subs idies . Developers often negotiate a "preferred
return," which gives the developer a fi rs t cla im on income.
The financial feasibility of a hotel depends on several factors, including:
• construction costs,
• estimated net operating income of the hotel,

Convention, Sports & Entertainment Facilities Consulting Chicago, Illinois
January 22, 2019 Public Private Partnerships Proposed Convention Center Hotel - Modesto, California 10-3
• interest rate levels,
• availability of equity,
• seasonality and volatility of the local hotel market, and
• other factors that affect the allocation of investment risk and return.
Despite positive market indicators and demand potential, some hotel projects do not generate enough net operating income to support their capital costs. Public incentives can help bridge the gap and encourage private development of high impact projects. P3s in hotel development are more frequently used in mid-sized, full-service hotel projects (150 to 500 rooms) in which a reasonable amount of public equity investment can make the difference between a feasible and infeasible project. Smaller projects typically generate more modest economic and fiscal impacts and only justify a limited investment on the part of the sponsoring municipality.
In some communities, a P3 is the only politically acceptable form of government support. Often other local hotel owners demand limits on government support of potentially competitive products. This is particularly true in stressed hotel markets where the proposed property would not induce significant amounts of new demand.
To assess trends and current industry practices in hotel P3s, HVS analyzed 48 existing and planned projects. These projects included hotels with 100 to 400 rooms and associated resort or conference amenities. We included some projects that have not yet opened. While these projects may change in scope, size, timing, or level of public participation, they provide insight into the current state of industry practices. To perform our research HVS relied on the following data sources: 1) an HVS proprietary data base that tracks hotel sales transactions and operating histories, 2) HVS data base of prior hotel research reports that contains information on some hotel transactions that involved public financing or PPPs, 3 )publicly available offering statements and other prospectuses on hotel transactions, 4) third party information on projects including industry and general media sources, and 5) first-hand knowledge of certain projects based on prior involvement in consulting activities related to the project.
The properties analyzed opened or will be open between 1980 and 2020 and have an average of 252 rooms. The average cost of the comparable projects was approximately $243,160 per room (stated in 2017 dollars). These project costs are inclusive of hard construction, furniture fixtures and equipment, and other related soft costs. Project costs are wide ranging depending on the location, timing, and quality of the hotel. The average cost per room for hotels other than full-service
Trends

Convention, Sports & Entertainment Facilities Consulting Chicago, Illinois
January 22, 2019 Public Private Partnerships Proposed Convention Center Hotel - Modesto, California 10-4
averaged $224,351 in 2017 dollars, and $274,569 for full-service hotels. The large number of Embassy Suites Hotels in the non-full-service category significantly increased the average cost per room. Figure 10-2 provides a distribution of costs per room for the comparable projects.
FIGURE 10-2 COST PER ROOM
13%
22%
16%
25% 25%
$100,000 to$150,000
$151,000 to$200,000
$201,000 to$250,000
$251,000 to$300,000
>$300,000
As shown in Figure 10-3, the largest percentage of P3 transactions took place from 2000 to 2009.
FIGURE 10-3 HOTEL OPENING DATE
2% 11%
58%
29%
1980-1989 1990-1999 2000-2009 2010-2020
Figures 10-4 and 10-5 show over three-quarters of projects received between 10% and 30% public participation. 20% received more than 30%. The overall average

Convention, Sports & Entertainment Facilities Consulting Chicago, Illinois
January 22, 2019 Public Private Partnerships Proposed Convention Center Hotel - Modesto, California 10-5
level of public participation is 27%, with hotels other than full-service averaging 23% and full-service hotels averaging 30%.
FIGURE 10-4 PERCENTAGE OF PUBLIC PARTICIPATION
2%
44%
32%
10% 10%
2%
Less than
10%10% to less
than 20%20% to less
than 30%30% to less
than 40%40% to less
than 50%Greater
than 50%
State law often dictates the forms of allowable public participation except in cities with home rule governments that have broad taxing powers. The most frequently used methods of public subsidy include tax rebates and tax increment financing, including:
• abatement of property taxes or subordination of payments in lieu of taxes to return on equity investment.
• abatement of hotel lodging taxes collected on property or redirection of those taxes to the project.
• a pledge of city-wide or special district lodging taxes to support a publicly-financed component of the project. Less frequently, public entities fund their contribution to the project using:
− food and beverage tax revenues generated by the property or from a special district, or
− general sales taxes or sales taxes from a special district.
Other incentives may include direct municipal participation in land acquisition and the development of project elements, including:
• infrastructure improvements, such as roadway improvements, parking lots and decks, and other supporting development, and
1T

Convention, Sports & Entertainment Facilities Consulting Chicago, Illinois
January 22, 2019 Public Private Partnerships Proposed Convention Center Hotel - Modesto, California 10-6
• publicly-owned developments, such as adjacent meeting and conference spaces, entertainment venues, and other visitor amenities.
Public participation for hotels and resorts may also include:
• funding feasibility studies and other forms of project due diligence,
• issuing municipal debt to offset the developer’s investment in the project,
• a pledge of city-wide or special district lodging taxes to support a publicly financed component of the project,
• development and permit fee waivers, and
• marketing support.
Public agencies may choose from a wide variety of options to provide public support for a convention center hotel project. Whatever forms public support may take, it must be tied to public benefits the project would incur to the local community.
Local government and private industry have worked together to accomplish several hotel projects in California. The following figure illustrates hotel P3 accomplished in California base on prior HVS studies and appraisals, newspaper articles, government press releases, and industry articles.
California P3 Projects

Convention, Sports & Entertainment Facilities Consulting Chicago, Illinois
January 22, 2019 Public Private Partnerships Proposed Convention Center Hotel - Modesto, California 10-7
FIGURE 10-5 CALIFORNIA P3 HOTEL PROJECTS
Opening
YearProject Name and Location Public Participation
2008 Hilton San Diego Bayfront
Development partners given land lease reduction for first eleven years of project - Port
of San Diego has constructed a 2,000-space parking structure that will accommodate
the needs of hotel guests as well as other visitors.
2010JW Marriott LA LIVE, Los
Angeles
City's Community Redevelopment Agency provided a $16 million loan and rebated up to
$270 million in project-generated lodging taxes. The City also waived $4 million in
develoment fees.
Various Disney Luxury Hotels, Anaheim100% of the City of Anaheim’s share of the hotel room tax for 15 years, an amount that
would add up to roughly $150 million. This incentive is per hotel.
2012Hyatt Place Riverside
Downtown
City Council approved the loan in March using federal tax-exempt bonds that were
offered only for private-sector projects. Riverside officials have said the deal was
structured with strong protections for the city, including two cushions of reserve funds
to cover debt service in case the developer could not pay and a provision that would let
the city foreclose on the project in case of default.
2018Great Wolf Lodge Garden
Grove
City will give the developers $52 million in funds earmarked for redevelopment to help
subsidize construction of the resort plus the site valued at $30 million.
2020 Great Wolf Lodge Manteca City will provide the land for the project.
2022 Gaylord Hotel Chula Vista
Developer will invest $785 million of debt and equity and the City of Chula Vista and
Port of San Diego will provide $300 million in public financing. Additional steps and
approvals are in the works, with the groundbreaking scheduled for late 2019.
Construction is expected to take three years to complete.
2022Additional L.A. Convention
Center Headquarters Hotel
AEG and its partners would fund the project but seek financial incentives — probably in
the form of breaks on the hotel's bed taxes. To get the JW Marriott and Ritz-Carlton
complex built in the mid-2000s, the City Council voted to let AEG keep as much as $270
million in bed taxes generated by the project over nearly three decades.
2022 Virgin Hotel Palm Springs75% of the transient occupancy taxes rebated for 30 years from the day of opening, or
until the amount rebated reaches $50 million, whichever comes first.
Governments in California participation in P3 projects are like P3 transactions throughout the county, primarily using favorable land sales, land leases, access to parking, and sharing of taxes generated by the hotel project.
The hotel market conditions in Modesto is currently favorable for the development of additional hotel rooms. The development of a new hotel in downtown Modesto is likely to be costlier per room than elsewhere in the City. This differential in costs is partly offset by a higher RevPAR for the proposed hotel over properties outside of downtown. With the City controlling the site, which it could offer on favorable terms
Implications for Modesto

Convention, Sports & Entertainment Facilities Consulting Chicago, Illinois
January 22, 2019 Public Private Partnerships Proposed Convention Center Hotel - Modesto, California 10-8
to a developer, and a cost-effective parking solution the development of an additional upper-upscale hotel adjacent to the MCP is a realistic option. If the City decides to pursue a full-service hotel.
..

Convention, Sports & Entertainment Facilities Consulting Chicago, Illinois
January 22, 2019 Statement of Assumptions and Limiting Conditions Proposed Convention Center Hotel - Modesto, California 11-1
11. Statement of Assumptions and Limiting Conditions
1. This report is to be used in whole and not in part.
2. All information, financial operating statements, estimates, and opinions obtained from parties not employed by HVS are assumed to be true and correct. We can assume no liability resulting from misinformation.
3. Unless noted, we assume that there are no encroachments, zoning violations, or building violations encumbering the Proposed Hotel.
4. The proposed facility is assumed to be in full compliance with all applicable federal, state, local, and private codes, laws, consents, licenses, and regulations (including a liquor license where appropriate). We assume that all licenses, permits, certificates, franchises, and so forth can be freely renewed or transferred to a purchaser.
5. We are not required to give testimony or attendance in court by reason of this analysis without previous arrangements, and only when our standard per-diem fees and travel costs are paid prior to the appearance.
6. If the reader is making a fiduciary or individual investment decision and has any questions concerning the material presented in this report, it is recommended that the reader contact us.
7. We take no responsibility for any events or circumstances that take place subsequent to the date of our report.
8. No responsibility is assumed for matters of a legal nature, nor do we render any opinion as to title, which is assumed to be marketable and free of any deed restrictions and easements.
9. We assume that there are no hidden or unapparent conditions of the sub-soil or structures, such as underground storage tanks, that would render the proposed property no more or less valuable. No responsibility is assumed for these conditions or for any engineering that may be required to discover them.
10. We have not considered the presence of potentially hazardous materials such as asbestos, urea formaldehyde foam insulation, any form of toxic waste, polychlorinated biphenyls (PCB), pesticides, mold, or lead-based paints. The appraisers are not qualified to detect hazardous substances, and we urge the client to retain an expert in this field if desired.
Convention, Sports & Entertainment Facilities Consulting Chicago, Illinois
January 22, 2019 Statement of Assumptions and Limiting Conditions Proposed Convention Center Hotel - Modesto, California 11-2
11. The Americans with Disabilities Act (ADA) became effective on January 26, 1992. We have assumed that the proposed property will be designed in accordance with the various detailed requirements of the ADA.
12. We have made no survey of the subject site, and we assume no responsibility in connection with such matters.
13. The estimated operating results presented in this report are based on an evaluation of the overall economy and neither consider nor make provision for the effect of any sharp rise or decline in local or national economic conditions. To the extent that wages and other operating expenses may advance during the economic life of the property, we expect that the prices of food, beverages, and services will be adjusted to at least offset those advances. We do not warrant that the estimates will be attained, but they have been prepared on the basis of information obtained during the course of this study.
14. The quality of a facility's on-site management has a direct effect on a property's economic performance. The demand and financial forecasts presented in this analysis assume responsible ownership and competent management. Any departure from this assumption may have a significant impact on the projected operating results.
15. We do not warrant our estimates. We use information obtained during our market research and are intended to reflect reasonable expectations.
16. Many of the figures presented in this report were generated using sophisticated computer models that make calculations based on numbers carried out to three or more decimal places. In the interest of simplicity, most numbers have been rounded. Thus, these figures may be subject to small rounding errors.
17. It is agreed that our liability to the client is limited to the amount of the fee paid as liquidated damages. Our responsibility is limited to the client and use of this report by third parties shall be solely at the risk of the client or third parties. The use of this report is also subject to the terms and conditions outlined in our engagement letter with the client.
18. Although this analysis employs various mathematical calculations, the final estimates are subjective and may be influenced by our experience and other factors not specifically outlined in this report.
19. HVS Convention, Sports & Entertainment Facilities Consulting prepared this report. All opinions, recommendations, and conclusions expressed during this assignment are rendered by the staff of this organization, as employees, rather than as individuals.
20. This report is set forth as a feasibility study of the Proposed Hotel; this is not an appraisal report.
.

Convention, Sports & Entertainment Facilities Consulting Chicago, Illinois
January 22, 2019 Certification Proposed Convention Center Hotel - Modesto, California 12-1
12. Certification
The undersigned certify that, to the best of our knowledge and belief:
1. the statements of fact presented in this report are true and correct;
2. the reported analyses, opinions, and conclusions are limited only by the reported assumptions and limiting conditions, and are our personal, impartial, and unbiased professional analyses, opinions, and conclusions;
3. we have no (or the specified) present or prospective interest in the property that is the subject of this report and no (or the specified) personal interest with respect to the parties involved;
4. we have no bias with respect to the property that is the subject of this report or to the parties involved with this assignment;
5. our engagement in this assignment was not contingent upon developing or reporting predetermined results;
6. our compensation for completing this assignment is not contingent upon the development or reporting of a predetermined value or direction in value that favors the cause of the client, the amount of the value opinion, the attainment of a stipulated result, or the occurrence of a subsequent event directly related to the intended use of this analysis; and
7. Tom Hazinski and Brian Harris participated in the analysis.
Tom Hazinski
Managing Director
Brian Harris
Senior Director