Hurtigruten Group AS Consolidated Financial Statements
25
1 Fourth quarter report 2018 Hurtigruten Group AS Consolidated Financial Statements Published 28 February 2018
Transcript of Hurtigruten Group AS Consolidated Financial Statements

1
Fourth quarter report 2018
Hurtigruten Group AS
Consolidated Financial Statements
Published 28 February 2018

2
Fourth quarter report 2018
Continued occupancy and revenue growth
Highlights
• Strong revenue growth in the fourth quarter of 2018 with total revenue increase of 6.8% to NOK 1,027 million (Q4 2017; NOK 961 million)
• Strong growth in occupancy in the Norwegian Coast segment in the quarter, at 73.8% (Q4 2017: 64.3%)
• Fourth quarter normalized adjusted EBITDA before other gains and losses of NOK 43 million (Q4 2017; NOK 74 million), and full year 2018 NOK 1,141 million (2017, NOK 1,003 million)
• Improved performance in the Expedition cruises segment (former Explorer segment) with 15.1% growth in EBITDA in fourth quarter, to NOK 29 million
• Strong pre-booking levels for 2019 and into 2020 with growth both in volume and yield
• Normalizations items YTD 2018 is mainly i) cancellation costs related to the Roald Amundsen and Fridtjof Nansen delayed delivery date (NOK 39 million) ii) one off non-cash cost related to the acquisition of MS Nordlys (NOK 18 million) iii) one off expenses related to the changed sailing patterns with the MS Fram in the North West Passage due to severe polar ice conditions iv) NOK 12m associated with the process to enter the Norwegian tax tonnage regime
Key figures*
*The figures presented in this report are unaudited
Note: On 26. February 2019, Silk Bidco AS changed name to Hurtigruten Group AS.
4th quarter 4th quarter % 01.01-31.12 01.01-31.12 %
NOK 1 000 2018 2017 Change 2018 2017 Change
Operational revenues 852,749 793,699 7.4 % 4,729,515 4,248,316 11.3 %
Contracual revenues 174,100 167,655 3.8 % 698,919 674,234 3.7 %
Total revenue 1,026,850 961,354 6.8 % 5,428,434 4,922,550 10.3 %
EBITDA 7,772 25,458 -69.5 % 1,073,785 826,311 29.9 %
Norwegian Coast
PCNs 280,818 255,858 9.8 % 1,353,146 1,249,149 8.3 %
Gross ticket yield 2,028 2,009 0.9 % 2,554 2,483 2.8 %
Occupancy rate 73.8 % 64.3 % 9.6 p.p. 83.8 % 78.3 % 5.6 p.p.
Explorer
PCNs 44,189 46,308 -4.6 % 166,681 155,725 7.0 %
Gross ticket yield 5,466 4,984 9.7 % 5,612 5,210 7.7 %
Occupancy rate 73.7 % 66.9 % 6.7 p.p. 72.1 % 68.2 % 3.9 p.p.

3
Fourth quarter report 2018
About Hurtigruten
Hurtigruten is the world’s leading expedition cruise and adventure travel company, with a fleet of 14 expedition
cruise vessels and two new tailor-made expedition cruise vessels do be delivered in 2019. Hurtigruten opens
a unique gateway to experiences in the Arctic, Antarctica and along the Norwegian coast to travelers from all
over the world. Hurtigruten’s operations builds on a rich heritage, having connected the many coastal
communities in Norway since 1893. Today, Hurtigruten combines a deeply-rooted desire to offer genuine local
experiences while leaving a smaller footprint when it shapes the future of the growing expedition cruise market.
For more information on Hurtigruten, please visit www.hurtigruten.no.
Hurtigruten has three business segments:
Hurtigruten Norwegian Coast
The largest segment with 11 ships providing
expedition cruises along the Norwegian coast
between Bergen and Kirkenes making 33
northbound and 32 southbound port calls on an 11-
day round trip. The segments customers are
predominantly international leisure travellers.
The vessel schedule and infrastructure are
leveraged to provide local transport and freight
services on top of the expedition cruise offering
where Hurtigruten receives an annual fixed fee from
the Norwegian government under the coastal service
contract.
From 2021 this segment will operate 7 ships under
the new State agreement. The segment accounted
for 73.6% of group revenues in the fourth quarter of
2018.
Expedition cruises
The second largest segment offering unique
expedition cruises using the vessels MS Fram, MS
Spitsbergen and MS Midnatsol (the latter two vessels
alternating between the Norwegian Coast and
Expedition cruises segments) as well as MS
Nordstjernen which is leased and operated in
Svalbard in the summer season. The Expedition
cruises segment will be strengthened from 2019 and
onward with two new purpose-built polar cruise
ships, The MS Roald Amundsen and the MS Fridtjof
Nansen. The segment accounted for 23.5% of group
revenues in the fourth quarter of 2018. From 2021
the Expedition Cruises segment will be Hurtigruten’s
largest segment when three of the largest vessels
from the Hurtigruten Norwegian Coast segment will
be transferred to the Expedition Cruises segment.
Spitsbergen
Comprises year-round hotel and restaurant activities
as well as Arctic experience tourism in Svalbard.
Hurtigruten Svalbard operates three hotels and an
equipment store. This segment accounted for 2.9%
of the total revenues in the fourth quarter of 2018.
The segment includes two newly refurbished hotels.
Expedition cruises
Hurtigruten Norwegian Coast
Spitsbergen

4
Fourth quarter report 2018
Operational review
Hurtigruten had a strong operational and financial
performance in the fourth quarter of 2018 with growth
in ticket revenue across all segments, and
particularly in the Expedition Cruises segment,
compared with the same period in 2017.
Total Passenger Cruise Nights (PCN) for the two
cruise segments increased 7.6%, or 22,841 PCN in
the fourth quarter of 2018 compared to the same
period last year. The occupancy was 73.8% in fourth
quarter for two segments combined, 9.1 ppt increase
from fourth quarter last year, driven by substantial
increase in demand in both segments
In the Expedition Cruises segment in the fourth
quarter of 2018, the vessels MS Fram and MS
Midnatsol operated in the Antarctic seas, sailing from
Canada and Europe in the beginning of the quarter.
The Antarctic sailings have been well received, with
high occupancy rates at high yields.
Maritime operations continued to perform well across
the company and there were no material incidents in
the second quarter. A total of 173 missed port calls
in the Coastal segment were registered in the fourth
quarter, primarily due to adverse weather conditions.
In the same period in 2017, the Group1 had 163
missed port calls also primarily due to weather.
Pre-bookings for 2019 are materially higher
compared to same time last year and we continue to
experience stronger demand for our itineraries
across all segments. Demand for the winter cruise
product is increasing significantly and this strong
trend is continuing into 2019 and 2020 with higher
booking levels compared to same time last year. We
continue to invest in the sales and marketing
organization to support the future growth as we are
increasing our capacity over the coming years.
1 The Group refers throughout this document to Hurtigruten Group AS consolidated accounts.

5
Results of operations
The following table presents, for the periods indicated, the revenues, operating profit, EBITDA and EBITDA
margin by reporting segment and for the Group as a whole:
(in NOK 1 000) 4th quarter 4th quarter % 01.01-31.12 01.01-31.12 %
Total operating revenues 2018 2017 Change 2018 2017 Change
Hurtigruten Norwegian Coast 755,709 697,412 8.4% 4,211,703 3,833,445 9.9%
Explorer 241,441 230,830 4.6% 935,996 811,497 15.3%
Spitsbergen 29,992 33,196 -9.7% 295,028 292,411 0.9%
Other business 39 71 -45.7% (34) 230 -115.0%
Eliminations (330) (154) -113.8% (14,258) (15,032) 5.1%
Total 1,026,850 961,354 6.8% 5,428,434 4,922,550 10.3%
Operating profit/(loss)
Hurtigruten Norwegian Coast (81,873) (76,928) -6.4% 589,898 294,435 100.3%
Explorer 6,529 4,407 48.2% 63,154 24,327 159.6%
Spitsbergen (19,478) (16,954) -14.9% 22,783 26,362 -13.6%
Other business 78 162 -51.7% 328 581 -43.6%
Eliminations (31) 104 -129.8% 0 64 -100.0%
Total (94,775) (89,210) -6.2% 676,162 345,768 95.6%
EBITDA
Hurtigruten Norwegian Coast (10,031) 13,032 -177.0% 883,724 696,226 26.9%
Explorer 29,307 25,470 15.1% 144,577 85,210 69.7%
Spitsbergen (11,551) (13,320) 13.3% 45,156 44,206 2.2%
Other business 78 173 -54.8% 328 606 -45.9%
Eliminations (31) 104 -129.8% 0 64 -100.0%
Total 7,772 25,458 -69.5% 1,073,785 826,311 29.9%
EBITDA margin
Hurtigruten Norwegian Coast -1.3 % 1.9 % -3.2 p.p. 21.0 % 18.2 % 2.8 p.p.
Explorer 12.1 % 11.0 % 1.1 p.p. 15.4 % 10.5 % 4.9 p.p.
Spitsbergen -38.5 % -40.1 % 1.6 p.p. 15.3 % 15.1 % .2 p.p.
Other business NM NM NM NM
Eliminations NM NM NM NM
Total 0.8% 2.6% -.7 p.p. 19.8% 16.8% 17.8 %

6
Fourth quarter report 2018
Segment review
Hurtigruten Norwegian Coast
The below table does not include the State Contract’s contractual revenue, nor the goods and other
operating revenue originated by the Norwegian Coast activity.
4th quarter 4th quarter 01.01-31.12 01.01-31.12
NOK 1 000 2018 2017 Change 2018 2017 Change
Operational revenues 581,608 529,757 9.8 % 3,512,784 3,159,211 11.2 %
Contracual revenues 174,100 167,655 3.8 % 698,919 674,234 3.7 %
Total revenue 755,709 697,412 8.4 % 4,211,703 3,833,445 9.9 %
EBITDA (10,031) 13,032 -177.0 % 883,724 696,226 26.9 %
4th quarter 4th quarter 01.01-31.12 01.01-31.12
2018 2017 2018 2017
PCNs 280,818 255,858 1,353,146 1,249,149
APCNs 380,308 398,002 1,613,984 1,595,924
Occupancy rate 73.8% 64.3% 83.8% 78.3%
Gross ticket revenues 569,359 513,973 3,455,655 3,102,068
Less:
Commissions, costs of goods for flights, hotels,
transportation and other passenger services 119,653 98,791 660,382 581,676
Food, beverage, shop, excursions 74,162 70,597 390,142 372,325
Net ticket revenues 375,544 344,585 2,405,130 2,148,068
Gross ticket revenues per PCN (NOK) 2,028 2,009 2,554 2,483
Net ticket revenues per PCN (NOK) 1,337 1,347 1,777 1,720
Ship operating costs 598,810 526,836 2,690,450 2,432,581
Selling, general and administrative expenses 187,719 167,513 716,087 678,797
Gross cruise costs 786,529 694,348 3,406,538 3,111,378
Less:
Commissions, costs of goods for flights, hotels,
transportation and other passenger services 119,653 98,791 660,382 581,676
Food, beverage, shop, excursions 74,162 70,597 390,142 372,325
Net cruise costs 592,714 524,960 2,356,013 2,157,378
Net cruise costs per APCN (NOK) 1,559 1,319 1,460 1,352
Fuel consumption (liter/nautical mile) 78.6 80.1 78.0 79.3
Fuel cost per liter 6.51 5.07 6.36 5.38
NOK 1 000 Except for PCNs, APCNs, occupancy
rate, fuel consumption and fuel cost per liter

7
Operational revenue excluding the contractual
income from the Norwegian state agreement,
increased by NOK 52 million, or 9.8%, to NOK 582
million in the fourth quarter, from NOK 530 million in
the fourth quarter of 2017. Occupancy increased to
73.8% compared to 64.3% in the fourth quarter of
2017, with an increase in Passenger Cruise Nights
(PCN) of 9.8%. The increase in PCNs is driven by
the increase in demand for the Hurtigruten winter
product along the Norwegian coast. We are seeing
the benefit from the improved product and food
offering on the Norwegian coast.
Net ticket revenue per PCN was NOK 1,337 in fourth
quarter, a slight decrease from NOK 1,347 in fourth
quarter last year. The decrease in yield is driven by
mix effects with volume growth coming in the lower
yielding months and somewhat higher cost of goods
sold and commission levels. Underlying net yield is
showing an increase intra month. Gross ticket
revenue per PCN increased with 0.9% in the period
compared to last year.
Hurtigruten experienced growth in yield from all
markets with the increased share of voyage
passengers (passengers that cruise longer than 6
days). The increased yield led to higher profitability
in the segment and demonstrated the scalability of
the business model as occupancy and yield
increases.
Contractual revenue was NOK 174 million in the
fourth quarter, increased from NOK 168 million a
year earlier, the change due to the contractual
payment schedule.
Net cruise cost per Available Passenger Cruise Night
(APCN) increased with 18.2% to NOK 1,559 in the
fourth quarter compared to same period last year.
The increase is due to i) a substantial higher fuel
costs driven by the higher oil price in the period ii)
higher crew cost driven by one off cost related to
historical VAT for crew food and crew cost related to
MS Richard With which spent 30 days at Fosen yard
undergoing a full refurbishment during the quarter.
The underlying fuel price increased with 28.4% YoY
for fourth quarter. Bareboat charter lease costs
increased compared to same period last year, as
fourth quarter of 2018 include a NOK 12.9 million
(NOK 2.4 million) expense related to the lease of MS
Nordlys and MS Richard With, which in most of fourth
quarter of 2017 were accounted for as finance leases
in the Group. In December 2017 and January 2018,
the sister Group Coastal Holding Group acquired
these vessels, and leased them to the Bidco Group
on 5-year operating leases. Due to timing of planned
repair and maintenance, costs for repair and
maintenance were higher in fourth quarter this year
compared to last year.
Due to the one-off costs, EBITDA decreased to NOK
-10 million (NOK 13 million) in the fourth quarter
compared to the same quarter last year. Adjusted for
the above mentioned one-off costs, internal bareboat
charter and fuel costs the Norwegian Coast segment
EBITDA increased with NOK 9 million.
Expedition cruises
4th quarter 4th quarter 01.01-31.12 01.01-31.12
NOK 1 000 2018 2017 Change 2018 2017 Change
Operational revenues 241,441 230,830 4.6 % 935,996 811,497 15.3 %
Total revenue 241,441 230,830 4.6 % 935,996 811,497 15.3 %
EBITDA 29,307 25,470 15.1 % 144,577 85,210 69.7 %

8
Fourth quarter report 2018
In the Expedition cruises segment, Passenger Cruise
nights (PCN) decreased by 4.6%, and available
Cruise nights (APCN) decreased with 13.3%,
resulting in an increase of 6.7 ppt in occupancy to
73.7% in the period compared to last year.
Segment ticket revenue was NOK 242 million in the
fourth quarter of 2018, up from NOK 231 million in
same period of 2017. The increase was driven by
gross ticket revenue per PCN which increased with
9.7%, offsetting the decrease in PCN.
The net yield decreased by 1.9% due to increased
cost of goods sold and commissions related to one
off costs.
Net cruise cost per available cruise night (APCN)
increased by 15.1% in fourth quarter, due to i)
increased fuel costs, as the price of fuel increased by
16% YoY in the quarter, ii) the strategic decision to
position MS Fram as a 200-berth ship in Antarctica
which led to lower number of APCN iii) Reduction in
APCN for the MS Midnatsol doing repositioning
itineraries, and iv) one off cost related to the ice
conditions in the North-West passage. Adjusted for
these effects, the underlying development in costs
are positive.
Fourth quarter EBITDA was NOK 29.3 million, an
increase of 15,1% from NOK 25.5 million in the same
period in 2017. In the quarter, there where NOK 12.9
million (Q4 2017; NOK 5.7 million) in one-off costs
predominantly related to ice conditions in the North-
West passage which led to certain refunds due to
changed itineraries. Adjusted for these one offs the
underlying segment EBITDA increased with 25%.
4th quarter 4th quarter 01.01-31.12 01.01-31.12
2018 2017 2018 2017
PCNs 44,189 46,308 166,681 155,725
APCNs 59,972 69,184 231,088 228,204
Occupancy rate 73.7 % 66.9 % 72.1 % 68.2 %
Gross ticket revenues 241,556 230,788 935,483 811,307
Less:
Commissions, costs of goods for flights, hotels,
transportation and other passenger services 70,784 56,189 266,861 199,937
Food, beverage, shop, excursions 19,728 13,217 55,032 53,679
Net ticket revenues 151,044 161,381 613,591 557,692
Gross ticket revenues per PCN (NOK) 5,466 4,984 5,612 5,210
Net ticket revenues per PCN (NOK) 3,418 3,485 3,681 3,581
Ship operating costs 177,474 148,102 672,364 556,411
Selling, general and administrative expenses 34,945 43,531 132,864 144,917
Gross cruise costs 212,419 191,634 805,229 701,328
Less:
Commissions, costs of goods for flights, hotels,
transportation and other passenger services 70,784 56,189 266,861 199,937
Food, beverage, shop, excursions 19,728 13,217 55,032 53,679
Net cruise costs 121,907 122,227 483,336 447,712
Net cruise costs per APCN (NOK) 2,033 1,767 2,092 1,962
Fuel consumption (liter/nautical mile) 95.0 88.8 83.1 90.5
Fuel cost per liter 6.41 5.54 5.99 5.52
NOK 1 000 Except for PCNs, APCNs, occupancy
rate, fuel consumption and fuel cost per liter

9
Fourth quarter report 2018
Spitsbergen
Spitsbergen segment comprises year-round hotel and restaurant activities as well as Arctic experience
tourism in Svalbard. Hurtigruten Svalbard operates three hotels and an equipment store
The Spitsbergen segment had fourth quarter
revenue of NOK 30 million, vs. NOK 33 million in
fourth quarter last year.
The reduction in revenues is mainly driven by the
closing of the Polar Hotel in December for
remodelling. This is partly offset by higher revenues
per available room, driven by the newly remodelled
Funken hotel in Longyearbyen. Decreased direct and
operating costs results in improvement in EBITDA in
the period, to NOK -11.6 million from NOK -13.3
million in the same period of 2017.
4th quarter 4th quarter 01.01-31.12 01.01-31.12
NOK 1 000 2018 2017 Change 2018 2017 Change
Operational revenues 29,992 33,196 -9.7 % 295,028 292,411 0.9 %
Total revenue 29,992 33,196 -9.7 % 295,028 292,411 0.9 %
EBITDA (11,551) (13,320) -13.3 % 45,156 44,206 2.2 %

10
Fourth quarter report 2018
Financial review
The financial information for the three months ended 31 December 2018 discussed below is derived from the
unaudited consolidated financial statements of Hurtigruten Group AS as of and for the three months ended
at 31 December 2018.
Profit and loss
Revenue per quarter (NOK million)
Group revenue increased by NOK 6.8%, or NOK 66
million to NOK 1,027 million in the fourth quarter of
2018 compared to fourth quarter of 2017. The
increase in revenue was due to increased ticket
revenue per PCN in both the Norwegian Coast and
Expedition cruises segments and increased
occupancy in the Coastal segment.
Employee expenses in fourth quarter were NOK 306
million an increase of 9.6% year over year, reflecting
annual salary increases and increased number of
employees to facilitate the expansion in relation to
the new vessels in 2019.
Fourth quarter depreciation, amortization and
impairment were NOK 103 million (NOK 115 million).
The decrease is primarily due to two vessels, MS
Nordlys and MS Richard With which in 2018 are on
operating leases in the Group, whereas last year, the
same vessels were on financial lease from third party
owners.
Specification of other operating costs
Other operating costs were NOK 735 million in the
fourth quarter of 2018 (NOK 653 million), an increase
of 12.4% from the same period last year.
Cost of goods sold relates to direct costs from flights,
hotels and transportation for passengers to and from
cruise destinations and costs for food and beverage
aboard the cruise vessels. With increased revenues
from goods sold, fourth quarter cost of goods sold
increase with 15.8% compared to same period last
year. The increase reflects results from the
companywide cost savings project but is offset by
increased prices for flights and hotels for the guests.
Operating costs include all other cruise operating
costs, harbour costs, bareboat lease costs and
1 540
769 978
1 343
1 640
961 1 188
1 447
1 767
1 027
Q3
16
Q4
16
Q1
17
Q2
17
Q3
17
Q4
17
Q1
18
Q2
18
Q3
18
Q4
18
4th quarter 4th quarter % 01.01-31.12 01.01-31.12 %
(NOK 1 000) 2018 2017 change 2018 2017 change
Cost of goods sold (207,519) (179,495) 15.6 % (996,689) (933,146) 6.8 %
Operating costs (ex fuel) (255,537) (231,424) 10.4 % (1,169,660) (990,715) 18.1 %
Fuel costs (139,517) (125,784) 10.9 % (556,418) (459,971) 21.0 %
Sales and administrative costs (131,993) (116,537) 13.3 % (518,037) (502,772) 3.0 %
Total (734,566) (653,239) 12.4 % (3,240,804) (2,886,603) 12.3 %

11
Fourth quarter report 2018
maintenance of the vessels, in addition to
commissions paid to travel agents. The fourth
quarter increase of 10.4% compared to same period
last year is primarily due to timing of planned repair
and maintenance costs for the fleet and the
operational bare boat lease for MS Nordlys and MS
Richard With. The vessels were on financial lease in
the same period in 2017. Adjusted for these effects,
the underlying operations show a positive
development.
Fuel costs in the quarter increased with 10.9% to
NOK 140 million, compared to the same quarter last
year, due to the substantial increase in the fuel price
in the period. Average cost per litre in fourth quarter
of 2018 was 28.4% and 15.7% higher in the Coastal
and Expedition cruises segment respectively
compared to last year. The price increase is partly
offset by lower fuel consumption per mile in the
Coastal segment.
Sales and administrative costs increased with 13.3%
in the quarter compared to last year, primarily as a
result of increased sales and marketing and
administrative expenses related to the future growth
in capacity.
Net other gains and losses for the fourth quarter was
a gain of NOK 21 million (loss of NOK 4 million).
Other gains and losses consist of gains and losses
from foreign currency contracts, translation of
working capital in foreign currency and realized gains
and losses on bunker derivatives.
The fourth quarter 2018 operating loss was NOK 95
million, compared to an operating loss of NOK 89
million in the same period last year.
Net financial items were NOK -413 million (NOK -405
million) in the fourth quarter. Interest costs in the
quarter has decreased compared to last year due to
reduced effective interest rates on borrowings after
the Group refinanced its major outstanding debt in
February 2018. The existing Bond of EUR 455 million
and Revolving Credit Facility of EUR 85 million were
replaced with a term B loan of EUR 575 million and
a new Revolving Credit Facility of EUR 85 million.
The refinancing entails 3-year prolonged debt
maturity, increased available liquidity and reduced
interest costs going forward. The positive effects of
reduced interest costs are offset by fourth quarter
currency effects on the group’s EUR denominated
financing as the NOK depreciated against the EUR
in the quarter. In November 2018, the Group
refinanced the Term B loan, increasing the nominal
value to EUR 655 million, with all other terms
unchanged.
Income tax in the period was a tax income of NOK
452 million (NOK 17 million). The tax income in the
period consists of recognition of deferred tax asset
on tax loss carry forwards, previously not recognized.
The deferred tax asset will be utilized in January
2019 when the Group reorganizes its operations into
two operating companies, whereof one, Hurtigruten
Cruise AS, will enter into the Norwegian Tax
Tonnage regime. See note 9, Events after balance
sheet date.
Net loss for the fourth quarter of 2018 was NOK 57
million, compared to a loss of NOK 478 million in the
same period of 2017. The change was primarily
driven by the tax effects in fourth quarter of 2018.
Financial position and liquidity
Cash flow
Net cash flow from operating activities in the fourth
quarter was NOK -97 million, compared with a net
cash flow from operations of NOK 187 million in the
same period of 2017. The decrease is primarily due
to changes in working capital due to timing
differences in settlements at year end.
Net cash flow used in investing activities was NOK
782 million (NOK 581 million in fourth quarter of
2017), whereof NOK 88 million (NOK 241 million) is
related to maintenance and new build capital
expenditures on the ships. Capital expenditure in
2017 included the purchase of the vessel MS
Richard With. Fourth quarter of 2018 included
prepayments for ships under construction and
refurbishments of NOK 67 million, vs NOK 25 million
in the same period last year. NOK 610 million of
investing cash flow in fourth quarter of 2018 is loans
given to other group companies. Other adjustments
in investing activities include settlement of financial
derivatives and change in restricted funds.
The Group expects normalised annual maintenance
capital expenditures for the vessels to be around
NOK 200 million based on current operations.
Net cash flow from financing activities was NOK 775
million (NOK 431 million) in the fourth quarter,
comprising primarily of proceeds from the increase in
the Term Loan B of EUR 80 million to EUR 655
million, reduced with the repayment of the revolving
credit facility.

12
Fourth quarter report 2018
Net decrease in cash in fourth quarter of 2018 was
NOK 105 million, vs. an increase of NOK 36 million
in the same quarter last year.
Cash and cash equivalents in the cash flow
statement totalled NOK 385 million at 31 December
2018 (NOK 338 million). Cash and cash equivalents
in the statement of financial position, including
restricted funds, totalled NOK 562 million at 31
December 2018, an increase of NOK 122 million
since year end 2017. At 31 December 2018, the
Group had additional available liquidity through the
EUR 85 million Revolving Credit Facility, which were
undrawn at quarter end.
The Group has secured financing for the delivery of
the newbuilds hybrid cruise vessels MS Roald
Amundsen and MS Fridtjof Nansen, to be delivered
in 2019.
Balance sheet
Total assets amounted to NOK 9,740 million at 31
December 2018, an increase of NOK 1,494 million
from year end 2017. Non-current assets increased
with NOK 1,319 million since year end 2017 due to
prepayments and capital expenditures on new
builds, upgrades and maintenance of the vessels,
and purchase of MS Nordlys in January 2018, offset
by depreciations and amortizations. Deferred tax
asset increased with NOK 471 million due to the
recognition of tax asset on tax loss carry forwards.
Other non-current assets include loans to other
group companies and increased with NOK 663
million in the year.
Current asset amounted to NOK 1,175 million, an
increase of NOK 175 since 31 December 2017,
primarily due to the increase in Cash and cash
equivalents.
Total equity at the end of fourth quarter was NOK 771
million vs. NOK 527 million at 31 December 2017.
The change in equity is due to net profit in the period,
reduced by negative changes in the Groups cash
flow hedges. In addition, equity is reduced by the fair
value adjustment of the Groups investment in Kleven
Verft. In June 2018, the Hurtigruten Group parent
company Silk Topco AS purchased 100% of the
shares in Kleven Verft AS, resulting in a fair value
adjustment of NOK -28 million on the investment in
Kleven in the Hurtigruten Group. The investment is
held as Available for sale, and fair value adjustments
are accounted for through Other Comprehensive
Income.
The equity ratio at 31 December 2018 was 7.9% vs.
6.4% at year-end 2017. The equity level is expected
to increase, as pre-booking levels for the remainder
of 2018 and into 2019 indicate positive results, and
the newbuild cruise vessels are put into production in
2019.
Total non-current liabilities amount to NOK 7,165 as
per 31 December 2018, an increase of NOK 6,426
million from NOK 739 million at year end 2017. The
increase is due to reclassification of the issued bond
of EUR 455 million and the RCF of NOK 774 million
from long term to short term borrowings at 31
December 2017, as the bond and the RCF were
refinanced in February 2018 and replaced with a
Term B Loan of EUR 575 million. In November 2018,
the Term Loan B was refinanced with an increase in
nominal value to EUR 655 million. Total borrowings
have increased from NOK 5,784 million at year end
2017 to NOK 6,944 million at 31 December 2018.
The majority of the Groups borrowings is
denominated in EUR, and EUR strengthening
against the NOK during the year contribute to the
increase in borrowings.
Current liabilities excluding borrowings were NOK
1,739 million, increased by NOK 54 million since year
end 2017. The change is due to reduction in working
capital items, offset by an increase in prepaid travels.
Off-balance sheet items
The Group has deferred income tax assets
recognised in the balance sheet of NOK 650 million
at 31 December 2018, and NOK 178 million at year
end 2017. At 31 December 2017, NOK 445 million in
deferred income tax assets was not recognised in the
balance sheet, while at year end 2018, the entire
previously unrecognized tax asset was recognized.
This is due to the reorganization of the Group in
January 2019, where the tax loss carry forward will
be utilized and the related deferred tax asset will be
reversed.
The Group does not have any material off-balance
sheet arrangements.

13
Fourth quarter report 2018
Outlook
Hurtigruten has experienced a strong positive
underlying booking trend over the last 12 months.
There is strong demand for the increased capacity
offered under the Expedition Cruises segment in
both Antarctica and the Arctic. Demand has also
increased for the Coastal cruise product across all
market segments at higher yields compared to at the
same point in time in 2017. Pre-bookings for 2019
and 2020 are higher compared to same time last
year driven by the effects of our investments in our
commercial team, product improvement initiatives,
and additional capacity in the Expedition Cruises
segment. 2019 booking is very strong for both
segments with NOK 3315 million gross ticket
revenue booked as of 26 February 2019, compared
to NOK 2976 million last year – an increase of 11.4%.
Gross revenue booked for Norwegian Coast is up
NOK 108 million (+5%) for 2019 compared to last
year. Expedition Cruises has booked NOK 231
million more than same time last year, up by 28%.
Risks and uncertainties
The risks described below are not the only risks the
Group faces.
Additional risks and uncertainties not currently
known to the Group or that Group currently deems
to be immaterial may also materially adversely
affect the business, financial condition or results of
operations.
An increase in port taxes or fees or other adverse
change of the terms of business with the authorities
operating the ports in which Hurtigruten calls could
increase the operating costs and adversely affect
the business, financial condition, results of
operations and prospects.
Hurtigruten is subject to complex laws and
regulations, including environmental, health and
safety laws and regulations, which could adversely
affect the operations and any change in the current
laws and regulations could lead to increased costs
or decreased revenue.
There is a risk that shipyard could fail to deliver the
new builds as agreed, or the Group could cancel a
shipbuilding contract because the shipyard has not
met its obligations. Any termination or breach of
contract on the Group’s part following any such
event may result in, among other things, the
forfeiture of prior deposits or payments made by
the Group as well as potential claims by the
Group’s customers against it if the Group’s ships
are out of service and the Group cannot provide
alternative services.
The Group’s inability to deploy new ships and carry
out ship repairs, maintenance and refurbishments
on terms and within timeframes that are favourable
or consistent with the Group’s expectations could
result in revenue losses and unforeseen costs.
Hurtigruten’s results of operations are susceptible
to unseasonable changes in weather and it may be
affected by adverse weather conditions.
If Hurtigruten’s services are delayed or cancelled,
Hurtigruten may need to re-route the guests to
other ports of call or cancel their bookings. As a
result, Hurtigruten may face difficulty in maintaining
consumer loyalty to the brand and the business,
financial condition, results of operations and
prospects may be adversely affected.

14
Fourth quarter report 2018
Interim financial statements
Condensed consolidated income statement
Unaudited
4th quarter 4th quarter 01.01-31.12 01.01-31.12
(NOK 1 000) Note 2018 2017 2018 2017
Operating revenues 852,749 793,699 4,729,515 4,248,316
Contractual revenues 174,100 167,655 698,919 674,234
Total Revenues 1,026,850 961,354 5,428,434 4,922,550
Payroll costs (305,647) (278,969) (1,206,479) (1,159,050)
Depreciation, amortisation and impairment (102,547) (114,668) (397,623) (480,543)
Other operating costs (734,566) (653,240) (3,240,804) (2,886,603)
Other (losses)/gains – net 21,136 (3,687) 92,634 (50,586)
Operating profit/(loss) (94,775) (89,210) 676,162 345,768
Net financial items 6 (412,745) (404,484) (622,681) (853,973)
Share of profit/(loss) of associates (1,223) (179) 596 1,246
Profit/(loss) before income tax (508,744) (493,873) 54,077 (506,959)
Income tax expense 451,798 16,706 399,719 (25,110)
Profit/(loss) for the period (56,946) (477,167) 453,796 (532,069)

15
Fourth quarter report 2018
Condensed consolidated statement of comprehensive income
Unaudited
4th quarter 4th quarter 01.01-31.12 01.01-31.12
(NOK 1 000) Note 2018 2017 2018 2017
Profit/(loss) for the period (56,946) (477,167) 453,796 (532,069)
Other comprehensive income, net of tax:
(3,514) - (3,168) (2,554)
13,485 - (28,015) -
Sum 9,971 - (31,183) (2,554)
Cash flow hedges, net of tax (155,769) 34,706 (173,450) 39,345
Tax
Currency translation differences (165) 38,059 (4,733) 21,872
Sum (155,934) 72,765 (178,183) 61,217
(202,908) (404,402) 244,430 (473,406)
Items that will not be reclassified to profit or loss in subsequent periods:
Items that will be reclassified to profit or loss in subsequent periods:
Actuarial gain/loss on retirement benefit
obligations
Total comprehensive income for the period
Fair value adjustments on financial instruments

16
Fourth quarter report 2018
Condensed consolidated statement of financial position
Unaudited
31.12. 31.12.
(NOK 1 000) Note 2018 2017
ASSETS
Non-current assets
Property, plant and equipment 4,528,117 4,301,649
Intangible assets 2,653,228 2,664,560
Deferred income tax assets 650,141 178,825
Derivative financial instruments 5 0 30,494
Other non-current assets 733,501 70,812
Total non-current assets 8,564,988 7,246,341
CURRENT ASSETS
Inventories 185,390 148,179
Trade and other receivables 7 428,353 393,590
Derivative financial instruments 7 (0) 19,533
Cash and cash equivalents 7 561,576 439,206
Total current assets 1,175,318 1,000,508
Total assets 9,740,304 8,246,848
EQUITY
Paid -in capital 1,827,674 1,827,646
Other equity (1,056,677) (1,301,080)
Total equity 770,997 526,567
LIABILITIES
Non-current liabilities
Borrowings 5,7 6,879,320 486,556
Prepaid travels with departure dates beyond one year 103,555 133,328
Derivative financial instruments 7 57,351 -
Other non-current liabilities 125,095 118,822
Total non-current liabilities 7,165,321 738,706
Current liabilities
Trade and other liabilities 7 829,955 1,011,533
Prepaid travels with departure date within one year 708,425 619,598
Borrowings 5,7 65,017 5,297,020
Derivative financial instruments 140,310 13,247
Other current liabilities 60,278 40,179
Total current liabilities 1,803,985 6,981,576
Total equity and liabilities 9,740,304 8,246,848

17
Fourth quarter report 2018
Condensed consolidated statement of changes in equity
Unaudited
(in NOK 1 000)
Paid -in
capital Other equity Total Equity
Paid -in
capital Other equity Total Equity
Equity at beginning of the period 1,827,646 -1,301,079 526,568 1,827,646 -827,674 999,972
Comprehensive income 244,430 244,430 (473,406) (473,406)
Contribution of equity - - - - - -
Equity at the close of the period 1,827,646 -1,056,649 770,997 1,827,646 -1,301,080 526,566
01.01-31.12.2018 01.01-31.12.2017
18
Fourth quarter report 2018
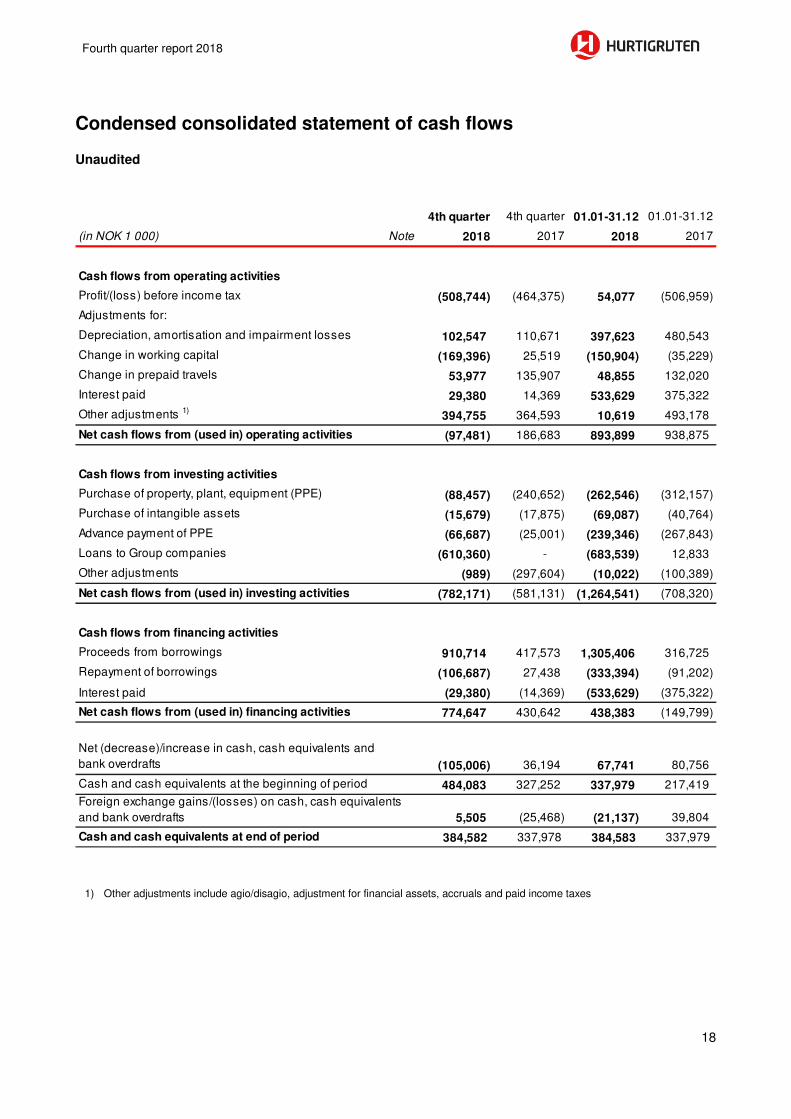
Condensed consolidated statement of cash flows
Unaudited
1) Other adjustments include agio/disagio, adjustment for financial assets, accruals and paid income taxes
4th quarter 4th quarter 01.01-31.12 01.01-31.12
(in NOK 1 000) Note 2018 2017 2018 2017
Cash flows from operating activities
Profit/(loss) before income tax (508,744) (464,375) 54,077 (506,959)
Adjustments for:
Depreciation, amortisation and impairment losses 102,547 110,671 397,623 480,543
Change in working capital (169,396) 25,519 (150,904) (35,229)
Change in prepaid travels 53,977 135,907 48,855 132,020
Interest paid 29,380 14,369 533,629 375,322
Other adjustments 1)394,755 364,593 10,619 493,178
Net cash flows from (used in) operating activities (97,481) 186,683 893,899 938,875
Cash flows from investing activities
Purchase of property, plant, equipment (PPE) (88,457) (240,652) (262,546) (312,157)
Purchase of intangible assets (15,679) (17,875) (69,087) (40,764)
Advance payment of PPE (66,687) (25,001) (239,346) (267,843)
Loans to Group companies (610,360) - (683,539) 12,833
Other adjustments (989) (297,604) (10,022) (100,389)
Net cash flows from (used in) investing activities (782,171) (581,131) (1,264,541) (708,320)
Cash flows from financing activities
Proceeds from borrowings 910,714 417,573 1,305,406 316,725
Repayment of borrowings (106,687) 27,438 (333,394) (91,202)
(29,380) (14,369) (533,629) (375,322)
Net cash flows from (used in) financing activities 774,647 430,642 438,383 (149,799)
Net (decrease)/increase in cash, cash equivalents and
bank overdrafts (105,006) 36,194 67,741 80,756
Cash and cash equivalents at the beginning of period 484,083 327,252 337,979 217,419
5,505 (25,468) (21,137) 39,804
Cash and cash equivalents at end of period 384,582 337,978 384,583 337,979
Interest paid
Foreign exchange gains/(losses) on cash, cash equivalents
and bank overdrafts

19
Fourth quarter report 2018
Notes to the condensed consolidated financial
Statements
Note 1 Accounting policies
The interim financial report for the Group includes Hurtigruten Group AS with subsidiaries and associated
companies. The interim financial report is prepared in accordance with IAS 34 Interim Financial Reporting. The
interim financial report does not include all information which will appear in the annual financial report, which
is prepared in accordance with all effective IFRS-standards and should therefore be read in connection with
the consolidated annual report for Hurtigruten Group AS (previously Silk Bidco Group) for 2017.
The annual report 2017 for the company can be obtained through a request to the company’s main office. The
accounting policies applied in the interim financial reporting are described in the note of accounting policies in
the annual report for 2017.
As described in the Annual Financial Statements for Hurtigruten Group for 2017, note 2.2b), the vessels MS Richard With and MS Nordlys are owned by the SPV’s Kystruten KS and Kirberg Shipping KS. These SPV’s were previously included in the consolidated Hurtigruten Group AS Financial Statements as consolidated entities in accordance with IFRS 10, Consolidated Financial Statements. At 31 December 2017, the Group deconsolidated these entities and recognized the vessels in the Financial Statements as Financial Lease assets according to IFRS 17, Financial Leases, based on updated evaluation of the Group’s interests in Kystruten KS and Kirberg Shipping KS. The derecognition of consolidated entities and recognition of financial leases have been restated in the previous financial statements and comparable statements. In connection with the deconsolidation of the KS’ interests, the Group determined that the PPA related to the purchase of Hurtigruten ASA in 2014 was erroneous, and NOK 117 million has been restated from Goodwill to Minority interests in the opening balance of 1 January 2016. In the preparation of the interim financial report, estimates and assumptions have been applied, which has affected assets, liabilities, revenues and costs. Actual figures can deviate from estimates applied.
Note 2 Financial risk management
There are potential risks and uncertainties that can affect the operations of the companies in the Group. This
may lead to actual results deviating from expected and historical results. Information concerning the most
important risks and uncertainties is disclosed in the latest annual report.
The Group is exposed to fluctuations in the price of bunker fuel, which is used to operate the ships. In order to
reduce the risk related to the fuel price the Group has implemented a fuel hedging policy that follows the
booking curve: the key principle in the bunker hedging policy is based on the company’s ability to obtain
visibility on earnings, hence the company has established a hedging policy linked to the development in the
booking curve (actual vs. budgeted PCNs booked). For example, if at any given time 75% of the volume for
one season is sold, a minimum of 50% of the bunker cost associated with the PCN volume sold are hedged.
Additionally, the policy allows for some flexibility if market conditions are viewed as attractive.
In 2016, the Group purchased fuel derivatives contracts hedging estimated bunker oil consumption for the
period 2017 until December 2018. In July 2018, October 2018, and November 2018, the Group entered into
additional derivative contracts with expiration in 2019 through 2021. At year-end 2018, a total of 142,350 MT
bunker fuel volume is hedged at an average price of USD 656/MT during 2019-2021.
Note 3 Contingencies
Membership in the industrial fund for nitrogen oxides
Hurtigruten AS is a member of the Confederation of Norwegian Enterprise’s (NHO) NOx Fund. The main
objective of the Environmental Agreement concerning reductions of NOx and the NHO’s NOx Fund is to reduce
emissions of nitrogen oxide. The Fund is a joint venture to which affiliated businesses can apply for support
for emission-reducing measures. Payment to the Fund replaces the nitrogen oxide tax for affiliated businesses.

20
Fourth quarter report 2018
The Environmental Agreement for 2011–2017 was signed on 14 December 2010 by 15 industry organisations
and the Ministry of the Environment and was approved by EFTA's Monitoring Body (ESA) on 19 May 2011.
The Fund has reported that the targets for 2011-2016 were met. On 24 May 2017, an extension to the NOx
Agreement for the period 2018-2025 was signed between the business organisations and the Norwegian
Authorities. The extension was approved by ESA on 22 February 2018.
The Norwegian Environment Agency monitors whether individual reduction targets have been achieved.
Deviations of more than 3% of emission targets trigger a collective fine, under which businesses must pay the
nitrogen oxide tax for the pro rata share of the target that has not been met. However, businesses will never
pay more than the official government rate for nitrogen oxide tax.
NOK 22.5 million in nitrogen dioxide tax is recognised in financial statements for 2018, as compared to NOK
16.4 million in 2017.
Note 4 Segments
Unaudited
4th quarter 4th quarter 4th quarter 4th quarter 4th quarter 4th quarter
(in NOK 1 000) 2018 2017 2018 2017 2018 2017
Operating revenues 581,608 529,757 241,441 230,830 29,992 33,196
Contractual revenues 174,100 167,655 - - - -
Total operating revenues 755,709 697,412 241,441 230,830 29,992 33,196
Payroll costs (245,191) (215,783) (42,332) (45,989) (18,124) (17,197)
Depreciation and impairment
losses (71,842) (89,960) (22,778) (21,063) (7,927) (3,634)
Other operating costs (541,338) (478,565) (170,087) (145,645) (23,480) (29,389)
Other (losses)/gains – net 20,790 9,968 286 (13,726) 60 70
Operating profit/(loss) (81,873) (76,928) 6,529 4,407 (19,478) (16,954)
EBITDA (10,031) 13,032 29,307 25,470 (11,551) (13,320)
Norwegian Coast Expedition cruises Spitsbergen
4th quarter 4th quarter 4th quarter 4th quarter 4th quarter 4th quarter
(in NOK 1 000) 2018 2017 2018 2017 2018 2017
Operating revenues 39 71 (330) (154) 852,749 793,699
Contractual revenues - - - - 174,100 167,655
Total operating revenues 39 71 (330) (154) 1,026,850 961,354
Payroll costs - - - 0 (305,647) (278,969)
Depreciation and impairment
losses - (11) 0 0 (102,547) (114,668)
Other operating costs 39 102 299 258 (734,566) (653,240)
Other (losses)/gains – net - - 0 (0) 21,136 (3,687)
Operating profit/(loss) 78 162 (31) 104 (94,775) (89,210)
EBITDA 78 162 (31) 104 7,772 25,458
Other Business Eliminations Silk Bidco Group

21
Fourth quarter report 2018
01.01-31.12 01.01-31.12 01.01-31.12 01.01-31.12 01.01-31.12 01.01-31.12
(in NOK 1 000) 2018 2017 2018 2017 2018 2017
Operating revenues 3,512,784 3,159,211 935,996 811,497 295,028 292,411
Contractual revenues 698,919 674,234 - - - -
Total operating revenues 4,211,703 3,833,445 935,996 811,497 295,028 292,411
Payroll costs (961,962) (918,674) (157,074) (158,957) (87,443) (81,419)
Depreciation and impairment
losses (293,826) (401,791) (81,424) (60,883) (22,373) (17,844)
Other operating costs (2,444,576) (2,192,705) (648,155) (542,371) (162,646) (167,000)
Other (losses)/gains – net 78,559 (25,841) 13,810 (24,959) 217 214
Operating profit/(loss) 589,898 294,435 63,154 24,327 22,783 26,362
EBITDA 883,724 696,226 144,577 85,210 45,156 44,206
Norwegian Coast Expedition cruises Spitsbergen
01.01-31.12 01.01-31.12 01.01-31.12 01.01-31.12 01.01-31.12 01.01-31.12
(in NOK 1 000) 2018 2017 2018 2017 2018 2017
Operating revenues (34) 230 (14,258) (15,032) 4,729,515 4,248,316
Contractual revenues - - - - 698,919 674,234
Total operating revenues (34) 230 (14,258) (15,032) 5,428,434 4,922,550
Payroll costs - - (0) 0 (1,206,479) (1,159,050)
Depreciation and impairment
losses - (25) (0) 0 (397,623) (480,543)
Other operating costs 314 376 14,258 15,097 (3,240,804) (2,886,603)
Other (losses)/gains – net 48 - 0 0 92,634 (50,586)
Operating profit/(loss) 328 581 0 64 676,162 345,768
EBITDA 328 606 0 64 1,073,785 826,311
Other Business Eliminations Silk Bidco Group

22
Fourth quarter report 2018
Note 5 Borrowings
Unaudited
The above amounts state borrowings at amortized cost, as in Statement of Financial Position. The Group Senior Secured Notes of EUR 455 million, and RCF of EUR 85 million, were at 31 December 2017
reclassified to short term borrowings as the Bond and RCF was terminated in February 2018 and replaced by
a Term loan B of EUR 575 million and a new RCF of EUR 85 million. In November 2018, the Group refinanced
the existing Term loan B, increasing the nominal value to EUR 655 million.
Maturity Profile The below maturity schedule reflects the borrowings at nominal values.
31.12. 31.12.
(Figures stated in NOK 1000) 2018 2017
Long term debt
Term Loan B 6,428,743 -
Revolving Credit Facility 2,367 -
Lease financing 447,308 473,109
Other borrowings 902 13,447
Total 6,879,320 486,556
Short term debt
Bond - 4,385,095
Revolving credit facility - 773,688
Lease financing 30,204 45,193
Credit facilities 29,899 26,789
Other borrowings 4,913 66,254
Total 65,017 5,297,020
Total outstanding debt 6,944,337 5,783,576
31.12. 31.12.
(Figures stated in NOK 1000) 2018 2017
Less than one year 65,016 5,389,130
Year 2 and 3 78,086 66,224
Year 4 and 5 88,413 73,502
More than 5 years 6,847,001 346,863
Total borrowings 7,078,517 5,875,719

23
Fourth quarter report 2018
Note 6 Net Financial items
Unaudited
Note 7 Financial assets and liabilities at fair value
The following principles have been applied for the subsequent measurement of financial assets and liabilities: At 31 December 2018: Unaudited
4th quarter 4th quarter 01.01-31.12 01.01-31.12
(NOK 1000) 2018 2017 2018 2017
Interest income on current bank deposits 11,610 (298) 24,122 (4,785)
Foreign exchange gains (135,388) (21,421) 15,289 93,558
Other financial income 16,858 1,652 20,387 3,172
Finance income (106,921) (20,067) 59,798 91,946
Interest expense and amortized borrowing fees (62,461) (178,731) (520,878) (502,192)
Foreign exchange losses (242,729) (206,126) (156,132) (443,707)
Other finance expenses (635) 441 (5,469) (19)
Finance expenses (305,825) (384,417) (682,479) (945,918)
Net Financial items (412,745) (404,484) (622,681) (853,973)
(Figures stated in NOK 1000)
Loans and
receivables
Assets at
fair value
through
profit and
loss
Assets at
fair value
through OCI
Derivatives
used for
hedging Total
Assets as per balance sheet
Other receivables, non-current 700 980 3 199 - - 704 180
Available for sale financial instruments - - 24 327 - 24 327
Trade and other receivables 428 353 - - - 428 353
Cash at bank, cash on hand and market-based
investments in the balance sheet 560 410 1 165 - - 561 576
Total 1 689 744 4 365 24 327 0 1 718 435
Total
Liabilities as per balance sheet
Total borrowings - - 6 944 337 6 944 337
Total derivatives - 197 662 - 197 662
Accounts payable and other short term payables - - 829 955 829 955
Total - 197 662 7 774 292 7 971 954
Liabilities at
fair value
through
profit and
loss
Derivatives
used for
hedging
Other
financial
liabilities at
amortised
cost

24
Fourth quarter report 2018
In September 2017, Hurtigruten Group purchased 15.9 % of the shares in Kleven Maritime AS, the parent
company of Kleven Verft AS, with purchase price NOK 50 million. In June 2018, the Hurtigruten Group parent
company Silk Topco AS purchased 100% of the shares in Kleven Verft AS, resulting in a fair value adjustment
of the investment in Kleven Maritime AS of NOK -28 million. The investment is held as Available for sale, and
fair value adjustments are recognized through Other Comprehensive Income according to IFRS 9.
At 31 December 2017:
The carrying amount for the financial assets and liabilities has been assessed and does not differ materially
from fair value, except for total borrowings. Fair value of total borrowings at 31 December 2018 was NOK
7,079 million (NOK 6,030 million).
Note 8 Business influenced by seasonal factors
The Hurtigruten coastal service is influenced by seasonal factors with the main season traditionally from May
through August. In recent years the company has developed seasonal concepts, "Hunting the light" for the
winter season, "Arctic Awakening" in the spring, “Midnight Sun” in the summer and "Autumn Gold" in the fall.
This has increased the number of cruise nights in the months outside the traditional main season. The itinerary
and fleet of the company is according to the Hurtigruten public procurement contract, which involves daily
departures from Bergen all year through.
(Figures stated in NOK 1000)
Loans and
receivables
Assets at
fair value
through
profit and
loss
Assets at
fair value
through OCI
Derivatives
used for
hedging Total
Assets as per balance sheet
Other receivables, non-current 12 794 3 169 - - 15 962
Available for sale financial instruments - - 49 970 - 49 970
Trade and other receivables 393 590 - - - 393 590
Total derivatives - - - 50 028 50 028
Cash at bank, cash on hand and market-based
investments in the balance sheet 438 053 1 153 - - 439 206
Total 844 436 4 321 49 970 50 028 948 755
Total
Liabilities as per balance sheet
Total borrowings - - 5 783 576 5 783 576
Total derivatives - 13 247 - 13 247
Accounts payable and other short term payables - - 1 011 533 1 011 533
Total - 13 247 6 795 108 6 808 355
Liabilities at
fair value
through
profit and
loss
Other
financial
liabilities at
amortised
cost
Derivatives
used for
hedging

25
Fourth quarter report 2018
Expedition cruises are cyclical because the cruises are concentrated around four geographic areas (different
parts of the year); the Antarctic, Arctic Canada, Svalbard, Greenland and cruise between the Antarctic and the
Arctic. The land-based Svalbard operation has a main season reaching from March through August. This
activity is operated by the subsidiary Hurtigruten Svalbard AS.
Note 9 Events after the balance sheet date
On 1 January 2019, Hurtigruten AS, a 100% owned subsidiary of Hurtigruten Group AS, transferred its cruise operating business to Hurtigruten Cruise AS, a 100% owned subsidiary of Hurtigruten AS. Hurtigruten Cruise AS is operating within the Norwegian Tax Tonnage regime, and the transactions was executed at fair value for tax purposes. The transaction will generate a taxable profit in Hurtigruten AS, for which the previously unrecognized tax loss carry forwards will be utilized. As such, at 31 December 2018, the deferred tax asset related to the tax loss carry forwards has been recognized in the financial statements. This positive accounting effect will be reversed in 2019 There were no other events after balance-sheet date and before the date of the approval of the interim financial report for the fourth quarter, which provides new information about conditions that existed at the balance sheet date (that are not currently reflected in the financial statement), or significant event after the balance sheet date that require further disclosures.