Hurricanes, Tigers, and GW Kyle Avery Colin Curwen-McAdams Spencer Johnson Stephanie Ostrander 100...
22
Hurricanes, Tigers, and GW Kyle Avery Colin Curwen-McAdams Spencer Johnson Stephanie Ostrander 100 miles http://www.stormcenter.com/media/060103/ image1.jpg www.chagrin-falls.k12.oh.us
-
date post
20-Dec-2015 -
Category
Documents
-
view
214 -
download
0
Transcript of Hurricanes, Tigers, and GW Kyle Avery Colin Curwen-McAdams Spencer Johnson Stephanie Ostrander 100...
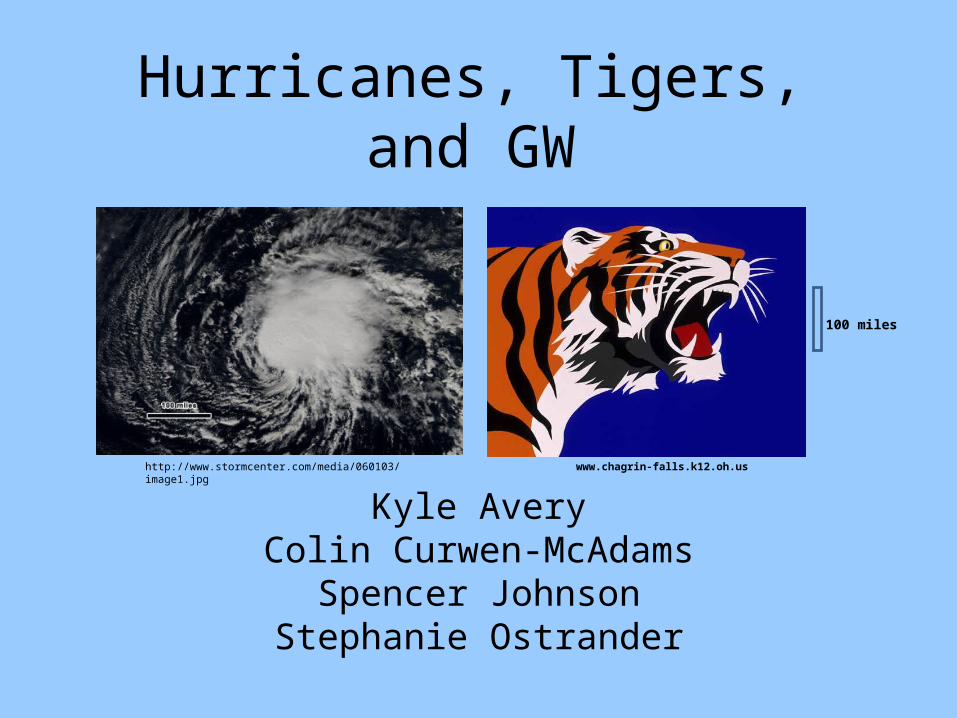
Hurricanes, Tigers, and GW
Kyle AveryColin Curwen-McAdams
Spencer JohnsonStephanie Ostrander
100 miles
http://www.stormcenter.com/media/060103/image1.jpg www.chagrin-falls.k12.oh.us
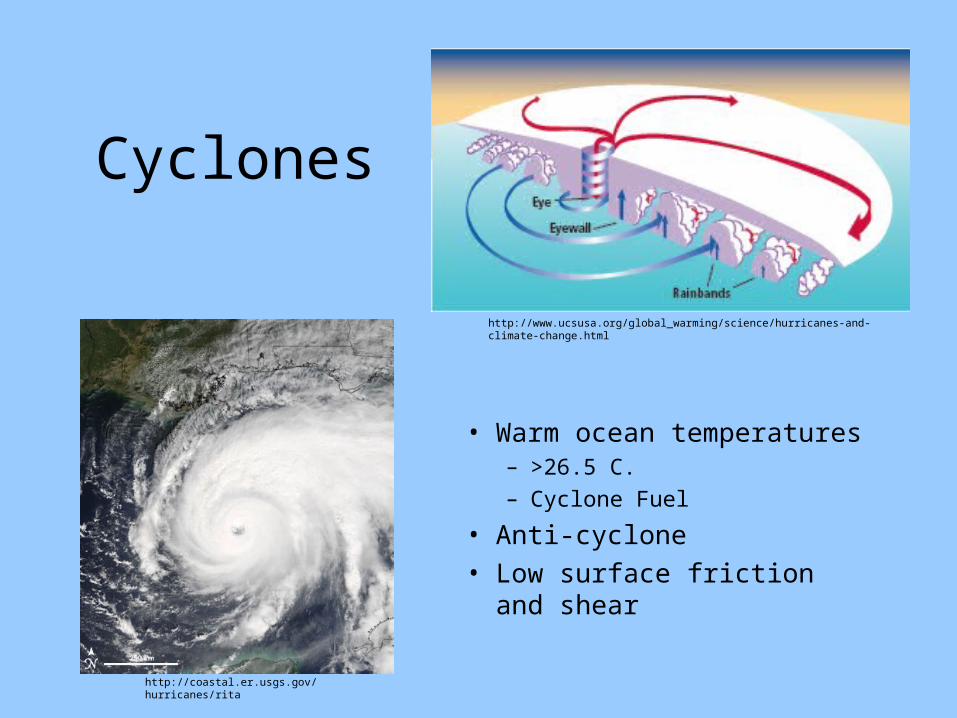
Cyclones
• Warm ocean temperatures– >26.5 C.
– Cyclone Fuel
• Anti-cyclone• Low surface friction and shear
http://coastal.er.usgs.gov/hurricanes/rita
http://www.ucsusa.org/global_warming/science/hurricanes-and-climate-change.html
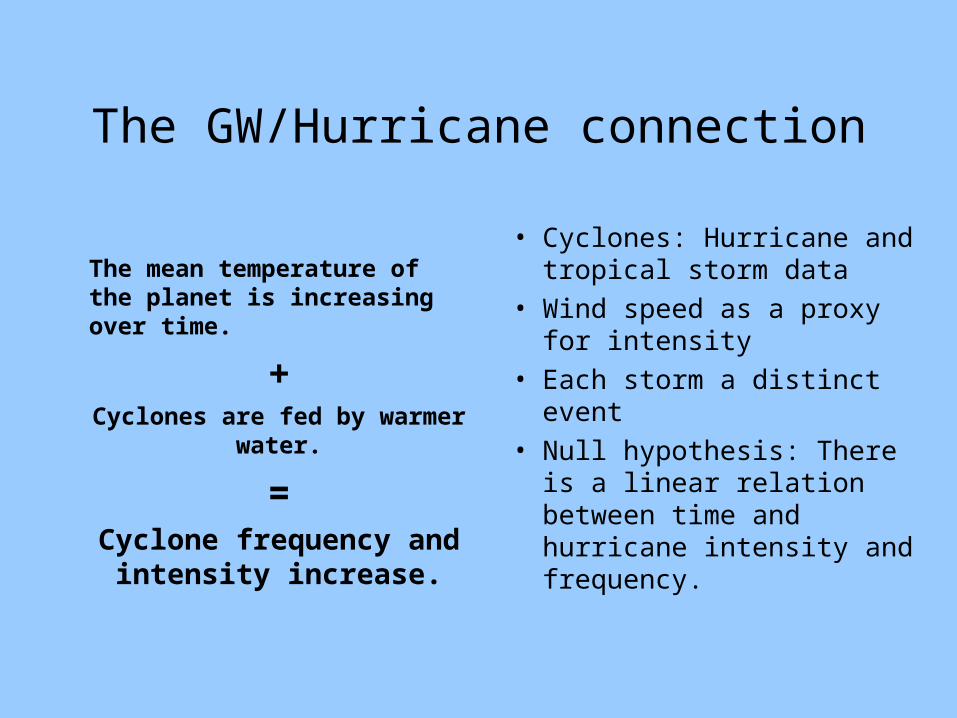
The GW/Hurricane connection
The mean temperature of the planet is increasing over time.
+Cyclones are fed by warmer
water.
=Cyclone frequency and
intensity increase.
• Cyclones: Hurricane and tropical storm data
• Wind speed as a proxy for intensity
• Each storm a distinct event
• Null hypothesis: There is a linear relation between time and hurricane intensity and frequency.
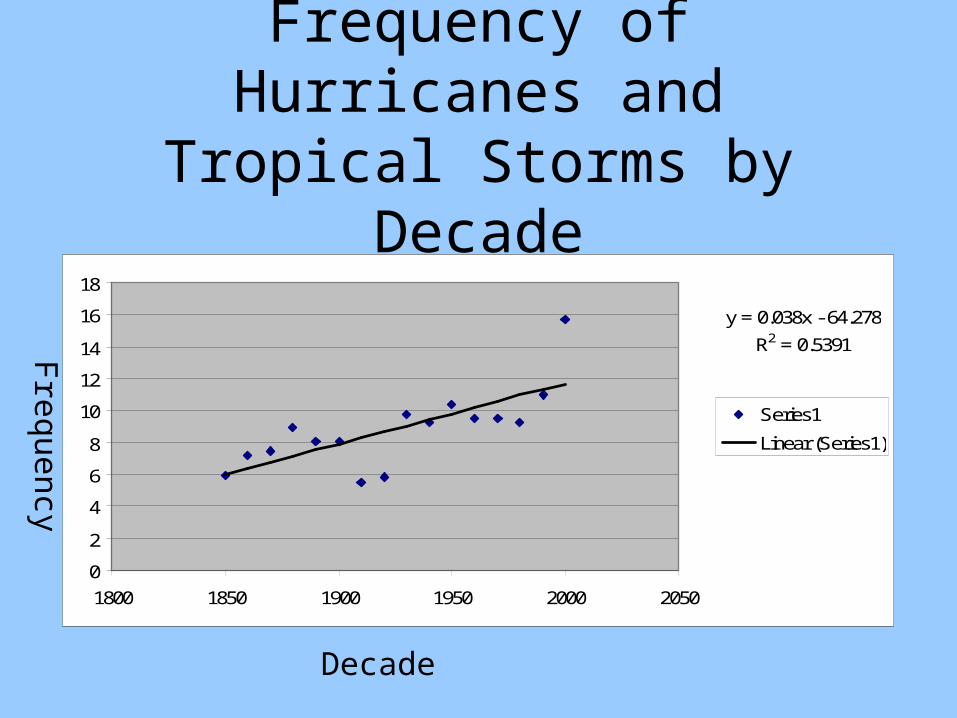
Frequency of Hurricanes and Tropical Storms by Decade
Decade
Frequency
y = 0.038x - 64.278
R2 = 0.5391
0
2
4
6
8
10
12
14
16
18
1800 1850 1900 1950 2000 2050
Series1
Linear (Series1)
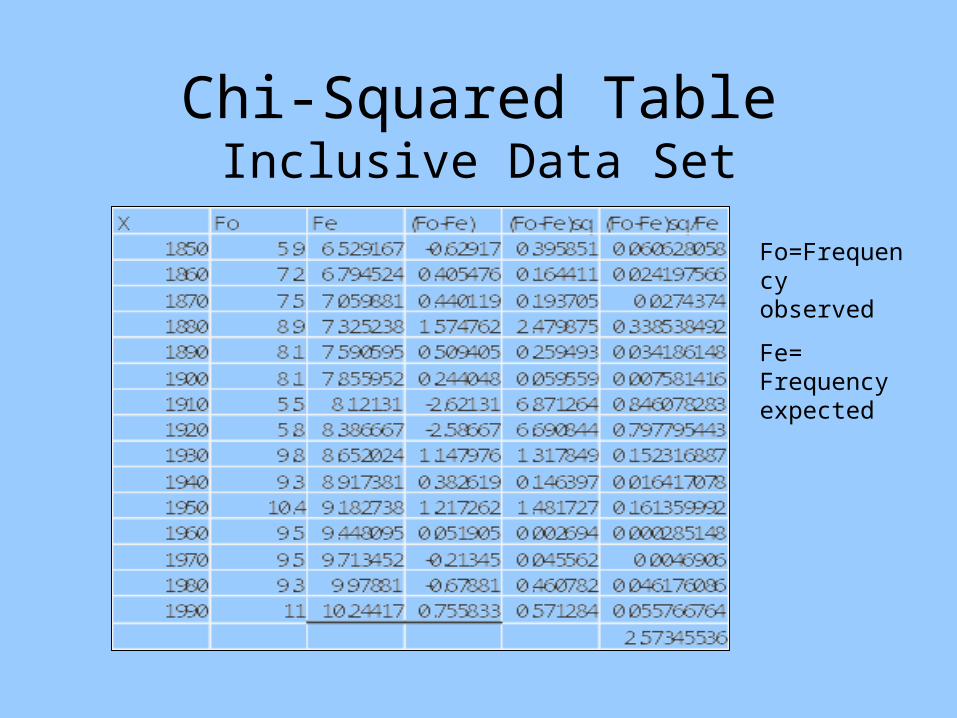
Chi-Squared TableInclusive Data Set
Fo=Frequency observed
Fe= Frequency expected
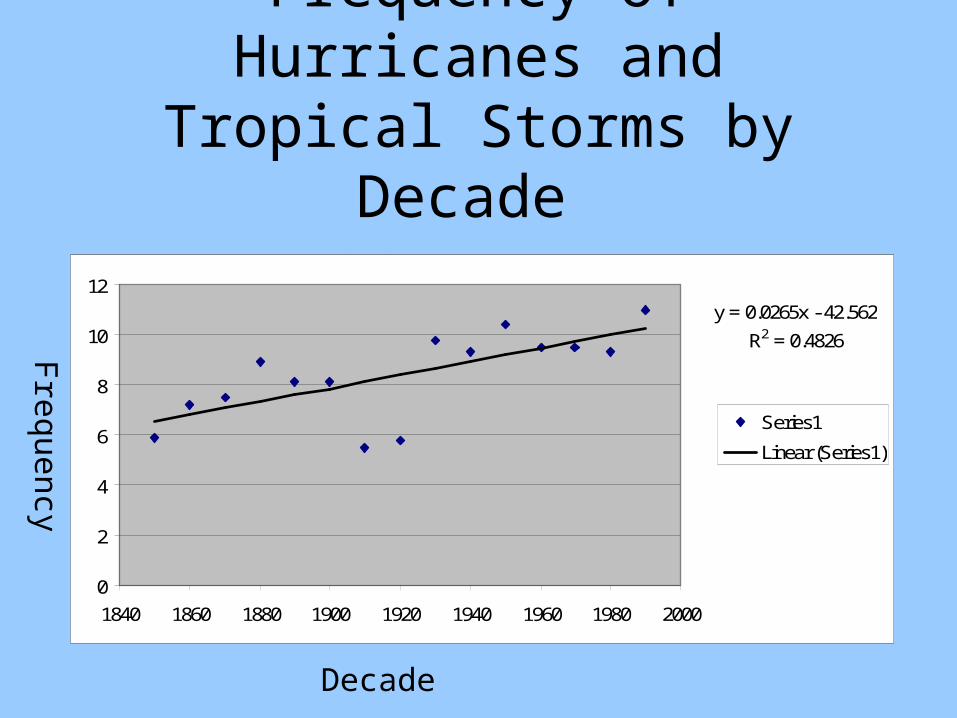
Frequency of Hurricanes and Tropical Storms by Decade
Data without 2000-2007
y = 0.0265x - 42.562
R2 = 0.4826
0
2
4
6
8
10
12
1840 1860 1880 1900 1920 1940 1960 1980 2000
Series1
Linear (Series1)
Decade
Frequency
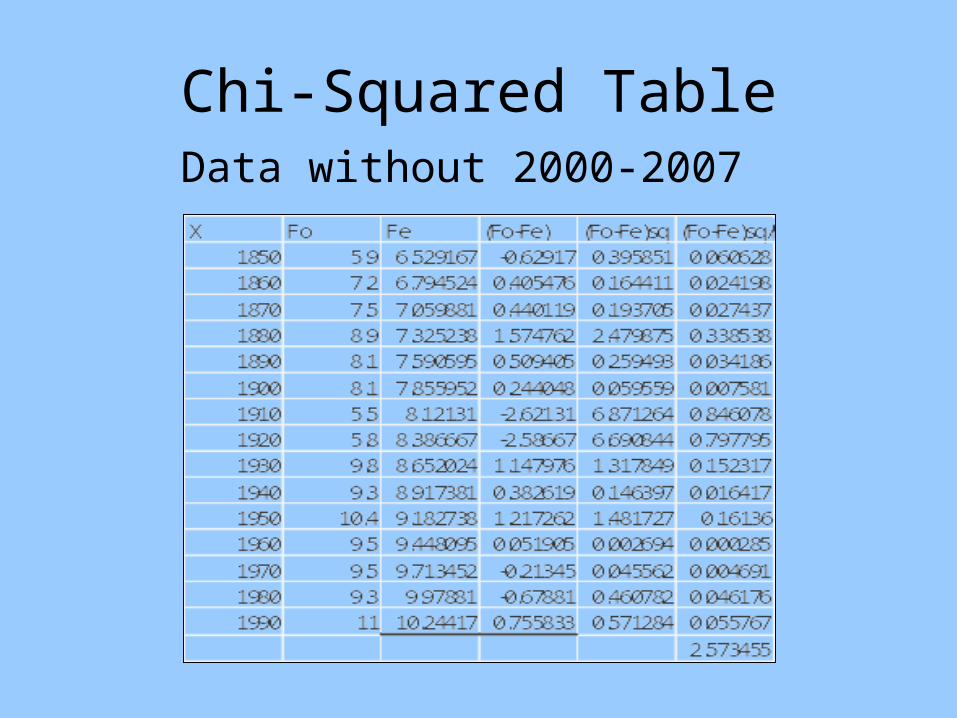
Chi-Squared TableData without 2000-2007
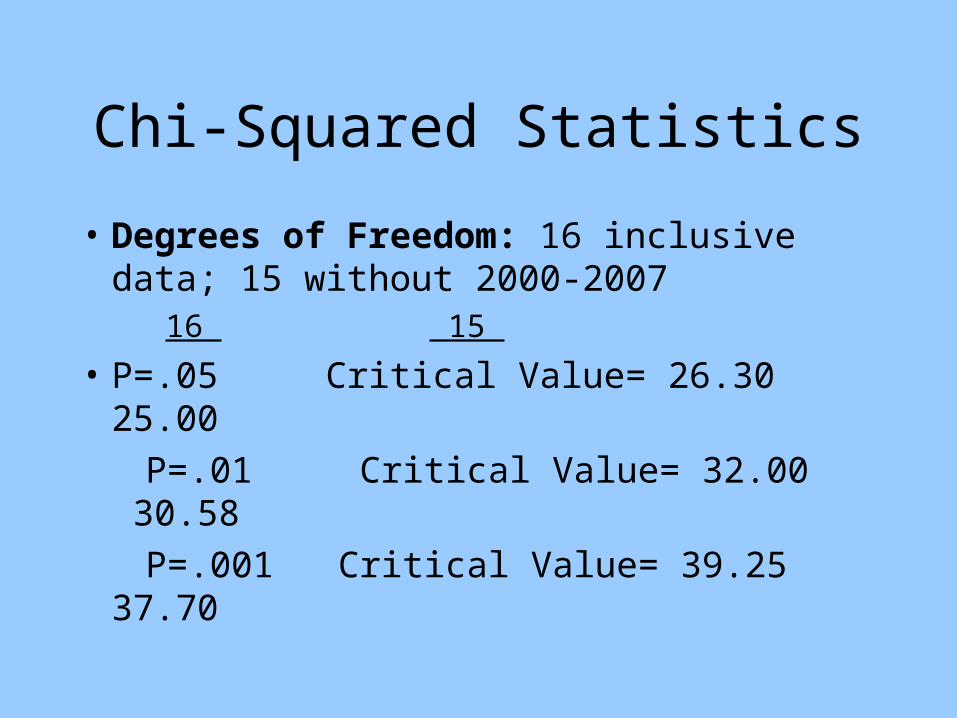
Chi-Squared Statistics
• Degrees of Freedom: 16 inclusive data; 15 without 2000-2007
16 15
• P=.05 Critical Value= 26.30 25.00
P=.01 Critical Value= 32.00 30.58
P=.001 Critical Value= 39.25 37.70
Average Wind Speed As a Function of Time
• Speed in knots
• 16 independent data points
• Data points are 10 year averages
• Degrees of Freedom = 16 (26.30 at p=.05)
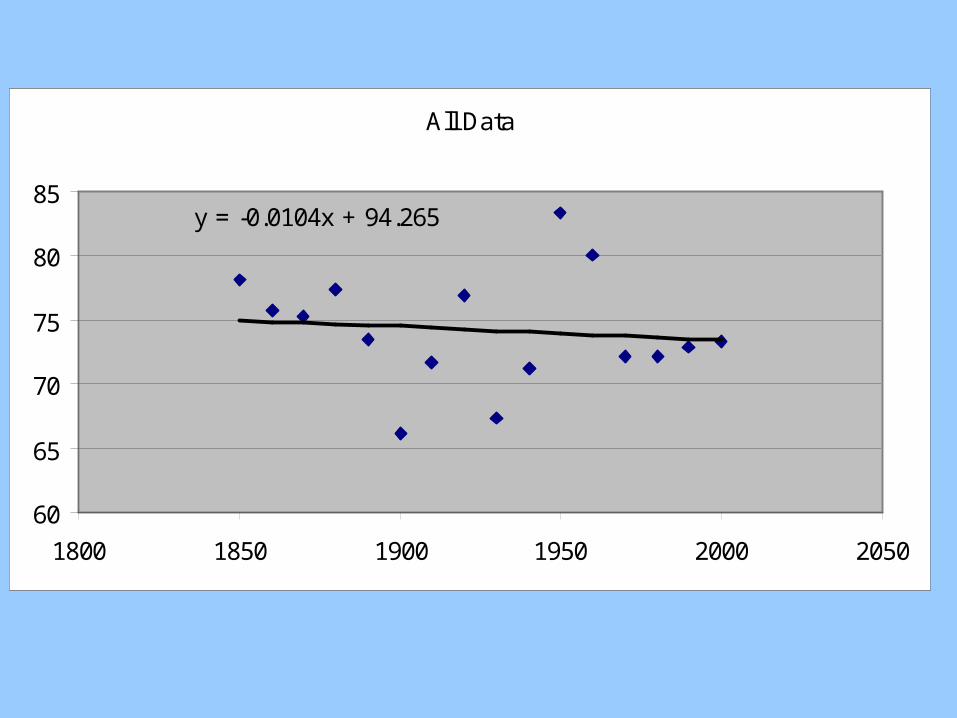
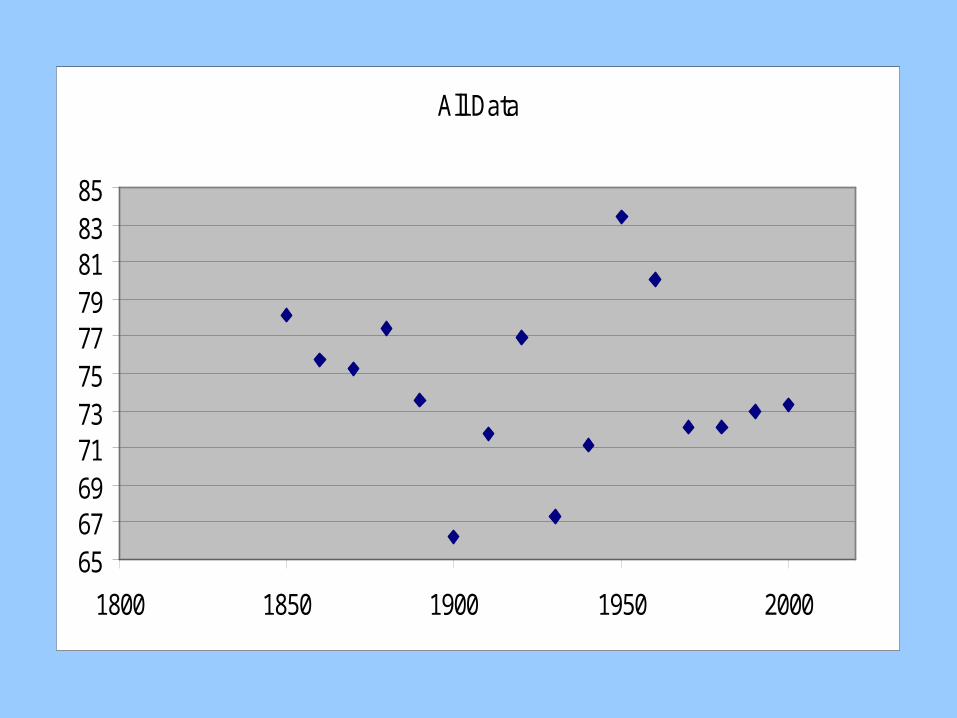
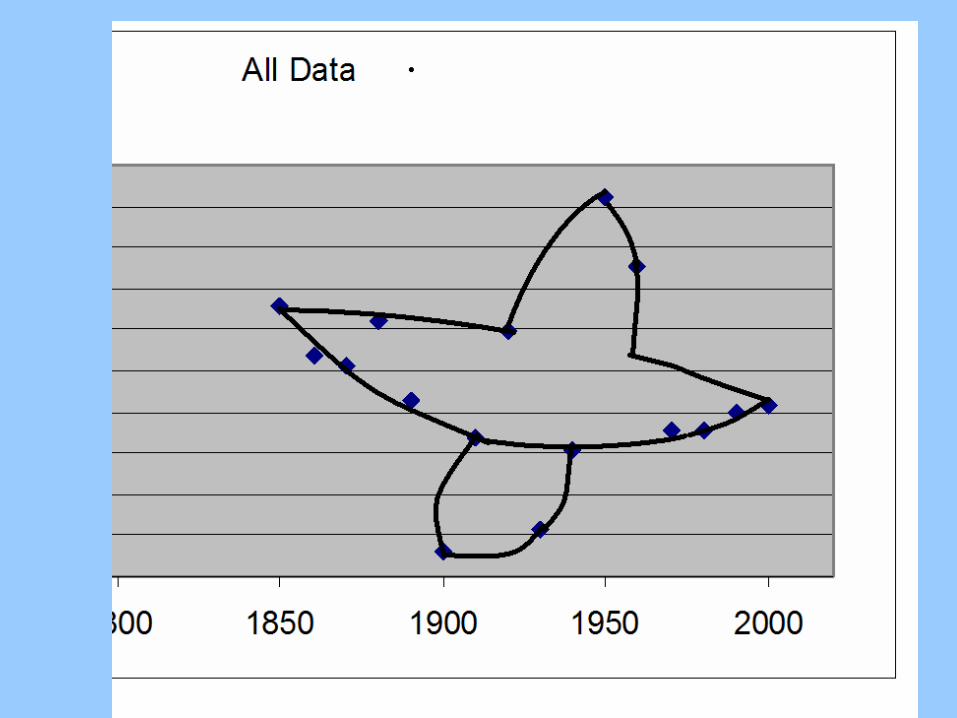
All Data
y = -0.0104x + 94.265
60
65
70
75
80
85
1800 1850 1900 1950 2000 2050
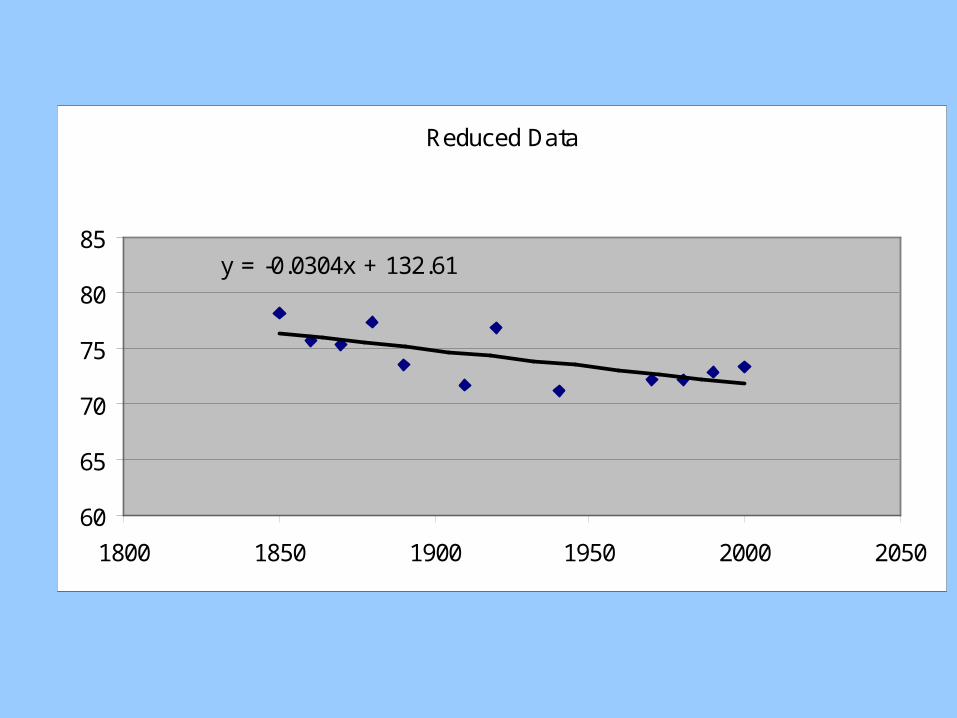
Reduced Data
y = -0.0304x + 132.61
60
65
70
75
80
85
1800 1850 1900 1950 2000 2050
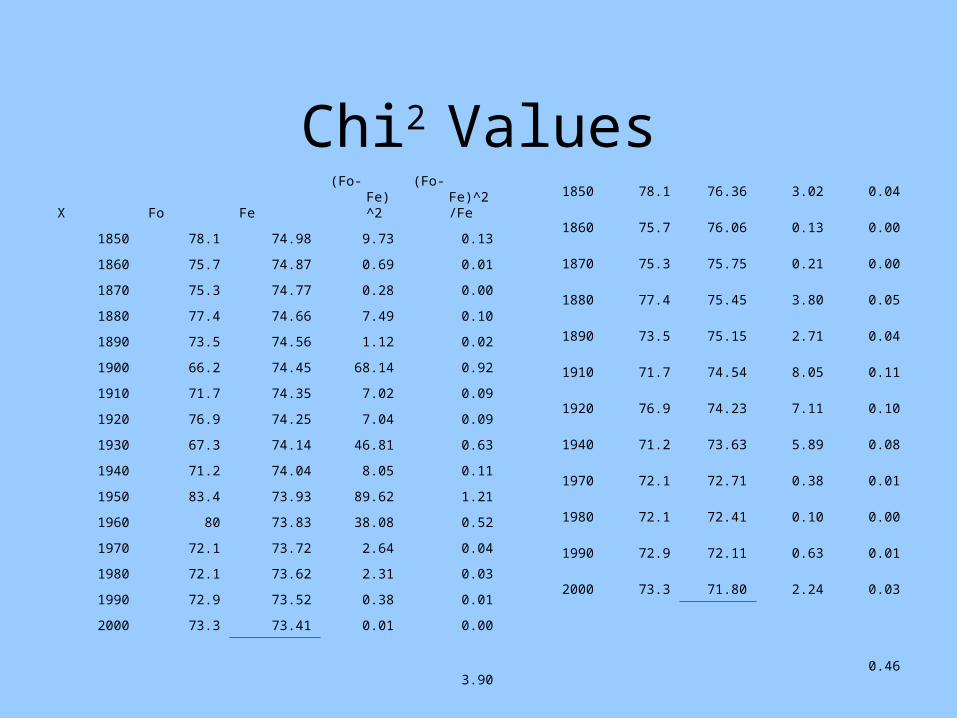
Chi2 ValuesX Fo Fe (Fo-Fe)^2 (Fo-Fe)^2/Fe
1850 78.1 74.98 9.73 0.13
1860 75.7 74.87 0.69 0.01
1870 75.3 74.77 0.28 0.00
1880 77.4 74.66 7.49 0.10
1890 73.5 74.56 1.12 0.02
1900 66.2 74.45 68.14 0.92
1910 71.7 74.35 7.02 0.09
1920 76.9 74.25 7.04 0.09
1930 67.3 74.14 46.81 0.63
1940 71.2 74.04 8.05 0.11
1950 83.4 73.93 89.62 1.21
1960 80 73.83 38.08 0.52
1970 72.1 73.72 2.64 0.04
1980 72.1 73.62 2.31 0.03
1990 72.9 73.52 0.38 0.01
2000 73.3 73.41 0.01 0.00
3.90
1850 78.1 76.36 3.02 0.04
1860 75.7 76.06 0.13 0.00
1870 75.3 75.75 0.21 0.00
1880 77.4 75.45 3.80 0.05
1890 73.5 75.15 2.71 0.04
1910 71.7 74.54 8.05 0.11
1920 76.9 74.23 7.11 0.10
1940 71.2 73.63 5.89 0.08
1970 72.1 72.71 0.38 0.01
1980 72.1 72.41 0.10 0.00
1990 72.9 72.11 0.63 0.01
2000 73.3 71.80 2.24 0.03
0.46
• Regression slopes -0.01 and -0.03
• Standard deviation 4.42 Average 7.19
All Data
6567697173757779818385
1800 1850 1900 1950 2000
All Data
6567697173757779818385
1700 1750 1800 1850 1900 1950 2000

What’s Wrong with Hurricanes Anyway?
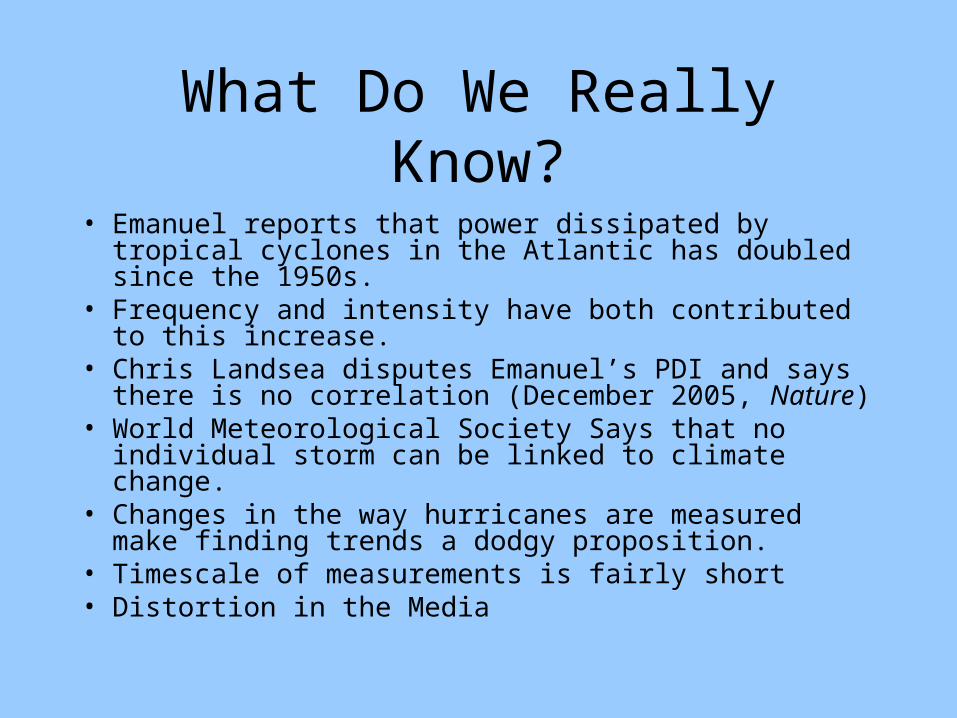
What Do We Really Know?
• Emanuel reports that power dissipated by tropical cyclones in the Atlantic has doubled since the 1950s.
• Frequency and intensity have both contributed to this increase.
• Chris Landsea disputes Emanuel’s PDI and says there is no correlation (December 2005, Nature)
• World Meteorological Society Says that no individual storm can be linked to climate change.
• Changes in the way hurricanes are measured make finding trends a dodgy proposition.
• Timescale of measurements is fairly short• Distortion in the Media
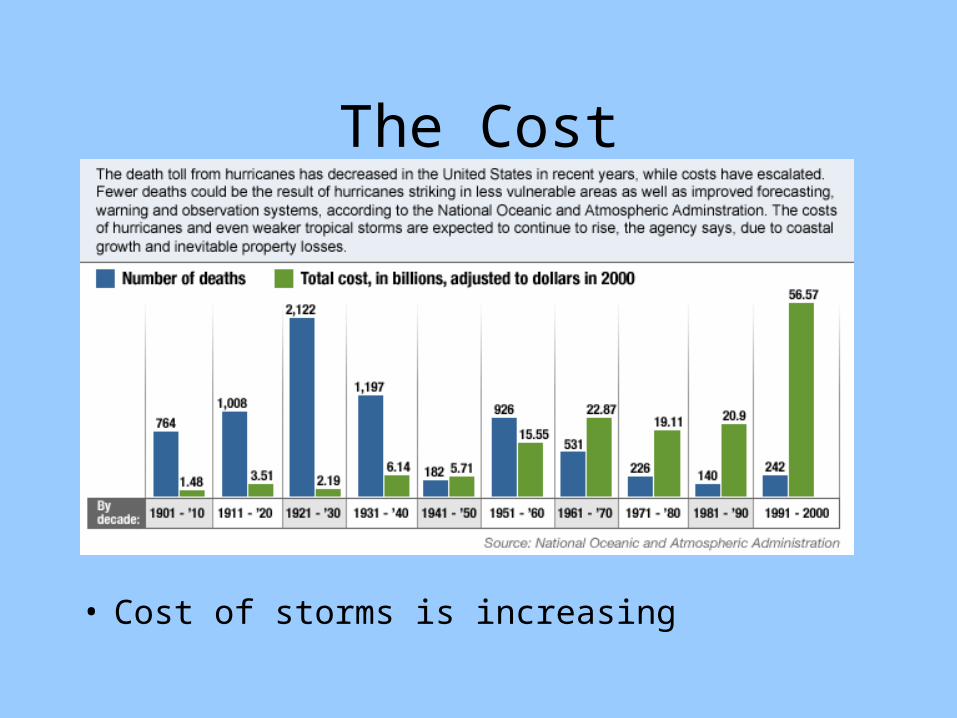
The Cost
• Cost of storms is increasing
What Should We Do?
• Learn from past mistakes
• Education about storms
• Don’t build below sea level or other especially precarious places
• Invest in preventative measures
The Real Problem