
HELPING AFTER HURRICANE HARVEY Friendswood , HURRICANE HARVEY

NATIONAL HURRICANE CENTER TROPICAL CYCLONE REPORT
HURRICANE OTIS (EP152017) 11–19 September 2017
Eric S. Blake National Hurricane Center
9 January 2018
NOAA/NASA TERRA MODIS SATELLITE IMAGE OF OTIS AT 2142 UTC 17 SEPTEMBER 2017.
Otis was a weak tropical cyclone for much of its lifetime before rapidly intensifying into a category three (on the Saffir-Simpson Hurricane Wind Scale) hurricane over the western portion of the eastern Pacific Ocean. It then rapidly weakened just as quickly and dissipated well out to sea.
Hurricane Otis 2
Hurricane Otis 11–19 SEPTEMBER 2017
SYNOPTIC HISTORY The mid-level circulation from Atlantic Hurricane Katia was the progenitor of Otis, which was moving westward across southern Mexico on 9 September. The system emerged off the southwestern coast of Mexico later that day and immediately started producing thunderstorms, likely enhanced by a weak convectively coupled Kelvin wave moving through the region. On 10 September, the disturbance was already showing signs of convective organization on satellite images, but there was no surface circulation noted until early on 11 September. Microwave images suggest that a well-defined low formed by 0600 UTC that day, marking the formation of a tropical depression about 335 n mi southwest of Manzanillo, Mexico. Easterly wind shear was too strong for much intensification, but the depression eventually became a tropical storm almost two days after genesis. The “best track” chart of Otis’ path is given in Fig. 1, with the wind and pressure histories shown in Figs. 2 and 3, respectively. The best track positions and intensities are listed in Table 11.
After genesis, the cyclone moved westward and west-southwestward around a deep-layer ridge over the far eastern Pacific. Otis reached an initial peak intensity of 35 kt around 0000 UTC 13 September, several hundred miles southwest of Baja California Sur. The storm then moved a bit slower to the west or west-northwest for the next several days around the weakening ridge. Despite being over warm waters, easterly shear (which decreased by 15 September) and eventually persistent mid-level dry air caused Otis to gradually lose strength, and scatterometer data showed that the cyclone only had 25-kt winds early on 16 September. The environment around Otis was changing, however, with dry air intrusions near the center decreasing, as suggested in microwave-derived precipitable water analyses (not shown). Consequently, Otis developed a circular central dense overcast late on 16 September and turned sharply northward into a weakness in the ridge while the cyclone steadily intensified.
Microwave data showed the formation of a mid-level eye by 1000 UTC 17 September, and a distinct pinhole eye was present on visible imagery later that day. Otis rapidly intensified into a hurricane by 1200 UTC 17 September and became a major hurricane with 100-kt winds at 0000 UTC 18 September about 1020 n mi west-southwest of Cabo San Lucas, Mexico. This strengthening was short-lived, however, as the northward track brought the cyclone over much cooler water and into a higher-shear, low-moisture environment. These changes caused Otis to rapidly weaken just as quickly as it had strengthened, down to only a 40-kt tropical storm 24 h after its peak intensity. The cyclone lost all deep convection by 1200 UTC 19 September, indicating that Otis had degenerated into a remnant low about 1050 n mi west of Cabo San Lucas.
1 A digital record of the complete best track, including wind radii, can be found on line at ftp://ftp.nhc.noaa.gov/atcf. Data for the current year’s storms are located in the btk directory, while previous years’ data are located in the archive directory.

Hurricane Otis 3
The low turned southwestward and accelerated while it was steered by a low-level ridge, opening up into a trough early on 21 September.
METEOROLOGICAL STATISTICS Observations in Otis (Figs. 2 and 3) include subjective satellite-based Dvorak technique intensity estimates from the Tropical Analysis and Forecast Branch (TAFB), the Satellite Analysis Branch (SAB), and the Advanced Dvorak Technique (ADT) from CIMSS at the University of Wisconsin. Data and imagery from NOAA polar-orbiting satellites including the Advanced Microwave Sounding Unit (AMSU), the NASA Global Precipitation Mission (GPM), the European Space Agency’s Advanced Scatterometer (ASCAT), and Defense Meteorological Satellite Program (DMSP) satellites, among others, were also useful in constructing the best track of Otis.
The estimated peak intensity of 100 kt at 0000 UTC 18 September is based on a blend of lower TAFB/SAB subjective Dvorak estimates (which were constrained) and higher ADT estimates from UW-CIMSS. All of the agencies had Data-T values supporting at least major-hurricane strength, and given that the 6-h ADT average was about 105 kt, these data suggest Otis attained category 3 strength. However, there is much more uncertainty than normal in the peak intensity because of the wide variety of estimates and the small size of the cyclone, making the hurricane more prone to rapid changes in intensity and difficult to assess.
There were no ship or land reports of tropical-storm-force winds associated with Otis.
CASUALTY AND DAMAGE STATISTICS
No damage or deaths occurred in association with Otis.
FORECAST AND WARNING CRITIQUE
The genesis forecasts for Otis were rather poor (Table 2). The potential for tropical cyclone development was introduced into the Tropical Weather Outlook (TWO) only 18 h before genesis occurred. It was thought that easterly shear would be too strong to allow for tropical cyclone formation in this case. This was a challenging forecast where the environment was barely conducive for what was initially a weak tropical cyclone—typically a situation where NHC genesis forecasts struggle.
A verification of NHC official track forecasts for Otis is given in Table 3a. Official forecast track errors were lower than the mean official errors for the previous 5-yr period through 48 h and then higher for 72 h to 120 h. These higher errors at long range were due to a sharp northward turn that was not forecast adequately until the shorter-range time periods. A homogeneous comparison of the official track errors with selected guidance models is given in Table 3b. Overall,

Hurricane Otis 4
the dynamical track model consensus aids TVCN and TVCX were generally difficult to beat, which is not unusual for the eastern Pacific. Among the single-model aids, the ECMWF (EMXI) and GFS-based COAMPS-TC (CTCI) models were the top performers, especially at longer ranges. The GFS-ensemble mean (AEMI) and the UKMET (EGRI) models had poorer performances than average for this cyclone.
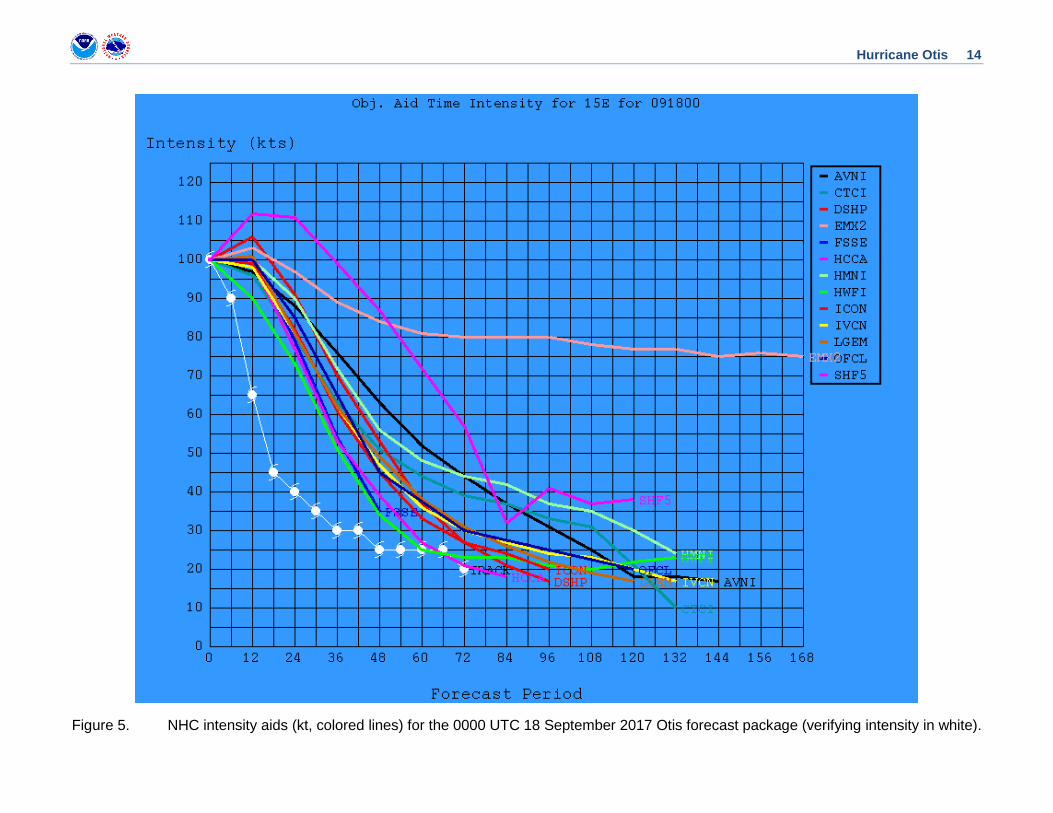
A verification of NHC official intensity forecasts for Otis is given in Table 4a. Official forecast intensity errors were generally far above the mean official errors for the previous 5-yr period through 36 h, then close to or lower than average through 96 h. The rapid intensification and subsequent weakening on 17–19 September were poorly forecast, featuring the typical biases of not forecasting a rapid enough strengthening and then keeping the intensity up for too long after peak intensity (Figs. 4,5). In fact, before rapid intensification not one single member of the historically reliable guidance suite was forecasting Otis to even become a hurricane, much less reach category three strength (Fig. 4). A homogeneous comparison of the official intensity errors with selected guidance models is given in Table 4b. Similar to track, the consensus models for intensity (IVCN & ICON) were the best overall performers, although the HFIP corrected-consensus model (HCCA) did improve upon the intensity consensus at some time periods. Of the deterministic models, the HWRF (HWFI) did well at short range, while the SHIPS (DSHP) and LGEM models were among the poorer performers.
No watches or warnings were required for land due to Otis.

Hurricane Otis 5
Table 1. Best track for Hurricane Otis, 11–19 September 2017.
Date/Time (UTC)
Latitude (°N)
Longitude (°W)
Pressure (mb)
Wind Speed
(kt) Stage
11 / 0600 16.4 108.6 1009 25 tropical depression
11 / 1200 16.5 110.0 1007 25 "
11 / 1800 16.4 111.5 1006 25 "
12 / 0000 16.2 113.0 1006 25 "
12 / 0600 16.0 114.4 1006 25 "
12 / 1200 15.8 115.7 1004 30 "
12 / 1800 15.5 116.9 1004 30 "
13 / 0000 15.2 118.0 1003 35 tropical storm
13 / 0600 14.9 119.1 1003 35 "
13 / 1200 14.9 120.1 1004 30 tropical depression
13 / 1800 15.0 120.9 1004 30 "
14 / 0000 15.1 121.5 1004 30 "
14 / 0600 15.2 122.1 1004 30 "
14 / 1200 15.3 122.7 1005 30 "
14 / 1800 15.5 123.3 1005 30 "
15 / 0000 15.7 123.9 1006 30 "
15 / 0600 15.9 124.4 1006 30 "
15 / 1200 16.0 124.8 1007 30 "
15 / 1800 16.0 125.2 1007 30 "
16 / 0000 15.9 125.5 1008 25 "
16 / 0600 15.8 125.9 1008 25 "
16 / 1200 15.8 126.4 1007 30 "
16 / 1800 15.8 126.8 1006 35 tropical storm
17 / 0000 15.8 127.1 1005 40 "
17 / 0600 16.0 127.3 1001 50 "
17 / 1200 16.3 127.2 991 65 hurricane

Hurricane Otis 6
17 / 1800 16.8 127.1 980 80 "
18 / 0000 17.6 127.2 965 100 "
18 / 0600 18.3 127.3 973 90 "
18 / 1200 18.7 127.4 991 65 "
18 / 1800 19.0 127.5 1002 45 tropical storm
19 / 0000 19.1 127.6 1004 40 "
19 / 0600 19.1 127.8 1006 35 "
19 / 1200 19.0 128.3 1007 30 low
19 / 1800 18.6 128.8 1007 30 "
20 / 0000 18.1 129.4 1008 25 "
20 / 0600 17.6 129.9 1008 25 "
20 / 1200 17.1 130.5 1008 25 "
20 / 1800 16.6 131.1 1008 25 "
21 / 0000 16.1 131.7 1009 20 "
21 / 0600 dissipated
18 / 0000 17.6 127.2 965 100 minimum pressure and maximum winds
Table 2. Number of hours in advance of the formation of Otis associated with the first NHC Tropical Weather Outlook forecast in the indicated likelihood category. Note that the timings for the “Low” category do not include forecasts of a 0% chance of genesis.
Hours Before Genesis
48-Hour Outlook 120-Hour Outlook
Low (<40%) 18 18
Medium (40%-60%)
High (>60%)

Hurricane Otis 7
Table 3a. NHC official (OFCL) and climatology-persistence skill baseline (OCD5) track forecast errors (n mi) for Otis. Mean errors for the previous 5-yr period are shown for comparison. Official errors that are smaller than the 5-yr means are shown in boldface type.
Forecast Period (h)
12 24 36 48 72 96 120
OFCL 20.0 32.4 41.6 53.8 90.8 128.3 195.1
OCD5 32.9 67.6 99.8 147.0 221.7 331.8 468.4
Forecasts 29 27 25 23 19 15 6
OFCL (2012-16) 22.2 33.9 43.8 54.8 80.0 108.9 145.1
OCD5 (2012-16) 35.7 72.0 112.2 150.2 217.0 271.0 340.2
Hurricane Otis 8
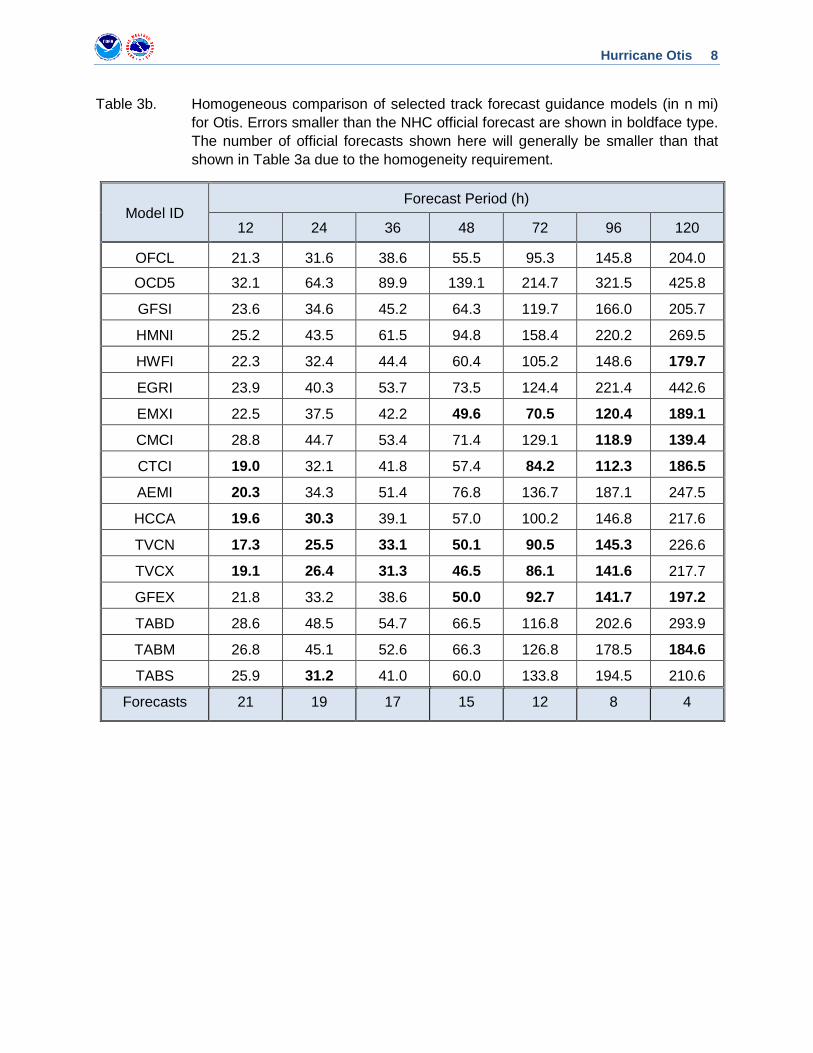
Table 3b. Homogeneous comparison of selected track forecast guidance models (in n mi) for Otis. Errors smaller than the NHC official forecast are shown in boldface type. The number of official forecasts shown here will generally be smaller than that shown in Table 3a due to the homogeneity requirement.
Model ID Forecast Period (h)
12 24 36 48 72 96 120
OFCL 21.3 31.6 38.6 55.5 95.3 145.8 204.0
OCD5 32.1 64.3 89.9 139.1 214.7 321.5 425.8
GFSI 23.6 34.6 45.2 64.3 119.7 166.0 205.7
HMNI 25.2 43.5 61.5 94.8 158.4 220.2 269.5
HWFI 22.3 32.4 44.4 60.4 105.2 148.6 179.7
EGRI 23.9 40.3 53.7 73.5 124.4 221.4 442.6
EMXI 22.5 37.5 42.2 49.6 70.5 120.4 189.1
CMCI 28.8 44.7 53.4 71.4 129.1 118.9 139.4
CTCI 19.0 32.1 41.8 57.4 84.2 112.3 186.5
AEMI 20.3 34.3 51.4 76.8 136.7 187.1 247.5
HCCA 19.6 30.3 39.1 57.0 100.2 146.8 217.6
TVCN 17.3 25.5 33.1 50.1 90.5 145.3 226.6
TVCX 19.1 26.4 31.3 46.5 86.1 141.6 217.7
GFEX 21.8 33.2 38.6 50.0 92.7 141.7 197.2
TABD 28.6 48.5 54.7 66.5 116.8 202.6 293.9
TABM 26.8 45.1 52.6 66.3 126.8 178.5 184.6
TABS 25.9 31.2 41.0 60.0 133.8 194.5 210.6
Forecasts 21 19 17 15 12 8 4

Hurricane Otis 9
Table 4a. NHC official (OFCL) and climatology-persistence skill baseline (OCD5) intensity forecast errors (kt) for Otis. Mean errors for the previous 5-yr period are shown for comparison. Official errors that are smaller than the 5-yr means are shown in boldface type.
Forecast Period (h)
12 24 36 48 72 96 120
OFCL 8.4 14.3 14.0 14.8 14.5 15.0 24.2
OCD5 10.1 16.7 17.1 18.4 19.8 20.4 19.8
Forecasts 29 27 25 23 19 15 6
OFCL (2012-16) 5.8 9.4 11.8 13.2 15.0 15.7 14.9
OCD5 (2012-16) 7.6 12.2 15.7 18.1 20.6 21.8 20.0
Table 4b. Homogeneous comparison of selected intensity forecast guidance models (in kt) for Otis. Errors smaller than the NHC official forecast are shown in boldface type. The number of official forecasts shown here will generally be smaller than that shown in Table 4a due to the homogeneity requirement.
Model ID Forecast Period (h)
12 24 36 48 72 96 120
OFCL 8.5 13.4 12.6 15.2 14.7 13.6 21.3
OCD5 10.2 16.1 16.0 19.4 20.1 19.8 16.8
GFSI 10.5 16.4 17.0 17.1 10.2 15.4 19.8
EMXI 10.8 14.4 12.8 14.4 16.6 20.3 28.3
DSHP 9.3 13.5 14.3 18.0 15.6 16.1 18.3
LGEM 8.9 12.6 12.8 15.6 19.2 17.7 18.0
HMNI 10.7 17.2 16.8 16.8 18.6 12.0 19.8
HWFI 10.3 11.6 10.7 15.0 17.8 14.5 21.8
HCCA 9.3 12.0 12.2 14.5 14.4 12.9 14.8
IVCN 9.2 12.3 11.8 14.1 14.4 14.3 14.0
ICON 9.1 12.2 11.9 15.0 16.9 13.6 13.5
Forecasts 27 25 23 21 18 14 4

Hurricane Otis 10
Figure 1. Best track positions for Hurricane Otis, 11–19 September 2017.

Hurricane Otis 11
Figure 2. Selected wind observations and best track maximum sustained surface wind speed curve for Otis. Advanced Dvorak Technique estimates represent the Current Intensity at the nominal observation time. AMSU intensity estimates are from the Cooperative Institute for Meteorological Satellite Studies technique. Dashed vertical lines correspond to 0000 UTC.
20
30
40
50
60
70
80
90
100
110
120
9/10 9/12 9/14 9/16 9/18 9/20 9/22
BEST TRACKSat (TAFB)Sat (SAB)ADTScatterometerAMSU
Win
d Sp
eed
(kt)
Date (Month/Day)
Hurricane Otis11 - 19 September 2017

Hurricane Otis 12
Figure 3. Selected pressure observations and best track minimum central pressure curve for Otis. Advanced Dvorak Technique estimates represent the Current Intensity at the nominal observation time. AMSU intensity estimates are from the Cooperative Institute for Meteorological Satellite Studies technique. KZC P-W refers to pressure estimates derived using the Knaff-Zehr-Courtney pressure-wind relationship. Dashed vertical lines correspond to 0000 UTC.
960
970
980
990
1000
1010
9/10 9/12 9/14 9/16 9/18 9/20 9/22
BEST TRACKKZC P-WSat (TAFB)Sat (SAB)ADTAMSUSurface
Pres
sure
(mb)
Date (Month/Day)
Hurricane Otis11 - 19 September 2017

Hurricane Otis 13
Figure 4. NHC intensity aids (kt, colored lines) for the 0000 UTC 17 September 2017 Otis forecast package (verifying intensity in white).
Hurricane Otis 14
Figure 5. NHC intensity aids (kt, colored lines) for the 0000 UTC 18 September 2017 Otis forecast package (verifying intensity in white).