Hurricane Hermine · National Hurricane Center . 30 January 2017 . ... August was responsible for...
63
NATIONAL HURRICANE CENTER TROPICAL CYCLONE REPORT HURRICANE HERMINE (AL092016) 28 August – 3 September 2016 Robbie Berg National Hurricane Center 30 January 2017 NASA TERRA MODIS IMAGE OF HERMINE AT 1625 UTC 1 SEPTEMBER 2016 OVER THE NORTHEASTERN GULF OF MEXICO, JUST BEFORE IT BECAME A HURRICANE Hermine was a category 1 hurricane (on the Saffir-Simpson Hurricane Wind Scale) that made landfall along the sparsely populated Big Bend coast of Florida just east of St. Marks. Hermine was the first hurricane to make landfall in Florida since Wilma in 2005. Hermine moved across Georgia, South Carolina, and North Carolina as a tropical storm and then meandered off the mid-Atlantic coast as an extratropical low for a few days.
Transcript of Hurricane Hermine · National Hurricane Center . 30 January 2017 . ... August was responsible for...

NATIONAL HURRICANE CENTER TROPICAL CYCLONE REPORT
HURRICANE HERMINE (AL092016) 28 August – 3 September 2016
Robbie Berg National Hurricane Center
30 January 2017
NASA TERRA MODIS IMAGE OF HERMINE AT 1625 UTC 1 SEPTEMBER 2016 OVER THE NORTHEASTERN GULF OF MEXICO,
JUST BEFORE IT BECAME A HURRICANE
Hermine was a category 1 hurricane (on the Saffir-Simpson Hurricane Wind Scale)
that made landfall along the sparsely populated Big Bend coast of Florida just east of St. Marks. Hermine was the first hurricane to make landfall in Florida since Wilma in 2005. Hermine moved across Georgia, South Carolina, and North Carolina as a tropical storm and then meandered off the mid-Atlantic coast as an extratropical low for a few days.

Hurricane Hermine 2
Hurricane Hermine 28 AUGUST – 3 SEPTEMBER 2016
SYNOPTIC HISTORY A tropical wave that moved off the west coast of Africa late on 16 August and early on 17 August was responsible for the formation of Hermine. The wave produced a small cluster of deep convection within the Intertropical Convergence Zone for a couple of days after moving off the coast, but by 20 and 21 August, the convection waned a bit due to drier mid-tropospheric air nearby. Over the next two days, showers and thunderstorms increased near the wave, and heavy rains began to spread over portions of the Leeward Islands late on 23 August. These rains continued to spread across the Leeward Islands and Greater Antilles on 24 and 25 August, with the wave axis moving quickly westward at about 20 kt. Although the wave’s fast motion caused gale-force winds to occur north of the Greater Antilles, the speed also inhibited the development of a closed wind circulation and well-defined center.
On 26 August, the northern portion of the tropical wave split off to the north of the Greater Antilles, and the disturbance’s forward speed slowed considerably. However, the system also approached an upper-level trough that extended across the western Bahamas, and the resulting increased deep-layer shear caused the convection to lose organization and the maximum surface winds to decrease below gale force. Showers and thunderstorms remained displaced east of the wave axis for another day or two while the wave moved between Cuba and the Bahamas, but the system finally developed a well-defined center of circulation on 28 August. Since the deep convection had sufficient organization at the time, it is estimated that a tropical depression formed by 1800 UTC that day in the Straits of Florida about 50 n mi south-southeast of Key West, Florida. The “best track” chart of the tropical cyclone’s path is given in Fig. 1, with the wind and pressure histories shown in Figs. 2 and 3, respectively. The best track positions and intensities are listed in Table 11.
When it formed, the depression was located to the south of a mid-level high pressure system centered over the Appalachian Mountains, which caused the cyclone to move slowly westward across the southeastern Gulf of Mexico through 30 August. Even though sea surface temperatures in that area were near 30°C, moderate northwesterly shear persisted over the system and prevented intensification for a couple of days. Early on 31 August, a break in the ridge developed over the southeastern United States, and the cyclone slowly turned toward the north and north-northeast. Upper-level winds also decreased, and the depression strengthened to a tropical storm by 0600 UTC 31 August while centered about 210 n mi north-northwest of Cancun, Mexico. A steady strengthening trend commenced at that time with Hermine moving north-northeastward and northeastward over the warm waters of the eastern Gulf of Mexico,
1 A digital record of the complete best track, including wind radii, can be found on line at ftp://ftp.nhc.noaa.gov/atcf. Data for the current year’s storms are located in the btk directory, while previous years’ data are located in the archive directory.

Hurricane Hermine 3
around the western periphery of a low- to mid-level western Atlantic ridge. Still, upper-level winds were strong enough on 31 August to give the tropical storm an asymmetric structure, with most of the cloudiness and deep convection oriented east of the center in an elongated band that extended from the Yucatan Peninsula to Florida.
A central cluster of deep convection developed separate from the elongated cloud band early on 1 September, and a ragged eye became evident in visible imagery later that day. Hermine reached hurricane intensity by 1800 UTC while it was centered about 115 n mi south-southwest of Apalachicola, Florida, and it strengthened a little more to a peak intensity of 70 kt by 0000 UTC 2 September. Hermine maintained that intensity until landfall along the Florida Big Bend coast just east of St. Marks, Florida, at 0530 UTC 2 September. The cyclone weakened quickly once it moved inland and became a tropical storm by 0800 UTC over the Florida Panhandle about 25 n mi east-northeast of Tallahassee.
As a tropical storm, Hermine moved northeastward just inland over coastal portions of Georgia, South Carolina, and North Carolina on 2 September and early on 3 September with maximum sustained winds of 50 kt. During that time, deep-layer southwesterly shear increased significantly, and Hermine began to gradually acquire non-tropical characteristics with the development of frontal boundaries, causing the convective structure to become increasingly asymmetric. Hermine became extratropical by 1200 UTC 3 September while centered very near Oregon Inlet, North Carolina, and baroclinic forcing caused the cyclone’s maximum winds to increase to 60 kt.
The extratropical cyclone moved generally eastward over the Atlantic Ocean away from the coast and maintained 60-kt winds until early on 5 September. The low then occluded and began to steadily weaken, and it turned northwestward and westward on 5 and 6 September, moving closer to the mid-Atlantic coast. Now cut off from the mid-latitude westerlies, the occluded low meandered offshore of New Jersey and Long Island on 7 September with its winds dropping below gale force by 1200 UTC. The weakened low then moved northeastward on 8 September and dissipated soon after 1800 UTC near Chatham, Massachusetts.
METEOROLOGICAL STATISTICS Observations in Hermine (Figs. 2 and 3) include subjective satellite-based Dvorak technique intensity estimates from the Tropical Analysis and Forecast Branch (TAFB) and the Satellite Analysis Branch (SAB), and objective Advanced Dvorak Technique (ADT) estimates from the Cooperative Institute for Meteorological Satellite Studies/University of Wisconsin-Madison. Observations also include flight-level, stepped frequency microwave radiometer (SFMR), and dropwindsonde observations from 18 flights of the 53rd Weather Reconnaissance Squadron of the U. S. Air Force Reserve Command and 7 flights of the NOAA Aircraft Operations Center (AOC). Data and imagery from NOAA polar-orbiting satellites including the Advanced Microwave Sounding Unit (AMSU), the NASA Global Precipitation Mission (GPM), the European Space Agency’s Advanced Scatterometer (ASCAT), and Defense Meteorological Satellite Program (DMSP) satellites, among others, were also useful in constructing the best track of Hermine.

Hurricane Hermine 4
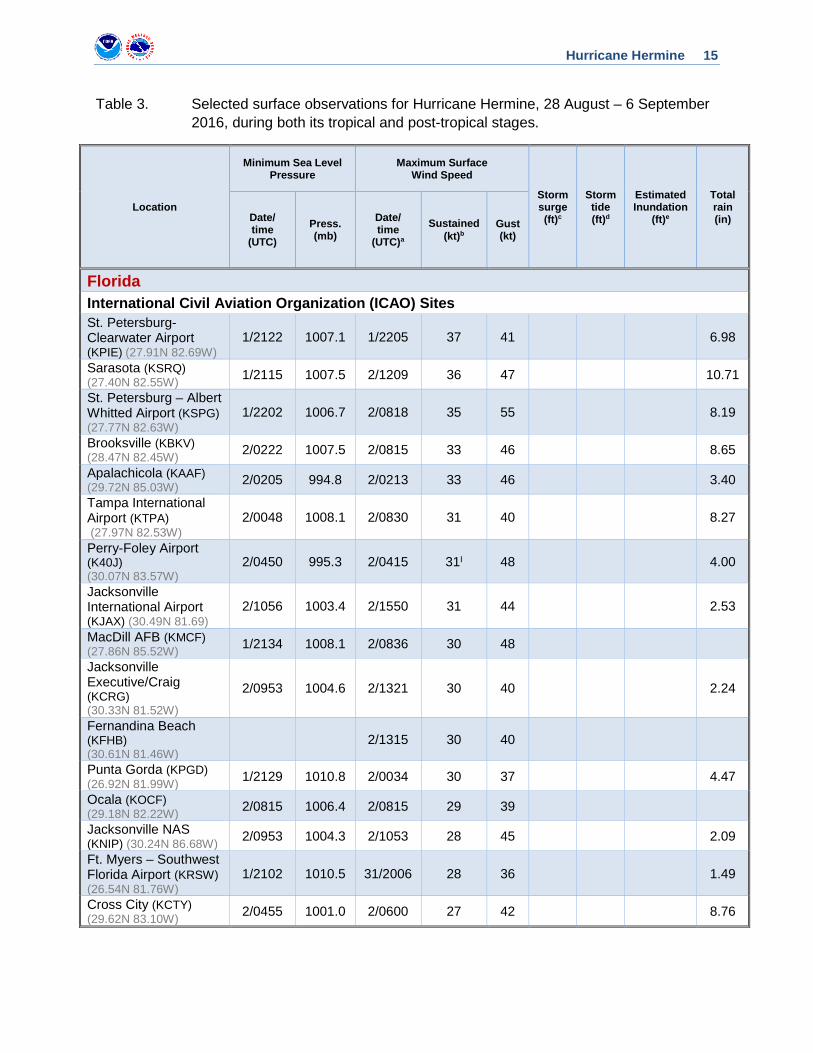
Ship reports of winds of tropical storm force associated with Hermine are given in Table 2, and selected surface observations from land stations and data buoys are given in Table 3.
Winds and Pressure Hermine is estimated to have reached tropical storm strength by 0600 UTC 31 August based on ASCAT data from 0330 UTC that showed maximum surface winds near 35 kt. This assessment is also supported by satellite intensity estimates from TAFB and SAB, which had increased to at least T2.5/35 kt from both agencies by that time.
The analysis of Hermine becoming a hurricane by 1800 UTC 1 September is based on a temporal interpolation of aircraft reconnaissance data. An Air Force Reserve flight during the afternoon of 1 September measured an 850-mb flight-level wind of 76 kt at 1606 UTC, which equates to a surface intensity near 60 kt. The next Air Force Reserve flight measured an 850-mb flight-level wind of 86 kt at 2343 UTC, which corresponds to a surface intensity near 70 kt. In addition, a dropsonde released from the second flight at 2340 UTC recorded an average wind of 81 kt in the lowest 150 m of the profile, corresponding to surface winds of 65-70 kt. Based on these data, Hermine is estimated to have had maximum winds of 65 kt at 1800 UTC. Hermine’s estimated peak intensity of 70 kt beginning at 0000 UTC 2 September until landfall at 0530 UTC is based on the aforementioned data, as well as a peak 850-mb flight-level wind of 90 kt measured at 0249 UTC and an SFMR observation of 67 kt at 0343 UTC. Doppler radar data from the Tallahassee WSR-88D indicated winds of 85-90 kt at elevations between 3000 and 7000 ft, which is also supportive of the 70-kt intensity at landfall.
Hermine’s central pressure fell to its minimum just before the hurricane made landfall along the Florida coast. A dropsonde released from the Air Force Reserve Hurricane Hunter aircraft at 0443 UTC 2 September, about 45 minutes before landfall, measured a splash pressure of 984 mb with a surface wind of 33 kt, yielding an estimated minimum central pressure of 981 mb.
Hermine made landfall along a section of the Florida coast that has a small population and a sparse observational network, and there were no reports of sustained hurricane-force winds on land in the state (Fig. 4a). A private weather station at Bald Point State Park did, however, measure a sustained wind of 53 kt and a gust to 68 kt while within Hermine’s western eyewall, which was the only land-based gust to hurricane force observed while Hermine was a tropical cyclone (Fig. 4b). A wind gust to 63 kt was measured by a WeatherFlow station in Sarasota late on 1 September, but this observation was elevated and related to a peripheral squall rather than the core of the hurricane. Tyndall Air Force Base Tower C, located about 13.5 n mi off the coast of St. George Island, Florida, measured a wind gust to 69 kt at an elevation of 115 ft. Based on an analysis of Hermine’s wind field, sustained hurricane-force winds likely occurred near the coast in Taylor and Jefferson Counties, Florida, to the east of where Hermine’s center made landfall, and possibly farther west in Wakulla and Franklin Counties. Sustained tropical-storm-force winds occurred over portions of northern Florida, as well as coastal sections of Georgia, South Carolina, and North Carolina while Hermine was a tropical cyclone. The highest winds reported in Tallahassee were a sustained wind of 41 kt and a gust to 56 kt by an anemometer from the WeatherSTEM network situated at the top of a parking garage on the Florida State University campus about 40 m above the ground.

Hurricane Hermine 5
After Hermine became extratropical, strong sustained winds near hurricane force occurred over the Outer Banks of North Carolina to the north of the cyclone’s center (Fig. 5a). The NOS station in Duck, North Carolina, measured a sustained wind of 62 kt, and a WeatherFlow station on the Alligator River Bridge measured a sustained wind of 60 kt during the morning of 3 September. The NOS station also reported a wind gust to 73 kt, and a separate WeatherFlow station in Nags Head reported a gust to 71 kt (Fig. 5b). Sustained gale-force winds extended farther north into the Tidewater region of southeastern Virginia, with the highest sustained wind at a standard height being 47 kt from a WeatherFlow station at Rudee Inlet in Virginia Beach. Sustained gale-force winds and gusts to storm force also affected sections of the mid-Atlantic and Northeast coasts between Maryland and southeastern Massachusetts (Figs. 6a and 6b). One observation of note was a WeatherFlow station in New Shoreham on Block Island, Rhode Island, which reported a sustained wind of 45 kt and a gust to 52 kt late on 5 September.
Storm Surge2 The highest measured storm surge in Florida was 7.50 ft above normal tide levels at an NOS gauge on Cedar Key. The combined effect of the surge and tide produced maximum inundation levels of 4 to 7 ft above ground level to the east of Hermine’s landfall location along the immediate coasts of Jefferson, Taylor, Dixie, and Levy Counties (Fig. 7). A high water mark of 6.5 ft above ground level was surveyed by the United States Geological Survey (USGS) at the Spring Warrior Fish Camp (on Spring Warrior Creek) in Taylor County, and the NOS gauge on Cedar Key measured a record storm tide of 6.1 ft above Mean Higher High Water (MHHW). The previous record at the gauge was 5.2 ft above MHHW set on 7 October 1996 during Tropical Storm Josephine. Records at the gauge go back as far as 1914. Several other high water marks survey by USGS in Taylor and Dixie Counties were between 4 and 6 ft above ground level.
Onshore winds along the west coast of Florida produced inundation values of 2 to 4 ft above ground level south of Cedar Key to Ft. Myers, including Tampa Bay. The NOS tide gauge at the McKay Bay Entrance near Downtown Tampa measured a storm surge of 4.09 ft above normal tide levels, resulting in a storm tide of 3.2 ft above MHHW. Storm tides of 3.0 ft above MHHW occurred at the NOS gauges on Clearwater Beach and Old Port Tampa.
Inundation levels of 2 to 4 ft above ground level also occurred west of Hermine’s landfall point from St. Marks westward to Cape San Blas (Wakulla, Franklin, and Gulf Counties). The NOS gauge at Apalachicola recorded a storm surge of 4.17 ft above normal tide levels, resulting in a storm tide of 3.0 ft above MHHW.
2 Several terms are used to describe water levels due to a storm. Storm surge is defined as the abnormal rise of water generated by a storm, over and above the predicted astronomical tide, and is expressed in terms of height above normal tide levels. Because storm surge represents the deviation from normal water levels, it is not referenced to a vertical datum. Storm tide is defined as the water level due to the combination of storm surge and the astronomical tide, and is expressed in terms of height above a vertical datum, i.e. the North American Vertical Datum of 1988 (NAVD88) or Mean Lower Low Water (MLLW). Inundation is the total water level that occurs on normally dry ground as a result of the storm tide, and is expressed in terms of height above ground level. At the coast, normally dry land is roughly defined as areas higher than the normal high tide line, or Mean Higher High Water (MHHW).

Hurricane Hermine 6
Only minor coastal flooding occurred along the coasts of northeastern Florida, Georgia, South Carolina, and southern North Carolina. However, strong winds on the back side of Hermine when it became extratropical resulted in storm surge inundation levels of 2 to 4 ft above ground level on portions of the Outer Banks and Tidewater region of Virginia, with isolated areas up to 5 ft. An NOS gauge at the US Coast Guard station in Hatteras, North Carolina, on Pamlico Sound measured a storm surge of 4.02 ft above normal tide levels, resulting in a storm tide of 4.4 ft above MHHW. Just south of Norfolk, Virginia, an NOS gauge at Money Point recorded a storm surge of 3.91 ft above normal tide levels and a storm tide of 3.5 ft above MHHW. Less significant coastal flooding occurred along the mid-Atlantic and Northeast coasts, where the highest observed storm tide was 1.8 ft above MHHW at the NOS gauge in Atlantic City, New Jersey.
Rainfall and Flooding Hermine produced heavy rainfall across much of western and northern Florida, extending northward across coastal sections of Georgia, South Carolina, and North Carolina (Fig. 8). The maximum reported storm-total rainfall was near Tarpon Springs, Florida, in Pinellas County, where 22.36 inches was measured between 30 August and 2 September. More than 10 inches of rain were reported at other sites along the west coast of Florida, particularly in Pinellas, Pasco, Manatee, and Charlotte Counties. The heavy rainfall caused flooding of streets and low-lying areas near the west coast of Florida, especially in Pinellas County where the most rain fell. Flooding occurred on several rivers in northern Florida, although only the Anclote River reached major flood stage. The river crested at 25.08 ft at Elfers, which was about 7 ft above flood stage and 1 ft above major flood stage. Moderate flooding occurred on the Steinhatchee River near Steinhatchee, where the river crested almost 4 ft above flood stage at a level of 23.24 ft.
Lesser rainfall amounts extended northward into southern Georgia, where a state maximum of 7.64 inches was measured near Valdosta. However, a secondary maximum in rainfall occurred over northeastern South Carolina and southeastern North Carolina. South Carolina’s maximum storm-total amount, measured from 1-3 September, was 14.17 inches near Georgetown, while 10.05 inches of rain fell near Hampstead in Pender County, North Carolina, from 2-3 September. At least 10 inches of rain fell over parts of Georgetown, Horry, Sumter, and Bamberg Counties in South Carolina. These rains caused some flash flooding and minor river flooding in North and South Carolina. Rainfall totals dropped off sharply farther north over the mid-Atlantic and Northeast. Several inches of rain fell in parts of southeastern Virginia, with a site in Suffolk recording 4.88 inches. Otherwise, most stations from Maryland to Massachusetts reported less than an inch. A little over an inch of rain fell in parts of southeastern Massachusetts.
Hermine and its precursor disturbance also produced heavy rainfall across parts of Cuba and the Dominican Republic. Media reports indicate that more than 12 inches of rain occurred in the cities of Santa Lucia and Candelaria in Pinar del Rio, Cuba. More than 4 inches occurred at many locations in the province of Sancti Spiritus, with the Cuban Meteorological Service reporting a rainfall total of 9.45 inches in San Carlos. In Cienfuegos, 4.25 inches of rain was reported in only three hours.

Hurricane Hermine 7
Tornadoes Hermine produced ten total tornadoes: five in Florida, two in Georgia, and three in North Carolina. Three EF-0 (on the Enhanced Fujita Scale) tornadoes were reported on the evening of 1 September near Steinhatchee, Adams Beach, and Salem in Taylor County, Florida, but none caused damage. Two other EF-0 tornadoes also occurred on the evening of 1 September in rural Winter Garden in Orange County, Florida, and near Fruitland Park and Lady Lake in Lake County, both causing some structural damage to homes and downing trees and powerlines.
Two EF-1 tornadoes touched down in the early morning hours of 2 September in coastal Georgia. One of the tornadoes hit near South Newport in Liberty County, snapping or uprooting trees and causing minor damage to a few structures. The other touched down on Skidaway Island in Chatham County just southeast of Savannah, damaging numerous homes and snapping or uprooting hundreds of large pine and oak trees.
Two EF-1 tornadoes were reported in Straits and Marshallberg in Carteret County, North Carolina, on the evening of 2 September. Both tornadoes caused some structural damage and snapped the trunks of trees or broke off large branches. An EF-0 tornado touched down near Hatteras Village in Dare County, North Carolina, soon after midnight on 3 September. The tornado caused several injuries and damaged or destroyed five trailers and camping cabins at a recreational vehicle (RV) resort.
CASUALTY AND DAMAGE STATISTICS Hermine caused one direct death3 as a result of its strong winds while it was a tropical cyclone. A 56-year-old homeless man died in Ocala, Florida, in the early morning hours of 2 September when a tree fell on his tent behind a gas station and food mart. Several hours after Hermine became post-tropical, a 64-year-old man driving a tractor-trailer across the Alligator River Bridge on U.S. Highway 64 in eastern North Carolina during the morning of 3 September died when strong winds overturned his vehicle and smashed it against the bridge’s railing. Winds on the bridge around the time of the accident were measured as high as 60 kt sustained and gusting to 70 kt.
The NOAA National Centers for Environmental Information (NCEI) estimates that wind and water damage from Hermine totaled around $550 million, with a 90% confidence interval of +/-$150 million. Damage assessments in Florida concluded that 1,600 homes and businesses in the state were destroyed or sustained major or minor damage, rendering them uninhabitable.4 Many of these structures were in Franklin, Wakulla, Taylor, Dixie, and Levy Counties in Florida, with the damage primarily due to storm surge and high winds. Heavy rainfall and freshwater
3 Deaths occurring as a direct result of the forces of the tropical cyclone are referred to as “direct” deaths. These would include those persons who drowned in storm surge, rough seas, rip currents, and freshwater floods. Direct deaths also include casualties resulting from lightning and wind-related events (e.g., collapsing structures). Deaths occurring from such factors as heart attacks, house fires, electrocutions from downed power lines, vehicle accidents on wet roads, etc., are considered indirect” deaths. 4 Florida Division of Emergency Management (9 December 2016). Hurricane Hermine Recovery. http://www.floridadisaster.org/info/recovery.htm#pda

Hurricane Hermine 8
flooding also damaged or destroyed homes and businesses in Citrus, Hernando, Pasco, Pinellas, and Hillsborough Counties. An additional 1,065 structures in Florida were affected but were not deemed uninhabitable. Strong winds downed many trees and power lines even well inland from the coast, leading to widespread power outages. According to a briefing given by Florida Governor Rick Scott on 2 September, more than 253,000 customers lost power in the state.5 About 65% of electric customers (75,000 total) lost power in the City of Tallahassee, in addition to 20,000 customers in the remainder of Leon County. The city’s electrical system experienced its most significant damage since Hurricane Kate in 1985, leaving many people without power for days.6 In Wakulla County, 91% of customers lost power due to the storm.
No major widespread structural damage occurred in Georgia, but Hermine’s winds produced millions of dollars in damage to pecan groves in the southern part of the state. The Georgia Farm Bureau reports that some pecan growers lost 30% to 80% of their crops.7 Many pecan trees were either blown down or broken, and about 30% of the nuts were blown from or shaken off the trees by the wind.8 Farther north, damage in South Carolina was not serious and was primarily limited to downed trees and powerlines. Damage was more significant on the Outer Banks of North Carolina due to the strong winds on the back side of Hermine when it became post-tropical and the resultant soundside storm surge flooding. An assessment for Dare County put the total damage at $5.4 million, with most occurring on the southern end of Hatteras Island in Hatteras village and the town of Frisco.9
The heavy rainfall from Hermine’s precursor disturbance also affected the Dominican Republic and Cuba. In the Dominican Republic, the Center for Emergency Operations indicated that 1,779 people had been displaced from their homes due to urban and rural flash flooding.10 Heavy rains in Cuba caused some flooding in provinces from Sancti Spiritus to Pinar del Rio, but they also helped to fill reservoirs and ease drought concerns in the country.11
FORECAST AND WARNING CRITIQUE
The forecasts for the genesis of Hermine were only good in that NHC was able to identify the incipient tropical wave as being a viable candidate for tropical cyclone formation, but there was no skill in isolating when that formation would occur. Table 4 provides the number of hours
5 Florida Division of Emergency Management (2 September 2016). Hurricane Hermine. http://www.floridadisaster.org/eoc/hermine2016/ 6 Leon County Board of County Commissioners (13 December 2016). Hurricane Hermine After-Action Report. http://cms.leoncountyfl.gov/coadmin/agenda/Workshops/ws120161213.pdf 7 Georgia Farm Bureau (7 September 2016). South Georgia pecan growers hit by Hermine. http://www.gfb.org/agnews/story.asp?RecordID=6265 8 Tattnall County Extension (6 September 2016). Assessing pecan damage from Hurricane Hermine. http://blog.extension.uga.edu/tattnall/2016/09/assessing-pecan-damage-from-hurricane-hermine/ 9 The Outer Banks Voice (8 September 2016). New assessment doubles Dare’s storm damage to $5.4 million. http://blog.extension.uga.edu/tattnall/2016/09/assessing-pecan-damage-from-hurricane-hermine/ 10 Dominican Today (27 August 2016). Rains to continue, 14 provinces on alert. http://www.dominicantoday.com/dr/local/2016/8/27/60436/Rains-to-continue-14-provinces-on-alert-updated 11 Martí (30 August 2016). Alertan de inundaciones repentinas en Cuba por intensas lluvais. http://www.martinoticias.com/a/cuba-lluvias-inundaciones-tormenta/128940.html

Hurricane Hermine 9
in advance of formation associated with the first NHC Tropical Weather Outlook (TWO) forecast in each likelihood category. The tropical wave was introduced in the TWO and given a low (<40%) chance of genesis during the next five days 240 h (10 days) before Hermine formed, and it was given a medium (40-60%) chance 6 h later. For the short term (48-h) forecast, NHC gave the disturbance a low and medium chance of genesis 234 h (9.75 days) and 138 h (5.75 days) before it formed, respectively. Despite these extraordinarily long lead times, NHC did not raise the five-day probability to high (>60%) chance until 114 h (4.75 days) before genesis, which actually ended up verifying well. After Hermine did not form before reaching the Leeward Islands, the prospects for genesis seemed worse since environmental conditions became more marginal, and NHC lowered the two- and five-day probabilities back to low and medium, respectively, 66 h (2.75 days) before genesis. Although those chances went back up within a day of genesis, the two-day probabilities never reached the high category before Hermine formed. This can partly be attributed to inconsistent model guidance. Within the five days prior to Hermine’s genesis, the National Weather Service’s Global Forecast System (GFS) only showed a trough or weak low moving into the eastern Gulf of Mexico. On the other hand, the European Centre for Medium-Range Forecasting global model (ECMWF) depicted a strong tropical cyclone forming and reaching the southeastern coast of Florida on several consecutive runs four to five days before Hermine formed. Within two to three days of genesis, however, the ECMWF backed off and did not show tropical cyclone formation again until a day before Hermine formed. The inconsistencies between these and other models made it very difficult for NHC to have high confidence that genesis would occur.
A verification of NHC official track forecasts for Hermine, during both its tropical and post-tropical phases12, is given in Table 5a. Official forecast track errors were greater than the mean official errors for the previous 5-yr period from 12 to 72 h but were lower than the previous 5-yr errors at 96 and 120 h. Hermine’s track was not very well behaved compared to that of a typical Atlantic tropical cyclone, especially during its post-tropical stage, and climatology and persistence model (OCD5) errors were larger than their respective mean errors during the previous 5-yr period at all times except 12 h13. Figures 9a and 9b show the NHC official track forecasts plotted against the best track for Hermine. The NHC forecasts verified well over the eastern Gulf of Mexico, but there was a noticeable eastward bias in the track forecasts over northern Florida and near the Georgia and Carolina coasts. The NHC track forecasts then had a westward bias north of that region, with Hermine expected to recurve closer to the mid-Atlantic coast as a post-tropical cyclone.
A homogeneous comparison of the official track errors with selected guidance models during Hermine’s tropical and post-tropical phases is given in Table 5b. No individual model or model consensus beat the NHC official forecast at every forecast time. Overall, however, the United Kingdom Met Office global model (EGRI) had relatively low errors compared to the official forecasts (between 24 and 96 h), as did the GFSI (between 36 and 120 h). Many of the model consensus aids also had lower errors than the official forecasts, especially between 12 and 72 h. Neither the European Centre for Medium-Range Weather Forecasting model (EMXI) nor the NWS 12 NHC verification protocols normally exclude forecasts in which a cyclone is post-tropical at either the initial or verifying time. Since NHC continued advisories on Hermine for several days after it had become post tropical, and tropical watches and warnings were in effect for the mid-Atlantic and Northeast coasts, all NHC forecasts are being verified regardless of initial or final cyclone status. 13 Historical OCD5 errors are not calculated using non-tropical cyclone stages.

Hurricane Hermine 10
Geophysical Fluid Dynamics Laboratory model (GHMI) was able to beat the official forecasts at any forecast time.
A verification of NHC official intensity forecasts for Hermine is given in Table 6a. OCD5 errors were larger than their respective 5-yr means at all forecast times, indicating that Hermine’s intensity was more difficult to forecast than for a typical tropical cyclone. However, NHC’s official intensity forecasts were quite good, with forecast intensity errors being lower than the mean official errors for the previous 5-yr period at all forecast times. A homogeneous comparison of the official intensity errors with selected guidance models is given in Table 6b. NHC’s short-term intensity forecasts through 48 h were skillful compared to most of the intensity guidance, but their performance was not as good for forecast times between 72 and 120 h. For those longer lead times, a majority of the intensity models had lower errors than the official forecasts. Overall, GHMI had the best statistics, beating the NHC official intensity forecasts at the most forecast times.
Coastal watches and warnings associated with Hermine are given in Table 7. A hurricane watch was first issued for the Big Bend coast of Florida from Anclote River to Indian Pass at 2100 UTC 30 August, and a hurricane warning was issued for a shorter segment of the coast from Suwannee River to Mexico Beach at 0300 UTC 1 September. Since tropical-storm-force winds first reached the coast within the hurricane watch and warning areas around 1800 UTC 1 September, the watch and warning provided lead times of 45 h and 15 h, respectively. Even though the hurricane watch was issued due to the possibility of Hermine becoming a hurricane before it reached land, the NHC official forecast did not explicitly forecast Hermine’s strengthening to a hurricane until 0300 UTC 1 September, which explains the shorter-than-normal lead time for the hurricane warning. Tropical storm watches and warnings were also issued at various times for a majority of the United States East Coast from Marineland, Florida, northward to Sagamore Beach, Massachusetts, including the lower section of Chesapeake Bay. Even though Hermine moved farther offshore than originally forecast during its post-tropical phase, sustained tropical-storm-force winds were still measured along the coasts of all states from Florida to Massachusetts.
Hermine provided the first opportunity for the National Weather Service to issue the Prototype Storm Surge Watch/Warning Graphic, a depiction of areas that would qualify for inclusion under a storm surge watch or warning under development by the National Weather Service. Once operational, the storm surge watch and warning will be issued to delineate areas in which there is a possibility and danger, respectively, of life-threatening inundation of normally dry areas near the coast due to the combination of storm surge and the tides. In the case of Hermine, the possibility of life-threatening inundation within the next 48 h along the Florida coast from Arepika to Indian Pass (the prototype storm surge watch) was first conveyed at 2100 UTC 30 August (Fig. 10a). A danger of life-threatening inundation within the next 36 to 48 h along the coast from Arepika to Indian Pass (the prototype storm surge warning) was first indicated at 1500 UTC 31 August (Fig. 10b). The prototype storm surge warning was extended southward to Longboat Key at 1700 UTC 1 September (Fig. 10c). Storm surge observations indicate that at least 3 ft of inundation (which NHC used as the threshold for the prototype watch/warning) occurred along most of the coast between Tampa Bay and Apalachicola, an area which was closely bookended by the Longboat Key-to-Indian Pass watch/warning delineation. NHC’s explicit storm surge inundation forecasts initially indicated as much as 2 to 4 ft above ground from Arepika to Indian Pass, but the forecasts were increased gradually to a maximum of 6 to 9 ft above ground

Hurricane Hermine 11
from Ochlockonee River to Yankeetown. Based on tide gauge observations and high water mark measurements, the highest inundations were 4 to 7 ft above ground in these areas.
Even though Hermine was forecast to become post-tropical off of the United States East Coast, the storm surge inundation risk for that portion of the coast was also communicated via the Prototype Storm Surge Watch/Warning Graphic. The possibility of life-threatening inundation within the next 48 hours from the North Carolina/Virginia border northward to Bridgeport, Connecticut, was indicated at 1500 UTC 2 September (Fig. 11a). A danger of life-threatening inundation within the next 24 h in the Hampton Roads area of Virginia was then indicated at 2100 UTC 2 September (Fig. 11b), followed by a portion of the coast from Chincoteague, Virginia, northward to Sandy Hook, New Jersey, at 1500 UTC 3 September (Fig. 11c). NOS tide station data indicate that the Prototype Storm Surge Warning for the Hampton Roads area would have verified. However, since Hermine moved farther offshore than initially forecast, only minor coastal flooding occurred from the Delmarva Peninsula northward to Massachusetts, and the Prototype Storm Surge Warning for those areas would not have verified. Elsewhere, inundation levels of at least 3 ft above ground occurred on the sound side of the Outer Banks on the back side of Hermine, but the Prototype Storm Surge Watch/Warning was not depicted for those areas.
ACKNOWLEDGMENTS Data in Table 3 were compiled from Post Tropical Cyclone Reports issued by the NWS Forecast Offices (WFOs) in Tampa Bay/Ruskin, Tallahassee, Jacksonville, Charleston, Wilmington, Newport/Morehead City, Wakefield, Baltimore/Washington, Philadelphia/Mt. Holly, New York, and Taunton. Data from the Weather Prediction Center, National Data Buoy Center, NOS Center for Operational Oceanographic Products and Services, United States Geological Survey, WFO Melbourne, and the Cuban Meteorological Service were also used in this report. The Storm Surge Unit at NHC is thanked for the creation of Figs. 7, 10, and 11 to help analyze the accuracy of the NWS Prototype Storm Surge Watch/Warning graphics, which were issued for the first time in Hurricane Hermine.

Hurricane Hermine 12
Table 1. Best track for Hurricane Hermine, 28 August – 3 September 2016.
Date/Time (UTC)
Latitude (°N)
Longitude (°W)
Pressure (mb)
Wind Speed (kt) Stage
28 / 1800 23.8 81.4 1009 30 tropical depression
29 / 0000 23.4 82.4 1007 30 "
29 / 0600 23.4 83.3 1007 30 "
29 / 1200 23.5 84.0 1007 30 "
29 / 1800 23.7 84.6 1005 30 "
30 / 0000 23.8 85.4 1003 30 "
30 / 0600 23.8 86.2 1003 30 "
30 / 1200 23.9 86.8 1003 30 "
30 / 1800 24.0 87.3 1003 30 "
31 / 0000 24.1 87.8 1003 30 "
31 / 0600 24.4 88.0 1003 35 tropical storm
31 / 1200 24.8 87.9 1003 40 "
31 / 1800 25.1 87.7 1002 45 "
01 / 0000 25.5 87.2 999 50 "
01 / 0600 26.0 86.8 995 55 "
01 / 1200 26.9 86.2 991 60 "
01 / 1800 27.9 85.5 988 65 hurricane
02 / 0000 29.0 84.8 983 70 "
02 / 0530 30.1 84.1 981 70 "
02 / 0600 30.3 84.0 982 65 "
02 / 0800 30.6 83.8 984 60 tropical storm
02 / 1200 31.4 82.8 989 50 "
02 / 1800 32.4 81.2 990 50 "
03 / 0000 33.6 79.2 991 50 "
03 / 0600 34.9 77.2 993 55 "
03 / 1200 35.8 75.5 995 60 extratropical

Hurricane Hermine 13
Date/Time (UTC)
Latitude (°N)
Longitude (°W)
Pressure (mb)
Wind Speed (kt) Stage
03 / 1800 36.0 74.1 997 60 "
04 / 0000 36.3 72.6 998 60 "
04 / 0600 36.7 71.3 998 60 "
04 / 1200 36.9 70.1 998 60 "
04 / 1800 37.0 69.0 998 60 "
05 / 0000 37.2 68.4 997 60 "
05 / 0600 37.8 68.2 996 60 "
05 / 1200 38.6 68.5 995 55 "
05 / 1800 39.2 69.3 995 55 "
06 / 0000 39.5 70.3 995 55 "
06 / 0600 39.6 71.2 996 50 "
06 / 1200 39.5 71.8 997 45 "
06 / 1800 39.5 72.3 998 40 "
07 / 0000 39.2 72.5 1000 35 "
07 / 0600 39.0 72.4 1002 35 "
07 / 1200 39.3 72.3 1004 30 "
07 / 1800 39.5 72.1 1007 30 "
08 / 0000 39.6 71.8 1008 25 "
08 / 0600 39.9 71.3 1009 25 "
08 / 1200 40.6 70.7 1010 25 "
08 / 1800 41.7 70.0 1010 20 "
09 / 0000 dissipated
02 / 0000 29.0 84.8 983 70 maximum winds
02 / 0530 30.1 84.1 981 70 minimum pressure
02 / 0530 30.1 84.1 981 70 landfall just east of St. Marks, Florida

Hurricane Hermine 14
Table 2. Selected ship reports with winds of at least 34 kt for Hurricane Hermine, 28 August – 3 September 2016, while it was a tropical cyclone. Note that many wind observations are taken from anemometers located well above the standard 10 m observation height.
Date/Time (UTC)
Ship call sign
Latitude
(°N)
Longitude
(°W) Wind
dir/speed (kt) Pressure
(mb)
28 / 2300 C6FM8 23.5 81.2 040 / 40 1005.0
30 / 0200 3FFL8 26.2 79.2 260 / 37 1018.4
30 / 0600 C6PZ8 26.2 79.2 150 / 35 1012.0
30 / 1400 3FZO8 21.3 84.6 210 / 35 1005.0
30 / 1500 WDD420 23.2 84.2 090 / 35 1011.5
31 / 0000 C6FN5 22.9 87.4 240 / 35 1009.5
31 / 0900 MGRX2 22.0 85.5 120 / 35 1008.6
31 / 1100 MGRX2 21.6 85.3 100 / 37 1008.6
31 / 1200 WDD420 24.2 87.6 240 / 37 1003.1
31 / 1200 C6FU7 26.0 90.9 020 / 40 1013.0
01 / 0000 WDE443 24.0 86.8 180 / 44 1005.0
02 / 0200 WDC673 31.6 79.6 180 / 36 1013.6
02 / 0500 3FFL8 26.9 79.4 310 / 41 1014.4
02 / 0500 3FOC5 28.9 80.2 160 / 38 1014.0
02 / 0800 C6SD9 29.2 80.1 120 / 37 1010.6
02 / 0900 3FFL8 26.2 78.4 310 / 41 1014.4
02 / 0900 WDC673 29.7 79.6 200 / 36 1011.0
02 / 1100 C6SD9 29.8 79.9 130 / 37 1013.7
02 / 1200 WDC673 28.9 79.6 210 / 40 1012.6
02 / 1500 WDC673 28.2 79.7 200 / 40 1015.0
02 / 1600 C6SD9 28.3 79.6 140 / 37 1014.0
02 / 1800 9V9793 30.9 78.6 200 / 50 1011.5
03 / 0100 H3GR 30.6 80.0 230 / 50 1011.0
03 / 0200 H3GR 30.8 79.9 310 / 35 1012.0
03 / 0300 H3VU 33.8 75.4 170 / 35 1011.0
03 / 0600 KRAU 32.4 76.4 190 / 35 1015.5
Hurricane Hermine 15
Table 3. Selected surface observations for Hurricane Hermine, 28 August – 6 September 2016, during both its tropical and post-tropical stages.
Location
Minimum Sea Level Pressure
Maximum Surface Wind Speed
Storm surge (ft)c
Storm tide (ft)d
Estimated Inundation
(ft)e
Total rain (in) Date/
time (UTC)
Press. (mb)
Date/ time
(UTC)a
Sustained (kt)b
Gust (kt)
Florida International Civil Aviation Organization (ICAO) Sites St. Petersburg-Clearwater Airport (KPIE) (27.91N 82.69W)
1/2122 1007.1 1/2205 37 41 6.98
Sarasota (KSRQ) (27.40N 82.55W) 1/2115 1007.5 2/1209 36 47 10.71
St. Petersburg – Albert Whitted Airport (KSPG) (27.77N 82.63W)
1/2202 1006.7 2/0818 35 55 8.19
Brooksville (KBKV) (28.47N 82.45W) 2/0222 1007.5 2/0815 33 46 8.65
Apalachicola (KAAF) (29.72N 85.03W) 2/0205 994.8 2/0213 33 46 3.40
Tampa International Airport (KTPA) (27.97N 82.53W)
2/0048 1008.1 2/0830 31 40 8.27
Perry-Foley Airport (K40J) (30.07N 83.57W)
2/0450 995.3 2/0415 31I 48 4.00
Jacksonville International Airport (KJAX) (30.49N 81.69)
2/1056 1003.4 2/1550 31 44 2.53
MacDill AFB (KMCF) (27.86N 85.52W) 1/2134 1008.1 2/0836 30 48
Jacksonville Executive/Craig (KCRG) (30.33N 81.52W)
2/0953 1004.6 2/1321 30 40 2.24
Fernandina Beach (KFHB) (30.61N 81.46W)
2/1315 30 40
Punta Gorda (KPGD) (26.92N 81.99W) 1/2129 1010.8 2/0034 30 37 4.47
Ocala (KOCF) (29.18N 82.22W) 2/0815 1006.4 2/0815 29 39
Jacksonville NAS (KNIP) (30.24N 86.68W) 2/0953 1004.3 2/1053 28 45 2.09
Ft. Myers – Southwest Florida Airport (KRSW) (26.54N 81.76W)
1/2102 1010.5 31/2006 28 36 1.49
Cross City (KCTY) (29.62N 83.10W) 2/0455 1001.0 2/0600 27 42 8.76

Hurricane Hermine 16
Location
Minimum Sea Level Pressure
Maximum Surface Wind Speed
Storm surge (ft)c
Storm tide (ft)d
Estimated Inundation
(ft)e
Total rain (in) Date/
time (UTC)
Press. (mb)
Date/ time
(UTC)a
Sustained (kt)b
Gust (kt)
Mayport Naval Station (KNRB) (30.39N 81.42W)
2/1552 1007.1 2/1252 26 44 1.66
Winter Haven (KGIF) (28.05N 81.75W) 2/0029 1009.8 2/1138 26 36 4.31
Ft. Myers – Page Field (KFMY) (26.58N 81.97W)
1/2128 1010.8 2/0014 24 38 3.64
Lake City (KLCQ) (30.18N 82.58W) 2/1155 25 37
Tampa Executive Airport (KVDF) (28.01N 82.34W)
2/0035 1009.1 2/0855 25 36
Gainesville (KGNV) (29.68N 82.27W) 2/0753 1003.7 2/0553 24 44 4.85
St. Augustine (KSGJ) (29.97N 81.33W) 2/0958 1007.0 2/1058 24 40 2.34
Keystone Heights (K42J) (29.85N 82.05W) 2/0755 1004.7 2/1235 24 36
Lakeland (KLAL) (27.99N 82.01W) 1/2255 1009.8 1/2350 23 37
Jacksonville Cecil Field (KVQQ) (30.22N 81.88W)
2/1150 22 35
Plant City (KPCM) (28.00N 82.16W) 1/2315 1009.8 2/1215 17 35
Tallahassee (KTLH) (30.39N 84.35W) 2/0453 990.9I 2/0325 38I 5.48
United States Geological Survey (USGS) High Water Marks Taylor County – Spring Warrior Creek (FLTAY03359) (29.92N 83.67W)
10.33 6.5
Taylor County – Fenholloway River (FLTAY03360) (30.00N 83.78W)
9.80 5.7
Taylor County – Fenholloway River (FLTAY03360) (30.00N 83.78W)
9.65 5.5
Taylor County – Fenholloway River (FLTAY03360) (30.00N 83.78W)
9.64 5.5
Dixie County – Steinhatchee River (FLDIX03354) (29.67N 83.39W)
8.95 5.4

Hurricane Hermine 17
Location
Minimum Sea Level Pressure
Maximum Surface Wind Speed
Storm surge (ft)c
Storm tide (ft)d
Estimated Inundation
(ft)e
Total rain (in) Date/
time (UTC)
Press. (mb)
Date/ time
(UTC)a
Sustained (kt)b
Gust (kt)
Dixie County – Shired Creek (FLDIX03351) (29.40N 83.21W)
8.74 4.4
Dixie County – Shired Creek (FLDIX03351) (29.40N 83.21W)
8.72 4.4
Taylor County – Aucilla River (FLTAY17325) (30.12N 83.98W)
7.93 4.4
Taylor County – Econfina River, Lamont (FLTAY17423) (30.05N 83.91W)
9.01 4.1
Taylor County – Econfina River, Lamont (FLTAY17422) (30.05N 83.91W)
9.08 3.9
Taylor County – Keaton Beach (FLTAY03356) (29.82N 83.59W)
9.31 3.0
Taylor County – Perry (FLTAY17424) (29.88N 83.63W)
9.69 2.5
Wakulla County – St. Marks Lighthouse (FLWAK03363) (30.07N 84.18W)
7.92 1.6
USGS Storm Tide Sensors Taylor County – Fenholloway River (FLTAY03360) (30.00N 83.78W)
9.66
Dixie County – Steinhatchee River (FLDIX03354) (29.67N 83.39W)
8.94
Dixie County – Shired Creek (FLDIX03351) (29.40N 83.21W)
8.47
Taylor County – Aucilla River (FLTAY17325) (30.12N 83.98W)
7.92

Hurricane Hermine 18
Location
Minimum Sea Level Pressure
Maximum Surface Wind Speed
Storm surge (ft)c
Storm tide (ft)d
Estimated Inundation
(ft)e
Total rain (in) Date/
time (UTC)
Press. (mb)
Date/ time
(UTC)a
Sustained (kt)b
Gust (kt)
Wakulla County – Ochlockonee Bay (FLWAK03369) (29.98N 84.38W)
7.57
Coastal-Marine Automated Network (C-MAN) Sites Tyndall AFB Tower C (N4) (SGOF1) (29.41N 84.86W)
2/0100 987.1 2/0140 53 (35 m, 10 min) 69
Keaton Beach (KTNF1) (29.82N 83.59W) 2/0500 995.2 2/0520 45 58
Cedar Key (CDRF1) (29.14N 83.03W) 2/0500 1004.2 2/0320 43 57
St. Augustine (SAUF1) (29.86N 81.27W) 2/0800 1007.3 2/0610 32
(8 m) 40
Venice (VENF1) (27.07N 82.45W) 2/0100 1009.0 2/0000 31 34
National Ocean Service (NOS) Sites Cedar Key (8727520) (29.14N 83.03W) 2/0706 1003.9 2/0306 42
(4 m) 53 7.50 7.64 6.1
Mckay Bay Entrance (8726667) (27.91N 82.43W)
4.09 4.15 3.2
Clearwater Beach (CWBF1) (27.98N 82.83W)
2/0006 1006.4 2/0800 41 (7 m) 54 4.41 3.99 3.0
Old Port Tampa (OPTF1) (27.86N 82.55W)
1/2124 1008.5 2/0824 40 (7 m) 50 3.70 3.0
Apalachicola (APCF1) (29.72N 84.98W) 2/0136 993.9 2/0024 34
(7 m) 43 4.17 3.89 3.0
St. Petersburg (SAPF1) (27.76N 82.63W) 1/2118 1007.7 2/0818 37
(7 m) 56 3.58 3.43 2.6
Port Manatee (PMAF1) (27.64N 82.56W) 1/2124 1007.3 3.21 2.99 2.3
Ft. Myers (FMRF1) (26.65N 81.87W) 1/2112 1010.4 2/1536 26
(7 m) 39 2.22 2.33 2.1
Naples (NPSF1) (26.13N 81.81W) 30/0948 1010.9 2.75 2.27 1.7
Panama City Beach (PCBF1) (30.21N 85.88W)
2/0048 1004.5 1.99 1.7
Pensacola (PCLF1) (30.40N 87.21W) 1/2200 1006.7 1.71 2.62 1.7
Panama City (PACF1) (30.15N 85.67W) 2/0036 1003.4 2.01 2.39 1.6
Fernandina Beach (FRDF1) (30.68N 81.47W)
2/1242 1003.0 2/1048 23 (7 m) 34 1.30 3.88 1.2

Hurricane Hermine 19
Location
Minimum Sea Level Pressure
Maximum Surface Wind Speed
Storm surge (ft)c
Storm tide (ft)d
Estimated Inundation
(ft)e
Total rain (in) Date/
time (UTC)
Press. (mb)
Date/ time
(UTC)a
Sustained (kt)b
Gust (kt)
Trident Pier (TRDF1) (28.42N 80.59W) 2/0718 1011.1 2/1506 31
(7 m) 43 1.34 2.10 1.1
Mayport (Bar Pilots Dock (MYPF1) (30.40N 81.43W)
2/1048 1004.9 2/1648 30 (6 m) 42 0.86 3.02 1.1
I-295 Bridge, St. Johns River (8720357) (30.19N 81.69W)
2/1036 1003.8 2/0712 30 (10 m) 45 1.40 1.15 0.8
Virginia Key (VAKF1) (25.73N 80.16W) 30/0918 1012.2 30/1906 32
(10 m) 39 0.64 0.99 0.8
Middle Tampa Bay (MTBF1) (27.66N 82.59W)
1/2124 1007.8 1/1648 40 (7 m) 51
Jacksonville – Blount Island Command (8720233) (30.39N 81.52W)
2/1106 1003.0 2/1242 30 (9 m) 42
Jacksonville – Navy Fuel Depot (8720215) (30.40N 81.63W)
2/1042 1005.0 2/1312 25 (9 m) 38
University of South Florida Coastal Ocean Monitoring and Prediction System (COMPS) C12 Central Buoy – 50 m Isobath (42022) (27.50N 83.74W)
1/2105 1001.8 1/2035 40 (3 m) 55
Tarpon Springs - Fred Howard Park (FHPF1) (28.15N 82.80W)
2/0036 1005.3 1/2212 34 47
C10 Central Buoy – 25 m Isobath (42013) (27.17N 82.92W)
1/2105 1005.8 1/2235 33 (3 m) 49
C13 South Buoy – 50 m Isobath (42023) (26.01N 83.09W)
1/0935 1006.5 1/2335 29 (3 m) 38
Shell Point (SHPF1) (30.06N 84.29W) 2/0506 983.9 2/0712 27 46
Weatherflow Sites Skyway Fishing Pier – St. Petersburg (XSKY) (27.60N 82.65W)
2/0845 52 (16 m, 1 min) 59
Clam Bayou Nature Park – Gulfport (XCBN) (27.74N 82.70W)
2/0813 46 (10 m, 1 min) 51
Egmont Channel – St. Petersburg (XEGM) (27.61N 82.76W)
2/0816 46 (13 m, 5 min) 56
Apalachee Bay – Alligator Point (XAPB) (29.93N 84.26W)
2/0016 42 (8 m, 1 min) 47

Hurricane Hermine 20
Location
Minimum Sea Level Pressure
Maximum Surface Wind Speed
Storm surge (ft)c
Storm tide (ft)d
Estimated Inundation
(ft)e
Total rain (in) Date/
time (UTC)
Press. (mb)
Date/ time
(UTC)a
Sustained (kt)b
Gust (kt)
Sarasota (XSAR) (27.35N 82.52W) 1/2250 42
(20 m, 1 min) 63
St. George Island – Eastpoint (XSTG) (29.67N 84.86W)
2/0013 42 (15 m, 1 min) 51
Sarasota Bay Marker 17 (XSRB) (27.34N 82.56W)
2/0013 41 (5 m, 1 min) 48
Tampa Bay Cut J – St. Petersburg (XTAM) (27.77N 82.57W)
2/0830 39 (15 m, 5 min) 51
Huguenot Park - Jacksonville (XHUP) (30.42N 81.41W)
2/1543 37 (12 m, 1 min) 46
Boca Grande (XBCG) (26.72N 82.26W) 2/0032 37
(10 m, 1 min) 42
Smith Shoal Light – Key West (XSMS) (24.72N 81.92W)
1/1839 36 (19 m, 1 min) 40
Jacksonville (XJAK) (30.39N 81.48W) 2/1312 36
(10 m, 1 min) 45
Jacksonville Beach Pier (XJAX) (30.29N 81.39W)
2/0724 35 (12 m, 5 min) 47
Belleair - Largo (XBLA) (27.94N 82.80W) 1/2158 35
(21 m, 1 min) 49
Charlotte Harbor Yacht Club – Punta Gorda (XCHL) (26.96N 82.08W)
2/0038 34 (10 m, 1 min) 41
Dunedin Causeway (XDUN) (28.06N 82.81W)
2/0815 34 (6 m, 5 min) 43
Reedy Lake – Horizon West (XRDY) (28.44N 81.63W)
2/0035 34 (15 m, 1 min) 41
Banana River – 520 – Merritt Island (XCCB) (28.36N 80.65W)
2/1458 34 (5 m, 1 min) 40
Miscellaneous Sites Bald Point / Alligator Point (KFLALLIG2) (29.92N 84.34W)
2/0400 984.4 2/0150 53 68
Tallahassee / FSU WeatherSTEM (KFLTALLA77) (30.44N 84.30W)
2/0519 987.1 2/0500 41 (40 m) 56

Hurricane Hermine 21
Location
Minimum Sea Level Pressure
Maximum Surface Wind Speed
Storm surge (ft)c
Storm tide (ft)d
Estimated Inundation
(ft)e
Total rain (in) Date/
time (UTC)
Press. (mb)
Date/ time
(UTC)a
Sustained (kt)b
Gust (kt)
Community Collaborative Rain, Hail and Snow Network (CoCoRaHS) Sites Seminole 3.2 WNW (Pinellas Co.) (FL-PN-64) (27.86N 82.83W)
18.23
Port Richey 2.0 NNE (Pasco Co.) (FL-PS-4) (28.30N 82.71W)
15.40
Englewood 5.4 ESE (Charlotte Co.) (FL-CH-18) (26.94N 82.27W)
10.78
Palmetto 1.2 W (Manatee Co.) (FL-MA-3) (27.52N 82.60W)
10.40
Avon Park 0.6 NW (Highlands Co.) (FL-HL-10) (27.60N 81.51W)
10.20
Lakeland 8.7 SW (Polk Co.) (FL-PK-37) (27.95N 82.04W)
8.89
Tampa 5.1 S (Hillsborough Co.) (FL-HB-10) (27.87N 82.49W)
8.80
Clermont 0.4 SW (Lake Co.) (FL-LK-10) (28.55N 81.76W)
8.58
Sarasota 1.4 E (Sarasota Co.) (FL-SS-47) (27.34N 82.52W)
8.27
Brooksville 5.5 SE (Hernando Co.) (FL-HN-5) (28.51N 82.32W)
8.25
Palm Bay 3.1 NNW (Brevard Co.) (FL-BV-5) (28.02N 80.69W)
8.12
Captiva 1.2 SSW (Lee Co.) (FL-LE-15) (26.50N 82.19W)
7.97

Hurricane Hermine 22
Location
Minimum Sea Level Pressure
Maximum Surface Wind Speed
Storm surge (ft)c
Storm tide (ft)d
Estimated Inundation
(ft)e
Total rain (in) Date/
time (UTC)
Press. (mb)
Date/ time
(UTC)a
Sustained (kt)b
Gust (kt)
Tallahassee 6.2 E (Leon Co.) (FL-LN-60) (30.46N 84.18W)
7.92
Bronson 3.0 SE (Levy Co.) (FL-LV-4) (29.42N 82.60W)
7.78
Cross City 4.7 E (Dixie Co.) (FL-DX-2) (29.64N 83.05W)
7.30
Winter Garden 6.1 SW (Orange Co.) (FL-OR-20) (28.50N 81.65W)
6.77
Tamarac 2.2 W (Broward Co.) (FL-BW-87) (26.21N 80.29W)
6.72
Bushnell 1.0 NNW (Sumter Co.) (FL-ST-21) (28.68N 82.12W)
6.54
Crawfordville 7.3 SSE (Wakulla Co.) (FL-WK-7) (30.08N 84.33W)
6.51
Lamont 7.7 SW (Jefferson Co.) (FL-JF-7) (30.29N 83.90W)
6.46
Ocala 14.3 S (Marion Co.) (FL-MR-36) (28.98N 82.17W)
6.18
Interlachen 1.3 SW (Putnam Co.) (FL-PT-10) (29.60N 81.91W)
6.10
Jacksonville 10.3 SW (Duval Co.) (FL-DV-42) (30.24N 81.79W)
5.81
Glen St. Mary 1.7 N (Baker Co.) (FL-BK-6) (30.30N 82.16W)
5.78

Hurricane Hermine 23
Location
Minimum Sea Level Pressure
Maximum Surface Wind Speed
Storm surge (ft)c
Storm tide (ft)d
Estimated Inundation
(ft)e
Total rain (in) Date/
time (UTC)
Press. (mb)
Date/ time
(UTC)a
Sustained (kt)b
Gust (kt)
Trenton 4.0 NW (Gilchrist Co.) (FL-GC-8) (29.66N 82.86W)
5.70
Madison 1.2 ENE (Madison Co.) (FL-MS-3) (30.47N 83.40W)
5.65
Gainesville 7.7 W (Alachua Co.) (FL-AL-55) (29.66N 82.46W)
5.60
Crystal River 4.7 ESE (Citrus Co.) (FL-CT-8) (28.87N 82.53W)
5.46
Naples 8.7 SE (Collier Co.) (FL-CR-38) (26.05N 81.70W)
5.44
Fort Pierce 3.4 NNE (St. Lucie Co.) (FL-SL-15) (27.49N 80.30W)
5.37
Fort White 3.2 WNW (Columbia Co.) (FL-CB-15) (29.94N 82.76W)
5.25
Hydrometeorological Automated Data System (HADS) Sites (NWS) Dunedin (CCKF1) (28.02N 82.74W) 13.59
Pinellas Park 2 NE (RRCF1) (27.87N 82.69W)
12.42
Oldsmar 2 NW (TBFF1) (28.05N 82.71W)
11.92
Dunedin (CRCF1) (28.05N 82.76W) 10.54
Pinellas Park (PNBF1) (27.87N 82.74W) 10.50
Oldsmar (OLDF1) (28.05N 82.63W) 9.95
Tampa (NACF1) (27.90N 82.35W) 9.26
Bradenton (LWDF1) (27.44N 82.49W) 8.76
Lithia (LITF1) (27.87N 82.21W) 8.57

Hurricane Hermine 24
Location
Minimum Sea Level Pressure
Maximum Surface Wind Speed
Storm surge (ft)c
Storm tide (ft)d
Estimated Inundation
(ft)e
Total rain (in) Date/
time (UTC)
Press. (mb)
Date/ time
(UTC)a
Sustained (kt)b
Gust (kt)
Chiefland 13 SW (SWNF1) (29.37N 83.03W)
8.37
Tampa (DLNF1) (27.93N 82.36W) 7.93
Wimauma 4 SW (WIMF1) (27.67N 82.35W)
6.97
Gulf Hammock 4 SW (GULF1) (29.20N 82.77W)
6.36
North Port 6 NNE (NPOF1) (27.12N 82.19W)
6.31
North Port (NPRF1) (27.05N 82.24W) 6.29
Bradenton 22 E (MKHF1) (27.47N 82.21W)
6.23
Fruitville 10 SE (MKCF1) (27.24N 82.32W)
6.13
Fruitville 7 NE (FRUF1) (27.42N 82.42W) 5.88
Bartow (BARF1) (27.90N 81.84W) 5.37
Tampa (TMTF1) (28.02N 82.43W) 5.23
Advanced Hydrologic Prediction Service Sites (AHPS) Thonotosassa (MORF1) (28.10N 82.31W)
5.56
NWS Cooperative Observer Program (COOP) Sites Marco (MCIF1) (25.95N 81.71W) 6.13
Palm Bay 1 W (PLBF1) (27.95N 80.64W) 5.84
Clermont 7 S (CLRF1) (28.45N 81.75W) 5.45
Macclenny 4 W (GSMF1) (30.27N 82.19W)
5.43
Kissimmee Lake 20 ENE (KISF1) (27.80N 81.20W)
5.26
Tallahassee 5 WSW (TASF1) (30.40N 84.36W)
5.07

Hurricane Hermine 25
Location
Minimum Sea Level Pressure
Maximum Surface Wind Speed
Storm surge (ft)c
Storm tide (ft)d
Estimated Inundation
(ft)e
Total rain (in) Date/
time (UTC)
Press. (mb)
Date/ time
(UTC)a
Sustained (kt)b
Gust (kt)
Other Sites Tarpon Springs 3 ESE (28.12N 82.72W) 22.36
Baskin 1 SSE (27.87N 82.81W) 20.11
Largo (27.90N 82.78W) 16.11
Georgia ICAO Sites Valdosta (KVLD) (30.79N 83.28W) 2/0907 989.2 2/0829 36I 49 5.57
Waycross (KAYS) (31.25N 82.40W) 2/1235 36 49
St. Simons Island (KSSI) (31.15N 81.38W)
2/1356 1002.0 2/1553 35 49 3.56
Savannah International Airport (KSAV) (32.13N 81.20W)
2/1753 996.0 2/2049 34 48 3.51
Savannah – Hunter Army Air Field (KSVN) (32.01N 81.13W)
2/1658 996.0 2/2015 30 43 4.33
Brunswick/Glynn County (KBQK) (31.15N 81.47W)
2/1515 29 44
Valdosta – Moody AFB (KVAD) (30.97N 83.20W)
2/1014 987.8 2/0850 29 43 5.49
Alma/Bacon County (KAMG) (31.54N 82.50W)
2/1253 990.5 2/1247 28 39 6.43
Homerville (KHOE) (31.06N 82.77W) 2/1115 27 44
Moultrie (KMGR) (31.08N 83.80W) 2/0911 992.2 2/0951 26 41
Jessup (KJES) (31.55N 81.88W) 2/1435 26 39
Tifton (KTMA) (31.43N 83.49W) 2/1115 993.6 2/1155 26 37
Fort Stewart (KLHW) (31.89N 81.56W) 2/1558 996.0 2/1555 24 38 4.64
Statesboro (KTBR) (32.49N 81.74W) 2/1615 997.0 2/1915 21 36

Hurricane Hermine 26
Location
Minimum Sea Level Pressure
Maximum Surface Wind Speed
Storm surge (ft)c
Storm tide (ft)d
Estimated Inundation
(ft)e
Total rain (in) Date/
time (UTC)
Press. (mb)
Date/ time
(UTC)a
Sustained (kt)b
Gust (kt)
NOS Sites Fort Pulaski (FPKG1) (32.04N 80.90W) 2/1748 997.9 2/2100 35
(7 m) 53 1.64 4.76 1.3
Weatherflow Sites Tybee Island (South) (XTYE) (31.99N 80.85W) 2/1712 47
(9 m, 1 min) 55
Jekyll Island (XJEK) (31.05N 81.41W) 2/1005 47
(10 m, 1 min) 53
Tybee Island (XTYB) (32.02N 80.84W) 2/1723 35
(10 m, 1 min) 47
CoCoRaHS Sites Valdosta 4.8 NNE (Lowndes Co.) (GA-LW-18) (30.91N 83.25W)
7.64
Darien 4.2 NNE (McIntosh Co.) (GA-MI-3) (31.42N 81.40W)
7.18
Savannah 8.2 SSE (Chatham Co.) (GA-CT-40) (31.92N 81.08W)
6.76
Fitzgerald 4.3 N (Ben Hill Co.) (GA-BH-2) (31.77N 83.26W)
6.24
Tifton 5.5 E (Tift Co.) (GA-TF-6) (31.46N 83.42W)
6.12
Metter 7.0 N (Candler Co.) (GA-CD-2) (32.50N 82.05W)
5.73
Jesup 7.1 N (Wayne Co.) (GA-WY-2) (31.70N 81.90W)
5.61
Garfield 2.7 N (Emanuel Co.) (GA-EM-3) (32.69N 82.10W)
5.52
Moultrie 6.8 E (Colquitt Co.) (GA-CQ-9) (31.16N 83.66W)
5.50

Hurricane Hermine 27
Location
Minimum Sea Level Pressure
Maximum Surface Wind Speed
Storm surge (ft)c
Storm tide (ft)d
Estimated Inundation
(ft)e
Total rain (in) Date/
time (UTC)
Press. (mb)
Date/ time
(UTC)a
Sustained (kt)b
Gust (kt)
Newington 0.5 SSE (Screven Co.) (GA-SV-5) (32.58N 81.50W)
5.30
Pridgen 1.5 NE (Coffee Co.) (GA-CF-3) (31.72N 82.94W)
5.26
Boston 3.4 NNW (Thomas Co.) (GA-TH-5) (30.84N 83.80W)
5.08
Statesboro 4.4 N (Bulloch Co.) (GA-BU-13) (32.51N 81.78W)
5.07
HADS Sites Millhaven 9 ENE (BFYG1) (32.93N 81.50W)
7.18
Sylvania 13 WSW (RFDG1) (32.65N 81.84W)
6.09
Hilltonia 4 N (BRIG1) (32.93N 81.65W) 5.96
Darien 7 NNE (MERG1) (31.45N 81.37W)
5.78
Adel 7 W (ADLG1) (31.16N 83.54W) 5.71
Thomasville 5 WNW (TMLG1) (30.88N 84.05W)
5.37
Remote Automated Weather Stations (RAWS) Adel 2 S (AELG1) (31.11N 83.43W) 5.97
Baxley 5 SW (BXYG1) (31.71N 82.39W) 5.87
Waycross (OKEG1) (31.24N 82.40W) 2/0724 27I
(41 m, 2 min) 55
Okefenokee NWR West (TT331) (30.97N 82.40W)
2/0610 24I (38 m, 2 min) 44
Baxley (BXTG1) (31.71N 82.39W) 2/1304 24I
(59 m, 2 min) 38

Hurricane Hermine 28
Location
Minimum Sea Level Pressure
Maximum Surface Wind Speed
Storm surge (ft)c
Storm tide (ft)d
Estimated Inundation
(ft)e
Total rain (in) Date/
time (UTC)
Press. (mb)
Date/ time
(UTC)a
Sustained (kt)b
Gust (kt)
Jones Island Okefenokee NWR (JONG1) (30.82N 82.36W)
2/0801 23I (35 m, 2 min) 46
Sterling 3 SW (STRG1) (31.21N 81.61W) 2/1004 16I
(4 m, 2 min) 37 5.67
NWS COOP Sites Pridgen (PRDG1) (31.70N 82.92W) 5.44
South Carolina
ICAO Sites North Myrtle Beach (KCRE) (33.81N 78.72W)
3/0112 998.3 2/2119 38 48 8.44
Charleston (KCHS) (32.90N 80.04W) 2/2156 996.0 3/0050 34 46 2.39
Charleston Executive Airport (KJZI) (32.70N 80.01W)
2/2115 997.0 2/1835 34 42
Beaufort County Airport (KARW) (32.41N 80.63W)
2/1755 998.0 2/1755 30 42
Hilton Head (KHXD) (32.23N 80.69W) 2/1850 998.0 2/1750 29 48
Mt. Pleasant (KLRO) (32.90N 79.78W) 2/2215 997.0 2/1915 27 42
Marion County Airport (KMAO) (34.18N 79.33W)
2/2215 26 44
Florence (KFLO) (34.19N 79.72W) 2/2346 1003.0 2/2053 26 42 5.21
Hartsville (KHVS) (34.40N 80.12W) 2/2035 1006.1 2/2215 25 43
Beaufort MCAS (KNBC) (32.49N 80.70W)
3/1856 996.0 2/1626 25 39 5.15
Conway (KHYW) (33.83N 79.12W) 3/0015 998.0 2/2035 25 38
Myrtle Beach (KMYR) (33.69N 78.93W) 3/0045 998.6 2/2050 24 34 5.16
Allendale County Airport (KAQX) (32.99N 81.27W)
2/1815 998.0 2/2015 20 34
Georgetown (KGGE) (33.31N 79.32W) 2/2355 996.9 2/1955 17 37

Hurricane Hermine 29
Location
Minimum Sea Level Pressure
Maximum Surface Wind Speed
Storm surge (ft)c
Storm tide (ft)d
Estimated Inundation
(ft)e
Total rain (in) Date/
time (UTC)
Press. (mb)
Date/ time
(UTC)a
Sustained (kt)b
Gust (kt)
Sumter (KSSC) (33.97N 80.47W) 6.36
Orangeburg (KOGB) (33.46N 80.86W) 5.91
C-MAN Sites Folly Island (FBIS1) (32.68N 79.89W) 2/2200 997.4 2/1850 40 51
NOS Sites Springmaid Pier (MROS1) (33.66N 78.92W)
3/0100 997.2 2/2148 39 (7 m) 51 2.10 3.59 1.1
Charleston (CHTS1) (32.78N 79.92W) 2/2148 996.8 2/1730 32
(9 m) 42 2.51 3.76 1.1
Oyster Landing (N Inlet Estuary) (8662245) (33.35N 79.19W)
2.01 3.40 1.0
Coastal Ocean Research and Monitoring Program (CORMP) Sites Fripp Nearshore – FRP2 (41033) (32.28N 80.41W)
2/1908 995.0 2/1708 36 (3 m) 56
Capers Nearshore – CAP2 (41029) (32.80N 79.62W)
2/2308 993.0 2/1908 35 (3 m) 50
Weatherflow Sites Georgetown - Winyah Bay Range Rear Light (XWIN) (33.19N 79.18W)
2/2007 53 (15 m, 1 min) 58
Charleston – Sullivan’s Island 28.5 (XSUL) (32.77N 79.82W)
2/1924 48 (13 m, 1 min) 55
Murrells Inlet (XMUR) (33.52N 79.03W) 2/2119 43
(7 m, 1 min) 49 Folly Beach Pier (XFOL) (32.65N 79.94W) 2/2011 43
(13 m, 5 min) 52 Charleston – Ft. Sumter Range Front Light (XSUM) (32.75N 79.87W)
2/2011 42 (12 m, 5 min) 54
Saint Helena Island - Beaufort (XBUF) (32.34N 80.59W)
2/1817 41 (10 m, 1 min) 49
Isle of Palms Pier (XIOP) (32.78N 79.79W)
2/2025 40 (9 m, 5 min) 51
Charleston (XCHA) (32.76N 79.95W) 3/0058 38
(10 m, 1 min) 49

Hurricane Hermine 30
Location
Minimum Sea Level Pressure
Maximum Surface Wind Speed
Storm surge (ft)c
Storm tide (ft)d
Estimated Inundation
(ft)e
Total rain (in) Date/
time (UTC)
Press. (mb)
Date/ time
(UTC)a
Sustained (kt)b
Gust (kt)
CoCoRaHS Sites Georgetown 6.0 S (Georgetown Co.) (SC-GT-4) (33.28N 79.29W)
14.17
Myrtle Beach 8.6 SW (Horry Co.) (SC-HR-10) (33.62N 79.01W)
11.60
Oakland 1.5 NE (Sumter Co.) (SC-SM-14) (34.00N 80.48W)
11.07
Branchville 8.3 SW (Bamberg Co.) (SC-BM-5) (33.16N 80.91W)
10.53
Neeses 7.0 SE (Orangeburg Co.) (SC-OR-11) (33.47N 81.04W)
8.71
Lodge 3.4 SW (Colleton Co.) (SC-CL-9) (33.03N 80.99W)
8.58
Summerton 8.4 SE (Clarendon Co.) (SC-CD-1) (33.53N 80.24W)
8.43
Hampton 0.8 SW (Hampton Co.) (SC-HM-7) (32.86N 81.12W)
7.38
Kingstree 7.9 NW (Williamsburg Co.) (SC-WL-2) (33.74N 79.93W)
7.33
Aiken 2.5 S (Aiken Co.) (SC-AK-41) (33.50N 81.73W)
7.02
Swansea 5.8 ENE (Lexington Co.) (SC-LX-81) (33.76N 81.01W)
6.88
Allendale 1.7 SE (Allendale Co.) (SC-AL-2) (32.99N 81.29W)
6.81

Hurricane Hermine 31
Location
Minimum Sea Level Pressure
Maximum Surface Wind Speed
Storm surge (ft)c
Storm tide (ft)d
Estimated Inundation
(ft)e
Total rain (in) Date/
time (UTC)
Press. (mb)
Date/ time
(UTC)a
Sustained (kt)b
Gust (kt)
Coward 5.1 NNW (Florence Co.) (SC-FL-12) (34.04N 79.79W)
6.61
Hopkins 3.9 NNE (Richland Co.) (SC-RC-30) (33.96N 80.86W)
6.39
St. Matthews 3.2 ENE (Calhoun Co.) (SC-CA-1) (33.69N 80.73W)
6.32
Reevesville 1.0 SSE (Dorchester Co.) (SC-DC-18) (33.19N 80.64W)
5.91
Bluffton 2.3 NNE (Beaufort Co.) (SC-BF-4) (32.27N 80.85W)
5.78
Prosperity 4.7 ENE (Newberry Co.) (SC-NW-12) (34.24N 81.46W)
5.50
Darlington 7.3 SSW (Darlington Co.) (SC-DR-4) (34.20N 79.91W)
5.41
Elgin 1.9 NE (Kershaw Co.) (SC-KR-16) (34.19N 80.77W)
5.31
Pineville 0.3 SSE (Berkeley Co.) (SC-BK-29) (33.42N 80.03W)
5.10
HADS Sites Galivants Ferry (GALS1) (34.06N 79.25W)
6.38
Kingstree 1 SE (KINS1) (33.65N 79.82W)
5.99
Columbia 10 WNW (MURS1) (34.05N 81.21W)
5.88
McBee 3 NE (MBES1) (34.51N 80.22W) 5.82

Hurricane Hermine 32
Location
Minimum Sea Level Pressure
Maximum Surface Wind Speed
Storm surge (ft)c
Storm tide (ft)d
Estimated Inundation
(ft)e
Total rain (in) Date/
time (UTC)
Press. (mb)
Date/ time
(UTC)a
Sustained (kt)b
Gust (kt)
NWS COOP Sites Bamberg (BAMS1) (33.30N 81.03W) 10.13
Blackville 3 W (BLVS1) (33.36N 81.33W) 7.86
Myrtle Beach (MYBS1) (33.73N 78.84W) 7.65
Springfield (SPRS1) (33.49N 81.28W) 7.45
Cades 4 W (CADS1) (33.82N 79.85W) 6.53
Batesburg (BATS1) (33.90N 81.54W) 6.18
Darlington (DLGS1) (34.30N 79.88W) 5.65
Mullins (MULS1) (34.19N 79.25W) 5.57
Chesterfield (CTFS1) (34.73N 80.04W) 5.37
Jefferson 7 E (JEFS1) (34.66N 80.27W) 5.01
North Carolina
ICAO Sites Dare County Gunnery Range (K2DP) (35.67N 75.90W)
3/0956 995.6 3/1525 47 64
Hatteras – Billy Mitchell Field (KHSE) (35.22N 75.62W)
3/0851 997.4 3/0526 41 49 6.12
Elizabeth City (KECG) (36.26N 76.17W) 3/0954 1001.9 3/1256 40 54 6.25
Manteo (KMQI) (35.90N 75.70W) 3/1200 996.6 3/1600 40 51
Cherry Point MCAS (KNKT) (34.90N 76.90W)
3/0654 997.9 3/0143 29 35 5.83
Kill Devil Hills – First Flight Airport (KFFA) (36.02N 75.67W)
3/1220 996.3 3/0900 28 45
Currituck County Airport (KONX) (36.40N 76.02W)
3/0940 1002.1 3/0940 28 40
Lumberton (KLBT) (34.60N 79.06W) 3/0028 1004.4 3/0054 25 40 5.07
Greenville (KPGV) (35.64N 77.38W) 3/0830 1003.4 3/0850 24 37

Hurricane Hermine 33
Location
Minimum Sea Level Pressure
Maximum Surface Wind Speed
Storm surge (ft)c
Storm tide (ft)d
Estimated Inundation
(ft)e
Total rain (in) Date/
time (UTC)
Press. (mb)
Date/ time
(UTC)a
Sustained (kt)b
Gust (kt)
Kinston (KISO) (35.33N 77.62W) 3/0720 997.9 3/0340 24 36
Edenton (KEDE) (36.03N 76.57W) 3/0940 1002.0 3/1040 23 35
New River MCAS (KNCA) (34.71N 77.44W)
3/0556 999.3 2/2356 22 38 6.17
Washington (KOCW) (35.57N 77.05W) 3/0820 999.3 3/1120 22 38
Wilmington (KILM) (34.27N 77.90W) 7.86
Beaufort (KMRH) (34.73N 76.66W) 6.35
C-MAN Sites Cape Lookout (CLKN7) (34.62N 76.53W) 3/0700 996.9 3/0500 31 40
NOS Sites USCG Hatteras (HCGN7) (35.21N 75.70W)
3/0842 996.8 3/1642 49 (8 m) 62 4.02 4.59 4.4
Duck (DUKN7) (36.18N 75.75W) 3/1300 995.8 3/1454 62
(9 m) 73 3.30 4.18 2.7
Oregon Inlet Marina (ORIN7) (35.80N 75.55W)
3/1036 996.2 3/1712 41 (7 m) 54 2.24 2.77 2.3
Beaufort (BFTN7) (34.72N 76.67W) 3/0636 996.2 3/0212 26
(7 m) 36 1.84 3.04 1.6
Wrightsville Beach (JMPN7) (34.21N 77.79W)
3/0418 997.7 2/2200 35 (8 m) 50 2.24 3.17 1.4
Wilmington (WLON7) (34.23N 77.95W) 3/0412 998.8 2.55 1.4
Coastal Ocean Research and Monitoring Program (CORMP) Sites Sunset Nearshore – SUN2 (41024) (33.84N 78.48W)
3/0208 997.8 2/1408 37 (3 m) 49
Wrightsville Beach Offshore – ILM3 (41037) (33.99N 77.36W)
3/0508 998.3 3/0108 16 (3 m) 49
Weatherflow Sites Alligator River Bridge (XALI) (35.90N 76.01W) 3/1446 60
(12 m, 1 min) 70 Nags Head – Jennettes Pier (XJNP) (35.91N 75.59W)
3/1705 58 (18 m, 5 min) 71

Hurricane Hermine 34
Location
Minimum Sea Level Pressure
Maximum Surface Wind Speed
Storm surge (ft)c
Storm tide (ft)d
Estimated Inundation
(ft)e
Total rain (in) Date/
time (UTC)
Press. (mb)
Date/ time
(UTC)a
Sustained (kt)b
Gust (kt)
Engelhard – Pamlico Sound (XPM2) (35.43N 75.83W)
3/1712 57 (13 m, 1 min) 65
Nags Head – Oregon Inlet Coast Guard (XORE) (35.77N 75.53W)
3/1656 50 (10 m, 5 min) 60
Frisco Woods (XFRI) (35.25N 75.63W) 3/1721 48
(6 m, 1 min) 59 Nags Head – Oregon Inlet (XORI) (35.80N 75.55W)
3/1758 48 (10 m, 1 min) 57
Avon Sound (XAVN) (35.37N 75.51W) 3/2000 47
(5 m, 1 min) 57 Waves – REAL Slick (XSLK) (35.57N 75.49W) 3/1920 45
(6 m, 5 min) 56 Ocracoke (XOCR) (35.14N 76.01W) 3/1525 45
(8 m, 5 min) 56 Buxton (XBUX) (35.26N 75.52W) 3/0531 44
(10 m, 1 min) 55 Rodanthe – KHK Resort (XRTH) (35.58N 75.47W)
3/1820 42 (16 m, 5 min) 53
Kure Beach – Federal Point (XFED) (33.96N 77.94W)
2/2341 41 (15 m, 1 min) 49
Waves (XWAV) (35.57N 75.47W) 3/1826 40
(11 m, 5 min) 49 Oak Island (XOKI) (33.91N 78.12W) 2/2247 38
(10 m, 1 min) 42 Avon Ocean (XAVO) (35.35N 75.50W) 3/1958 37
(12 m, 5 min) 48 Nags Head – Jockey’s Ridge (XNAG) (35.95N 75.63W)
3/1604 36 (5 m, 5 min) 49
Atlantic Beach – Fort Macon (XMAC) (34.70N 76.69W)
3/0251 34 (10 m, 1 min) 41
CoCoRaHS Sites Hampstead 2.3 ENE (Pender Co.) (NC-PD-26) (34.38N 77.67W)
10.05
Southport 0.9 NE (Brunswick Co.) (NC-BR-53) (33.93N 78.01W)
9.89

Hurricane Hermine 35
Location
Minimum Sea Level Pressure
Maximum Surface Wind Speed
Storm surge (ft)c
Storm tide (ft)d
Estimated Inundation
(ft)e
Total rain (in) Date/
time (UTC)
Press. (mb)
Date/ time
(UTC)a
Sustained (kt)b
Gust (kt)
Jamesville 1.5 SSE (Martin Co.) (NC-MT-2) (35.79N 76.89W)
8.98
Havelock 8.2 ESE (Craven Co.) (NC-CN-76) (34.87N 76.76W)
8.95
Harkers Island 3.2 NE (Carteret Co.) (NC-CR-20) (34.73N 76.52W)
8.66
Wilmington 4.1 SE (New Hanover Co.) (NC-NH-16) (34.17N 77.86W)
8.39
Whiteville 6.1 NW (Columbus Co.) (NC-CL-25) (34.38N 78.79W)
8.25
Elizabethtown 6.2 NW (Bladen Co.) (NC-BD-2) (34.68N 78.69W)
8.06
Roper 2.4 NE (Washington Co.) (NC-WS-3) (35.90N 76.58W)
7.83
Manteo 1.0 WNW (Dare Co.) (NC-DR-33) (35.91N 75.68W)
7.74
Gurganus 0.5 N (Onslow Co.) (NC-ON-70) (34.76N 77.65W)
7.73
Wallace 3.7 E (Duplin Co.) (NC-DP-22) (34.74N 77.93W)
7.44
Greenville 4.7 WNW (Pitt Co.) (NC-PT-25) (35.63N 77.45W)
7.27
Lowland 0.2 SE (Pamlico Co.) (NC-PM-21) (35.30N 76.56W)
7.21

Hurricane Hermine 36
Location
Minimum Sea Level Pressure
Maximum Surface Wind Speed
Storm surge (ft)c
Storm tide (ft)d
Estimated Inundation
(ft)e
Total rain (in) Date/
time (UTC)
Press. (mb)
Date/ time
(UTC)a
Sustained (kt)b
Gust (kt)
Hertford 7.7 SSE (Perquimans Co.) (NC-PR-12) (36.09N 76.40W)
7.10
Kinston 1.3 NNW (Lenoir Co.) (NC-LR-26) (35.29N 77.60W)
7.00
Edenton 0.9 N (Chowan Co.) (NC-CW-15) (36.07N 76.60W)
6.85
Blounts Creek 4.0 N (Beaufort Co.) (NC-BF-14) (35.41N 76.95W)
6.72
Trenton 4.6 W (Jones Co.) (NC-JN-6) (35.06N 77.44W)
6.11
Hope Mills 4.8 SE (Cumberland Co.) (NC-CM-13) (34.93N 78.89W)
5.96
Lumberton 2.3 NE (Robeson Co.) (NC-RB-9) (34.66N 78.99W)
5.70
Ocracoke 0.7 SSW (Hyde Co.) (NC-HD-11) (35.11N 75.99W)
5.53
Mount Olive 0.4 NW (Wayne Co.) (NC-WY-21) (35.20N 78.07W)
5.51
Snow Hill 3.1 NNE (Greene Co.) (NC-GN-7) (35.50N 77.66W)
5.42
Harrells 0.7 SE (Sampson Co.) (NC-SM-11) (34.72N 78.19W)
5.19
Elizabeth City 2.6 W (Pasquotank Co.) (NC-PS-1) (36.30N 76.27W)
5.15

Hurricane Hermine 37
Location
Minimum Sea Level Pressure
Maximum Surface Wind Speed
Storm surge (ft)c
Storm tide (ft)d
Estimated Inundation
(ft)e
Total rain (in) Date/
time (UTC)
Press. (mb)
Date/ time
(UTC)a
Sustained (kt)b
Gust (kt)
Kenly 6.6 NW (Johnston Co.) (NC-JH-9) (35.66N 78.21W)
5.07
HADS Sites Greenville (PGVN7) (35.62N 77.38W) 6.45
Kelly 5 SE (CPFN7) (34.40N 78.29W) 5.59
Pinetops 3 ENE (TOWN7) (35.80N 77.59W)
5.54
NWS COOP Sites Wilmington 7 N (WIMN7) (34.32N 77.92W)
9.30
Kure Beach 3 W (SUNN7) (34.00N 77.96W)
9.02
Whiteville 1 W (WHIN7) (34.34N 78.73W) 8.88
Columbia 17 SSE (CBAN7) (35.73N 76.13W)
8.35
Shallotte 10 WNW (LNGN7) (34.01N 78.55W)
7.14
Burgaw 11 E (BKIN7) (34.53N 77.72W) 6.99
New Bern (PYTN7) (35.06N 77.09W) 6.48
Jacksonville 3 NE (JEON7) (34.80N 77.40W)
6.00
Kinston 6 SE (KNNN7) (35.20N 77.54W) 5.82
Shallotte 7 NE (NATN7) (34.05N 78.29W)
5.76
Elizabethtown 1 E (ELZN7) (34.63N 78.58W)
5.68
Lumberton (LBRN7) (34.63N 79.02W) 5.00
Florida Coastal Monitoring Program Sites Buxton – Hatteras High (WF73823) (35.26N 75.55W)
3/1715 55 (20 m, 5 min) 66

Hurricane Hermine 38
Location
Minimum Sea Level Pressure
Maximum Surface Wind Speed
Storm surge (ft)c
Storm tide (ft)d
Estimated Inundation
(ft)e
Total rain (in) Date/
time (UTC)
Press. (mb)
Date/ time
(UTC)a
Sustained (kt)b
Gust (kt)
Stumpy Point Tower (WF84816) (35.71N 75.77W)
3/1904 40 (47 m, 1 min) 61
Virginia ICAO Sites Norfolk International Airport (KORF) (36.91N 76.20W)
3/0951 1006.7 3/1223 39 48 3.24
Wallops Island (KWAL) (37.97N 75.47W) 3/1105 1012.1 3/1448 35 47 0.74
Virginia Beach – Oceana NAS (KNTU) (36.83N 76.03W)
3/0956 1006.4 3/1256 31 50 4.26
Langley AFB (KLFI) (37.09N 76.35W) 3/1158 1009.1 3/1258 31 44
Norfolk NAS (KNGU) (36.96N 76.29W) 3/0959 1008.0 3/1050 29 45 3.32
Accomack Airport (KMFV) (37.65N 75.77W)
3/1035 1010.9 3/1355 28 36
Newport News (KPHF) (37.14N 76.50W) 3/1154 1009.5 3/1230 25 39 1.34
Suffolk (KSFQ) (36.68N 76.62W) 3/1153 1007.5 3/0935 25 37
Hampton Roads Executive (KPVG) (36.78N 76.45W)
3/1320 22 36
Fentress (KNFE) (36.70N 76.13W) 2.65
NOS Sites Money Point (MNPV2) (36.78N 76.30W) 3/1000 1006.4 3/1406 21
(6 m) 36 3.91 3.5
Sewells Point (SWPV2) (36.94N 76.33W) 3/0948 1007.8 3.82 4.55 3.4
Chesapeake Bay Bridge Tunnel (CBBV2) (36.97N 76.11W)
3/0954 1006.1 3/1512 42 (6 m) 51 3.70 3.2
Yorktown USCG Training Center (YKTV2) (37.23N 76.48W)
3/1224 1009.0 3/1048 32 (10 m) 40 3.17 2.9
Wachapreague (WAHV2) (37.61N 75.69W)
1/1612 1009.9 3/1454 40 (7 m) 47 3.73 4.70 2.8
Kiptopeke (KPTV2) (37.17N 75.99W) 3/1518 26
(7 m) 38 3.28 3.56 2.5

Hurricane Hermine 39
Location
Minimum Sea Level Pressure
Maximum Surface Wind Speed
Storm surge (ft)c
Storm tide (ft)d
Estimated Inundation
(ft)e
Total rain (in) Date/
time (UTC)
Press. (mb)
Date/ time
(UTC)a
Sustained (kt)b
Gust (kt)
Windmill Point (8636580) (37.62N 76.29W)
2.28 2.4
Lewisetta (LWTV2) (38.00N 76.47W) 1/0900 1009.3 3/0600 27
(6 m) 34 1.93 2.64 2.0
Dahlgren (8635027) (38.32N 77.04W) 1/0830 1009.3 1.98 1.9
Cape Henry (CHYV2) (36.93N 76.01W) 3/1006 47
(28 m) 58
Weatherflow Sites Virginia Beach - Chesapeake Light Tower (XCLT) (36.90N 75.71W)
3/1556 58 (41 m, 1 min) 64
Newport News – Middle Ground Lighthouse (XMGL) (36.95N 76.39W)
3/0726 47 (20 m, 1 min) 52
Virginia Beach – Rudee Inlet (XRUD) (36.83N 75.97W)
3/1635 47 (9 m, 1 min) 53
Virginia Beach – Cape Henry (XHEN) (36.93N 76.01W)
3/1525 43 (23 m, 5 min) 50
Wachapreague (XWAC) (37.60N 75.69W)
3/1525 42 (10 m, 1 min) 49
Hampton – Thimble Shoals (XTHM) (37.05N 76.26W)
3/1201 39 (6 m, 1 min) 44
Virginia Beach – 3rd Island (XBBT) (37.04N 76.08W)
3/2330 39 (16 m, 5 min) 48
Virginia Beach – Lynnhaven Pier (XLYN) (36.92N 76.08W)
3/1250 39 (9 m, 5 min) 46
Poquoson (XPOQ) (37.11N 76.32W) 3/1407 38
(10 m, 1 min) 45
Poquoson City – Poquoson River Light 11 (XPQR) (37.16N 76.38W)
3/1310 38 (7 m, 1 min) 45
Hacksneck - Onancock (XHAK) (37.65N 75.88W)
3/1908 36 (14 m, 1 min) 41
Norfolk – Lafayette River (XODU) (36.89N 76.32W)
3/0905 36 (6 m, 1 min) 44

Hurricane Hermine 40
Location
Minimum Sea Level Pressure
Maximum Surface Wind Speed
Storm surge (ft)c
Storm tide (ft)d
Estimated Inundation
(ft)e
Total rain (in) Date/
time (UTC)
Press. (mb)
Date/ time
(UTC)a
Sustained (kt)b
Gust (kt)
Exmore – Silver Beach (XSIL) (37.49N 75.97W)
3/2255 36 (8 m, 1 min) 42
Port Haywood – New Point Comfort (XNPC) (37.33N 76.27W)
3/1125 36 (13 m, 5 min) 44
Portsmouth – South Norfolk Jordan Bridge (XSNJ) (36.81N 76.29W)
3/1302 36 (59 m, 5 min) 54
Poquoson – Messick Point (XMES) (37.11N 76.32W)
3/1225 34 (9 m, 5 min) 43
HADS Sites Chesapeake 19 SSW (LKDV2) (36.60N 76.44W)
2.26
RAWS Sites Suffolk 8 S (GDSV2) (36.61N 76.55W) 4.88
NWS COOP Sites Camp Pickett (CAPV2) (37.04N 77.96W) 2.09
Maryland ICAO Sites Ocean City (KOXB) (38.31N 75.12W) 3/1553 1013.8 3/1714 28 37 0.76
Salisbury (KSBY) (38.34N 75.51W) 3/1654 1015.1 3/2040 25 35 0.54
NOS Sites Ocean City Inlet (OCIM2) (38.33N 75.09W)
3/1524 22 (9 m) 36 2.04 2.41 1.6
Bishops Head (BISM2) (38.22N 76.04W) 3/1948 29
(7 m) 37 1.47 2.29 1.5
Solomons Island (SLIM2) (38.32N 76.45W)
3/1800 22 31 1.45 2.14 1.5
Annapolis (APAM2) (38.98N 76.48W) 1.47 2.02 1.4
Cambridge (CAMM2) (38.57N 76.07W) 3/2000 25
(6 m) 34 1.44 2.35 1.4
Chesapeake City (CHCM2) (39.53N 75.81W)
3/1636 18 (7 m) 26 1.36 1.4

Hurricane Hermine 41
Location
Minimum Sea Level Pressure
Maximum Surface Wind Speed
Storm surge (ft)c
Storm tide (ft)d
Estimated Inundation
(ft)e
Total rain (in) Date/
time (UTC)
Press. (mb)
Date/ time
(UTC)a
Sustained (kt)b
Gust (kt)
Baltimore (BLTM2) (39.27N 76.58W) 3/1542 20
(7 m) 26 1.39 2.14 1.3
Tolchester Beach (TCBM2) (39.21N 76.24W)
1.19 1.2
Chesapeake Bay Interpretive Buoy System Potomac (44042) (38.03N 76.34W) 3/1130 1012.5 3/1640 27
(3 m) 37
Weatherflow Sites Ocean City (XOCN) (38.33N 75.08W) 3/1427 39
(10 m, 1 min) 45
District of Columbia NOS Sites Washington, DC (WASD2) (38.87N 77.02W)
2.16 3.36 1.6
Delaware NOS Sites Lewes (LWSD1) (38.78N 75.12W) 3/2054 33
(10 m) 41 2.50 3.72 1.7
Reedy Point (RDYD1) (39.56N 75.57W) 1.48 3.96 1.1
Delaware City (DELD1) (39.58N 75.59W) 3/1948 22
(7 m) 27 1.42 1.0
Weatherflow Sites Dewey Beach (XDEW) (38.68N 75.08W) 3/2041 34
(11 m, 1 min) 41
New Jersey NOS Sites Atlantic City (ACYN4) (39.36N 74.42W) 2.45 3.79 1.8
Cape May (CMAN4) (38.97N 74.96W) 3/1412 20
(10 m) 32 2.18 4.17 1.7
Ship John Shoal (SJSN4) (39.31N 75.38W)
3/1754 28 (15 m) 35 1.86 1.2
Sandy Hook (SDHN4) (40.47N 74.01W) 6/0236 18
(6 m) 28 2.55 3.51 1.1
Robbins Reef (ROBN4) (40.66N 74.07W) 6/0748 1012.0 6/1248 26
(21 m) 37

Hurricane Hermine 42
Location
Minimum Sea Level Pressure
Maximum Surface Wind Speed
Storm surge (ft)c
Storm tide (ft)d
Estimated Inundation
(ft)e
Total rain (in) Date/
time (UTC)
Press. (mb)
Date/ time
(UTC)a
Sustained (kt)b
Gust (kt)
Weatherflow Sites Ocean City South Beach (XOCS) (39.22N 74.64W)
3/1641 34 (10 m, 1 min) 38
New York ICAO Sites Islip (KISP) (40.79N 73.10W) 6/0756 1011.3 6/0630 25 34 0.61
New York - Kennedy International Airport (KJFK) (40.65N 73.78W)
6/0751 1012.8 6/2148 24 35 0.17
Montauk Airport (KMTP) (41.07N 71.92W)
6/0754 1011.0 5/2254 22 35 0.44
East Hampton (KHTO) (40.95N 72.25W) 6/0635 1010.8 6/0135 21 37
NOS Sites Montauk (MTKN6) (41.05N 71.96W) 1.89 2.50 1.5
Kings Point (KPTN6) (40.81N 73.77W) 6/0548 24
(9 m) 30 2.13 1.4
The Battery (BATN6) (40.70N 74.01W) 2.30 3.38 1.1
Bergen Point West Reach (BGNN4) (40.64N 74.15W)
2.41 1.0
Weatherflow Sites Napeague (XNAP) (41.01N 72.06W) 6/0014 40
(10 m, 1 min) 46
Great Gull Island (XGUL) (41.20N 72.12W) 6/0208 37
(16 m, 5 min) 47
Hampton Bays – Shinnecock Light (XSHN) (40.84N 72.48W)
6/0215 36 (12 m, 5 min) 42
Connecticut ICAO Sites Groton (KGON) (41.33N 72.05W) 6/0256 1011.8 5/2320 31 41 0.51
New Haven (KHVN) (41.26N 72.88W) 6/0753 1013.1 5/2053 25 34 0.06

Hurricane Hermine 43
Location
Minimum Sea Level Pressure
Maximum Surface Wind Speed
Storm surge (ft)c
Storm tide (ft)d
Estimated Inundation
(ft)e
Total rain (in) Date/
time (UTC)
Press. (mb)
Date/ time
(UTC)a
Sustained (kt)b
Gust (kt)
Bridgeport (KBDR) (41.16N 73.13W) 6/0652 1013.0 6/0445 23 34 0.12
NOS Sites Bridgeport (BRHC3) (41.17N 73.18W) 6/1730 20
(8 m) 29 1.88 4.69 1.2
New Haven (NWHC3) (41.28N 72.91W) 6/0430 25
(7 m) 34 1.72 1.1
New London (NLNC3) (41.36N 72.09W) 5/2354 12
(8 m) 24 1.60 2.35 1.1
University of Connecticut, Department of Marine Sciences Sites New London Ledge (LDLC3) (41.31N 72.08W)
6/0650 1010.0 5/2320 33 (20 m) 47
Central Long Island Sound (44039) (41.14N 72.66W)
5/0023 27I (4 m) 37
Weatherflow Sites Stonington – Outer Breakwater 4 (XSTO) (41.32N 71.91W)
5/2341 34 (11 m, 5 min) 45
Rhode Island ICAO Sites Providence (KPVD) (41.72N 71.43W) 6/0751 1013.9 5/1951 29 48 0.18
Newport (KUUU) (41.53N 71.28W) 6/0753 1012.5 5/2128 27 42 0.23
Block Island (KBID) (41.16N 71.58W) 5/1956 1000.0 5/2218 27 40
Pawtucket (KSFZ) (41.92N 71.49W) 6/0756 1016.6 5/2256 23 35 0.08
NOS Sites Providence (FOXR1) (41.81N 71.40W) 5/1912 25
(18 m) 38 1.30 3.39 1.0
Newport (NWPR1) (41.50N 71.33W) 5/2300 26
(8 m) 36 1.48 2.75 0.9
Quonset Point (QPTR1) (41.59N 71.41W)
5/2218 37 (7 m) 44 1.34 0.8
Conimicut Light (CPTR1) (41.72N 71.35W)
5/2206 34 (21 m) 44 1.22 0.8

Hurricane Hermine 44
Location
Minimum Sea Level Pressure
Maximum Surface Wind Speed
Storm surge (ft)c
Storm tide (ft)d
Estimated Inundation
(ft)e
Total rain (in) Date/
time (UTC)
Press. (mb)
Date/ time
(UTC)a
Sustained (kt)b
Gust (kt)
Weatherflow Sites New Shoreham – Block Island Jetty (XBLK) (41.20N 71.59W)
5/2302 45 (11 m, 1 min) 52
Narragansett – University of Rhode Island (XURI) (41.49N 71.42W)
5/2226 43 (10 m, 1 min) 49
East Providence – Sabin Point (XSBN) (41.76N 71.37W)
5/2236 39 (9 m, 1 min) 44
Narragansett – Point Judith (XJUD) (41.36N 71.50W)
5/2321 36 (16 m, 5 min) 49
Massachusetts ICAO Sites Nantucket (KACK) (41.25N 70.06W) 5/2253 1009.5 5/1753 34 49 1.26
Martha’s Vineyard (KMVY) (41.39N 70.61W)
5/2353 1011.1 5/1953 31 43 0.06
Plymouth (KPYM) (41.90N 70.73W) 6/0752 1014.3 5/2350 26 39 0.55
Boston (KBOS) (42.36N 71.01W) 6/0654 1015.9 5/2254 24 35 0.24
Chatham (KCQX) (41.68N 69.99W) 5/2252 1013.0 5/1938 20 36 0.53
Hyannis (KHYA) (41.66N 70.28W) 5/2356 1011.8 5/2256 20 34 0.43
Milton (KMQE) (42.21N 71.11W) 6/0854 1016.1 6/0454 19 37 1.11
New Bedford (KEWB) (41.67N 70.96W) 6/0653 1012.8 5/1953 19 34 0.53
NDBC Sites Buzzards Bay (BUZM3) (41.40N 71.03W) 6/0200 1011.7 5/2000 41
(25 m) 50
NOS Sites Nantucket Island (NTKM3) (41.29N 70.10W)
5/2300 1009.9 5/2042 28 (9 m) 41 1.45 1.1
Chatham (8447435) (41.69N 69.95W) 2.61 3.87 0.9
Woods Hole (BZBM3) (41.52N 70.67W) 1.33 1.74 0.9

Hurricane Hermine 45
Location
Minimum Sea Level Pressure
Maximum Surface Wind Speed
Storm surge (ft)c
Storm tide (ft)d
Estimated Inundation
(ft)e
Total rain (in) Date/
time (UTC)
Press. (mb)
Date/ time
(UTC)a
Sustained (kt)b
Gust (kt)
Weatherflow Sites Tisbury, Martha’s Vineyard – Vineyard Haven (XVIN) (41.46N 70.59W)
5/2106 41 (10 m, 1 min) 46
Duxbury (XDUX) (42.06N 70.65W) 6/0035 34
(12 m, 5 min) 41
Boston – Deer Island (XDER) (42.34N 70.95W)
5/2233 34 (17 m, 1 min) 38
Cuba Santa Lucia 12.50
Candelaria 12.24
San Carlos 9.45 Surgidero de Batabanó 8.46
Mapos 6.57
Guasimal 6.32
Natividad 5.20
La Sierpe 4.93
Presa Zaza 4.61
Casilda 4.57
Aliviadero Cayajaná 4.27
El Jíbaro 4.20
Banao 4.13
Pojabo 3.94
Offshore NOAA Buoys West Tampa (42036) (28.50N 84.52W) 1/2150 989.4 1/2200 53
(5 m, 10 min) 68
Virginia Beach (44014) (36.61N 74.84W) 3/1150 1000.5 3/1800 49
(5 m, 10 min) 64
Nantucket (44008) (40.50N 69.25W) 5/1850 1000.1 5/1650 44
(5 m, 10 min) 56
Diamond Shoals (41025) (35.01N 75.40W)
3/0850 997.7 3/1800 44 (5 m, 10 min) 52

Hurricane Hermine 46
Location
Minimum Sea Level Pressure
Maximum Surface Wind Speed
Storm surge (ft)c
Storm tide (ft)d
Estimated Inundation
(ft)e
Total rain (in) Date/
time (UTC)
Press. (mb)
Date/ time
(UTC)a
Sustained (kt)b
Gust (kt)
Edisto (41004) (32.50N 79.10W) 2/2350 997.8 2/2240 43
(5 m, 10 min) 56
East Gulf (42003) (26.01N 85.65W) 1/0950 1001.0 1/0940 43
(5 m, 10 min) 54
Grays Reef (41008) (31.40N 80.87W) 2/1650 1001.0 2/1710 40
(5 m, 10 min) 52
Montauk Point (44017) (40.69N 72.05W) 6/0750 1007.9 6/0010 37
(5 m, 10 min) 49
Frying Pan Shoals (41013) (33.44N 77.74W)
3/0320 998.3 3/0100 37 (4 m, 1 min) 45
Nantucket Sound (44020) (41.44N 70.19W)
5/2250 1009.7 5/1910 35 (5 m, 10 min) 45
Pensacola (42039) (28.74N 86.01W) 1/1950 998.2 1/1950 33
(5 m, 10 min) 43
Long Island (44025) (40.25N 73.16W) 6/0750 1009.3 6/0900 31
(5 m, 10 min) 45
New York Harbor Entrance (44065) (40.37N 73.70W)
6/0650 1011.4 6/1230 26 (5 m, 10 min) 35
East of Long Beach, NJ (44066) (39.57N 72.59W)
6/1750 1003.7
a Date/time is for sustained wind when both sustained and gust are listed. b Except as noted, sustained wind averaging periods for C-MAN and land-based reports are 2 min; buoy averaging
periods are 8 min. c Storm surge is water height above normal astronomical tide level. d For most locations, storm tide is water height above the North American Vertical Datum of 1988 (NAVD88). e Estimated inundation is the maximum height of water above ground. For NOS tide gauges, the height of the water
above Mean Higher High Water (MHHW) is used as a proxy for inundation. I Incomplete data

Hurricane Hermine 47
Table 4. Number of hours in advance of formation associated with the first NHC Tropical Weather Outlook forecast in the indicated likelihood category. Note that the timings for the “Low” category do not include forecasts of a 0% chance of genesis.
Hours Before Genesis
48-Hour Outlook 120-Hour Outlook
Low (<40%) 234 240
Medium (40%-60%) 138 234
High (>60%) - 114
Table 5a. NHC official (OFCL) and climatology-persistence skill baseline (OCD5) track forecast errors (n mi) for forecasts issued while Hermine was a tropical and post-tropical cyclone (28 August – 6 September 2016). Mean errors for the previous 5-yr period are shown for comparison. Official errors that are smaller than the 5-yr means are shown in boldface type.
Forecast Period (h)
12 24 36 48 72 96 120
OFCL 28.6 51.6 73.2 95.9 127.7 136.6 119.7
OCD5 46.5 110.8 192.7 285.9 492.6 639.6 730.0
Forecasts 36 36 36 36 33 29 24
OFCL (2011-15) 28.4 45.0 60.4 77.1 113.1 157.8 210.0
OCD5 (2011-15) 48.3 101.5 161.5 222.6 329.8 412.6 483.9

Hurricane Hermine 48
Table 5b. Homogeneous comparison of selected track forecast guidance models (in n mi) for forecasts issued while Hermine was a tropical and post-tropical cyclone (28 August – 6 September 2016). Errors smaller than the NHC official forecast are shown in boldface type. The number of official forecasts shown here will generally be smaller than that shown in Table 5a due to the homogeneity requirement.
Model ID Forecast Period (h)
12 24 36 48 72 96 120
OFCL 24.4 48.4 79.2 107.6 133.3 138.9 120.5
OCD5 39.8 87.3 156.0 239.3 432.8 615.4 754.9
GFSI 25.2 49.1 72.9 95.7 114.0 111.3 116.5
EMXI 28.3 56.6 87.9 118.7 152.6 201.9 222.8
EGRI 25.4 38.1 53.1 68.3 85.8 99.5 151.9
NVGI 41.7 85.7 133.3 175.2 232.5 270.9 322.3
CMCI 35.8 60.1 80.1 99.4 114.3 164.3 187.4
GHMI 31.3 61.8 95.9 129.3 180.1 192.4 194.1
HWFI 25.2
47.4 86.2 127.9 180.2 221.7 314.9
CTCI 22.2 44.6 76.4 109.3 168.4 247.4 328.3
GFNI 34.3 77.5 130.7 173.1 203.2 201.7 266.7
TCON 22.1 43.7 66.7 92.3 123.1 130.1 151.1
TVCA 21.7 43.6 67.0 92.5 126.4 148.8 177.6
TVCX 23.0 45.4 69.1 95.2 127.5 154.2 179.1
GFEX 25.9 51.8 78.4 105.5 129.0 145.3 138.1
HCCA 19.5 37.3 57.8 85.1 120.8 178.3 208.0
AEMI 26.4 50.5 79.0 102.1 112.2 104.8 129.6
BAMS 65.9 134.2 204.5 267.0 355.5 504.9 744.7
BAMM 48.5 100.7 158.9 215.6 314.5 438.6 646.9
BAMD 41.2 83.7 134.2 189.7 321.6 458.6 592.1
Forecasts 22 22 22 22 22 22 21

Hurricane Hermine 49
Table 6a. NHC official (OFCL) and climatology-persistence skill baseline (OCD5) intensity forecast errors (kt) for forecasts issued while Hermine was a tropical and post-tropical cyclone (28 August – 6 September 2016). Mean errors for the previous 5-yr period are shown for comparison. Official errors that are smaller than the 5-yr means are shown in boldface type.
Forecast Period (h)
12 24 36 48 72 96 120
OFCL 5.0 6.8 7.9 7.8 12.0 13.3 10.0
OCD5 7.5 11.4 15.0 16.9 20.7 24.4 29.9
Forecasts 36 36 36 36 33 29 24
OFCL (2011-15) 6.2 9.4 11.5 13.3 14.6 14.6 15.8
OCD5 (2011-15) 7.3 10.8 13.3 15.3 17.7 17.8 17.6

Hurricane Hermine 50
Table 6b. Homogeneous comparison of selected intensity forecast guidance models (in kt) for forecasts issued while Hermine was a tropical and post-tropical cyclone (28 August – 6 September 2016). Errors smaller than the NHC official forecast are shown in boldface type. The number of official forecasts shown here will generally be smaller than that shown in Table 6a due to the homogeneity requirement.
Model ID Forecast Period (h)
12 24 36 48 72 96 120
OFCL 5.2 6.7 7.6 7.4 11.1 11.5 9.2
OCD5 7.2 11.2 14.4 15.9 17.1 20.6 31.6
DSHP 6.7 9.4 11.6 14.0 16.0 11.3 11.8
LGEM 6.6 9.6 13.5 15.3 15.3 11.1 15.0
GHMI 6.8 7.9 6.1 6.3 7.8 9.9 8.2
HWFI 5.8 8.3 9.5 10.0 8.3 10.6 13.1
CTCI 6.6 6.7 7.3 8.0 6.5 10.4 6.8
GFNI 5.7 7.4 5.7 8.8 16.1 12.6 9.6
ICON 5.8 7.3 8.6 9.3 10.3 8.8 8.9
IVCN 5.8 6.6 7.7 8.1 9.2 8.4 8.2
HCCA 5.3 6.3 7.6 8.4 8.6 8.6 10.9
GFSI 5.8 7.2 8.8 9.9 12.3 15.4 13.3
EMXI 6.1 7.8 7.0 7.3 10.2 8.8 9.8
Forecasts 23 23 23 23 23 20 12

Hurricane Hermine 51
Table 7. Watch and warning summary for Hurricane Hermine, 28 August – 6 September 2016.
Date/Time (UTC) Action Location
30 / 2100 Tropical Storm Watch issued Indian Pass to Walton/Bay Co Line
30 / 2100 Hurricane Watch issued Anclote River to Indian Pass
31 / 0900 Tropical Storm Watch discontinued All
31 / 0900 Tropical Storm Warning issued Anclote River to Walton/Bay Co Line
31 / 1500 Tropical Storm Watch issued Marineland to Altamaha Sound
31 / 2100 Tropical Storm Warning modified to Anclote River to Destin
31 / 2100 Hurricane Watch modified to Anclote River to Destin
1 / 0300 Tropical Storm Watch modified to Marineland to South Santee River
1 / 0300 Tropical Storm Warning modified to Anclote River to Suwannee River
1 / 0300 Hurricane Watch modified to Anclote River to Suwannee River
1 / 0300 Hurricane Warning issued Suwannee River to Mexico Beach
1 / 0900 Tropical Storm Watch changed to Tropical Storm Warning Marineland to South Santee River
1 / 0900 Tropical Storm Watch issued South Santee River to Surf City
1 / 1500 Tropical Storm Watch modified to Surf City to Oregon Inlet
1 / 1500 Tropical Storm Warning modified to Mexico Beach to Walton/Bay Co Line
1 / 1500 Tropical Storm Warning modified to Marineland to Surf City
1 / 1500 Hurricane Watch modified to Mexico Beach to Walton/Bay Co Line
1 / 1700 Tropical Storm Warning changed to Hurricane Watch Anclote River to Suwannee River
1 / 1700 Tropical Storm Warning modified to Flagler/Volusia Co Line to Surf City
1 / 1700 Tropical Storm Warning issued Englewood to Suwannee River
1 / 2100 Tropical Storm Watch discontinued Surf City to Oregon Inlet
1 / 2100 Tropical Storm Watch issued Duck to Sandy Hook
1 / 2100 Tropical Storm Warning modified to Flagler/Volusia Co Line to Duck
2 / 0900 Tropical Storm Warning modified to Englewood to Indian Pass
2 / 0900 Tropical Storm Warning discontinued Mexico Beach to Walton/Bay Co Line
2 / 0900 Hurricane Watch discontinued All
2 / 0900 Hurricane Warning discontinued All

Hurricane Hermine 52
Date/Time (UTC) Action Location
2 / 1200 Tropical Storm Warning modified to Englewood to Ochlockonee River
2 / 1500 Tropical Storm Watch discontinued Duck to Sandy Hook
2 / 1500 Tropical Storm Watch issued Fenwick Island to Watch Hill
2 / 1500 Tropical Storm Warning discontinued Englewood to Ochlockonee River
2 / 1500 Tropical Storm Warning discontinued Flagler/Volusia Co Line to Duck
2 / 1500 Tropical Storm Warning issued Nassau Sound to Fenwick Island
2 / 2100 Tropical Storm Watch modified to Sandy Hook to Watch Hill
2 / 2100 Tropical Storm Warning discontinued Nassau Sound to Fenwick Island
2 / 2100 Tropical Storm Warning issued Altamaha Sound to Sandy Hook
3 / 0000 Tropical Storm Warning modified to Savannah River to Sandy Hook
3 / 0300 Tropical Storm Warning modified to Edisto Beach to Sandy Hook
3 / 0600 Tropical Storm Warning modified to Surf City to Sandy Hook
3 / 1200 Tropical Storm Warning modified to Ocracoke Inlet to Sandy Hook
3 / 1500 Tropical Storm Watch modified to Watch Hill to Sagamore Beach
3 / 1500 Tropical Storm Warning modified to Ocracoke Inlet to Watch Hill
4 / 0900 Tropical Storm Warning modified to Duck to Watch Hill
4 / 1500 Tropical Storm Warning modified to Cape Charles Light to Watch Hill
4 / 2100 Tropical Storm Watch discontinued All
4 / 2100 Tropical Storm Warning discontinued Cape Charles Light to Watch Hill
4 / 2100 Tropical Storm Warning issued Fenwick Island to Sagamore Beach
5 / 0300 Tropical Storm Warning modified to New Haven to Sagamore Beach
5 / 0300 Tropical Storm Warning issued Fire Island Inlet to Port Jefferson Beach
6 / 1500 Tropical Storm Warning discontinued New Haven to Sagamore Beach
6 / 1800 Tropical Storm Warning discontinued All

Hurricane Hermine 53
Figure 1. Best track positions for Hurricane Hermine, 28 August – 3 September 2016.

Hurricane Hermine 54
Figure 2. Selected wind observations and best track maximum sustained surface wind speed curve for Hurricane Hermine, 28 August – 3 September 2016. Aircraft observations have been adjusted for elevation using 90%, 80%, and 80% adjustment factors for observations from 700 mb, 850 mb, and 1500 ft, respectively. Dropwindsonde observations include actual 10 m winds (sfc), as well as surface estimates derived from the mean wind over the lowest 150 m of the wind sounding (LLM). Advanced Dvorak Technique estimates represent the Current Intensity at the nominal observation time. AMSU intensity estimates are from the Cooperative Institute for Meteorological Satellite Studies technique. Dashed vertical lines correspond to 0000 UTC, and the solid vertical line corresponds to landfall.
20
30
40
50
60
70
80
90
8/28 8/30 9/1 9/3 9/5 9/7 9/9
BEST TRACKSat (TAFB)Sat (SAB)ADTAC (sfc)AC (flt->sfc)AC (DVK P->W)ScatterometerSurfaceDrop (sfc)Drop (LLM xtrp)AMSUAnalysis
Win
d Sp
eed
(kt)
Date (Month/Day)
Hurricane Hermine28 August - 3 September 2016

Hurricane Hermine 55
Figure 3. Selected pressure observations and best track minimum central pressure curve for Hurricane Hermine, 28 August – 3 September 2016. Advanced Dvorak Technique estimates represent the Current Intensity at the nominal observation time. AMSU intensity estimates are from the Cooperative Institute for Meteorological Satellite Studies technique. KZC P-W refers to pressure estimates derived using the Knaff-Zehr-Courtney pressure-wind relationship. Dashed vertical lines correspond to 0000 UTC, and the solid vertical line corresponds to landfall.
980
990
1000
1010
8/28 8/30 9/1 9/3 9/5 9/7 9/9
BEST TRACKKZC P-WSat (TAFB)Sat (SAB)ADTAMSUAC (sfc)SurfaceAnalysis
Pres
sure
(mb)
Date (Month/Day)
Hurricane Hermine28 August - 3 September 2016

Hurricane Hermine 56
Figure 4. Select (a) sustained winds (kt) and (b) gusts reported during Hermine between 28 August and 2 September 2016, along with Hermine’s best track. An asterisk denotes observations taken at an elevation of 20 m or higher.
(a)
(b)

Hurricane Hermine 57
Figure 5. Select (a) sustained winds (kt) and (b) gusts reported during Hermine between 2 and 3 September 2016, along with Hermine’s best track. An asterisk denotes observations taken at an elevation of 20 m or higher.
(a)
(b)

Hurricane Hermine 58
Figure 6. Select (a) sustained winds (kt) and (b) gusts reported during Hermine between 3 and 8 September 2016, along with Hermine’s best track. An asterisk denotes observations taken at an elevation of 20 m or higher.
(a)
(b)

Hurricane Hermine 59
Figure 7. Maximum storm surge inundation levels (ft above ground level) along the Gulf coast of Florida based on USGS high water mark observations (red dots) and NOS tide station observations above MHHW (blue dots). Image courtesy of the NHC Storm Surge Unit.

Hurricane Hermine 60
Figure 8. Rainfall amounts (inches) for Hurricane Hermine during its tropical and post-tropical phases, compiled between 27 August and 8 September 2016. Image courtesy of David Roth at the NOAA/NWS Weather Prediction Center.

Hurricane Hermine 61
Figure 9. Hermine best track (black) and NHC official track forecasts (red) issued between 28 August and 6 September 2016 centered over (a) Florida and the eastern Gulf of Mexico and (b) off the mid-Atlantic coast of the United States.
(a)
(b)

Hurricane Hermine 62
Figure 10. Prototype Storm Surge Watch (lavender) and Warning (magenta) areas issued at (a) 2100 UTC 30 August, (b) 1500 UTC 31 August, and (c) 1700 UTC 1 September with maximum storm surge inundation heights (ft above ground level) from USGS high water mark observations (green dots) and NOS tide station observations above MHHW (blue dots). Images courtesy of the NHC Storm Surge Unit.
(a) (b)
(c)

Hurricane Hermine 63
Figure 11. Prototype Storm Surge Watch (lavender) and Warning (magenta) areas issued at (a) 1500 UTC 2 September, (b) 2100 UTC 2 September, and (c) 1500 UTC 3 September with maximum storm surge inundation heights (ft above ground level) from USGS high water mark observations (green dots) and NOS tide station observations above MHHW (blue dots). Images courtesy of the NHC Storm Surge Unit.
(a) (b) (c)