
Huron-Clinton Metropolitan Authority
98
Huron-Clinton Metropolitan Authority Comprehensive Annual Financial Report Year Ended December 31, 2018 SUBMITTED TO THE HURON-CLINTON METROPOLITAN AUTHORITY BOARD OF COMMISSIONERS BRIGHTON, MICHIGAN Timothy J. McCarthy - Chairman - Governor Appointee Robert W. Marans - Vice Chairman - Washtenaw County Jaye Quadrozzi - Treasurer - Oakland County Bernard Parker - Secretary - Wayne County Steven E. Williams - Livingston County Kurt L. Heise - Governor Appointee John Paul Rea - Macomb County Prepared by the Huron-Clinton Metropolitan Authority Finance Department
Transcript of Huron-Clinton Metropolitan Authority
Huron-Clinton Metropolitan Authority
Comprehensive Annual Financial Report Year Ended December 31, 2018
SUBMITTED TO THE HURON-CLINTON METROPOLITAN AUTHORITY
BOARD OF COMMISSIONERS BRIGHTON, MICHIGAN
Timothy J. McCarthy - Chairman - Governor Appointee
Robert W. Marans - Vice Chairman - Washtenaw County Jaye Quadrozzi - Treasurer - Oakland County Bernard Parker - Secretary - Wayne County
Steven E. Williams - Livingston County Kurt L. Heise - Governor Appointee John Paul Rea - Macomb County
Prepared by the Huron-Clinton Metropolitan Authority Finance Department
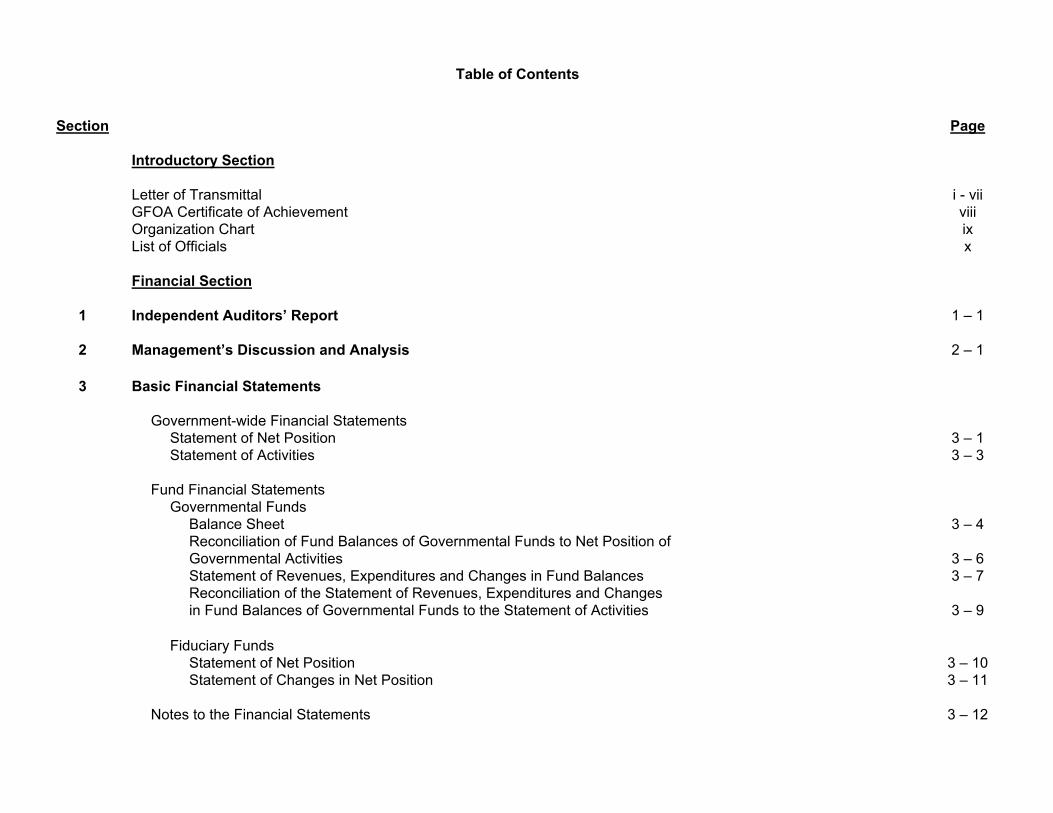
Table of Contents
Section Page Introductory Section Letter of Transmittal i - vii GFOA Certificate of Achievement viii Organization Chart ix List of Officials x Financial Section
1 Independent Auditors’ Report 1 – 1
2 Management’s Discussion and Analysis 2 – 1
3 Basic Financial Statements Government-wide Financial Statements Statement of Net Position 3 – 1 Statement of Activities 3 – 3 Fund Financial Statements Governmental Funds Balance Sheet 3 – 4 Reconciliation of Fund Balances of Governmental Funds to Net Position of
Governmental Activities
3 – 6 Statement of Revenues, Expenditures and Changes in Fund Balances 3 – 7 Reconciliation of the Statement of Revenues, Expenditures and Changes
in Fund Balances of Governmental Funds to the Statement of Activities
3 – 9 Fiduciary Funds Statement of Net Position 3 – 10 Statement of Changes in Net Position 3 – 11 Notes to the Financial Statements 3 – 12
Section Page
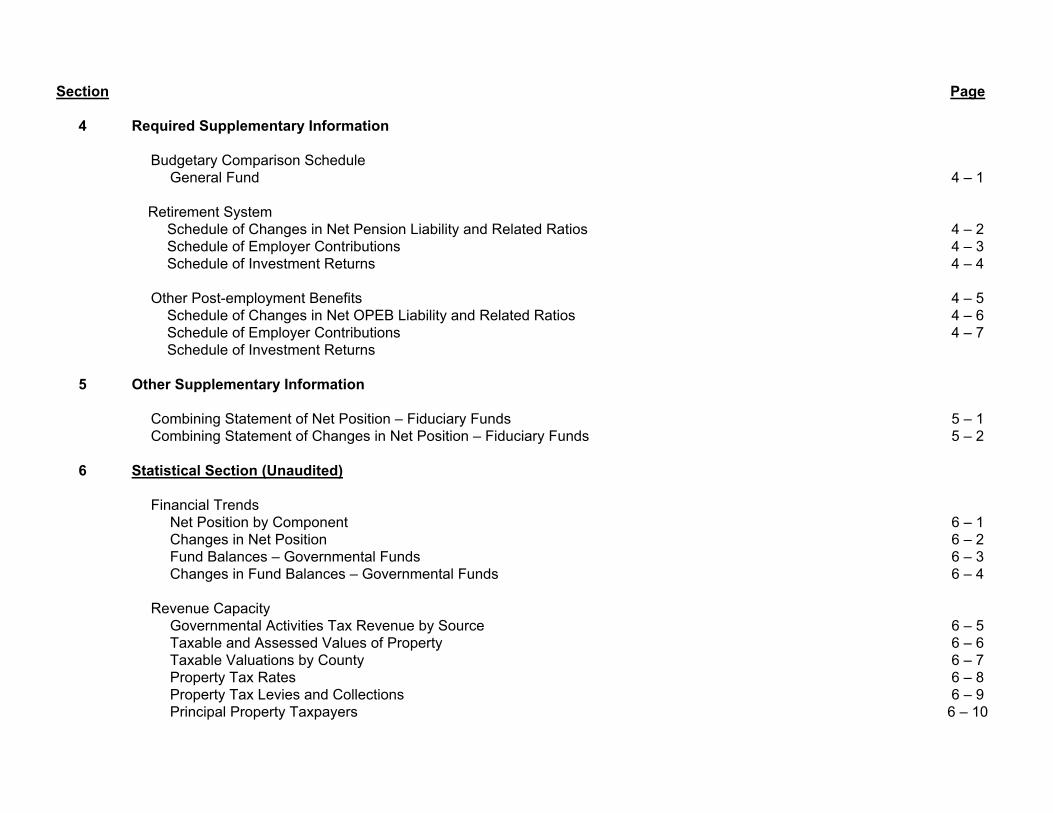
4 Required Supplementary Information Budgetary Comparison Schedule General Fund 4 – 1
Retirement System
Schedule of Changes in Net Pension Liability and Related Ratios Schedule of Employer Contributions Schedule of Investment Returns Other Post-employment Benefits Schedule of Changes in Net OPEB Liability and Related Ratios Schedule of Employer Contributions Schedule of Investment Returns
4 – 2 4 – 3 4 – 4
4 – 5 4 – 6 4 – 7
5 Other Supplementary Information
Combining Statement of Net Position – Fiduciary Funds
5 – 1 Combining Statement of Changes in Net Position – Fiduciary Funds 5 – 2
6 Statistical Section (Unaudited) Financial Trends
Net Position by Component Changes in Net Position Fund Balances – Governmental Funds Changes in Fund Balances – Governmental Funds
6 – 1 6 – 2 6 – 3 6 – 4
Revenue Capacity Governmental Activities Tax Revenue by Source Taxable and Assessed Values of Property Taxable Valuations by County Property Tax Rates Property Tax Levies and Collections Principal Property Taxpayers
6 – 5 6 – 6 6 – 7 6 – 8 6 – 9
6 – 10
Section Page
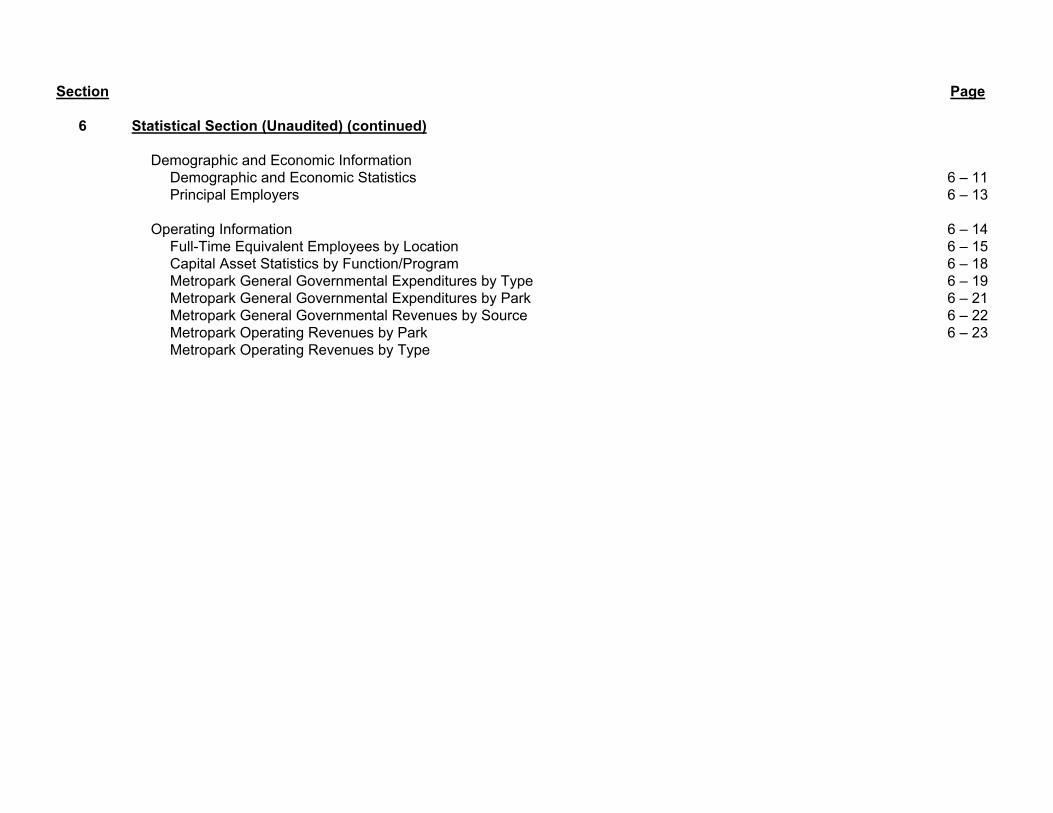
6 Statistical Section (Unaudited) (continued) Demographic and Economic Information
Demographic and Economic Statistics Principal Employers
Operating Information Full-Time Equivalent Employees by Location Capital Asset Statistics by Function/Program Metropark General Governmental Expenditures by Type Metropark General Governmental Expenditures by Park Metropark General Governmental Revenues by Source Metropark Operating Revenues by Park Metropark Operating Revenues by Type
6 – 11 6 – 13
6 – 14 6 – 15 6 – 18 6 – 19 6 – 21 6 – 22 6 – 23

INTRODUCTORY SECTION

Delhi | Dexter-Huron | Hudson Mills | Huron Meadows | Indian Springs | Kensington Lake Erie | Lower Huron | Lake St. Clair | Oakwoods | Stony Creek | Willow | Wolcott Mill
Board of Commissioners
Kurt L. Heise Stevens E. Williams Bernard Parker Robert W. Marans John Paul Rea Timothy J. McCarthy Jaye Quadrozzi Governor Appointee Livingston County Wayne County Washtenaw County Macomb County Governor Appointee Oakland County
i
June 11, 2019 To the Board of Commissioners, Director, and Citizens of the Huron-Clinton Metropolitan Authority Park Districts: State law requires that all local governmental units, including authorities such as the Huron-Clinton Metropolitan Authority, publish within six months of the close of each fiscal year a complete set of financial statements presented in conformity with generally accepted accounting principles (GAAP) and audited in accordance with generally accepted auditing standards by a firm of licensed certified public accountants. Pursuant to that requirement, we hereby issue the comprehensive annual financial report of the Huron-Clinton Metropolitan Authority for the fiscal year ended December 31, 2018. Responsibility for both the accuracy of the data and the completeness and fairness of the presentation, including all disclosures, rests with management. GASB 34 requires that management provide a narrative introduction, overview, and analysis to accompany the Basic Financial Statements in the form of a Management’s Discussion & Analysis (MD&A). This letter of transmittal is designed to complement the MD&A and should be read in conjunction with it. The MD&A can be found immediately following the report of the independent auditors. The financial reporting entity of the Huron-Clinton Metropolitan Authority includes all funds of the Huron-Clinton Metropolitan Authority. The Authority is a special district form of government operating independently of all other governmental agencies. It provides a full range of recreational activities in the five-county region including Wayne, Macomb, Oakland, Washtenaw, and Livingston Counties (Counties). GOVERNMENTAL STRUCTURE, LOCAL ECONOMIC CONDITION, AND OUTLOOK The Huron-Clinton Metropolitan Authority was sanctioned by Public Act 147 of Public Acts 1939. This Act provided for the incorporation of the Huron-Clinton Metropolitan Authority to permit the Counties to join in a metropolitan district for planning, promoting and/or acquiring, constructing, owning, developing, maintaining and operating, either within or without their limits, parks, connecting drives and/or limited access highways; to provide for the assessment, levy and collection of property taxes on both real and personal properties located within its boundaries. A referendum was held on November 5, 1940 and the citizens of the five-county district approved the creation of the Huron-Clinton Metropolitan Authority.
ii
The governing body of the Huron-Clinton Metropolitan Authority is a seven member Board of Commissioners. Two Commissioners serve as representatives at large and are appointed by the Governor of Michigan for four-year terms. The other five commissioners are appointed by their respective county Board of Commissioners and they serve a six-year staggered term. Public meetings of the Board of Commissioners are held on the second Thursday of each month. The Board of Commissioners is responsible for setting policy, adopting the budget, setting fees, approving contracts, land acquisition and expenditures, planning of new parks and facilities, and appointing the Director. The Director is responsible for carrying out the policies of the Board of Commissioners, for overseeing the day-to-day operations of the park system, hiring all full time employees, and approving all purchase commitments of the Authority. The Chief Finance Officer is responsible for maintaining all financial accounting records, collecting all revenues due, investing all funds, issuing payment vouchers for goods, services and payrolls, maintaining property/casualty insurances and serves as the Pension Plan Trustee and Retiree Health Trust Plan Administrator. The Authority’s main endeavor is to provide a variety of quality recreational opportunities through the development of natural resources along the Huron and Clinton Rivers for the benefit of the 4.4 million citizens of the five-county park district located in southeastern Michigan. Since its inception, the Authority has created thirteen Metroparks covering nearly 25,000 acres within the 1,600 square mile watershed area of the Huron and Clinton Rivers. The Authority, named after the two longest rivers within its boundaries, is a dynamic and changing organization striving to provide its services while minimizing disruption to existing land use. The characteristics of the Metroparks are different from recreation supplied by most other units of government or by the private sector. Generally, Metroparks are fairly large and offer a blend of natural resources such as lakes, rivers, woods, or wildlife area with constructed facilities that provide for more intensive recreational pursuits such as swimming, golfing, bicycling, cross-country skiing or other outdoor recreation. These Metroparks are within an hour’s drive for most of the residents of the region and are generally considered “day use” parks. The Metroparks range in size from 53 acres at Delhi Metropark to over 4,400 acres at Stony Creek Metropark. The larger Metroparks are designed to accommodate crowds of 35,000 or more on peak use days. In 2017, the Metropark system provided recreation for 7.3 million park visitors. The Authority’s centralized Administrative Office coordinates the development and operation of all thirteen Metroparks. The following departments are housed at the Administrative Office: (1) Executive; (2) Finance; (3) Fund Development; (4) Engineering; (5) Planning; (6) Natural Resources; (7) Human Resources; (8) Communications/Marketing; (9) Purchasing; (10) Information Systems; and (11) Police. The day-to-day administration, operation, and maintenance of each Metropark is coordinated through three district park superintendents. These district park superintendents oversee all on-site park activities, operations and maintenance of buildings, roads and grounds.
iii
The economic climate of the regions in Southeast Michigan continues regain strength in its 8th year of recovery. Unemployment levels are falling, but still overall above the national rate. Not all areas within the five-county Metroparks region respond evenly. Median household income ranges from a low of $43,700 in Wayne County to a high of $78,000 in Livingston County. Southeast Michigan overall sees taxable value continue to grow with growth continuing to be steady in the housing markets and values. MAJOR INITIATIVES During 2018, the Authority’s staff, worked with the Board of Commissioners and the Director to define an appropriate range for the general fund unassigned fund balance. In addition to this, the Board of Commissioners approved implementation and transition to a capital project fund. Past capital improvement projects were budgeted and expensed within the general fund. A majority of capital projects span multiple years making the fit within the general fund annual budget less than ideal. As of year end the new Capital Project Fund was set up and all open capital improvement projects were transitioned. The following information summarizes several of the more significant projects. These projects reflect the Authority’s ongoing commitment to providing quality public recreational facilities and services in a well-maintained and safe environment to the citizens of Southeast Michigan. The major activities and accomplishments during 2018 included:
1. At Lake St. Clair Metropark, $150,000 was expended to finalize development of open waterways through the Black Creek Marsh. This work will which was funded through NOAA (National Oceanic and Atmospheric Administration) and GLC (Great Lakes Commission) is intended to improve fish spawning habitat in the Lake St. Clair watershed as well as enhancing water based recreation in the Black Creek March. This was primarily accomplished through dredging and development of small pond areas and channels within the existing marshlands.
2. Kensington Metropark’s east boat launch facility was updated to include more accessibility for personal water craft as well as
improvement of the launch ramps themselves at a cost of $110,000.
3. Redevelopment of the boat launch facility at Stony Creek Metropark continued during 2018. This work which was originally anticipated to cost in excess of $4 million when completed encompassed two separate projects. The first, which entailed rework of the boat launch ramps themselves as well as some paving and bike path realignment incurred expenditures in 2018 to complete the project. The other component will remove the existing comfort station which is not in compliance with current accessibility standards. $641,000 was expended during 2018. There is currently no further construction underway on this project.
4. Also at Stony Creek Metropark, reconstruction of an existing section of hike-bike trail accounted for expenditures of nearly $150,000.
5. Wolcott Metropark Farm Center was improved with the re-development of a children’s play area at a cost of $91,000.

iv
6. Huron Meadows Metropark Golf Course service yard was updated with the removal of an existing underground storage tank (UST) and replacement with an above ground storage tank (AST). This process of removing the UST and replacing it with an AST is ongoing throughout the Metroparks.
7. In addition, design work for several significant projects was underway in 2018. These projects include Kensington Maple Beach Facilities, Stony Creek Baypoint Beach Facilities, Willow Park Office. All three of these facilities will replace obsolete facilities that have either been removed or are planned for removal.
In total, the Authority invested in park facilities to the extent of nearly $2.2 million, as work was performed on 36 individual capital projects. These capitalized projects will help ensure that Metropark facility offerings to our public are in good working order and relevant to today's recreational interests. The vast majority of the 2018 capital improvement expenditures continue to relate to the 3-R's (repair, renovate and replace). Due to the age of the Metropark facilities, it is essential that these types of projects continue to be the primary focus. FINANCIAL INFORMATION Management of the Authority is responsible for establishing and maintaining internal controls designed to ensure that the assets of the Authority are protected from loss, theft, or misuse and to ensure that adequate accounting data is compiled to allow for the preparation of financial statements in conformity with generally accepted accounting principles. Internal controls are designed to provide reasonable, but not absolute, assurance that these objectives are met. The concept of reasonable assurance recognizes that: (1) the cost of a control should not exceed the benefits likely to be derived; and (2) the valuation of costs and benefits requires estimates and judgments by management. As management, we assert that, to the best of our knowledge and belief, this financial report is complete and reliable in all material respects.

v
FEDERAL FINANCIAL ASSISTANCE The Authority received Federal financial assistance during 2018 related to the Black Creek Marsh restoration at Lake St. Clair Metropark. The receipt of these funds will not require the independent auditor to issue a Single Audit Report. BUDGET The annual budget serves as the foundation for the Huron-Clinton Metropolitan Authority’s financial planning and control. The Authority employs a Five-Year Plan for long-range financial planning, which provides general guidance for each year’s annual budget. This Five-Year Plan is updated annually. The annual budget process is multi-faceted, involving all units of the Authority. The Authority’s Planning, Engineering, and Natural Resources Departments, in conjunction with park operating units, develop capital improvement, equipment, major maintenance, and minor project listings that are reviewed and finalized by mid-September. All park operating units are required to submit park operation budget requests to the CFO’s office near the end of September. The CFO utilizes these requests, along with capital budget requests, as the starting point for developing a proposed General Fund budget. The CFO conducts budget review meetings and presents the proposed budget at a public hearing and then to the Board of Commissioners at the November Board meeting. The appropriated budget is a line item budget prepared by fund, category (i.e., capital equipment, park operations), department/park (i.e., Lake St. Clair, Kensington), sub-department/activity (i.e., golf course, regulatory), and object (i.e., full time wages, utilities). The Director is authorized to make budgetary transfers between line item appropriations. All General Fund budget amendments are approved by the Board of Commissioners on a monthly basis. The Authority maintains an encumbrance accounting system and a work order (project accounting) system for capital construction type projects to assist in maintaining budgetary control. LONG-TERM FINANCIAL PLANNING The Huron-Clinton Metropolitan Authority employs a Five-Year Community Recreation Plan as well as a rolling Five-Year Financial Plan. The current Community Recreation Plan covers recreational development for the period from 2018 through 2022. Long term financial planning for the Metroparks system is provided by the rolling Five-Year Plan which is updated and approved by the Board annually. The development of the Five-Year Plan is a planning process that is a joint effort involving the general public, park staff, administrative office staff, planning staff, natural resource staff, engineering staff, interpretive staff, police staff, and the Board of Commissioners. Due to the continued fiscal constraints and the large amount of aging infrastructure within the Metropark system, an emphasis continues to be placed on renovation/redevelopment/restoration type projects rather than new park developments. The Board of Commissioners and staff have developed the current Five-Year Plan in an effort to position the Authority to work towards a model of fiscal sustainability. Recognizing the paradigm shift in tax revenue as well as the capital needs of aging facilities, roads and other infrastructure, the current five-year plan focuses on these issues:

vi
Continuation of high standards of maintenance and service levels for existing park operations. Increased funding for major maintenance projects to $ 2.5 million annually. Maintenance of a functional fleet of equipment plus equipping new facilities. Funding the redevelopment of major assets based on established criteria. Funding for the continuation of reconstructing/resurfacing of Authority roads, parking lots, and hike/bike trails. Maintaining contributions to the Authority’s Retiree Health Care Trust Fund and Pension Trust Fund.
The current Five-Year Plan provides general guidance for the development of the Authority’s annual budget each year. Adjustments are made to the Five-Year Plan as dictated by ongoing economic conditions. DEBT The Authority has not issued any bonded debt. The Authority’s Enabling Act restricts debt issues to revenue bonds. Throughout the history of the Metroparks, it has never been felt to be beneficial to issue revenue bonds as a means of financing recreational facilities. OTHER INFORMATION Independent Audit State statute requires an annual audit by an independent certified public accountant. The accounting firm of Yeo & Yeo was selected by the Board of Commissioners. The audit is conducted in accordance with generally accepted auditing standards and the standards for financial audits contained in Government Auditing Standards issued by the Comptroller General of the United States. The audit will meet the requirements set forth by State statute and will include tests of the accounting records of the Authority and other procedures necessary for Yeo & Yeo to express an opinion on the financial statements. The auditor’s report on the financial statements, required supplementary information, and supplemental schedules are included in the Financial Section of this report. Awards The Government Finance Officers Association of the United States and Canada (GFOA) awarded a Certificate of Achievement for Excellence in Financial Reporting to the Huron-Clinton Metropolitan Authority for its comprehensive annual financial report for the year ended December 31, 2017. This was the fifteenth consecutive year that the Authority has achieved this prestigious award. In order to be awarded a Certificate of Achievement, a government must publish an easily readable and efficiently organized comprehensive annual financial report. This report must satisfy both generally accepted accounting principles and applicable legal requirements.
vii
A Certificate of Achievement is valid for a period of one year only. We believe that our current comprehensive annual financial report continues to meet the Certificate of Achievement Program’s requirements and we are submitting it again to the GFOA to determine its eligibility for this award. Acknowledgements The preparation of this comprehensive annual financial report is a major undertaking and I want to acknowledge the extraordinary efforts of our Finance Department, and especially Supervisor of Accounting Rebecca Baaki and Auditor Molly Goike. Their assistance was absolutely essential and appreciated in submitting this report. The input and guidance from our independent auditors, Yeo & Yeo, was also appreciated to direct us through the compilation of our comprehensive annual financial report. Finally, without the support and leadership of the Board of Commissioners this report would not have been possible. Respectfully submitted,
Rebecca Franchock

Huron-Clinton Metropolitan Authority GFOA Certificate of Achievement
December 31, 2018
viii

Huron-Clinton Metropolitan Authority Organization Chart December 31, 2018
ix

Huron-Clinton Metropolitan Authority List of Officials
December 31, 2018
x
Unit – Title Name of Official Administrative Staff
Director Amy McMillan Deputy Director David B. Kirbach Chief of Finance Rebecca L. Franchock Supervisor of Accounting Rebecca J. Baaki Chief of Natural Resources Ryan Colliton Chief of Police Michael Reese Director of Fund Development Julie Hein Information Technology Manager Robert Rudolph Interpretive Services Manager Jennifer Jaworski Manager of Engineering Michael Henkel Manager of Human Resources Randy Rossman Manager of Planner Nina Kelly Supervising Field Engineer Jim Soraghan Supervising Design Engineer Laura L. Martin
EASTERN DISTRICT District Park Superintendent Michael G. Lyons
District Maintenance Supervisor Mark V. Lietaert District Interpretive Supervisor Julie C. Champion Park Operations Manager - Stony Creek Park Operations Manager - Wolcott Mill Metroparks
Gary G. Hopp Susan Schmidt
Park Operations Manager - Lake St. Clair Metropark Joseph Hall
WESTERN DISTRICT District Park Superintendent Jeff Brown
District Maintenance Supervisor Adam Haberkorn District Interpretive Supervisor Victoria Sluder Park Operations Manager - Kensington, Indian Springs Metroparks Eric J. Koppin Park Operations Manager - Hudson Mills, Dexter-Huron, Delhi and Huron Meadows Metroparks Tamra Bezzeg
SOUTHERN DISTRICT District Park Superintendent Jerome Cyr
District Maintenance Supervisor Joseph B. Jolly District Interpretive Supervisor Kevin J. Arnold Park Operations Manager - Lower Huron, Willow, Oakwoods Metroparks Jeff Schuman Park Operations Manager - Lake Erie Metropark Jeffrey D. Linn

FINANCIAL SECTION

1 – 1
Independent Auditors’ Report
To the Board of Commissioners Huron-Clinton Metropolitan Authority Brighton, Michigan
Report on the Financial Statements
We have audited the accompanying financial statements of the governmental activities, each major fund, and the aggregate remaining fund information of the Huron-Clinton Metropolitan Authority, as of and for the year ended December 31, 2018, and the related notes to the financial statements, which collectively comprise the Huron-Clinton Metropolitan Authority’s basic financial statements as listed in the table of contents.
Management’s Responsibility for the Financial Statements
Management is responsible for the preparation and fair presentation of these financial statements in accordance with accounting principles generally accepted in the United States of America; this includes the design, implementation, and maintenance of internal control relevant to the preparation and fair presentation of financial statements that are free from material misstatement, whether due to fraud or error.
Auditors’ Responsibility
Our responsibility is to express opinions on these financial statements based on our audit. We conducted our audit in accordance with auditing standards generally accepted in the United States of America. Those standards require that we plan and perform the audit to obtain reasonable assurance about whether the financial statements are free from material misstatement.
An audit involves performing procedures to obtain audit evidence about the amounts and disclosures in the financial statements. The procedures selected depend on the auditors’ judgment, including the assessment of the risks of material misstatement of the financial statements, whether due to fraud or error. In making those risk assessments, the auditor considers internal control relevant to the entity’s preparation and fair presentation of the financial statements in order to design audit procedures that are appropriate in the circumstances, but not for the purpose of expressing an opinion on the effectiveness of the entity’s internal control. Accordingly, we express no such opinion. An audit also includes evaluating the appropriateness of accounting policies used and the reasonableness of significant accounting estimates made by management, as well as evaluating the overall presentation of the financial statements.

1 – 2
We believe that the audit evidence we have obtained is sufficient and appropriate to provide a basis for our audit opinions.
Opinions
In our opinion, the financial statements referred to above present fairly, in all material respects, the respective financial position of the governmental activities, each major fund, and the aggregate remaining fund information of the Huron-Clinton Metropolitan Authority, as of December 31, 2018, and the respective changes in financial position for the year then ended in accordance with accounting principles generally accepted in the United States of America.
Adoption of New Accounting Standards
As described in Note 1 to the financial statements, during the year ended December 31, 2018, the Authority adopted GASB Statement No. 75 Accounting and Financial Reporting for Postemployment Benefits Other Than Pensions. Our opinions are not modified with respect to this matter.
Other Matters
Required Supplementary Information
Accounting principles generally accepted in the United States of America require that the management’s discussion and analysis, budgetary comparison information, pension schedules and other post-employment benefit schedules, as identified in the table of contents, be presented to supplement the basic financial statements. Such information, although not a part of the basic financial statements, is required by the Governmental Accounting Standards Board, who considers it to be an essential part of financial reporting for placing the basic financial statements in an appropriate operational, economic, or historical context. We have applied certain limited procedures to the required supplementary information in accordance with auditing standards generally accepted in the United States of America, which consisted of inquiries of management about the methods of preparing the information and comparing the information for consistency with management’s responses to our inquiries, the basic financial statements, and other knowledge we obtained during our audit of the basic financial statements. We do not express an opinion or provide any assurance on the information, because the limited procedures do not provide us with sufficient evidence to express an opinion or provide any assurance.
Other Supplementary Information
Our audit was conducted for the purpose of forming opinions on the financial statements that collectively comprise the Huron-Clinton Metropolitan Authority’s basic financial statements. The introductory section, statistical section, and other supplementary information, as identified in the table of contents, are presented for purposes of additional analysis and are not required parts of the basic financial statements.
The other supplementary information, as identified in the table of contents, is the responsibility of management and was derived from and relates directly to the underlying accounting and other records used to prepare the basic financial statements. The other supplementary information has been subjected to the auditing procedures applied in the audit of the basic financial statements and certain additional procedures, including
1 – 3
comparing and reconciling such information directly to the underlying accounting and other records used to prepare the basic financial statements or to the basic financial statements themselves, and other additional procedures in accordance with auditing standards generally accepted in the United States of America. In our opinion, the other supplementary information, as identified in the table of contents, is fairly stated, in all material respects, in relation to the basic financial statements as a whole.
The introductory section and statistical section, which are the responsibility of management, have not been subjected to the auditing procedures applied in the audit of the basic financial statements, and accordingly, we do not express an opinion or provide any assurance on them.
Auburn Hills, MI June 11, 2019
Huron-Clinton Metropolitan Authority Management’s Discussion and Analysis
December 31, 2018
2 - 1
As management of the Huron-Clinton Metropolitan Authority, we offer the readers of the Authority’s financial statements this narrative overview and analysis of the financial activities of the Huron-Clinton Metropolitan Authority for the year ended December 31, 2018. We encourage readers to consider the information presented here in conjunction with additional information that we have furnished in our letter of transmittal, the financial statements, and the notes to the financial statements. Financial Highlights The assets of the Authority exceeded its liabilities and deferred inflows at the end of 2018 by $210,752,159 (net position). Of this amount, $15,550,860 (unrestricted net position) may be used to meet the Authority’s ongoing obligations to provide park and recreation services to the citizens of the five-county Metropark system. The Authority’s total net position increased by $1,220,507. Authority General Fund revenues of approximately $54 million were more than the expected 2018 final budget targets by $1,109,679 (2.1 percent). Authority General Fund operating expenditures of approximately $56 million were under amended 2018 budget amounts by $5,779,476 (10.3 percent). Overview of the Financial Statements This discussion and analysis is intended to serve as an introduction to the Authority’s basic financial statements. The Authority’s basic financial statements are comprised of three components: (1) government-wide financial statements, (2) fund financial statements, and (3) notes to the financial statements. This report also contains other supplementary information in addition to the basic financial statements themselves. Government-Wide Financial Statements. The government-wide financial statements are designed to provide readers with a broad overview of the Authority’s finances in a manner like private-sector business. The statement of net position presents information on all the Authority’s assets, deferred outflows of resources, liabilities and deferred inflows of resources, with the difference between the assets and deferred outflows and the liabilities and deferred inflows reported as net position. Over time, increases or decreases in net position may serve as a useful indicator of whether the financial position of the Authority is improving or deteriorating. The statement of activities presents information showing how the Authority’s net position changed during the most recent year. All changes in net position are reported as soon as the underlying event giving rise to the change occurs, regardless of the timing of related cash flows. Thus, revenues and expenses are reported in this statement for some items that will only result in cash flows in future years (i.e., earned but unused vacation leave).

Huron-Clinton Metropolitan Authority Management’s Discussion and Analysis
December 31, 2018
2 - 2
Both of the government-wide financial statements distinguish functions of the Authority that are principally supported by taxes and program revenues. The sole governmental activity of the Authority consists of providing regional park and recreation services in the five-county metropolitan Detroit area. The Authority is a single purpose governmental agency. Fund financial statements. A fund is a grouping of related accounts that is used to maintain control over resources that have been segregated for specific activities or objectives. The Authority, like other state and local governments, uses fund accounting to ensure and demonstrate compliance with finance-related legal requirements. All of the funds of the Authority can be divided into two categories: governmental funds and fiduciary funds. Governmental funds. Governmental funds are used to account for essentially the same functions reported as governmental activities in the government-wide financial statements. However, unlike the government-wide financial statements, government fund financial statements focus on near-term inflows and outflows of spendable resources, as well as on balances of spendable resources available at the end of the year. Such information may be useful in evaluating a government’s near-term financing requirements. Because the focus of governmental funds is narrower than that of the government-wide financial statements, it is useful to compare the information presented for governmental funds with similar information presented for governmental activities in the government-wide financial statements. By doing so, readers may better understand the long-term impact of the government’s near-term financing decisions. Both the governmental fund balance sheet and the governmental fund statement of revenues, expenditures, and changes in fund balances provide a reconciliation to facilitate this comparison between governmental funds and governmental activities. The Authority maintains three individual governmental funds. Information is presented separately in the governmental fund balance sheet and in the governmental fund statement of revenues, expenditures and changes in fund balances for the General, Supplemental Major Maintenance and Capital Projects funds, each of which are considered to be major funds. The Authority adopts an annual appropriated budget for its General Fund. A budgetary comparison statement has been provided herein to demonstrate compliance with this budget.
Huron-Clinton Metropolitan Authority Management’s Discussion and Analysis
December 31, 2018
2 - 3
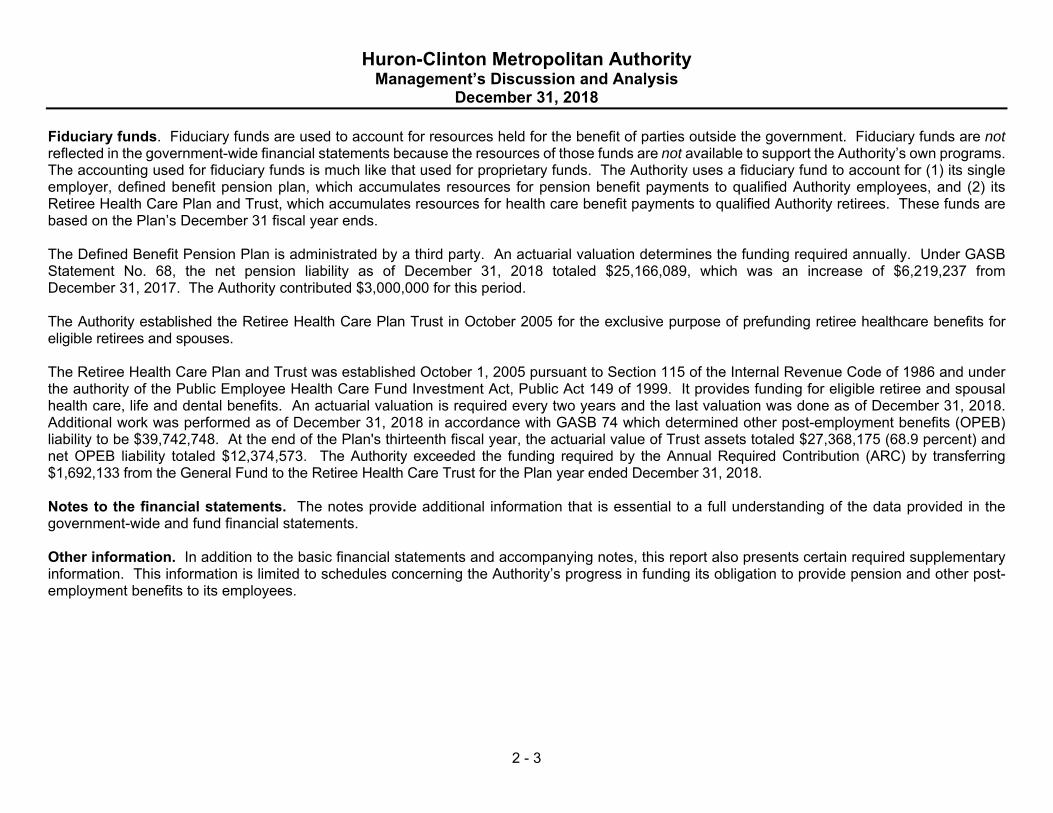
Fiduciary funds. Fiduciary funds are used to account for resources held for the benefit of parties outside the government. Fiduciary funds are not reflected in the government-wide financial statements because the resources of those funds are not available to support the Authority’s own programs. The accounting used for fiduciary funds is much like that used for proprietary funds. The Authority uses a fiduciary fund to account for (1) its single employer, defined benefit pension plan, which accumulates resources for pension benefit payments to qualified Authority employees, and (2) its Retiree Health Care Plan and Trust, which accumulates resources for health care benefit payments to qualified Authority retirees. These funds are based on the Plan’s December 31 fiscal year ends. The Defined Benefit Pension Plan is administrated by a third party. An actuarial valuation determines the funding required annually. Under GASB Statement No. 68, the net pension liability as of December 31, 2018 totaled $25,166,089, which was an increase of $6,219,237 from December 31, 2017. The Authority contributed $3,000,000 for this period. The Authority established the Retiree Health Care Plan Trust in October 2005 for the exclusive purpose of prefunding retiree healthcare benefits for eligible retirees and spouses. The Retiree Health Care Plan and Trust was established October 1, 2005 pursuant to Section 115 of the Internal Revenue Code of 1986 and under the authority of the Public Employee Health Care Fund Investment Act, Public Act 149 of 1999. It provides funding for eligible retiree and spousal health care, life and dental benefits. An actuarial valuation is required every two years and the last valuation was done as of December 31, 2018. Additional work was performed as of December 31, 2018 in accordance with GASB 74 which determined other post-employment benefits (OPEB) liability to be $39,742,748. At the end of the Plan's thirteenth fiscal year, the actuarial value of Trust assets totaled $27,368,175 (68.9 percent) and net OPEB liability totaled $12,374,573. The Authority exceeded the funding required by the Annual Required Contribution (ARC) by transferring $1,692,133 from the General Fund to the Retiree Health Care Trust for the Plan year ended December 31, 2018. Notes to the financial statements. The notes provide additional information that is essential to a full understanding of the data provided in the government-wide and fund financial statements. Other information. In addition to the basic financial statements and accompanying notes, this report also presents certain required supplementary information. This information is limited to schedules concerning the Authority’s progress in funding its obligation to provide pension and other post-employment benefits to its employees.

Huron-Clinton Metropolitan Authority Management’s Discussion and Analysis
December 31, 2018
2 - 4
Government-Wide Financial Analysis As noted earlier, net position may serve over time as a useful indicator of a government’s financial position. In the case of the Huron-Clinton Metropolitan Authority, assets exceeded liabilities and deferred inflows by $210,752,159 at the close of the year. By far the largest portion of the Authority’s net position (92 percent) reflects its investment in capital assets (i.e., land, buildings, infrastructure, roads, park improvements, vehicles, and equipment). The Authority uses these capital assets to provide park and recreation services to citizens; consequently, these assets are not available for future spending. The Authority does not have any bonded debt.
2018 2017
Current and other assets 82,685,789$ 81,258,752$ Capital assets, net 194,826,998 197,243,195
Total assets 277,512,787 278,501,947
Deferred outflows of resources 8,367,668 5,008,332
Long-term liabilities 40,079,747 21,688,045 Other liabilities 3,459,924 3,805,727
Total liabilities 43,539,671 25,493,772
Deferred inflows of resources 31,588,625 33,816,260
Net positionNet investment in capital assets 194,826,998 197,243,195 Restricted 374,301 349,962 Unrestricted 15,550,860 26,607,090
Total net position 210,752,159$ 224,200,247$
Net PositionGovernmental Activities

Huron-Clinton Metropolitan Authority Management’s Discussion and Analysis
December 31, 2018
2 - 5
A portion of the Authority’s net position is restricted. Amounts have been restricted for future maintenance or construction of the Lake St. Clair Marina facility, per grant requirements. In addition, per contract requirements with an outside party, amounts have been restricted related to the Hudson Mills canoe livery. The unrestricted net position may be used to meet the Authority’s ongoing obligations for park and recreation facilities and services to citizens and creditors. At the end of the current year, the Authority is able to report a positive balance in net position. The same situation held true for the prior fiscal year. The Authority’s net position increased by $1,220,507 during the current year.
2018 2017Program revenues
Park charges for services 19,802,276$ 19,692,340$ Operating grants 907,043 1,377,190 Capital grants 76,311 -
General revenuesProperty taxes 31,675,974 30,645,350 Oil and gas royalties 95,652 93,838 Donations 19,065 32,483 Interest 785,931 484,795 Miscellaneous 791,122 -
Total revenues 54,153,374 52,325,996
ExpensesRecreation and culture 52,932,867 51,898,640
Change in net position 1,220,507 427,356
Net positionBeginning of year 209,531,652 223,772,891
End of year 210,752,159$ 224,200,247$
Change in Net PositionGovernmental Activities

Huron-Clinton Metropolitan Authority Management’s Discussion and Analysis
December 31, 2018
2 - 6
Governmental Activities Governmental activities increased the Authority’s net position by $1,220,507, as total 2018 operating revenues of $54.1 million exceeded total expenditures of $52.9 million. Change in Net Position The change in net position for 2018 is approximately $0.8 million more than the change in net position for 2017. Financial Analysis of the Government’s Funds As noted earlier, the Authority uses fund accounting to ensure and demonstrate compliance with finance-related legal requirements. Governmental funds. The focus of the Authority’s governmental funds is to provide information on near-term inflows, outflows, and balances of spendable resources. Such information is useful in assessing the Authority’s financing requirements. In particular, unassigned fund balance may serve as a useful measure of a government’s net resources available for spending at the end of the year. As of the end of the current year, the Authority’s governmental funds reported a combined ending fund balance of $48,440,145, an increase of $5,836,917 compared to 2017. Approximately 44 percent of this total amount ($21.2 million) constitutes “unassigned” fund balance. Approximately 2 percent of this total amount ($0.9 million) is considered nonspendable. Approximately one percent of the total amount ($0.4 million) is considered restricted. Approximately 15 percent of this total amount ($7.2 million) is considered assigned. The remainder of fund balance ($18.8 million) is “committed” to indicate that it is not available for new spending because it has already been committed for: (1) capital projects-$7.3 million, (2) supplemental major maintenance-$4.9 million, (3) future land purchases-$5.5 million, and (4) health insurance rate stabilization funds-$1.1 million. The general fund is the primary operating fund of the Authority. At the end of the current year, unassigned fund balance of the general fund was $21,153,287 while total fund balance was $36,204,515. As a measure of the general fund’s liquidity, it may be useful to compare unassigned fund balance to expenditures. The Authority’s goal is to maintain the unassigned fund balance within a range of 25 to 30% of general fund revenues, and at year end the unassigned fund balance was 39% of general fund revenues of $54 million. The Board of Commissioners has approved a systematic buildup of fund balance with the knowledge of our deferred infrastructure. The fund balance of the Authority’s general fund decreased by $1,673,875.

Huron-Clinton Metropolitan Authority Management’s Discussion and Analysis
December 31, 2018
2 - 7
The following paragraphs present a summary of general fund revenues, which totaled $54,184,230 for 2018, an overall increase of $2,210,341 from 2017. Revenues by source were as follows:
Amount of Percent of2018 Percent 2017 Increase Increase
Revenues Amount of Total Amount (Decrease) (Decrease)
Property taxes 31,675,974$ 58.5% 30,658,374$ 1,017,600$ 3.3%Park charges for services 19,328,560 35.7% 19,340,845 (12,285) -0.1%Interest 707,124 1.3% 449,196 257,928 57.4%Grants 976,902 1.8% 284,871 692,031 242.9%Donations 230,832 0.4% 245,687 (14,855) -6.0%Proceeds from sale of capital assets 473,716 0.9% 643,421 (169,705) -26.4%Other revenue 791,122 1.5% 351,495 439,627 125.1%
Totals 54,184,230$ 100.0% 51,973,889$ 2,210,341$ 4.3%
The Authority’s millage rate declined to 0.2140 mills in 2018 from 0.2146. The millage rate had been at 0.2146 since the recession in 2008. Taxable values increased from the prior year which contributed to the $1.0 million (3.3 percent) increase in 2018 property tax collections. We expect taxable values to continue to rise triggering further roll-backs of the millage rate and mitigating recovery of property tax revenue generated. The $19,328,560 of 2018 park operating revenues were under the 2018 budget goal of $19,870,872 by $542,312 (2.8 percent). This represented a $12,285 (0.1 percent) decrease from 2017 revenues. The Authority’s two leading sources of revenue are tolling and golf. Interest income derived from investments in Certificates of Deposits and U.S. Agency issues increased to $707,124 in 2018. This was a 57 percent increase from 2017 interest income. The Authority recognized $976,902 in grant revenue in 2018. This includes $850,000 grant revenue earned that was deferred in the 2017. Total grant revenue increased $692,031 from 2017. Other revenues increased $439,627 from 2017.

Huron-Clinton Metropolitan Authority Management’s Discussion and Analysis
December 31, 2018
2 - 8
General fund expenditures were $46,480,841 for 2018, a decrease of $8,546,119 from 2017’s expenditures. A detailed breakdown of expenditures by major category is as follows:
Amount of Percent of2018 Percent 2017 Increase Increase
Expenditures Amount of Total Amount (Decrease) (Decrease)
Capital improvements -$ 0.0% 7,523,357$ (7,523,357)$ -100.0%Equipment 1,836,785 4.0% 2,801,066 (964,281) -34.4%Land acquisition - 0.0% 10,900 (10,900) -100.0%Major maintenance 2,546,141 5.5% 2,270,033 276,108 12.2%Administrative office 9,254,259 19.9% 9,122,348 131,911 1.4%Park operations 32,843,656 70.7% 33,299,256 (455,600) -1.4%
Totals 46,480,841$ 100.0% 55,026,960$ (8,546,119)$ -15.5%
Capital improvement outlays cover both the design and construction costs associated with capital improvement projects that exceed the Authority’s $10,000 capitalization limit and develop or add to a capital asset. Engineering, Planning and other staff time that is directly related to the design or construction of these projects is included in the cost of the capital improvement. During 2018, the Authority added a capital projects fund and spent nearly $2.1 million on capital projects within the Metropark system. This was a 5.4 million dollar decrease compared with the amount spent in the 2017 general fund. The vast majority of 2018 projects continue to relate to the 3-R’s type projects (repair, renovate and replace) in accordance with the Board of Commissioner approved revised Five-Year Plan. These projects enhanced the Authority’s recreational facilities offered the public in terms of park roads, hike/bike trails, parking lots, buildings, utilities, landscaping, golf courses, and other improvements. Many of the more significant 2018 capital projects have been previously highlighted under the MAJOR INITIATIVES section of this report. Equipment having an individual value in excess of $5,000 is capitalized. During 2018, a total of $1,836,785 was spent equipping the Metroparks system, down from the 2017 amount of $964,281. Auto and truck acquisitions totaled approximately $878,000. Heavy equipment (mowers, tractors, golf cars, etc.) purchases accounted for approximately $769,000. $190,000 of purchases related to other equipment such as pontoon boat, a walk in freezer and other equipment. The Authority classifies all non-recurring repair/maintenance-type projects that exceed $10,000 as Major Maintenance expenses. These projects do not substantially improve or alter an existing facility and, therefore, are not capitalized. During 2018, major maintenance costs for various projects was $2,546,141.


Huron-Clinton Metropolitan Authority Management’s Discussion and Analysis
December 31, 2018
2 - 10
General Fund Budgetary Highlights Over the course of the year, the Authority’s Board of Commissioners amended the budget to account for changes made necessary due to unanticipated events or situations requiring increased expenditures for operations or capital activities. The original General Fund budget anticipated a $7,212,494 use of fund balance, while the final amended budget increased this to $8,563,046. The actual change in fund balance for the 2018 fiscal year was a decrease of $1,673,875. During the year, general fund revenues were over final budgetary estimates in total by $1,109,679. Park operating revenues fell short of the budgeted target of $19,870,872 by $542,312. This was offset by $1,180,871 more of interest and other revenues then the budget anticipated. Park operation and administrative expenditures were significantly less than anticipated by approximately $3,327,497. Major maintenance expenditures were less than projected, coming in approximately $1,936,637 under final budget projections. This is due to some projects being delayed or deemed not necessary at this time. Capital expenditures were under budget by approximately $416,301, resulting mainly from the amount of equipment purchased. Capital Assets and Debt Administration Capital assets. The Authority’s investment in capital assets for its governmental-type activities as of December 31, 2018 amounted to $194,826,998 (net of accumulated depreciation). This investment in capital assets includes land, land improvements (golf courses, etc.), buildings, roads, bridges, sewer/water systems, park facilities, and equipment. The total decrease in the Authority’s investment in capital assets (net of depreciation) for the year totaled $2,416,197 (1.2 percent).

Huron-Clinton Metropolitan Authority Management’s Discussion and Analysis
December 31, 2018
2 - 12
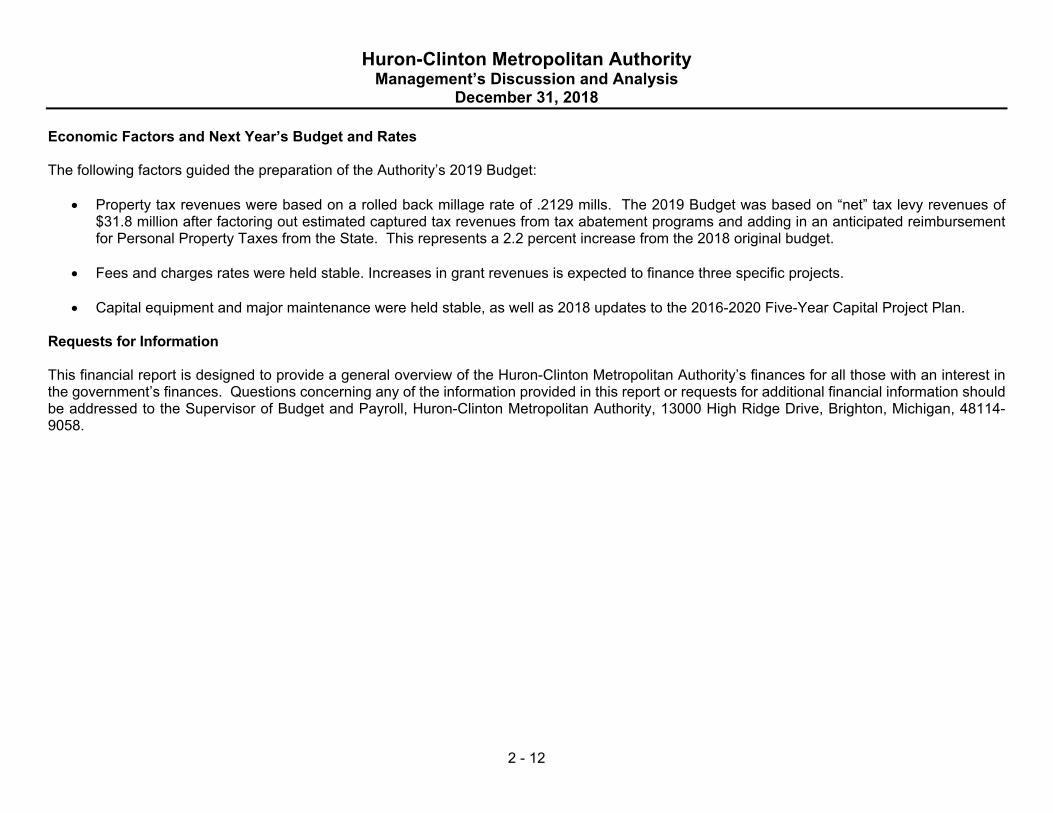
Economic Factors and Next Year’s Budget and Rates The following factors guided the preparation of the Authority’s 2019 Budget:
Property tax revenues were based on a rolled back millage rate of .2129 mills. The 2019 Budget was based on “net” tax levy revenues of $31.8 million after factoring out estimated captured tax revenues from tax abatement programs and adding in an anticipated reimbursement for Personal Property Taxes from the State. This represents a 2.2 percent increase from the 2018 original budget.
Fees and charges rates were held stable. Increases in grant revenues is expected to finance three specific projects.
Capital equipment and major maintenance were held stable, as well as 2018 updates to the 2016-2020 Five-Year Capital Project Plan. Requests for Information This financial report is designed to provide a general overview of the Huron-Clinton Metropolitan Authority’s finances for all those with an interest in the government’s finances. Questions concerning any of the information provided in this report or requests for additional financial information should be addressed to the Supervisor of Budget and Payroll, Huron-Clinton Metropolitan Authority, 13000 High Ridge Drive, Brighton, Michigan, 48114-9058.

BASIC FINANCIAL STATEMENTS
GovernmentalActivities
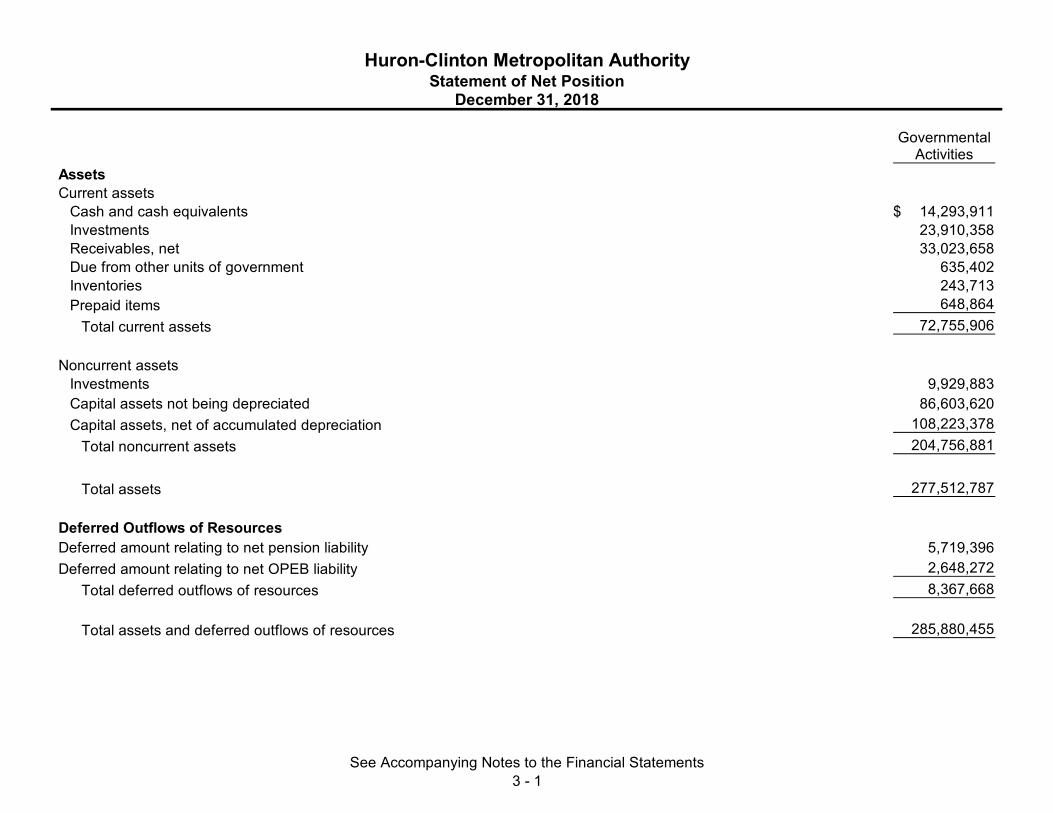
AssetsCurrent assets
Cash and cash equivalents 14,293,911$ Investments 23,910,358 Receivables, net 33,023,658 Due from other units of government 635,402 Inventories 243,713 Prepaid items 648,864
Total current assets 72,755,906
Noncurrent assetsInvestments 9,929,883 Capital assets not being depreciated 86,603,620 Capital assets, net of accumulated depreciation 108,223,378
Total noncurrent assets 204,756,881
Total assets 277,512,787
Deferred Outflows of ResourcesDeferred amount relating to net pension liability 5,719,396 Deferred amount relating to net OPEB liability 2,648,272
Total deferred outflows of resources 8,367,668
Total assets and deferred outflows of resources 285,880,455
Huron-Clinton Metropolitan AuthorityStatement of Net Position
December 31, 2018
See Accompanying Notes to the Financial Statements3 - 1

GovernmentalActivities
Huron-Clinton Metropolitan AuthorityStatement of Net Position
December 31, 2018
LiabilitiesCurrent
Accounts payable 1,312,337$ Accrued and other liabilities 670,945 Unearned revenue 361,993 Compensated absences due within one year 1,114,649
Total current liabilities 3,459,924
Noncurrent liabilitiesCompensated absences due in more than one year 2,539,085 Net pension liability 25,166,089 Net OPEB liability 12,374,573
Total noncurrent liabilities 40,079,747
Total liabilities 43,539,671
Deferred Inflows of ResourcesProperty taxes levied for a subsequent period 31,222,433 Deferred amount relating to net pension liability 232,824 Deferred amount relating to net OPEB liability 133,368
Total deferred inflows of resources 31,588,625
Total liabilities and deferred inflows of resources 75,128,296
Net PositionInvestment in capital assets 194,826,998 Restricted for
Lake St. Clair Marina 365,128 Hudson Mills Canoe Livery 9,173
Unrestricted 15,550,860
Total net position 210,752,159$ See Accompanying Notes to the Financial Statements
3 - 2
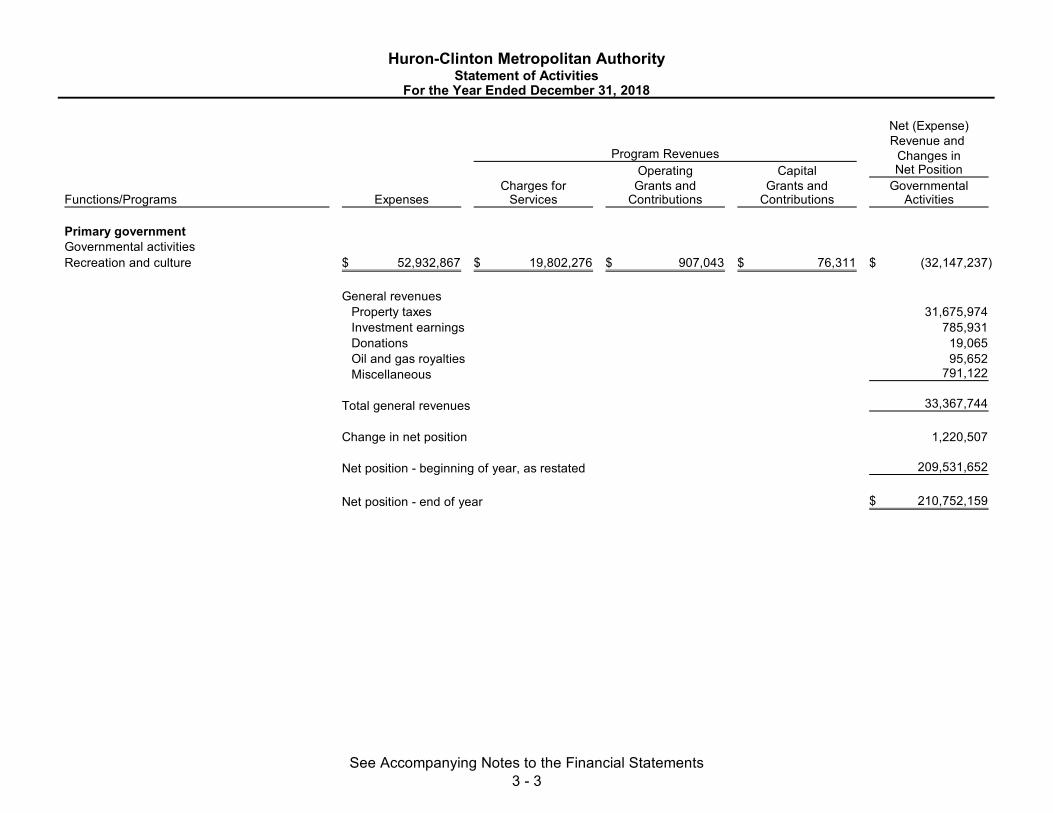
Net (Expense)Revenue and
Changes inOperating Capital Net Position
Charges for Grants and Grants and GovernmentalFunctions/Programs Expenses Services Contributions Contributions Activities
Primary governmentGovernmental activitiesRecreation and culture 52,932,867$ 19,802,276$ 907,043$ 76,311$ (32,147,237)$
General revenuesProperty taxes 31,675,974 Investment earnings 785,931 Donations 19,065 Oil and gas royalties 95,652 Miscellaneous 791,122
Total general revenues 33,367,744
Change in net position 1,220,507
Net position - beginning of year, as restated 209,531,652
Net position - end of year 210,752,159$
Program Revenues
Huron-Clinton Metropolitan AuthorityStatement of Activities
For the Year Ended December 31, 2018
See Accompanying Notes to the Financial Statements3 - 3

SupplementalMajor Capital
General Maintenance Projects TotalAssetsCash and cash equivalents 9,405,256$ 4,888,655$ -$ 14,293,911$ Investments 33,840,241 - - 33,840,241 Receivables
Property taxes, net 32,663,082 - - 32,663,082 Accounts receivable 349,934 10,642 - 360,576
Due from other units of government 635,402 - - 635,402 Due from other funds - - 7,476,617 7,476,617 Inventories 243,713 - - 243,713 Prepaid items 648,864 - - 648,864
Total assets 77,786,492$ 4,899,297$ 7,476,617$ 90,162,406$
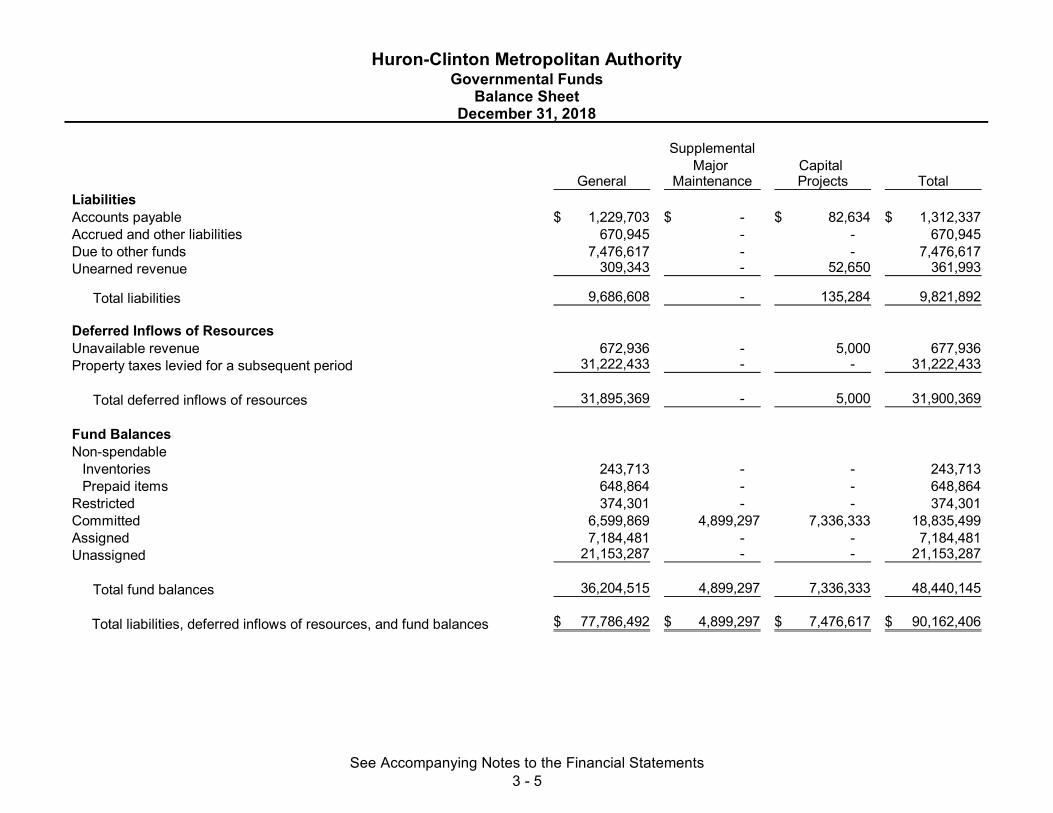
Huron-Clinton Metropolitan AuthorityGovernmental Funds
Balance SheetDecember 31, 2018
See Accompanying Notes to the Financial Statements3 - 4
SupplementalMajor Capital
General Maintenance Projects Total
Huron-Clinton Metropolitan AuthorityGovernmental Funds
Balance SheetDecember 31, 2018
LiabilitiesAccounts payable 1,229,703$ -$ 82,634$ 1,312,337$ Accrued and other liabilities 670,945 - - 670,945 Due to other funds 7,476,617 - - 7,476,617 Unearned revenue 309,343 - 52,650 361,993
Total liabilities 9,686,608 - 135,284 9,821,892
Deferred Inflows of ResourcesUnavailable revenue 672,936 - 5,000 677,936 Property taxes levied for a subsequent period 31,222,433 - - 31,222,433
Total deferred inflows of resources 31,895,369 - 5,000 31,900,369
Fund BalancesNon-spendable
Inventories 243,713 - - 243,713 Prepaid items 648,864 - - 648,864
Restricted 374,301 - - 374,301 Committed 6,599,869 4,899,297 7,336,333 18,835,499 Assigned 7,184,481 - - 7,184,481 Unassigned 21,153,287 - - 21,153,287
Total fund balances 36,204,515 4,899,297 7,336,333 48,440,145
Total liabilities, deferred inflows of resources, and fund balances 77,786,492$ 4,899,297$ 7,476,617$ 90,162,406$
See Accompanying Notes to the Financial Statements3 - 5

Total fund balances for governmental funds 48,440,145$
Total net position for governmental activities in the statement of net position is different because:
Capital assets net of accumulated depreciation used in governmental activities are not financial resources and therefore are not reported in the funds. 108,223,378
Capital assets not being depreciated used in governmental activities are not financial resources and therefore are not reported in the funds. 86,603,620
Long-term receivables are not available to pay for current period expenditures and are therefore deferred inflows ofresources in the governmental funds. 677,936
Deferred outflows (inflows) of resources. Deferred inflows of resources resulting from net pension liability (232,824) Deferred inflows of resources resulting from net OPEB liability (133,368) Deferred outflow of resources resulting from net pension liability 5,719,396 Deferred outflow of resources resulting from net OPEB liability 2,648,272
Long-term liabilities applicable to governmental activities are not due and payable in the current period and, accordingly,are not reported as fund liabilities. Compensated absences (3,653,734) Net pension liability (25,166,089) Net OPEB liability (12,374,573)
Net position of governmental activities 210,752,159$
Huron-Clinton Metropolitan Authority
Reconciliation of Fund Balances of Governmental Fundsto Net Position of Governmental Activities
December 31, 2018
Governmental Funds
See Accompanying Notes to the Financial Statements3 - 6

SupplementalMajor Capital
General Maintenance Projects TotalRevenuesProperty taxes 31,675,974$ -$ -$ 31,675,974$ Oil and gas royalties - 95,652 - 95,652 Operating grants 976,902 - 71,311 1,048,213 Donations 230,832 - 18,274 249,106 Charges for services 19,328,560 - - 19,328,560 Interest income 707,124 78,807 - 785,931 Other revenue 791,122 - - 791,122
Total revenues 53,710,514 174,459 89,585 53,974,558
ExpendituresCurrent
OperatingPark operations 32,843,656 - - 32,843,656 Major maintenance 2,546,141 - - 2,546,141 Administrative offices 9,254,259 - - 9,254,259
Total operating 44,644,056 - - 44,644,056
Huron-Clinton Metropolitan AuthorityGovernmental Funds
Statement of Revenues, Expenditures and Changes in Fund BalancesFor the Year Ended December 31, 2018
See Accompanying Notes to the Financial Statements3 - 7

SupplementalMajor Capital
General Maintenance Projects Total
Huron-Clinton Metropolitan AuthorityGovernmental Funds
Statement of Revenues, Expenditures and Changes in Fund BalancesFor the Year Ended December 31, 2018
Capital outlayCapital improvements -$ -$ 2,130,516$ 2,130,516$ Equipment 1,836,785 - - 1,836,785
Total capital outlay 1,836,785 - 2,130,516 3,967,301
Total expenditures 46,480,841 - 2,130,516 48,611,357
Excess (deficiency) of revenues over expenditures 7,229,673 174,459 (2,040,931) 5,363,201
Other financing sourcesTransfers in - - 9,377,264 9,377,264 Transfers out (9,377,264) - - (9,377,264) Proceeds from sale of capital assets 473,716 - - 473,716
Total other financing sources and uses (8,903,548) - 9,377,264 473,716
Net change in fund balance (1,673,875) 174,459 7,336,333 5,836,917
Fund balance - beginning of year 37,878,390 4,724,838 - 42,603,228
Fund balance - end of year 36,204,515$ 4,899,297$ 7,336,333$ 48,440,145$
See Accompanying Notes to the Financial Statements3 - 8

Net change in fund balances - total governmental funds 5,836,917$
Depreciation expense (6,315,756) Capital outlay 3,953,909 Net book value of disposed capital assets (54,350)
Revenues in the statement of activities that do not provide current financial resources are not reported as revenuein the funds.
Change in unavailable revenue (294,900)
Expenses are recorded when incurred in the statement of activities. Net change in compensated absences 115,225
The statement of net position reports the net pension liability and related deferred outflows and inflows of resources.However, the amount recorded on the governmental funds equals actual pension contributions. Change in net pension liability (6,219,237) Net change in the deferred inflows of resources related to the net pension liability 3,637,285 Net change in the deferred outflows of resources related to the net pension liability 711,064
The statement of net position reports the net OPEB liability and deferred outflows of resources and deferred inflowsrelated to the net OPEB liability and pension expense. However, the amount recorded on the governmental funds equals actual OPEB contributions. Change in net OPEB liability (2,664,554) Net change in the deferred inflows of resources related to the net OPEB liability (133,368) Net change in the deferred outflows of resources related to the net OPEB liability 2,648,272
Change in net position of governmental activities 1,220,507$
For the Year Ended December 31, 2018
Huron-Clinton Metropolitan AuthorityGovernmental Funds
Reconciliation of the Statement of Revenues, Expenditures and Changes in Fund Balancesof Governmental Funds to the Statement of Activities
Total change in net position reported for governmental activities in the statement of activities is different because:
See Accompanying Notes to the Financial Statements3 - 9

AssetsInvestments
Equity mutual funds 36,639,134$ Fixed income mutual funds 40,063,262 Collective investment trust 6,354,545
Receivables 87,748 Prepaids 117,865
Total assets 83,262,554
LiabilitiesVouchers payable 97,469
Net PositionRestricted for pension benefits 55,796,910 Restricted for other post-employment benefits 27,368,175
Total net position 83,165,085$
Huron-Clinton Metropolitan AuthorityFiduciary Funds
Statement of Net PositionDecember 31, 2018
See Accompanying Notes to the Financial Statements3 - 10

AdditionsInvestment earnings (losses)
Interest 2,022,653$ Net decrease in fair value of investments (5,891,076)
Total investment earnings (losses) (3,868,423)
ContributionsEmployer 4,500,000 Plan members 91,815
Total contributions 4,591,815
Total additions 723,392
DeductionsBenefits 5,977,788 Administrative expenses 389,666
Total deductions 6,367,454
Change in net position (5,644,062)
Net position - beginning of year 88,809,147
Net position - end of year 83,165,085$
Huron-Clinton Metropolitan AuthorityFiduciary Funds
Statement of Changes in Net PositionFor the Year Ended December 31, 2018
See Accompanying Notes to the Financial Statements3 - 11
Huron-Clinton Metropolitan Authority Notes to the Financial Statements
December 31, 2018
3 - 12
Note 1 - Summary of Significant Accounting Policies
Reporting entity The Huron-Clinton Metropolitan Authority (the Authority) was created in 1939 as a special district form of government to provide recreational facilities and services to residents of Livingston, Macomb, Oakland, Washtenaw, and Wayne Counties. The Authority is governed by a Board of Commissioners, which consists of a Commissioner appointed by the Board of Commissioners from each of the five participating counties, and two Commissioners appointed by the Governor of Michigan. Principal funding for the Authority is derived from a property tax levy assessed in each of the five participating counties. The financial statements of the Authority have been prepared in accordance with accounting principles generally accepted in the United States of America (GAAP) as applied to governments. The Governmental Accounting Standards Board is the accepted standard-setting body for establishing governmental accounting and financial reporting principles. The Authority’s more significant accounting policies are described below. The Authority has determined that no entities should be consolidated into its basic financial statements as component units. The criteria for including a component unit include entries for which the government is considered to be financially accountable. Therefore, the reporting entity consists only of the primary government. Government-wide and fund financial statements The government-wide financial statements (i.e., the statement of net position and the statement of changes in activities) report information on all of the nonfiduciary activities of the primary government. The statement of activities demonstrates the degree to which the direct expenses of a given function or segments are offset by program revenues. Direct expenses are those that are clearly identifiable with
a specific function or segment. Program revenues include 1) charges to customers or applicants who purchase, use, or directly benefit from goods, services, or privileges provided by a given function or segment and 2) grants and contributions that are restricted to meeting the operational or capital requirements of a particular function or segment. Taxes and other items not properly included among program revenues are reported instead as general revenues. This includes all taxes, contributions, and oil and gas royalties and shows how governmental functions are either self-financing or supported by general revenues. Separate financial statements are provided for governmental funds and fiduciary funds, even though the latter are excluded from the government-wide financial statements. Major individual governmental funds are reported as separate columns in the fund financial statements. Measurement focus, basis of accounting, and financial statement presentation The government-wide financial statements are reported using the economic resources measurement focus and the accrual basis of accounting, as are the fiduciary fund financial statements. Revenues are recorded when earned and expenses are recorded when a liability is incurred, regardless of the timing of related cash flows. Property taxes are recognized as revenues in the year for which they are levied. Grants and similar items are recognized as revenue as soon as all eligibility requirements imposed by the provider have been met. Governmental fund financial statements are reported using the current financial resources measurement focus and the modified accrual basis of accounting. Revenues are recognized as soon as they are both measurable and available. Revenues are considered to be available when they are collectible within the current period or soon enough thereafter to pay liabilities of the current period. For this purpose, the government considers revenues to be available if they

Huron-Clinton Metropolitan Authority Notes to the Financial Statements
December 31, 2018
3 - 13
are collected within 60 days of the end of the current fiscal period. Expenditures generally are recorded when a liability is incurred, as under accrual accounting. However, debt service expenditures, as well as expenditures related to compensated absences and claims and judgments, are recorded only when payment is due. The Authority reports the following major governmental funds:
The General Fund is the Authority’s primary operating fund. It accounts for all financial resources of the general government, except those required to be accounted for in another fund.
The Supplemental Major Maintenance Fund is used to record supplemental major maintenance projects of the Authority, which are nonrecurring expenditures to repair or replace existing park facilities. As designated by the Authority, oil and gas revenues received are earmarked to fund these projects. The Capital Projects Fund is used to account for capital improvement projects which result in the development of tangible assets. Funding is provided by the General Fund.
In addition, the Authority reports pension and other post-employment benefit trust funds, which account for the Authority’s single employer, defined benefit pension plan and other post-employment benefits plan. These plans accumulate resources for pension benefit and other post-employment benefit payments to qualified Authority employees. The funds are based on the Plans’ December 31 fiscal year ends. As a general rule the effect of interfund activity has been eliminated from the government-wide financial statements. Assets, liabilities, and net position or equity Deposits and investments – Cash and cash equivalents are
considered to be cash on hand, demand deposits, and short-term investments with a maturity of three months or less when acquired. Investments are stated at fair value based. Certificate of deposits are stated at cost which approximates fair value. Receivables and payables – In general, outstanding balances between funds are reported as “due to/from other funds.” Activity between funds that is representative of a lending/borrowing arrangement outstanding at the end of the fiscal year is referred to as “advances to/from other funds.” Property tax receivables are shown as net of allowance for uncollectible amounts. The Authority considers all accounts receivable to be fully collectible; accordingly, no allowance for uncollectible amounts is recorded. Property tax receivables are shown net of an allowance for uncollectible amounts of $47,000. Property taxes are levied on each December 1st on the taxable valuation of property as of the preceding December 31st. Taxes are considered delinquent on March 1st of the following year, at which time penalties and interest are assessed. The 2017 taxable valuation of the Authority totaled $143,627,242,079, on which ad valorem taxes consisted of 0.2140 mills for operating purposes. This resulted in $31,675,974 for operating expenses, exclusive of any Michigan Tax Tribunal or Board of Review adjustments. Inventories and prepaid items – Inventories are valued at average cost. Inventories of governmental funds are recorded as expenditures when consumed rather than when purchased. Certain payments to vendors reflect costs applicable to future fiscal years. For such payments in governmental funds the Authority follows the consumption method, and they therefore are presented as prepaid items in both government-wide and fund financial statements.

Huron-Clinton Metropolitan Authority Notes to the Financial Statements
December 31, 2018
3 - 14
Unearned revenue – The Authority has recorded unearned revenue in the fund financial statements and government-wide financial statements equaling the amount of pledged revenue from park patrons and cash received in advance of being earned/used for the subsequent year’s activities. Capital assets – Capital assets, which include property, buildings, equipment, other improvements and infrastructure (roads, bridges, paved pathways, and water/sewer lines), are reported in the applicable governmental activities column in the government-wide financial statements. Capital assets are defined by the government as assets with an initial individual cost of more than $5,000 for equipment and $10,000 for all other assets, and an estimated useful life in excess of one year. Such assets are recorded at historical cost or estimated historical cost, if purchased or constructed. Donated capital assets are reported at acquisition value. The reported value excludes normal maintenance and repairs which are essentially amounts spent in relation to capital assets that do not increase the capacity or efficiency of the item or extend its useful life beyond the original estimate. In the case of donations the government values these capital assets at the estimated fair value of the item at the date of its donation. Capital assets are depreciated using the straight-line method over the following useful lives:
Buildings 30 to 50 yearsEquipment 3 to 25 yearsOther improvements 15 to 60 yearsInfrastructure 15 to 50 years
Compensated absences – The Authority allows employees to earn annual leave benefits and sick leave termination bonuses based, in part, on length of service. Annual leave is fully vested when earned
and sick leave termination bonuses vest upon completion of ten years of service. Upon termination, employees are paid their accumulated sick leave termination bonuses and annual leave depending upon the nature of separation (death, retirement, or termination). All vacation pay is accrued when incurred in the government-wide fund financial statements. A liability for these amounts is reported in governmental funds only if they have matured, for example, as a result of employee resignations and retirements. Pensions and other post-employment benefit (OPEB) costs – For purposes of measuring the net pension and OPEB liabilities, deferred outflows of resources and deferred inflows of resources related to pensions and OPEB, and pension/OPEB expense, information about the fiduciary net positon of the Plans and additions to/deductions from Plan’s fiduciary net position have been determined on the same basis as they are reported to the Plans. For this purpose, benefit payments (including refunds of employee contributions) are recognized when due and payable in accordance with the benefit terms. Investments are reported at fair value. Deferred outflows of resources – A deferred outflow of resources is a consumption of net position by the government that is applicable to a future reporting period. The Authority reports deferred outflows of resources as a result of pension and OPEB investment earnings. These amounts are the result of a difference between what the plans are expected to earn from plans investments and what is actually earned. These amounts will be amortized over the next five years and included in pension and OPEB expense. Changes in assumptions and experience differences relating to the net pension and OPEB liabilities are deferred and amortized over the expected remaining services lives of the employees and retirees in the plan. Deferred inflows of resources – A deferred inflow of resources is an acquisition of net position by the government that is applicable to a future reporting period. For governmental funds this includes
Huron-Clinton Metropolitan Authority Notes to the Financial Statements
December 31, 2018
3 - 15
unavailable in connection with receivables for revenues that are not considered available to liquidate liabilities of the current period. Changes in assumptions and experience differences relating to the net pension and OPEB liabilities are deferred and amortized over the expected remaining services lives of the employees and retirees in the plan. Fund Balance – In the fund financial statements, governmental funds report fund balance in the following categories:
Non-spendable – assets that are not available in a spendable form. Restricted – amounts that are legally imposed or otherwise required by external parties to be used for a specific purpose. Committed – amounts constrained on use imposed by the government’s highest level of decision-making, its Board of Commissioners. A fund balance commitment may be established, modified, or rescinded by a resolution of the Board of Commissioners. Assigned – amounts intended to be used for specific purposes, as determined by Board of Commissioners. Residual amounts in governmental funds other than the general fund are automatically assigned by their nature. Unassigned – all other resources; the remaining fund balances after non-spendable, restrictions, commitments and assignments.
When an expenditure is incurred for purposes for which both restricted and unrestricted fund balance is available, the government’s policy is to consider restricted funds spent first.
When an expenditure is incurred for purposes for which committed, assigned, or unassigned amounts could be used, the government’s policy is to consider the funds to be spent in the following order: (1) committed, (2) assigned, (3) unassigned. Use of Estimates The preparation of financial statements in conformity with accounting principles generally accepted in the United States of America requires management to make estimates and assumptions that affect the reported amounts of assets, deferred outflows, liabilities, deferred inflows and disclosure of contingent assets and liabilities at the date of the financial statements and the reported amounts of revenue and expenses during the period. Actual results could differ from those estimates. Adoption of New Accounting Standards Statement No. 75, Accounting and Financial Reporting for Postemployment Benefits Other Than Pensions establishes standards for recognizing and measuring liabilities, deferred outflows of resources, deferred inflows of resources, and expense/expenditures. For defined OPEB plans, this Statement identifies the methods and assumptions that are required to be used to project benefit payments, discount projected benefit payments to their actuarial present value, and attribute that present value to periods of employee services. It also requires additional note disclosures and required supplementary information.
Statement No. 85, Omnibus 2017 addresses practice issues that were identified during implementation and application of certain GASB Statements. This statement covers issues related to blending component units, goodwill, fair value measurement and application, and postemployment benefits (pensions and other postemployment benefits).

Huron-Clinton Metropolitan Authority Notes to the Financial Statements
December 31, 2018
3 - 16
Upcoming Accounting and Reporting Changes In addition, the Governmental Accounting Standards Board has released the following Statements. Statement No. 84, Fiduciary Activities improves the guidance regarding the identification of fiduciary activities for accounting and financial reporting purposes and how those activities should be reported. The criteria generally is on (1) is the government controlling the assets of the fiduciary activity and (2) the beneficiaries with whom a fiduciary relationship exists. The four fiduciary funds that should be reported, if applicable: (1) pension (and other employee benefit) trust funds, (2) investment trust funds, (3) private-purpose trust funds, and (4) custodial funds. Custodial funds generally will report fiduciary activities that are not held in a trust or similar arrangement that meets specific criteria. The requirements of this Statement are effective for the fiscal year ending December 31, 2019.
Statement No. 87, Leases increases the usefulness of the financial statements by requiring recognition of certain lease assets and liabilities for leases that previously were classified as operating leases and recognized as inflows of resources or outflows of resources based on the payment provisions of the contract. It establishes a single model for lease accounting based on the foundational principle that leases are financings of the right to use an underlying asset. A lessee will be required to recognize a lease liability and an intangible right-to-use a lease asset, and a lessor will be required to recognize a lease receivable and a deferred inflow of resources, thereby enhancing the relevance and consistency of information about leasing activities. The requirements of this Statement are effective for the year ending December 31, 2020. The Authority is evaluating the impact that the above GASBs will have on its financial reporting.
Note 2 - Stewardship, Compliance, and Accountability
Budgetary information The Authority is subject to the budgetary control requirements of the Uniform Budgeting Act (P.A. 621 of 1978, as amended). A budget for the general fund is adopted, on a basis consistent with generally accepted accounting principles (GAAP), and is adopted on a category level (i.e. park operations, major maintenance, administrative offices, equipment, and transfers out). An operating budget including major maintenance, park operations, and general administration categories lapses at year end. Capital outlay budgets including engineering and general planning, capital improvements, equipment, and land acquisition categories do not lapse at year-end. No later than the December regular meeting, the Director submits to the Board of Commissioners a proposed operating budget for the fiscal year commencing the following January 1. Public hearings are held to obtain taxpayer comments and the budget is legally enacted through passage of an ordinance prior to January 1. The governing body must approve the budget and amendments, including supplemental appropriations at the category level. The Authority’s management can transfer appropriations between line items within a category without governing body approval.
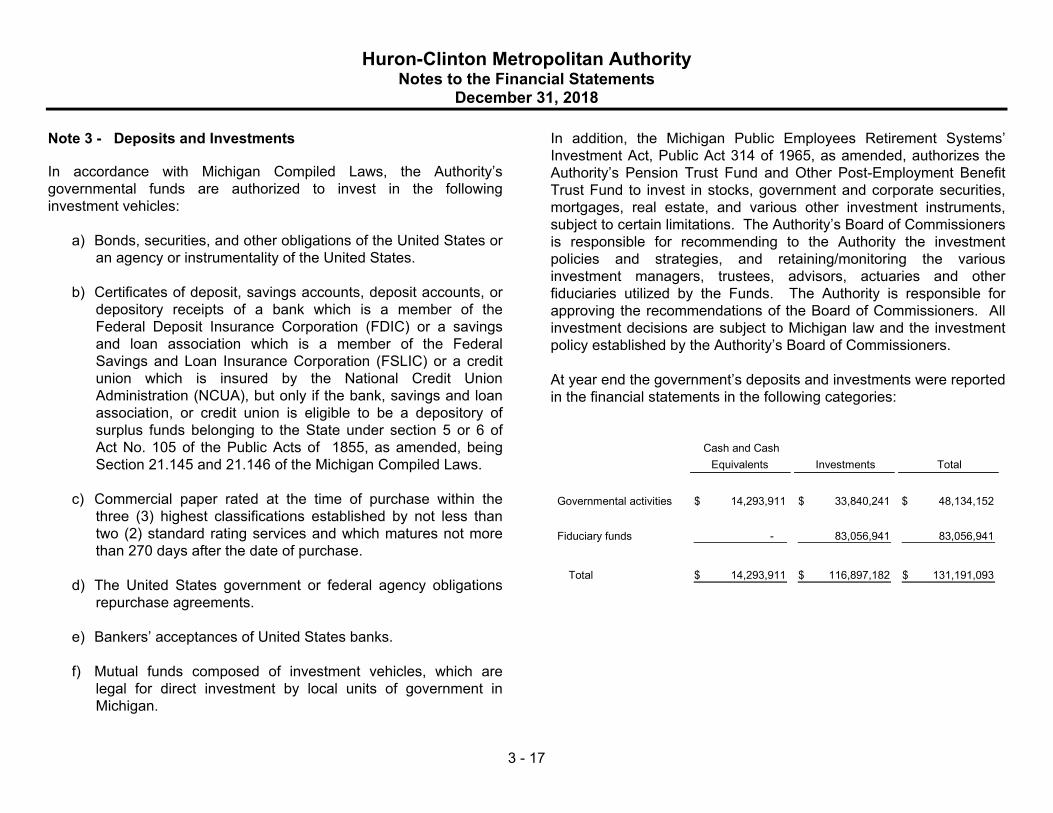
Huron-Clinton Metropolitan Authority Notes to the Financial Statements
December 31, 2018
3 - 17
Note 3 - Deposits and Investments
In accordance with Michigan Compiled Laws, the Authority’s governmental funds are authorized to invest in the following investment vehicles:
a) Bonds, securities, and other obligations of the United States or an agency or instrumentality of the United States.
b) Certificates of deposit, savings accounts, deposit accounts, or
depository receipts of a bank which is a member of the Federal Deposit Insurance Corporation (FDIC) or a savings and loan association which is a member of the Federal Savings and Loan Insurance Corporation (FSLIC) or a credit union which is insured by the National Credit Union Administration (NCUA), but only if the bank, savings and loan association, or credit union is eligible to be a depository of surplus funds belonging to the State under section 5 or 6 of Act No. 105 of the Public Acts of 1855, as amended, being Section 21.145 and 21.146 of the Michigan Compiled Laws.
c) Commercial paper rated at the time of purchase within the
three (3) highest classifications established by not less than two (2) standard rating services and which matures not more than 270 days after the date of purchase.
d) The United States government or federal agency obligations
repurchase agreements.
e) Bankers’ acceptances of United States banks.
f) Mutual funds composed of investment vehicles, which are legal for direct investment by local units of government in Michigan.
In addition, the Michigan Public Employees Retirement Systems’ Investment Act, Public Act 314 of 1965, as amended, authorizes the Authority’s Pension Trust Fund and Other Post-Employment Benefit Trust Fund to invest in stocks, government and corporate securities, mortgages, real estate, and various other investment instruments, subject to certain limitations. The Authority’s Board of Commissioners is responsible for recommending to the Authority the investment policies and strategies, and retaining/monitoring the various investment managers, trustees, advisors, actuaries and other fiduciaries utilized by the Funds. The Authority is responsible for approving the recommendations of the Board of Commissioners. All investment decisions are subject to Michigan law and the investment policy established by the Authority’s Board of Commissioners. At year end the government’s deposits and investments were reported in the financial statements in the following categories:
Cash and Cash Equivalents Investments Total
Governmental activities 14,293,911$ 33,840,241$ 48,134,152$
Fiduciary funds - 83,056,941 83,056,941
Total 14,293,911$ 116,897,182$ 131,191,093$

Huron-Clinton Metropolitan Authority Notes to the Financial Statements
December 31, 2018
3 - 18
The breakdown between deposits and investments is as follows:
Primary Government Fiduciary Funds Total
Bank deposits (checking, savings accounts, and money markets) 14,260,261$ -$ 14,260,261$
Investments in securities, mutual funds, and similar vehicles 33,840,241 83,056,941 116,897,182
Petty cash and cash on hand 33,650 - 33,650
48,134,152$ 83,056,941$ 131,191,093$
As of year end, the Authority had the following investments:
Average WeightedFair S & P Average
Investment Value Rating Maturity
U.S. agencies 9,929,883$ AA+ 0.56Certificates of deposit 23,910,358 Not rated 0.64Equity mutual funds 36,639,134 Not rated N/AFixed income mutual funds 40,063,262 B+ to AA- 13.38Collective investment funds 6,354,545 Not rated N/A
116,897,182$
Interest rate risk – State law limits the allowable investments and the maturities of some of the allowable investments as identified in the above list of authorized investments. The Authority’s investment policy does not have specific limits in excess of State law on investment maturities as a means of managing its exposure to fair value losses arising from increasing interest rates. Credit risk – State law limits investments to specific government securities, certificates of deposit and bank accounts with qualified institutions, commercial paper with specific maximum maturities and ratings when purchased, bankers acceptances of specific financial institutions, qualified mutual funds and qualified external investment pools as identified in the list of authorized investments above. Incompliance with State law, the Authority’s investment policy limits investments to the top two ratings issued by nationally recognized statistical rating organizations. As of December 31, 2018, the Authority’s investments were within these guidelines. The investment policy adopted by the Board of Commissioners, in accordance with Public Act 196 of 1997, is in accordance with statutory authority. Concentration of credit risk – State law limits allowable investments but does not limit concentration of credit risk as identified in the list of authorized investments above. The Authority’s investment policy does not have specific limits in excess of state law on concentration of credit risk. The investments that exceed 5 percent of the Authority’s total investments are in mutual funds, investment pools, and U.S. agencies securities. All investments held at year-end are reported above. Custodial credit risk - deposits – In the case of deposits, this is the risk that in the event of bank failure, the government’s deposits may not be returned to it. The government does not have a policy for custodial credit risk. As of year-end, $14,070,664 was exposed to

Huron-Clinton Metropolitan Authority Notes to the Financial Statements
December 31, 2018
3 - 19
custodial credit risk because it was uninsured and uncollateralized. Custodial credit risk – For an investment, custodial credit risk is the risk that, in the event of the failure of the counterparty, the Authority will not be able to recover the value of its investments or collateral securities that are in the possession of an outside party. State law does not require and the Authority does not have a policy for investment custodial credit risk. On the investments listed above, there is no custodial credit risk, as these investments are either uninsured, unregistered, or held by a counterparty in the Authority’s name or are uncategorized as to credit risk. Note 4 - Fair Value Measurements
The Authority categorizes its fair value measurements within the fair value hierarchy established by generally accepted accounting principles. The hierarchy is based on the valuation inputs used to measure the fair value of the asset. Level 1 inputs are quoted prices in active markets for identical assets; Level 2 inputs are significant other observable inputs; and Level 3 inputs are significant unobservable inputs. The Authority has the following recurring fair value measurements as of December 31, 2018: • Equity and fixed income mutual funds of $76.70 million are valued using quoted market prices (Level 1 inputs) • U.S. agency securities of $9.93 million are valued as described below (Level 2 inputs). • The collective investment funds are valued at net asset value (NAV) and are therefore uncategorized as to fair value level. Following is a description of the valuation methodologies used for instruments measured at fair value on a recurring basis and
recognized in the accompanying financial statements, as well as the general classification of such instruments pursuant to the valuation hierarchy. The investments in U.S. agencies are valued based on prices obtained by the investment custodian from independent quotation bureaus that use computerized valuation formulas to calculate current values. The collective investment funds are valued based on a net asset value that is obtained by the investment advisor from the funds. The collective investment funds are subject to a quarterly redemption process that requires 65 days pre-notification. Funds are redeemable at NAV. There is also a 10% holdback on final payments under which the amount is held in escrow until completion of the fund’s audit. Note 5 - Receivables
Receivables as of year-end for the governmental activities in the aggregate are as follows:
Primary governmentTaxes 32,663,082$ Accrued interest and other 360,576
33,023,658$
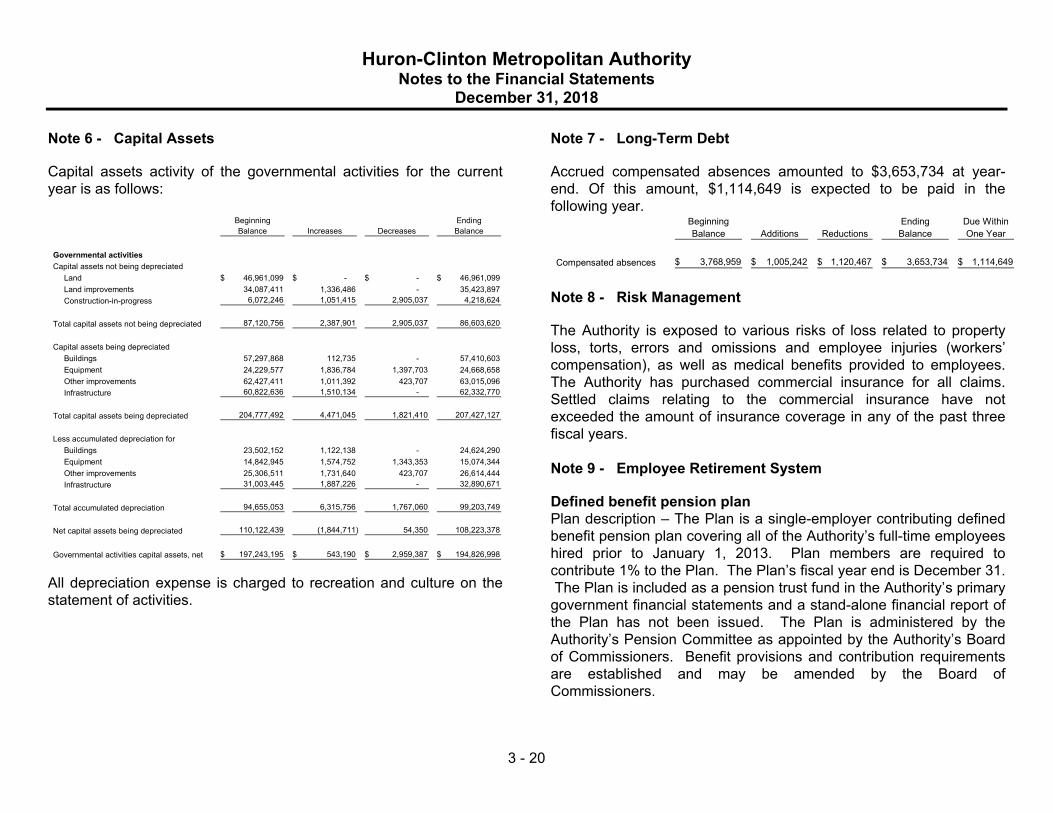
Huron-Clinton Metropolitan Authority Notes to the Financial Statements
December 31, 2018
3 - 20
Note 6 - Capital Assets
Capital assets activity of the governmental activities for the current year is as follows:
Beginning EndingBalance Increases Decreases Balance
Governmental activitiesCapital assets not being depreciated
Land 46,961,099$ -$ -$ 46,961,099$ Land improvements 34,087,411 1,336,486 - 35,423,897 Construction-in-progress 6,072,246 1,051,415 2,905,037 4,218,624
Total capital assets not being depreciated 87,120,756 2,387,901 2,905,037 86,603,620
Capital assets being depreciatedBuildings 57,297,868 112,735 - 57,410,603 Equipment 24,229,577 1,836,784 1,397,703 24,668,658 Other improvements 62,427,411 1,011,392 423,707 63,015,096 Infrastructure 60,822,636 1,510,134 - 62,332,770
Total capital assets being depreciated 204,777,492 4,471,045 1,821,410 207,427,127
Less accumulated depreciation forBuildings 23,502,152 1,122,138 - 24,624,290 Equipment 14,842,945 1,574,752 1,343,353 15,074,344 Other improvements 25,306,511 1,731,640 423,707 26,614,444 Infrastructure 31,003,445 1,887,226 - 32,890,671
Total accumulated depreciation 94,655,053 6,315,756 1,767,060 99,203,749
Net capital assets being depreciated 110,122,439 (1,844,711) 54,350 108,223,378
Governmental activities capital assets, net 197,243,195$ 543,190$ 2,959,387$ 194,826,998$
All depreciation expense is charged to recreation and culture on the statement of activities.
Note 7 - Long-Term Debt
Accrued compensated absences amounted to $3,653,734 at year-end. Of this amount, $1,114,649 is expected to be paid in the following year.
Beginning Ending Due WithinBalance Additions Reductions Balance One Year
Compensated absences 3,768,959$ 1,005,242$ 1,120,467$ 3,653,734$ 1,114,649$
Note 8 - Risk Management
The Authority is exposed to various risks of loss related to property loss, torts, errors and omissions and employee injuries (workers’ compensation), as well as medical benefits provided to employees. The Authority has purchased commercial insurance for all claims. Settled claims relating to the commercial insurance have not exceeded the amount of insurance coverage in any of the past three fiscal years. Note 9 - Employee Retirement System
Defined benefit pension plan Plan description – The Plan is a single-employer contributing defined benefit pension plan covering all of the Authority’s full-time employees hired prior to January 1, 2013. Plan members are required to contribute 1% to the Plan. The Plan’s fiscal year end is December 31. The Plan is included as a pension trust fund in the Authority’s primary government financial statements and a stand-alone financial report of the Plan has not been issued. The Plan is administered by the Authority’s Pension Committee as appointed by the Authority’s Board of Commissioners. Benefit provisions and contribution requirements are established and may be amended by the Board of Commissioners.

Huron-Clinton Metropolitan Authority Notes to the Financial Statements
December 31, 2018
3 - 21
Benefits provided – The Plan provides eligible participants with retirement benefits as well as disability benefits. All retirement benefits fully vest after ten years of credited service, with partial vesting granted for service less than ten years. Employees who retire at age 65 are entitled to an annual retirement benefit, payable monthly in an amount equal to 2% of the highest consecutive five year average monthly earnings in the last ten years of service, with a maximum monthly benefit of 71% of the final average monthly earnings. Employees may retire at age 60 with an unreduced benefit only if they have 25 or more years of service at early retirement. Employees retiring at age 55 with ten years credited service are entitled to receive a reduced monthly retirement benefit. The Plan’s financial statements are prepared using the accrual basis of accounting. The Authority’s contributions to the Plan are recognized when due and the employer has made a formal commitment to provide the contributions. Benefits and refunds are recognized when due and payable in accordance with the terms of the plan. The administrative costs are financed through investment earnings. Employees covered by benefit terms – At the December 31, 2018 valuation date, the following employees, which is closed to new members, were covered by benefit terms:
Inactive employees or beneficiaries currently receiving benefits 171 Inactive employees entitled to, but not yet receiving benefits 17 Active employees 128
316
Investment Policy – The Authority maintains an investment policy for the Plan which permits 5% to 40% of Pension Trust Fund assets to be invested in high quality fixed income securities, 15% to 50% in equity
type securities and 25% to 60% in guaranteed rate of return contracts. Equity investments and bonds are reported at fair value. Investments for which market quotations are not readily available are valued at their fair values as determined by the custodian under the direction of the Authority’s Pension Committee. The investments of the pension trust fund are not federally insured. Contributions – The annual required contribution for the current period was determined as part of the December 31, 2018 actuarial valuation using the individual entry age actuarial cost method. Benefits are funded on a level percentage of earnings from each participant’s date of participation to assumed retirement date. The effects of plan amendments and changes in assumptions are amortized over 30 years. Smoothed asset value spreads the difference between the assumed return and the actual investment return over a five (5) year period and was used to determine the actuarial value of assets. The amortization methods used are either 30-year, level percent of payroll dollar method or a 5-year level dollar method depending on participation in the 2013 early retirement window or not, where the effect of plan amendment and changes in assumptions are amortized over 30 years on a closed basis. The remaining amortization periods as of December 31, 2018 were 23.75 and 0.75 years. Gains and losses are not separately amortized but reduce or increase the amortization balances and payments. Net pension liability – The employer’s net pension liability was measured as of December 31, 2018, and the total pension liability used to calculate the net pension liability was determined by an annual actuarial valuation as of that date.

Huron-Clinton Metropolitan Authority Notes to the Financial Statements
December 31, 2018
3 - 22
Actuarial assumptions – The total pension liability in the December 31, 2018, annual actuarial valuation was determined using the following actuarial assumptions, applied to all periods included in the measurement: Inflation: 3.50% Salary increases: 3.69% - 7.25% including inflation. Investment rate of return: 6.75% Mortality: RP-2014 Generational Mortality Table for males and females, extended via cubic spline. This table is adjusted backwards to 2006 with the MP-2014 scale, resulting in a base year of 2006 with future mortality improvements assumed each year using scale MP-2015. The actuarial assumptions used in December 31, 2018 valuation were based on results of an actuarial experience study dated September 26, 2016. The actuarial assumptions used in valuation were based on the results of the most recent actuarial experience study. Projected Cash Flows – Based on these assumptions, the pension plan’s fiduciary net position was projected to be available to pay all projected future benefit payments of current active and inactive employees. Therefore, the long-term expected rate of return on pension plan investments was applied to all periods of projected benefit payments to determine the total pension liability. The long-term expected rate of return on pension plan investments was determined using a model method in which the best-estimate ranges of expected future real rates of return (expected returns, net of investment and administrative expenses and inflation) are developed for each major asset class. These ranges are combined to produce the long-term expected rate of return by weighting the expected future
real rates of return by the target asset allocation percentage and by adding expected inflation. The target allocation and best estimates of arithmetic real rates of return for each major asset class are summarized in the following table:
Long-termTarget expected real
Asset class Allocation rate of returnUS Large Cap Index 15.00% 8.00%US Small Cap Equity 2.00% 10.15%US Small/Mid Cap Equity Index 4.00% 8.00%World Equity ex-US 19.00% 9.32%Emerging Markets Equity 2.00% 9.67%Core Fixed Income 20.00% 6.54%Limited Duration Bonds 12.00% 5.65%US High Yield 2.00% 7.82%Emerging Markets Debt 3.00% 8.75%Diversified Short Term Fixed Income 4.00% 5.89%Dynamic Asset Allocation 6.00% 10.32%Multi-Asset 3.00% 6.81%Structured Credit 3.00% 10.52%Private Real Estate 5.00% 7.30%
100.00%
Discount rate – The discount rate used to measure the total pension liability is 6.75%. The projection of cash flows used to determine the discount rate assumes that employer and employee contributions will be made at the rates agreed upon for employees and the actuarially determined rates for employers.

Huron-Clinton Metropolitan Authority Notes to the Financial Statements
December 31, 2018
3 - 23
Changes in Net Pension Liability
Total Pension Liability Service cost 966,866$ Interest on the total pension liability 5,205,391 Difference between expected and actual experience 367,984 Benefit payments and refunds (4,421,433)
Net change in total pension liability 2,118,808 Total pension liability - beginning 78,844,190
Total pension liability - ending (a) 80,962,998$
Plan Fiduciary Net Position Employer contributions 3,000,000$ Employee contributions 91,814 Pension plan net investment income (loss) (2,503,594) Benefit payments and refunds (4,421,433) Pension plan administrative expense (267,216)
Net change in plan fiduciary net position (4,100,429) Plan fiduciary net position - beginning 59,897,338
Plan fiduciary net position - ending (b) 55,796,909
Net pension liability (a-b) 25,166,089$
Plan fiduciary net position as a percentage of total pension liability 68.92%
Covered employee payroll 9,013,973$ Net pension liability as a percentage of covered employee payroll 279.19%
Sensitivity of the net pension liability to changes in the discount rate – The following presents the net pension liability of the employer, calculated using the discount rate of 6.75%, as well as what the
employer’s net pension liability would be using a discount rate that is 1% point lower (5.75%) or 1% higher (7.75%) than the current rate.
Current1% decrease discount rate 1% increase
Net pension liability 34,328,712$ 25,166,089$ 17,392,150$
Pension expense and deferred outflows of resources and deferred inflows of resources related to pensions – For the year ended December 31, 2018 the employer recognized pension expense of $4,870,888. The employer reported deferred outflows and inflows of resources related to pensions from the following sources:
Deferred Deferredoutflows of inflows of Total to resources resources amortize
Differences in experience 269,485$ 232,824$ 36,661$ Differences in assumptions 1,853,729 - 1,853,729 Net difference between projected and actual
earnings on pension plan investments 3,596,182 - 3,596,182
Total 5,719,396$ 232,824$ 5,486,572$
Amounts reported as deferred outflows and inflows of resources related to pensions will be recognized in pension expense as follows:
Year ended,2019 2,589,469$ 2020 1,008,431 2021 590,117 2022 1,298,555
5,486,572$
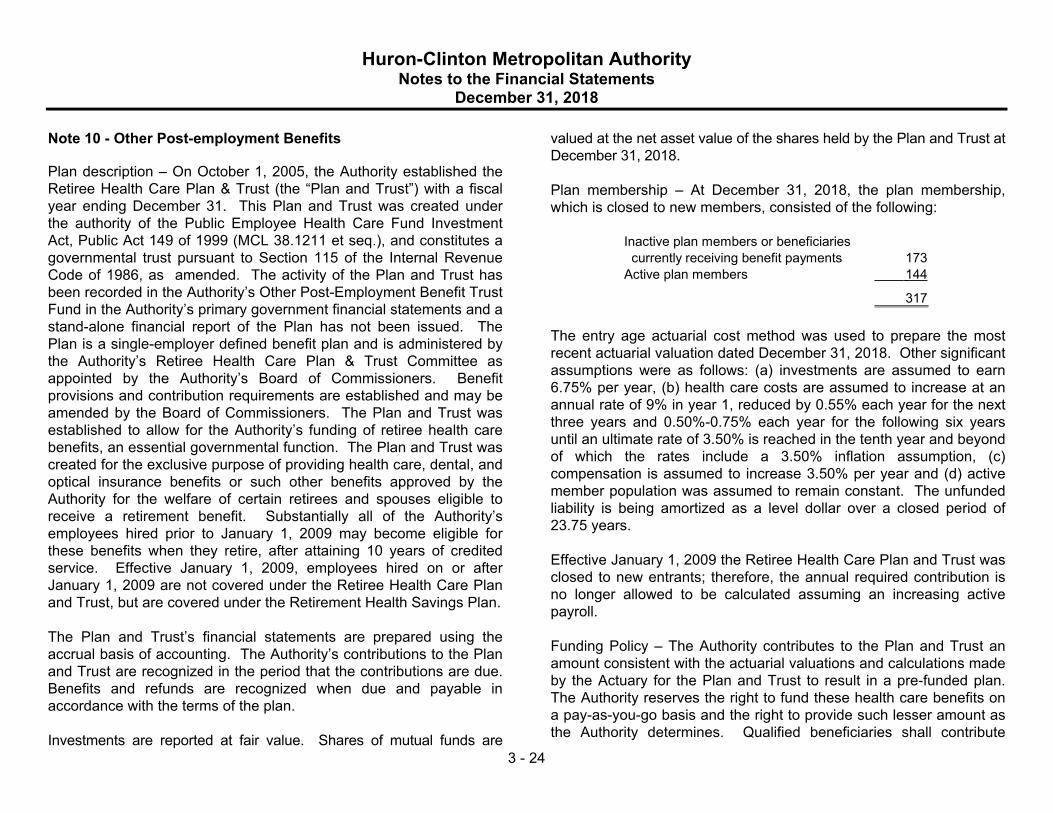
Huron-Clinton Metropolitan Authority Notes to the Financial Statements
December 31, 2018
3 - 24
Note 10 - Other Post-employment Benefits Plan description – On October 1, 2005, the Authority established the Retiree Health Care Plan & Trust (the “Plan and Trust”) with a fiscal year ending December 31. This Plan and Trust was created under the authority of the Public Employee Health Care Fund Investment Act, Public Act 149 of 1999 (MCL 38.1211 et seq.), and constitutes a governmental trust pursuant to Section 115 of the Internal Revenue Code of 1986, as amended. The activity of the Plan and Trust has been recorded in the Authority’s Other Post-Employment Benefit Trust Fund in the Authority’s primary government financial statements and a stand-alone financial report of the Plan has not been issued. The Plan is a single-employer defined benefit plan and is administered by the Authority’s Retiree Health Care Plan & Trust Committee as appointed by the Authority’s Board of Commissioners. Benefit provisions and contribution requirements are established and may be amended by the Board of Commissioners. The Plan and Trust was established to allow for the Authority’s funding of retiree health care benefits, an essential governmental function. The Plan and Trust was created for the exclusive purpose of providing health care, dental, and optical insurance benefits or such other benefits approved by the Authority for the welfare of certain retirees and spouses eligible to receive a retirement benefit. Substantially all of the Authority’s employees hired prior to January 1, 2009 may become eligible for these benefits when they retire, after attaining 10 years of credited service. Effective January 1, 2009, employees hired on or after January 1, 2009 are not covered under the Retiree Health Care Plan and Trust, but are covered under the Retirement Health Savings Plan. The Plan and Trust’s financial statements are prepared using the accrual basis of accounting. The Authority’s contributions to the Plan and Trust are recognized in the period that the contributions are due. Benefits and refunds are recognized when due and payable in accordance with the terms of the plan. Investments are reported at fair value. Shares of mutual funds are
valued at the net asset value of the shares held by the Plan and Trust at December 31, 2018. Plan membership – At December 31, 2018, the plan membership, which is closed to new members, consisted of the following:
Inactive plan members or beneficiaries currently receiving benefit payments 173 Active plan members 144
317
The entry age actuarial cost method was used to prepare the most recent actuarial valuation dated December 31, 2018. Other significant assumptions were as follows: (a) investments are assumed to earn 6.75% per year, (b) health care costs are assumed to increase at an annual rate of 9% in year 1, reduced by 0.55% each year for the next three years and 0.50%-0.75% each year for the following six years until an ultimate rate of 3.50% is reached in the tenth year and beyond of which the rates include a 3.50% inflation assumption, (c) compensation is assumed to increase 3.50% per year and (d) active member population was assumed to remain constant. The unfunded liability is being amortized as a level dollar over a closed period of 23.75 years. Effective January 1, 2009 the Retiree Health Care Plan and Trust was closed to new entrants; therefore, the annual required contribution is no longer allowed to be calculated assuming an increasing active payroll. Funding Policy – The Authority contributes to the Plan and Trust an amount consistent with the actuarial valuations and calculations made by the Actuary for the Plan and Trust to result in a pre-funded plan. The Authority reserves the right to fund these health care benefits on a pay-as-you-go basis and the right to provide such lesser amount as the Authority determines. Qualified beneficiaries shall contribute

Huron-Clinton Metropolitan Authority Notes to the Financial Statements
December 31, 2018
3 - 25
those amounts required for additional coverage as optioned by such qualified beneficiaries, required by an applicable collective bargaining agreement, and otherwise determined by the Trustees. Asset allocation targets for investments in the trust are:
Long-termTarget expected real
Asset class Allocation rate of returnU.S. Large Cap Index 15.00% 8.00%U.S. Small/Mid Cap Equity Index 6.00% 8.00%World Equity ex-U.S. 19.00% 9.32%Emerging Markets Equity 2.00% 9.67%Core Fixed Income 20.00% 6.54%Limited Duration Bonds 13.00% 5.65%U.S. High Yield 2.00% 7.82%Emerging Markets Debt 4.00% 8.75%Diversified Short Term Fixed Income 7.00% 5.89%Dynamic Asset Allocation 6.00% 10.32%Multi-Asset 3.00% 6.81%Private Real Estate 3.00% 7.30%
100.0% The Authority maintains an investment policy for the Plan and Trust which permits 5% to 40% of Plan and Trust assets to be invested in high quality fixed income securities, 15% to 50% in equity type securities and 25% to 60% in guaranteed rate of return contracts. Rate of return – For the year ended December 31, 2018, the annual money-weighted rate of return on investments, net of investment expense, was a decrease of 5.16%. The money-weighted rate of return expresses investment performance, net of investment expenses, adjusted for the changing amounts actually invested. Actuarial assumptions – The total OPEB liability was determined by an actuarial valuation as of December 31, 2018, using the following
actuarial assumptions, applied to all periods included in the measurement.
Inflation 3.50%Salary increases 3.69% to 7.25%, average, including
inflationInvestment rate of return 6.75%, net of OPEB plan investment
expense, including inflationHealthcare cost trend rates 9.0%, decreasing .55% per year to a
rate of 3.5% in year 10
Mortality rates were based on the RP-2014 Generational Mortality Table for males and females, extended via cubic spline. This table is adjusted backwards to 2006 with the MP-2014 scale, resulting in a base year of 2006 with future mortality improvements assumed each year using scale MP-2015. The actuarial assumptions used in the December 31, 2018 valuation were based on the results of an actuarial experience study dated September 28, 2016. Discount rate – The discount rate used to measure the total OPEB liability was 6.75%. The projection of cash flows used to determine the discount rate assumed that Authority contributions will be made at rates equal to the actuarially determined contribution rates. Based on those assumptions, the OPEB plan’s fiduciary net position was projected to be available to make all projected future benefit payments of current plan members. Therefore, the long-term expected rate of return on OPEB plan investments was applied to all periods of projected benefit payments to determine the total OPEB liability.
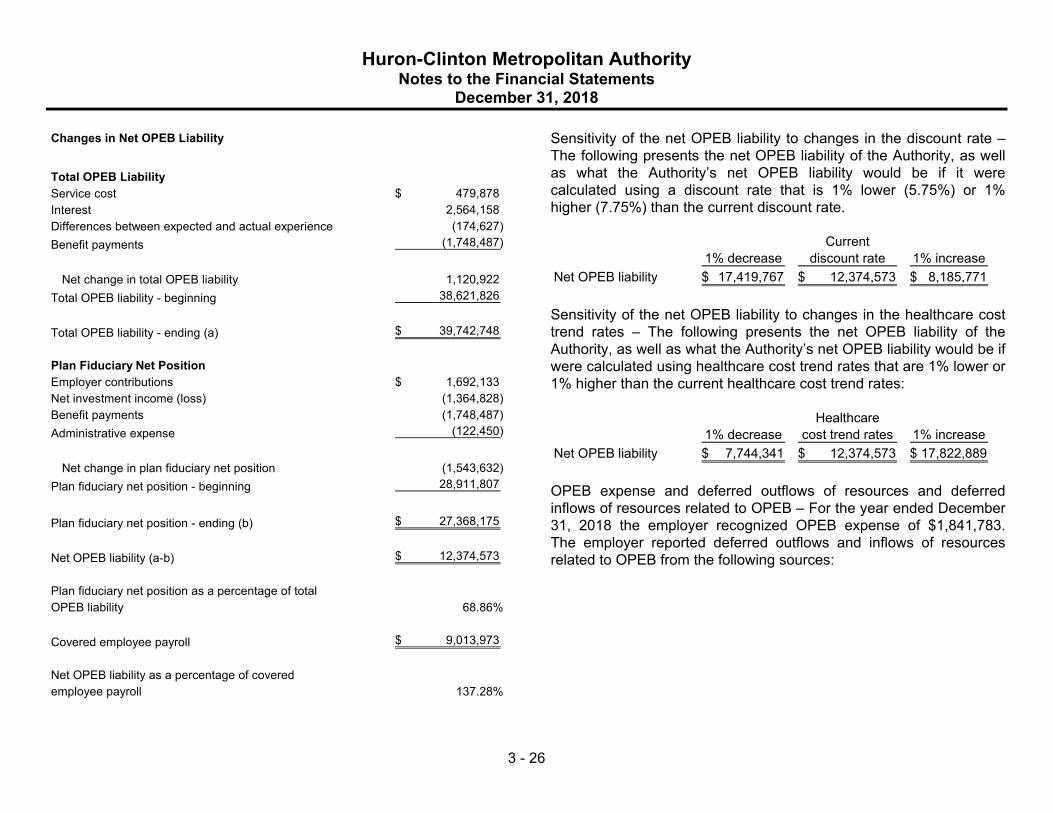
Huron-Clinton Metropolitan Authority Notes to the Financial Statements
December 31, 2018
3 - 26
Changes in Net OPEB Liability
Total OPEB LiabilityService cost 479,878$ Interest 2,564,158 Differences between expected and actual experience (174,627) Benefit payments (1,748,487)
Net change in total OPEB liability 1,120,922 Total OPEB liability - beginning 38,621,826
Total OPEB liability - ending (a) 39,742,748$
Plan Fiduciary Net PositionEmployer contributions 1,692,133$ Net investment income (loss) (1,364,828) Benefit payments (1,748,487) Administrative expense (122,450)
Net change in plan fiduciary net position (1,543,632) Plan fiduciary net position - beginning 28,911,807
Plan fiduciary net position - ending (b) 27,368,175$
Net OPEB liability (a-b) 12,374,573$
Plan fiduciary net position as a percentage of totalOPEB liability 68.86%
Covered employee payroll 9,013,973$
Net OPEB liability as a percentage of covered employee payroll 137.28%
Sensitivity of the net OPEB liability to changes in the discount rate – The following presents the net OPEB liability of the Authority, as well as what the Authority’s net OPEB liability would be if it were calculated using a discount rate that is 1% lower (5.75%) or 1% higher (7.75%) than the current discount rate.
Current1% decrease discount rate 1% increase
Net OPEB liability 17,419,767$ 12,374,573$ 8,185,771$
Sensitivity of the net OPEB liability to changes in the healthcare cost trend rates – The following presents the net OPEB liability of the Authority, as well as what the Authority’s net OPEB liability would be if were calculated using healthcare cost trend rates that are 1% lower or 1% higher than the current healthcare cost trend rates:
Healthcare1% decrease cost trend rates 1% increase
Net OPEB liability 7,744,341$ 12,374,573$ 17,822,889$
OPEB expense and deferred outflows of resources and deferred inflows of resources related to OPEB – For the year ended December 31, 2018 the employer recognized OPEB expense of $1,841,783. The employer reported deferred outflows and inflows of resources related to OPEB from the following sources:

Huron-Clinton Metropolitan Authority Notes to the Financial Statements
December 31, 2018
3 - 27
Deferred Deferredoutflows of inflows of Total to resources resources amortize
Differences in experience -$ 133,368$ (133,368)$ Net difference between
projected and actual earningson plan investments 2,648,272 - 2,648,272
Total 2,648,272$ 133,368$ 2,514,904$
Amounts reported as deferred outflows and inflows of resources related to OPEB will be recognized in OPEB expense as follows:
Year ended,2019 620,809$ 2020 620,809 2021 620,809 2022 652,477
2,514,904$
Note 11 - Financial Statements for Individual Pension and Other Post-employment Benefits
Combining Financial Information - The combining financial information of the Authority’s pension trust fund and the post-employment benefit trust fund, as of and for the year ended December 31, 2018, is as follows:
OtherPost-Employment
Pension Benefit TrustTrust Fund Fund Total
AssetsInvestments
Equity mutual funds 24,500,884$ 12,138,250$ 36,639,134$ Fixed income mutual funds 25,876,921 14,186,341 40,063,262 Collective investment trust 5,428,345 926,200 6,354,545
Receivables 58,353 29,395 87,748 Prepaids - 117,865 117,865
Total assets 55,864,503 27,398,051 83,262,554
LiabilitiesVouchers payable 67,593 29,876 97,469
Net PositionRestricted for pension benefits 55,796,910 - 55,796,910 Restricted for other post-employment benefits - 27,368,175 27,368,175
Total net position 55,796,910$ 27,368,175$ 83,165,085$
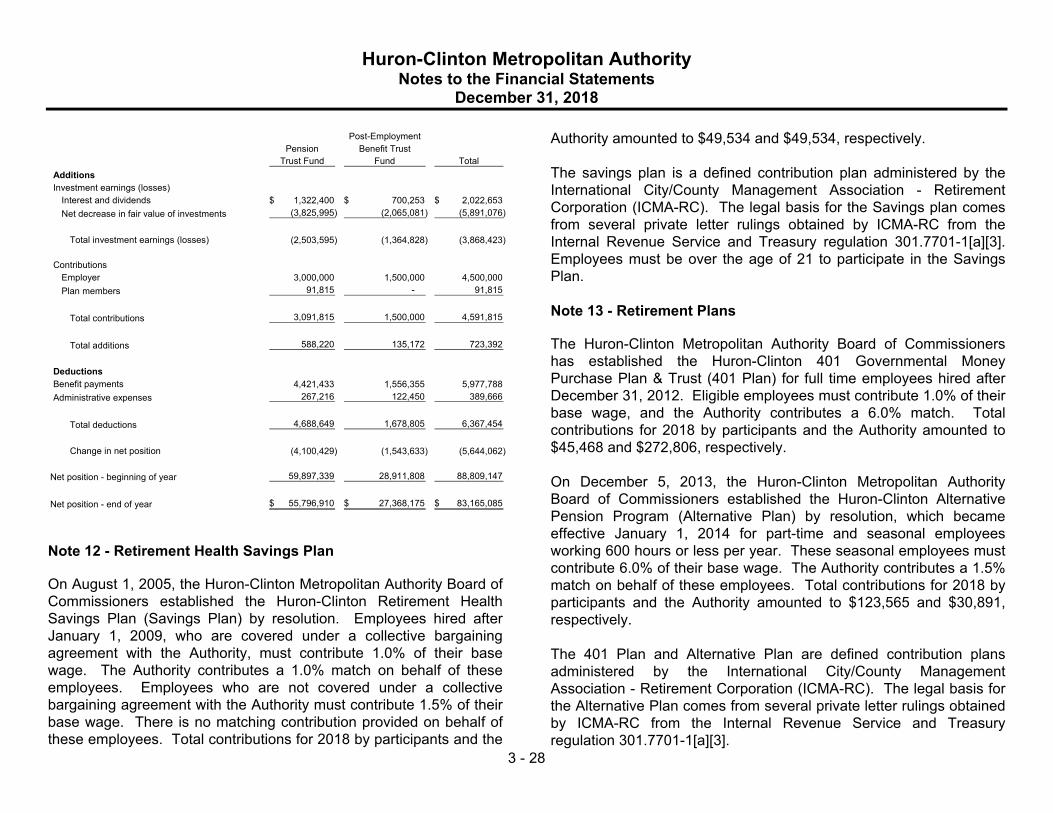
Huron-Clinton Metropolitan Authority Notes to the Financial Statements
December 31, 2018
3 - 28
Post-EmploymentPension Benefit Trust
Trust Fund Fund TotalAdditionsInvestment earnings (losses)
Interest and dividends 1,322,400$ 700,253$ 2,022,653$ Net decrease in fair value of investments (3,825,995) (2,065,081) (5,891,076)
Total investment earnings (losses) (2,503,595) (1,364,828) (3,868,423)
ContributionsEmployer 3,000,000 1,500,000 4,500,000 Plan members 91,815 - 91,815
Total contributions 3,091,815 1,500,000 4,591,815
Total additions 588,220 135,172 723,392
DeductionsBenefit payments 4,421,433 1,556,355 5,977,788 Administrative expenses 267,216 122,450 389,666
Total deductions 4,688,649 1,678,805 6,367,454
Change in net position (4,100,429) (1,543,633) (5,644,062)
Net position - beginning of year 59,897,339 28,911,808 88,809,147
Net position - end of year 55,796,910$ 27,368,175$ 83,165,085$
Note 12 - Retirement Health Savings Plan
On August 1, 2005, the Huron-Clinton Metropolitan Authority Board of Commissioners established the Huron-Clinton Retirement Health Savings Plan (Savings Plan) by resolution. Employees hired after January 1, 2009, who are covered under a collective bargaining agreement with the Authority, must contribute 1.0% of their base wage. The Authority contributes a 1.0% match on behalf of these employees. Employees who are not covered under a collective bargaining agreement with the Authority must contribute 1.5% of their base wage. There is no matching contribution provided on behalf of these employees. Total contributions for 2018 by participants and the
Authority amounted to $49,534 and $49,534, respectively. The savings plan is a defined contribution plan administered by the International City/County Management Association - Retirement Corporation (ICMA-RC). The legal basis for the Savings plan comes from several private letter rulings obtained by ICMA-RC from the Internal Revenue Service and Treasury regulation 301.7701-1[a][3]. Employees must be over the age of 21 to participate in the Savings Plan. Note 13 - Retirement Plans
The Huron-Clinton Metropolitan Authority Board of Commissioners has established the Huron-Clinton 401 Governmental Money Purchase Plan & Trust (401 Plan) for full time employees hired after December 31, 2012. Eligible employees must contribute 1.0% of their base wage, and the Authority contributes a 6.0% match. Total contributions for 2018 by participants and the Authority amounted to $45,468 and $272,806, respectively. On December 5, 2013, the Huron-Clinton Metropolitan Authority Board of Commissioners established the Huron-Clinton Alternative Pension Program (Alternative Plan) by resolution, which became effective January 1, 2014 for part-time and seasonal employees working 600 hours or less per year. These seasonal employees must contribute 6.0% of their base wage. The Authority contributes a 1.5% match on behalf of these employees. Total contributions for 2018 by participants and the Authority amounted to $123,565 and $30,891, respectively. The 401 Plan and Alternative Plan are defined contribution plans administered by the International City/County Management Association - Retirement Corporation (ICMA-RC). The legal basis for the Alternative Plan comes from several private letter rulings obtained by ICMA-RC from the Internal Revenue Service and Treasury regulation 301.7701-1[a][3].

Huron-Clinton Metropolitan Authority Notes to the Financial Statements
December 31, 2018
3 - 29
Note 14 - Fund Balances – Governmental Funds
In the fund financial statements, the governmental funds report fund balances as follows:
SupplementalGeneral Major Capital
Fund Maintenance Projects Total
NonspendableInventories 243,713$ -$ -$ 243,713$ Prepaids 648,864 - - 648,864
RestrictedLake St. Clair Marina 365,128 - - 365,128 Hudson Mills Canoe Livery 9,173 - - 9,173
CommittedLand 5,536,694 - - 5,536,694 Capital projects - 4,899,297 7,336,333 12,235,630 Rate stabilization fund 1,063,175 - - 1,063,175
AssignedCompensated absences 3,653,734 - - 3,653,734 Storm/sanitary improvements 345,447 - - 345,447 ADA Improvements 76,364 - - 76,364 Roadway resurfacing 192,258 - - 192,258 Other capital equipment 399,178 - - 399,178 Subsequent budgeted use of fund balance 2,517,500 - - 2,517,500
Unassigned 21,153,287 - - 21,153,287
Total Fund Balances 36,204,515$ 4,899,297$ 7,336,333$ 48,440,145$
Note 15 - Tax Abatements
Municipalities within the Authority’s boundaries entered into property tax abatement agreements with local businesses under several programs as authorized under Public Act 381 of 1996, as amended (PA 381), and Public Act 198 of 1974, as amended (PA 198).
PA 381 (Brownfield Redevelopment Abatement) allows abatements to encourage the purchase and revitalization of properties in which redevelopment or reuse may be complicated by the presence or perception of contamination. Revitalizing and redeveloping these properties protects the environment, reuses existing infrastructure, minimizes urban sprawl and creates economic opportunities. PA198 (Industrial Property Tax Abatement) allows abatements to
encourage Michigan manufacturers to build new plans, expand existing plans, renovate aging plants, or add new machinery and equipment. High technology operations are also eligible for the abatement. Once approved the firm pays an Industrial Facilities Tax (IFT), instead of property taxes, which reflects the abatement savings. The exemption covers only the specific project that is the subject of the application. Any buildings and equipment that existed prior to the construction of a new facility are not exempt. Likewise, any structures or equipment added after completion of the project are fully taxable. The IFT on new plant and non-industrial personal property is computed at half the local property mileage rate, resulting in a reduction of property taxes of approximately 50%. For an obsolete plant or machinery that is being replaced or restored, the IFT is frozen at the assessed value of the plant prior to improvement, resulting in a 100% exemption from property tax on the value of the improvements. A speculative building would be eligible for a reduction in property taxes of approximately 50%. Commercial personal property will receive an automatic reduction of 12 mills for local school on their property tax bill. PA 328 (Personal Property Tax Relief in Distressed Communities) allows eligible distressed communities to abate taxes on new investments made by eligible commercial businesses that reduce unemployment, promote economic growth, and increase capital investment. Neighborhood Enterprise Zone designation would qualify a community as eligible for the PA 328 exemption. Eligible projects include manufacturing, mining, research and development, wholesale trade, and office operations. Retail businesses and casinos are not eligible. Abatements reduce property taxes by the full millage rate. The law does not specify a maximum or a minimum number of years to be abated. A PILOT is a payment in lieu of taxes (also sometimes abbreviated "PILT"), made to compensate a local government for some or all of the tax revenue that it loses because of the nature of the ownership or
Huron-Clinton Metropolitan Authority Notes to the Financial Statements
December 31, 2018
3 - 30
use of a particular piece of real property. For the fiscal year ended December 31, 2018, the Authority experienced reduced property taxes totaling $1,096,451 under these programs.
Note 16 - Contingent Liabilities
The Authority is a defendant in various lawsuits. Although the outcome of these lawsuits is not presently determinable, in the opinion of management and its attorney, the resolution of these matters will not have a material adverse effect on the financial condition of the Authority. Amounts received or receivable from grantor agencies are subject to audit and adjustment by grantor agencies, such as the Federal and State governments. Any disallowed claims, including amounts already collected, may constitute a liability of the applicable funds. The amount, if any, of expenditures, which may be disallowed by the grantor, cannot be determined at this time although the Authority expects such amounts, if any, to be immaterial. Note 17 - Change in Accounting Principle
As indicated in Note 1, Governmental Accounting Standards Board Statement 75 has been adopted. This statement requires the net OPEB liability and OPEB expense to be recorded. The standard requires this change be applied retroactively. The impact of this change is to reduce beginning net position in the statement of activities as of December 31, 2017 by $14,668,595, restating it from $224,200,247 to $209,531,652.

REQUIRED SUPPLEMENTARY INFORMATION
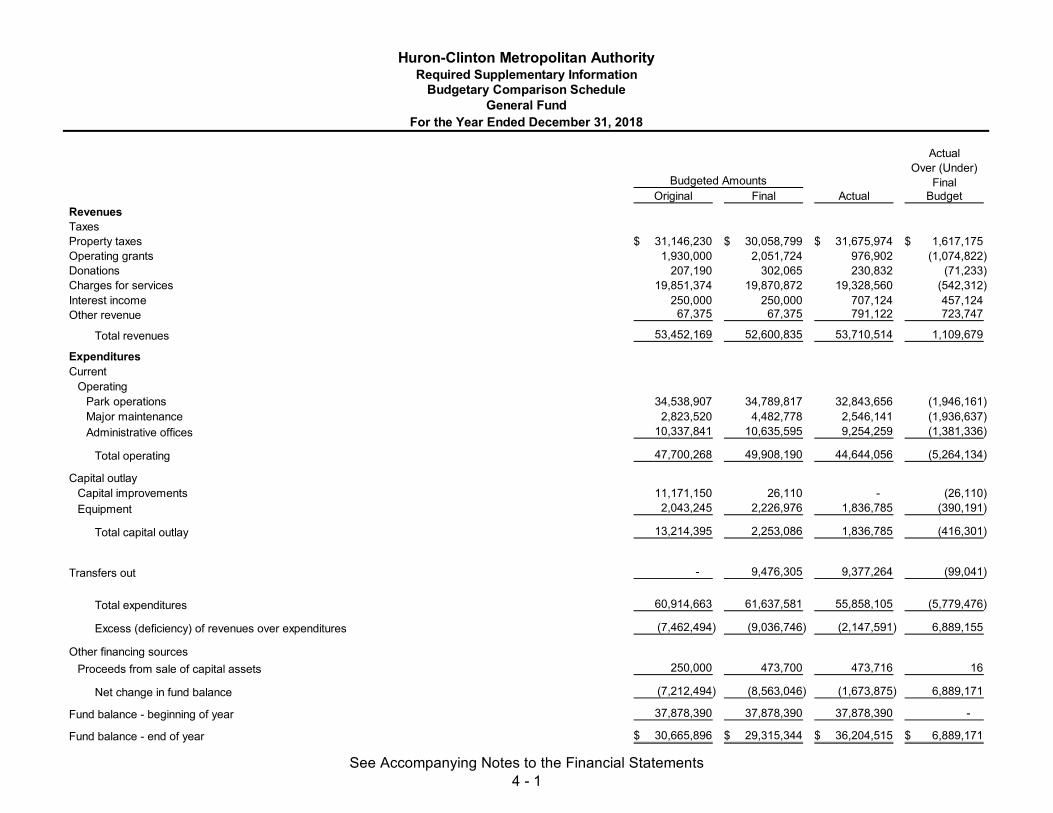
ActualOver (Under)
FinalOriginal Final Actual Budget
RevenuesTaxesProperty taxes 31,146,230$ 30,058,799$ 31,675,974$ 1,617,175$ Operating grants 1,930,000 2,051,724 976,902 (1,074,822) Donations 207,190 302,065 230,832 (71,233) Charges for services 19,851,374 19,870,872 19,328,560 (542,312) Interest income 250,000 250,000 707,124 457,124 Other revenue 67,375 67,375 791,122 723,747
Total revenues 53,452,169 52,600,835 53,710,514 1,109,679
ExpendituresCurrent
OperatingPark operations 34,538,907 34,789,817 32,843,656 (1,946,161) Major maintenance 2,823,520 4,482,778 2,546,141 (1,936,637) Administrative offices 10,337,841 10,635,595 9,254,259 (1,381,336)
Total operating 47,700,268 49,908,190 44,644,056 (5,264,134)
Capital outlayCapital improvements 11,171,150 26,110 - (26,110) Equipment 2,043,245 2,226,976 1,836,785 (390,191)
Total capital outlay 13,214,395 2,253,086 1,836,785 (416,301)
Transfers out - 9,476,305 9,377,264 (99,041)
Total expenditures 60,914,663 61,637,581 55,858,105 (5,779,476)
Excess (deficiency) of revenues over expenditures (7,462,494) (9,036,746) (2,147,591) 6,889,155
Other financing sourcesProceeds from sale of capital assets 250,000 473,700 473,716 16
Net change in fund balance (7,212,494) (8,563,046) (1,673,875) 6,889,171
Fund balance - beginning of year 37,878,390 37,878,390 37,878,390 -
Fund balance - end of year 30,665,896$ 29,315,344$ 36,204,515$ 6,889,171$
Budgeted Amounts
For the Year Ended December 31, 2018
Huron-Clinton Metropolitan AuthorityRequired Supplementary Information
Budgetary Comparison ScheduleGeneral Fund
See Accompanying Notes to the Financial Statements4 - 1
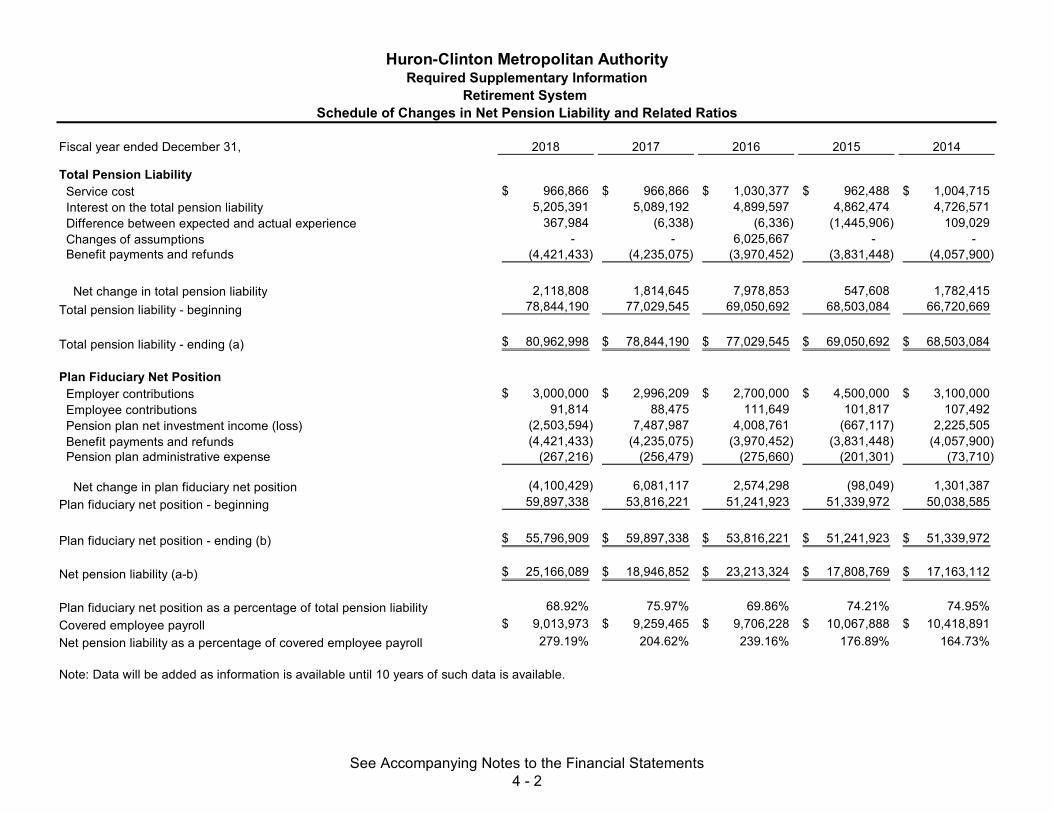
Fiscal year ended December 31, 2018 2017 2016 2015 2014
Total Pension Liability Service cost 966,866$ 966,866$ 1,030,377$ 962,488$ 1,004,715$ Interest on the total pension liability 5,205,391 5,089,192 4,899,597 4,862,474 4,726,571 Difference between expected and actual experience 367,984 (6,338) (6,336) (1,445,906) 109,029 Changes of assumptions - - 6,025,667 - - Benefit payments and refunds (4,421,433) (4,235,075) (3,970,452) (3,831,448) (4,057,900)
Net change in total pension liability 2,118,808 1,814,645 7,978,853 547,608 1,782,415 Total pension liability - beginning 78,844,190 77,029,545 69,050,692 68,503,084 66,720,669
Total pension liability - ending (a) 80,962,998$ 78,844,190$ 77,029,545$ 69,050,692$ 68,503,084$
Plan Fiduciary Net Position Employer contributions 3,000,000$ 2,996,209$ 2,700,000$ 4,500,000$ 3,100,000$ Employee contributions 91,814 88,475 111,649 101,817 107,492 Pension plan net investment income (loss) (2,503,594) 7,487,987 4,008,761 (667,117) 2,225,505 Benefit payments and refunds (4,421,433) (4,235,075) (3,970,452) (3,831,448) (4,057,900) Pension plan administrative expense (267,216) (256,479) (275,660) (201,301) (73,710)
Net change in plan fiduciary net position (4,100,429) 6,081,117 2,574,298 (98,049) 1,301,387 Plan fiduciary net position - beginning 59,897,338 53,816,221 51,241,923 51,339,972 50,038,585
Plan fiduciary net position - ending (b) 55,796,909$ 59,897,338$ 53,816,221$ 51,241,923$ 51,339,972$
Net pension liability (a-b) 25,166,089$ 18,946,852$ 23,213,324$ 17,808,769$ 17,163,112$
Plan fiduciary net position as a percentage of total pension liability 68.92% 75.97% 69.86% 74.21% 74.95% Covered employee payroll 9,013,973$ 9,259,465$ 9,706,228$ 10,067,888$ 10,418,891$ Net pension liability as a percentage of covered employee payroll 279.19% 204.62% 239.16% 176.89% 164.73%
Huron-Clinton Metropolitan AuthorityRequired Supplementary Information
Retirement System Schedule of Changes in Net Pension Liability and Related Ratios
Note: Data will be added as information is available until 10 years of such data is available.
See Accompanying Notes to the Financial Statements4 - 2
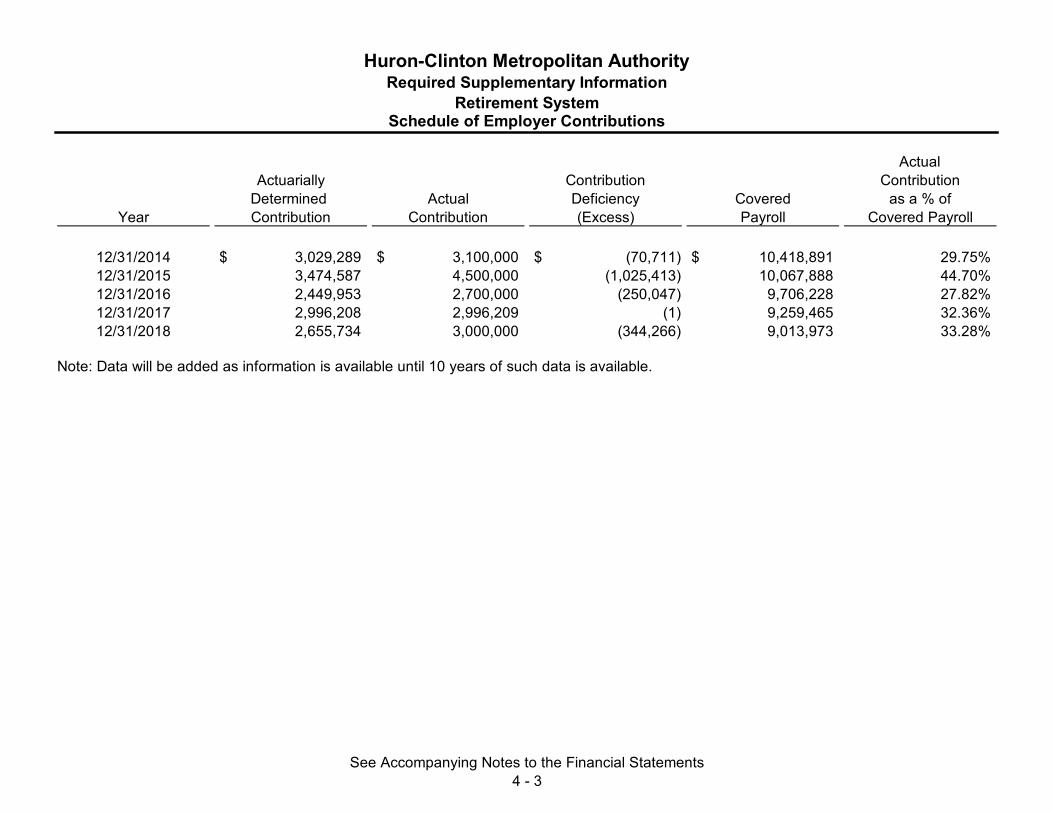
ActualActuarially Contribution Contribution
Determined Actual Deficiency Covered as a % ofYear Contribution Contribution (Excess) Payroll Covered Payroll
12/31/2014 3,029,289$ 3,100,000$ (70,711)$ 10,418,891$ 29.75% 12/31/2015 3,474,587 4,500,000 (1,025,413) 10,067,888 44.70% 12/31/2016 2,449,953 2,700,000 (250,047) 9,706,228 27.82% 12/31/2017 2,996,208 2,996,209 (1) 9,259,465 32.36% 12/31/2018 2,655,734 3,000,000 (344,266) 9,013,973 33.28%
Huron-Clinton Metropolitan AuthorityRequired Supplementary Information
Retirement SystemSchedule of Employer Contributions
Note: Data will be added as information is available until 10 years of such data is available.
See Accompanying Notes to the Financial Statements4 - 3

Fiscal YearEnded Annual
December 31, Return % *2014 4.43%2015 -1.68%2016 7.33%2017 13.40%2018 -4.64%
* Annual money-weighted rate of return, net of investment expenses
Huron-Clinton Metropolitan AuthorityRequired Supplementary Information
Retirement SystemSchedule of Investment Returns
Note: Data will be added as information is available until 10 years of such data is available.
See Accompanying Notes to the Financial Statements4 - 4

Fiscal year ended December 31, 2018
Total OPEB Liability Service cost 479,878$ Interest 2,564,158 Differences between expected and actual experience (174,627) Benefit payments (1,748,487)
Net change in total OPEB liability 1,120,922 Total OPEB liability - beginning 38,621,826
Total OPEB liability - ending (a) 39,742,748$
Plan Fiduciary Net Position Employer contributions 1,692,133$ Net investment income (loss) (1,364,828) Benefit payments and refunds (1,748,487) Administrative expense (122,450)
Net change in plan fiduciary net position (1,543,632) Plan fiduciary net position - beginning 28,911,807
Plan fiduciary net position - ending (b) 27,368,175$
Net OPEB liability (a-b) 12,374,573$
Plan fiduciary net position as a percentage of total OPEB liability 68.86% Covered employee payroll 9,013,973$ Net OPEB liability as a percentage of covered employee payroll 137.28%
Note: Data will be added as information is available until 10 years of such data is available.
Huron-Clinton Metropolitan AuthorityRequired Supplementary Information
Other Post-employment BenefitsSchedule of Changes in Net OPEB Liability and Related Ratios
See Accompanying Notes to the Financial Statements4 - 5

ActualActuarial Actuarially Contribution ContributionValuation Determined Actual Deficiency Covered as a % of
Date Contribution Contribution (Excess) Payroll Covered Payroll
12/31/2017 1,415,660$ 2,149,330$ (733,670)$ 8,866,219$ 24.24% 12/31/2018 1,395,565 1,692,133 (296,568) 9,013,973 18.77%
Notes to Schedule of ContributionsValuation date: December 31, 2018
Methods and assumptions used to determine contribution rates:Actuarial cost method Entry ageAmortization method Level percentage of payroll, closedRemaining amortization period 23.75 yearsAsset valuation method 5-year smoothed marketInflation 3.50%Healthcare cost trend rates 9% initial, decreasing 0.5% per year to an ultimate rate of 3.5%Salary increases 3.50%Investment rate of return 6.75%Mortality 2014 Group annuity mortality table of 50% male and 50% female blend
Huron-Clinton Metropolitan AuthorityRequired Supplementary Information
Other Post-employment BenefitsSchedule of Employer Contributions
Note: Data will be added as information is available until 10 years of such data is available.
See Accompanying Notes to the Financial Statements4 - 6

Fiscal YearEnded Annual
December 31, Return % *2017 13.31%2018 (5.16%)
Huron-Clinton Metropolitan AuthorityRequired Supplementary Information
Other Post-employment BenefitsSchedule of Investment Returns
Note; Data will be added as information is available until 10 years of such data is available.
* Annual money-weighted rate of return, net of investment expenses
See Accompanying Notes to the Financial Statements4 - 7

OTHER SUPPLEMENTARY INFORMATION

OtherPost-Employment
Pension Benefit TrustTrust Fund Fund Total
AssetsInvestments
Equity mutual funds 24,500,884$ 12,138,250$ 36,639,134$ Fixed income mutual funds 25,876,921 14,186,341 40,063,262 Collective investment trust 5,428,345 926,200 6,354,545
Receivables 58,353 29,395 87,748 Prepaids - 117,865 117,865
Total assets 55,864,503 27,398,051 83,262,554
LiabilitiesVouchers payable 67,593 29,876 97,469
Net PositionRestricted for pension benefits 55,796,910 - 55,796,910 Restricted for other post-employment benefits - 27,368,175 27,368,175
Total net position 55,796,910$ 27,368,175$ 83,165,085$
Huron-Clinton Metropolitan AuthorityFiduciary Funds
Combining Statement of Net PositionDecember 31, 2018
See Accompanying Notes to the Financial Statements5 - 1

OtherPost-Employment
Pension Benefit Trust Trust Fund Fund TotalAdditionsInvestment earnings (loss)
Interest and dividends 1,322,400$ 700,253$ 2,022,653$ Net decrease in fair value of investments (3,825,995) (2,065,081) (5,891,076)
Total investment earnings (loss) (2,503,595) (1,364,828) (3,868,423)
ContributionsEmployer 3,000,000 1,500,000 4,500,000 Plan members 91,815 - 91,815
Total contributions 3,091,815 1,500,000 4,591,815
Total additions 588,220 135,172 723,392
DeductionsBenefit payments 4,421,433 1,556,355 5,977,788 Administrative expenses 267,216 122,450 389,666
Total deductions 4,688,649 1,678,805 6,367,454
Change in net position (4,100,429) (1,543,633) (5,644,062)
Net position - beginning of year 59,897,339 28,911,808 88,809,147
Net position - end of year 55,796,910$ 27,368,175$ 83,165,085$
Huron-Clinton Metropolitan AuthorityFiduciary Funds
Combining Statement of Changes in Net PositionFor the Year Ended December 31, 2018
See Accompanying Notes to the Financial Statements5 - 2
STATISTICAL SECTION (UNAUDITED)

Contents Page
Financial Trends
6 - 1
Revenue Capacity
6 - 5
Demographic and Economic Information
6 - 11
Operating Information
6 - 14
Huron-Clinton Metropolitan AuthorityStatistical Section - Table of Contents
For the Year Ending December 31, 2018
This part of Huron-Clinton Metropolitan Authority’s comprehensive annual financial report presents detailed information as a context for understanding what the information in the financial statements, note disclosures, and required supplementary information says about the government’s overall financial health.
Sources: Unless otherwise noted, the information in these schedules is derived from the comprehensive annual financial reports for the relevant year.
These schedules contain trend information to help the reader understand how the government’s financial performance and well-being have changed over time.
These schedules offer demographic and economic indicators to help the reader understand the environment within which the government’s financial activities take place.
These schedules contain service and infrastructure data to help the reader understand how the information in the government’s financial report relates to the services the government provides and the activities it performs.
These schedules contain information to help the reader assess the government’s most significant local revenue source, the property tax.

2009 2010 2011 2012 2013 2014 2015 2016 2017 2018Governmental activities
Net investment in capital assets 195,042,991$ 195,093,978$ 194,800,234$ 194,403,024$ 195,125,395$ 195,936,628$ 193,545,863$ 194,722,125$ 197,243,195$ 194,826,998$ Restricted - - 37,709 90,430 138,856 185,995 259,201 311,705 349,962 374,301 Unrestricted 29,396,377 33,118,763 34,227,707 36,140,736 38,675,137 41,440,497 28,935,288 28,739,061 26,607,090 15,550,860
Total governmental activities net position 224,439,368$ 228,212,741$ 229,065,650$ 230,634,190$ 233,939,388$ 237,563,120$ 222,740,352$ 223,772,891$ 224,200,247$ 210,752,159$
Fiscal year 2015 includes the implementation of GASB Statement 68, which required the recognition of deferred outflows of resources, net pension liabilities, and deferred inflows of resources related to the Authority's pension plan. The net effect of these changes decreased net position by $17.2 million in fiscal year 2015. Prior years have not been restated to reflect the changes required by GASB Statement 68.
Fiscal year 2018 includes the implementation of GASB Statement 75, which required the recognition of deferred outflows of resources, net OPEB liabilities, and deferred inflows of resources related to the Authority's other post-employment benefit plan. The net effect of these changes decreased net position by $14.7 million in fiscal year 2018. Prior years have not been restated to reflect the changes required by GASB Statement 75.
Last Ten Fiscal Years(Unaudited)
Net Position by ComponentHuron-Clinton Metropolitan Authority
6 - 1
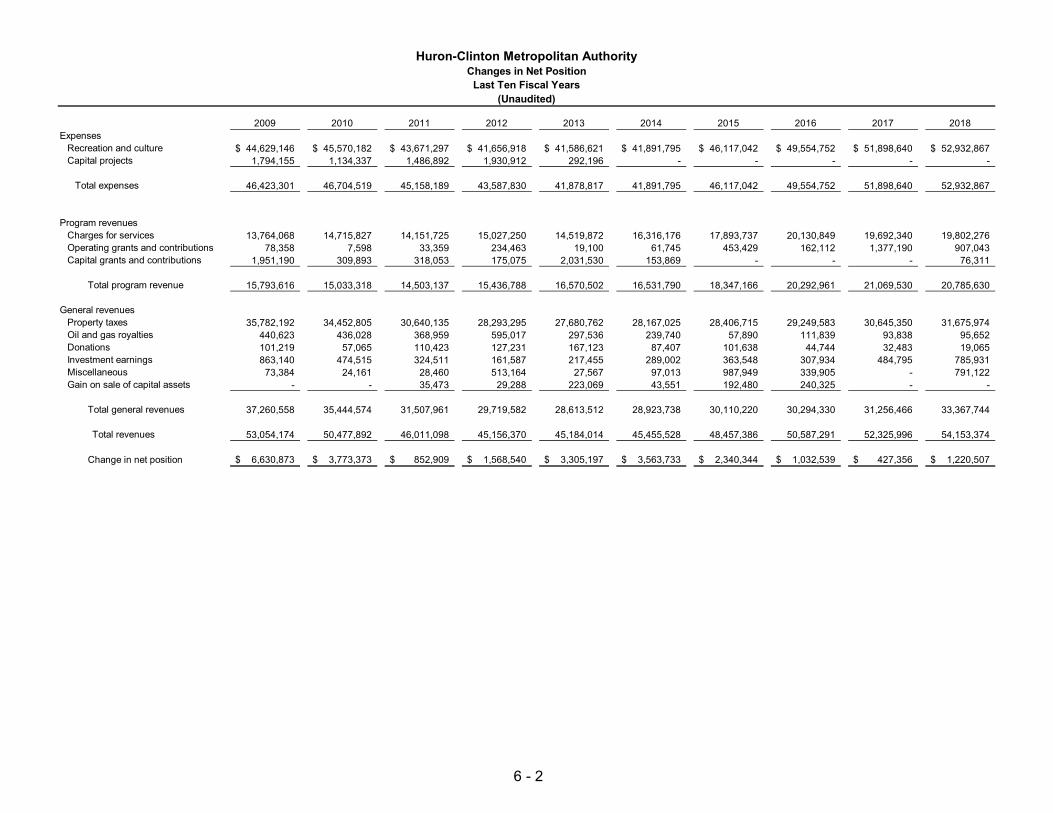
2009 2010 2011 2012 2013 2014 2015 2016 2017 2018Expenses
Recreation and culture 44,629,146$ 45,570,182$ 43,671,297$ 41,656,918$ 41,586,621$ 41,891,795$ 46,117,042$ 49,554,752$ 51,898,640$ 52,932,867$ Capital projects 1,794,155 1,134,337 1,486,892 1,930,912 292,196 - - - - -
Total expenses 46,423,301 46,704,519 45,158,189 43,587,830 41,878,817 41,891,795 46,117,042 49,554,752 51,898,640 52,932,867
Program revenuesCharges for services 13,764,068 14,715,827 14,151,725 15,027,250 14,519,872 16,316,176 17,893,737 20,130,849 19,692,340 19,802,276 Operating grants and contributions 78,358 7,598 33,359 234,463 19,100 61,745 453,429 162,112 1,377,190 907,043 Capital grants and contributions 1,951,190 309,893 318,053 175,075 2,031,530 153,869 - - - 76,311
Total program revenue 15,793,616 15,033,318 14,503,137 15,436,788 16,570,502 16,531,790 18,347,166 20,292,961 21,069,530 20,785,630
General revenuesProperty taxes 35,782,192 34,452,805 30,640,135 28,293,295 27,680,762 28,167,025 28,406,715 29,249,583 30,645,350 31,675,974 Oil and gas royalties 440,623 436,028 368,959 595,017 297,536 239,740 57,890 111,839 93,838 95,652 Donations 101,219 57,065 110,423 127,231 167,123 87,407 101,638 44,744 32,483 19,065 Investment earnings 863,140 474,515 324,511 161,587 217,455 289,002 363,548 307,934 484,795 785,931 Miscellaneous 73,384 24,161 28,460 513,164 27,567 97,013 987,949 339,905 - 791,122 Gain on sale of capital assets - - 35,473 29,288 223,069 43,551 192,480 240,325 - -
Total general revenues 37,260,558 35,444,574 31,507,961 29,719,582 28,613,512 28,923,738 30,110,220 30,294,330 31,256,466 33,367,744
Total revenues 53,054,174 50,477,892 46,011,098 45,156,370 45,184,014 45,455,528 48,457,386 50,587,291 52,325,996 54,153,374
Change in net position 6,630,873$ 3,773,373$ 852,909$ 1,568,540$ 3,305,197$ 3,563,733$ 2,340,344$ 1,032,539$ 427,356$ 1,220,507$
Huron-Clinton Metropolitan AuthorityChanges in Net Position
Last Ten Fiscal Years(Unaudited)
6 - 2

2009 2010 2011 2012 2013 2014 2015 2016 2017 2018General Fund
Reserved 2,500,709$ 1,268,203$ -$ -$ -$ -$ -$ -$ -$ -$ Unreserved 24,970,045 29,812,797 - - - - - - - - Nonspendable - - 228,747 232,363 534,899 498,779 1,018,633 1,069,422 1,055,873 892,577 Restricted - - 37,709 90,430 138,856 185,995 259,201 311,705 349,962 374,301 Committed - - 13,394,338 13,334,981 12,907,536 9,401,861 9,873,636 10,011,796 6,083,467 6,599,869 Assigned - - - 15,526,682 11,990,064 11,846,371 10,074,807 15,908,505 12,108,959 7,184,481 Unassigned - - 18,200,790 5,014,458 10,323,181 14,747,179 18,348,559 13,630,033 18,280,129 21,153,287
Total General Fund 27,470,754$ 31,081,000$ 31,861,584$ 34,198,914$ 35,894,536$ 36,680,185$ 39,574,836$ 40,931,461$ 37,878,390$ 36,204,515$
Supplemental Major Maintenance FundReserved 33,834$ 280,642$ -$ -$ -$ -$ -$ -$ -$ -$ Unreserved 6,370,316 6,458,797 - - - - - - - - Committed - - 6,087,728 4,780,236 4,804,776 4,481,442 4,463,556 4,595,401 4,724,838 4,899,297
Total Supplemental Major Maintenance Fund 6,404,150$ 6,739,439$ 6,087,728$ 4,780,236$ 4,804,776$ 4,481,442$ 4,463,556$ 4,595,401$ 4,724,838$ 4,899,297$
Capital Projects FundCommitted -$ -$ -$ -$ -$ -$ -$ -$ -$ 7,336,333$
Total Capital Projects Fund -$ -$ -$ -$ -$ -$ -$ -$ -$ 7,336,333$
Note: GASB 54 became effective and was implemented in 2011. Prior period amounts were not restated.
Huron-Clinton Metropolitan AuthorityFund Balances - Governmental Funds
Last Ten Fiscal Years(Unaudited)
6 - 3
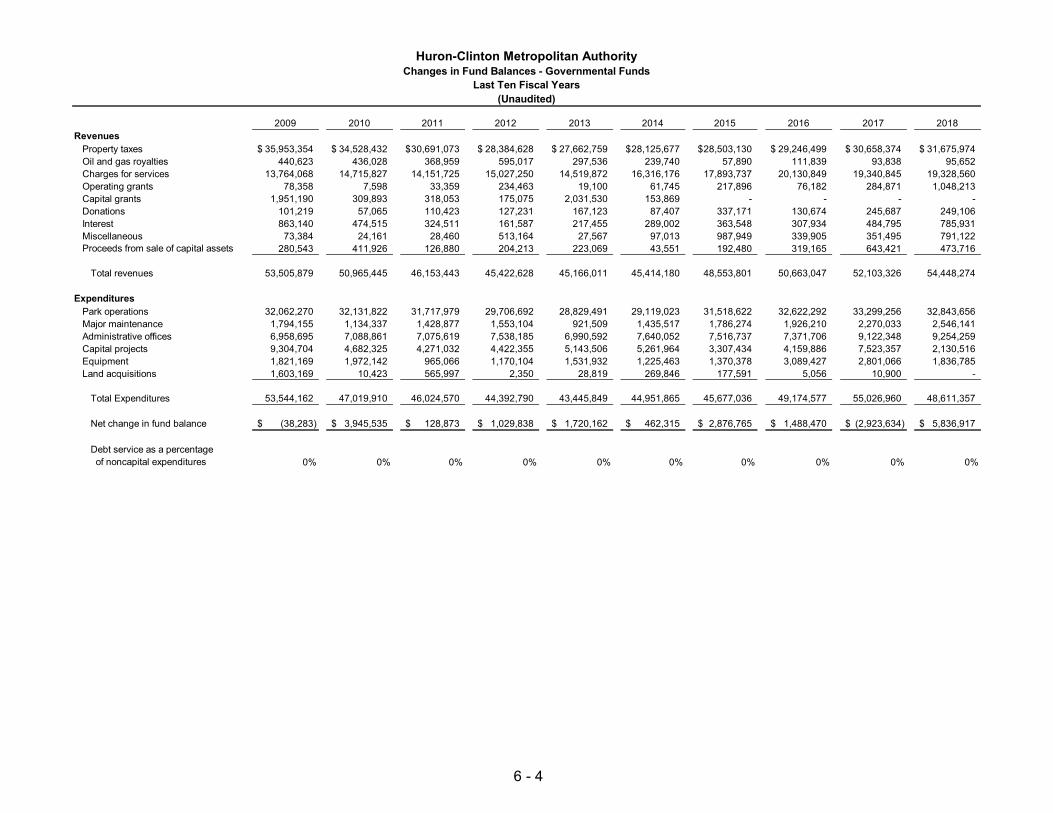
2009 2010 2011 2012 2013 2014 2015 2016 2017 2018Revenues
Property taxes 35,953,354$ 34,528,432$ 30,691,073$ 28,384,628$ 27,662,759$ 28,125,677$ 28,503,130$ 29,246,499$ 30,658,374$ 31,675,974$ Oil and gas royalties 440,623 436,028 368,959 595,017 297,536 239,740 57,890 111,839 93,838 95,652 Charges for services 13,764,068 14,715,827 14,151,725 15,027,250 14,519,872 16,316,176 17,893,737 20,130,849 19,340,845 19,328,560 Operating grants 78,358 7,598 33,359 234,463 19,100 61,745 217,896 76,182 284,871 1,048,213 Capital grants 1,951,190 309,893 318,053 175,075 2,031,530 153,869 - - - - Donations 101,219 57,065 110,423 127,231 167,123 87,407 337,171 130,674 245,687 249,106 Interest 863,140 474,515 324,511 161,587 217,455 289,002 363,548 307,934 484,795 785,931 Miscellaneous 73,384 24,161 28,460 513,164 27,567 97,013 987,949 339,905 351,495 791,122 Proceeds from sale of capital assets 280,543 411,926 126,880 204,213 223,069 43,551 192,480 319,165 643,421 473,716
Total revenues 53,505,879 50,965,445 46,153,443 45,422,628 45,166,011 45,414,180 48,553,801 50,663,047 52,103,326 54,448,274
ExpendituresPark operations 32,062,270 32,131,822 31,717,979 29,706,692 28,829,491 29,119,023 31,518,622 32,622,292 33,299,256 32,843,656 Major maintenance 1,794,155 1,134,337 1,428,877 1,553,104 921,509 1,435,517 1,786,274 1,926,210 2,270,033 2,546,141 Administrative offices 6,958,695 7,088,861 7,075,619 7,538,185 6,990,592 7,640,052 7,516,737 7,371,706 9,122,348 9,254,259 Capital projects 9,304,704 4,682,325 4,271,032 4,422,355 5,143,506 5,261,964 3,307,434 4,159,886 7,523,357 2,130,516 Equipment 1,821,169 1,972,142 965,066 1,170,104 1,531,932 1,225,463 1,370,378 3,089,427 2,801,066 1,836,785 Land acquisitions 1,603,169 10,423 565,997 2,350 28,819 269,846 177,591 5,056 10,900 -
Total Expenditures 53,544,162 47,019,910 46,024,570 44,392,790 43,445,849 44,951,865 45,677,036 49,174,577 55,026,960 48,611,357
Net change in fund balance (38,283)$ 3,945,535$ 128,873$ 1,029,838$ 1,720,162$ 462,315$ 2,876,765$ 1,488,470$ (2,923,634)$ 5,836,917$
Debt service as a percentage of noncapital expenditures 0% 0% 0% 0% 0% 0% 0% 0% 0% 0%
Huron-Clinton Metropolitan AuthorityChanges in Fund Balances - Governmental Funds
Last Ten Fiscal Years(Unaudited)
6 - 4

Year Property Tax
2009 35,953,354$ 2010 34,528,4322011 30,691,0732012 28,384,6282013 27,662,7592014 28,125,6772015 28,406,7152016 29,249,5832017 30,645,3502018 31,675,974
Last Ten Fiscal Years(Unaudited)
Governmental Activities Tax Revenue by SourceHuron-Clinton Metropolitan Authority
6 - 5

Personal Property (a) State State State Estimated Percent
Taxable Equalized Taxable Equalized Taxable Equalized Market Change inYear Value Value Value Value Value Value Value (b) Market Value
2009 159,805,335,088$ 190,072,799,884$ 13,834,646,241$ 13,895,283,284$ 173,639,981,329$ 203,968,083,168$ 407,936,166,336$ -3.9%2010 154,220,925,617 171,635,829,603 13,979,514,883 13,966,280,994 168,200,440,500 185,602,110,597 371,204,221,194 -9.0%2011 138,988,195,205 149,496,027,195 13,021,305,792 13,034,781,334 152,009,500,997 162,530,808,529 325,061,617,058 -12.4%2012 130,162,996,751 136,807,421,204 12,360,397,169 12,378,691,878 142,523,393,920 149,186,113,082 298,372,226,164 -8.2%2013 123,811,211,186 128,820,235,807 12,562,799,230 12,573,994,972 136,374,010,416 141,394,230,779 282,788,461,558 -5.2%2014 122,943,107,230 129,773,753,961 13,126,543,590 13,159,608,616 136,069,650,820 142,933,362,577 285,866,725,154 1.1%2015 123,996,465,352 135,715,141,261 12,839,179,302 12,888,111,844 136,835,644,654 148,603,253,105 297,206,506,210 4.0%2016 127,299,266,119 147,549,827,757 13,328,310,313 13,339,823,672 140,627,576,432 160,889,651,429 321,779,302,858 8.3%2017 129,731,372,431 158,080,403,922 10,932,474,841 10,951,448,476 140,663,847,272 169,031,852,398 338,063,704,796 5.1%2018 133,670,573,042 167,371,105,480 10,782,695,017 10,815,394,135 144,453,268,059 178,186,499,615 356,372,999,230 5.4%
(b) Total estimated market value is based on two times State Equalized Value figures.
Source: Livingston, Macomb, Oakland, Washtenaw, and Wayne County Assessing and Equalization Departments.
Real Property (a)
(a) Property value information represents the combined totals of Livingston, Macomb, Oakland, Washtenaw, and Wayne counties. These counties are the member counties of the Metropark district.
Huron-Clinton Metropolitan AuthorityTaxable and Assessed Values of Property
Last Ten Fiscal Years(Unaudited)
6 - 6

Livingston % of Macomb % of Oakland % of Washtenaw % of Wayne % of Total TotalYear County Total County Total County Total County Total County Total Taxable Value %
2009 8,825,074,848$ 5.1% 31,812,886,490$ 18.3% 64,728,962,196$ 37.3% 15,650,088,801$ 9.0% 52,622,968,994$ 30.3% 173,639,981,329$ 100.0%2010 8,572,010,718 5.1% 31,010,555,286 18.4% 62,411,551,405 37.1% 15,271,517,551 9.1% 50,934,805,540 30.3% 168,200,440,500 100.0%2011 7,953,592,697 5.2% 27,895,119,373 18.4% 55,081,707,586 36.3% 14,496,599,262 9.5% 46,582,482,079 30.6% 152,009,500,997 100.0%2012 8,195,851,938 5.8% 25,840,445,900 18.1% 50,798,540,257 35.7% 14,083,128,684 9.9% 43,605,427,141 30.6% 142,523,393,920 100.0%2013 7,482,442,287 5.5% 24,255,702,728 17.8% 49,235,953,993 36.2% 13,976,296,665 10.2% 41,423,614,473 30.4% 136,374,010,146 100.0%2014 7,571,057,139 5.6% 24,113,941,897 17.7% 49,235,110,306 36.3% 14,210,463,343 10.4% 40,939,078,135 30.1% 136,069,650,820 100.0%2015 7,682,984,917 5.6% 24,563,858,227 18.0% 50,048,650,087 36.7% 14,496,462,571 10.6% 40,043,688,852 29.3% 136,835,644,654 100.0%2016 8,053,582,840 5.7% 25,475,376,698 18.1% 51,895,341,437 37.0% 14,925,676,802 10.6% 40,277,598,655 28.6% 140,627,576,432 100.0%2017 8,193,575,309 5.8% 25,264,565,701 18.0% 52,786,202,473 37.6% 15,257,429,398 10.8% 39,162,074,391 27.8% 140,663,847,272 100.0%2018 8,463,028,554 5.9% 25,997,372,246 18.0% 54,723,743,027 38.0% 15,807,731,211 10.9% 39,461,393,021 27.3% 144,453,268,059 100.0%
Source: Livingston, Macomb, Oakland, Washtenaw, and Wayne County Assessing and Equalization Departments.
Note: Property tax levies are not collected directly by Huron-Clinton Metropolitan Authority. Authority property tax levies are collected by local communities within the five county park district and areforwarded to each County Treasurer who distributes the Authority's tax levy to the park district. Accordingly, individual taxpayer records are not maintained by Huron-Clinton Metropolitan Authority.
Huron-Clinton Metropolitan AuthorityTaxable Valuations by County
Last Ten Fiscal Years(Unaudited)
6 - 7

AuthorityYear Millage Rate (a)
2009 0.21462010 0.21462011 0.21462012 0.21462013 0.21462014 0.21462015 0.21462016 0.21462017 0.21462018 0.2141
(a) Huron-Clinton Metropolitan Authority operates in five different counties encompassing many different townships, cities, and school districts.Huron-Clinton Metropolitan Authority does not collect any taxes on behalf of any other governmental entity.
Source: Livingston, Macomb, Oakland, Washtenaw, and Wayne County Assessing and Equalization Departments.
(Unaudited)
Huron-Clinton Metropolitan AuthorityProperty Tax Rates (Per $1,000 of Value)
Last Ten Fiscal Years
6 - 8

Initial Current Year Percent of Prior Years Prior Years Percent of Total Percent of Outstanding TaxTax Tax Current Year Tax Receivable Tax Receivable Prior Years Tax Total Tax Receivable Balances
Year Levy (a) Collections (b) Taxes Collected Balances Collections (b) Taxes Collected Collections Collections (c) At Year End
2009 35,875,236$ 36,085,090$ 100.6% 891,926$ (130,847)$ -14.7% 35,954,243$ 97.8% 774,623$ 2010 34,594,391 34,777,802 100.5% 774,623 (249,370) -32.2% 34,528,432 97.6% 446,9962011 31,348,452 31,179,480 99.5% 121,434 (230,372) -189.7% 30,949,108 98.3% 239,0582012 30,311,637 29,158,227 96.2% 63,840 (238,136) -373.0% 28,920,092 95.2% 110,9142013 29,093,937 28,015,682 96.3% 53,383 (209,270) -392.0% 27,806,412 95.4% 136,7602014 28,950,466 28,419,636 98.2% 93,563 37,629 40.2% 28,457,265 98.0% 193,1542015 29,147,709 28,155,589 96.6% 193,154 265,079 137.2% 28,420,668 96.9% 155,5782016 29,956,861 29,330,025 97.9% 155,578 42,697 27.4% 29,372,722 97.5% 175,5412017 30,002,724 33,389,306 111.3% 175,541 128,223 73.0% 33,517,529 111.1% 178,7212018 30,736,230 28,385,251 92.4% 178,721 57,299 32.1% 28,442,550 92.0% 1,752,480
Source: Huron-Clinton Metropolitan Authority and various County collection records.
(a) Initial tax levy amounts exclude Industrial, Commercial, Downtown Development Authority, Tax Incremental FinancingAuthority tax abatement properties, Board of Review, and State Tax Tribunal adjustments.
(b) Tax collection amounts are net of refunds ordered by Boards of Review and the State Tax Tribunal.
(c) Compares total tax collections to initial tax levy and prior years tax receivable balances at year end.
Huron-Clinton Metropolitan AuthorityProperty Tax Levies and Collections
Last Ten Fiscal Years(Unaudited)
6 - 9

Percent of Percent ofTotal Authority Total Authority
Taxpayer Taxable Value (a) Rank Taxable Value Taxable Value (a) Rank Taxable Value
Detroit Edison 2,259,522,613$ 1 1.56% 2,007,518,013$ 3 1.16%Ford Motor Company 849,392,676 2 0.59% 2,400,731,201 1 1.38%Consumers Energy 604,075,895 3 0.42% 323,496,007 5 0.19%Daimler/Chrysler 445,813,519 4 0.31% 1,588,287,195 4 0.91%General Motors 432,764,182 5 0.30% 2,093,636,357 2 1.21%ITC 379,475,318 6 0.26% - - - Marathon Oil Company 308,504,089 7 0.21% 151,186,066 9 0.09%Michigan Consolidated Gas 304,312,801 8 0.21% 147,837,523 10 0.09%Vanguard Health Systems- Hospitals 288,072,442 9 0.20% - - - Enbridge Energy 257,432,976 10 0.18% - - - MGM Grand Detroit LLC - - - 296,307,555 6 0.17%Pfizer Global - - - 238,483,825 7 0.14%United States Steel - - - 225,026,607 8 0.13%
Total Ten Largest Taxpayers 6,129,366,511$ 4.24% 9,472,510,349$ 5.56%
Source: Livingston, Macomb, Oakland, Washtenaw, and Wayne County Assessing and Equalization Departments.
2018 2009
(a) Taxable values include Industrial Facility Act 198 properties and Commercial Facility Act 255 properties. Taxable values have been combined if the taxpayer has locations in more than one county.
Huron-Clinton Metropolitan AuthorityPrincipal Property TaxpayersCurrent and Ten Years Ago
(Unaudited)
6 - 10
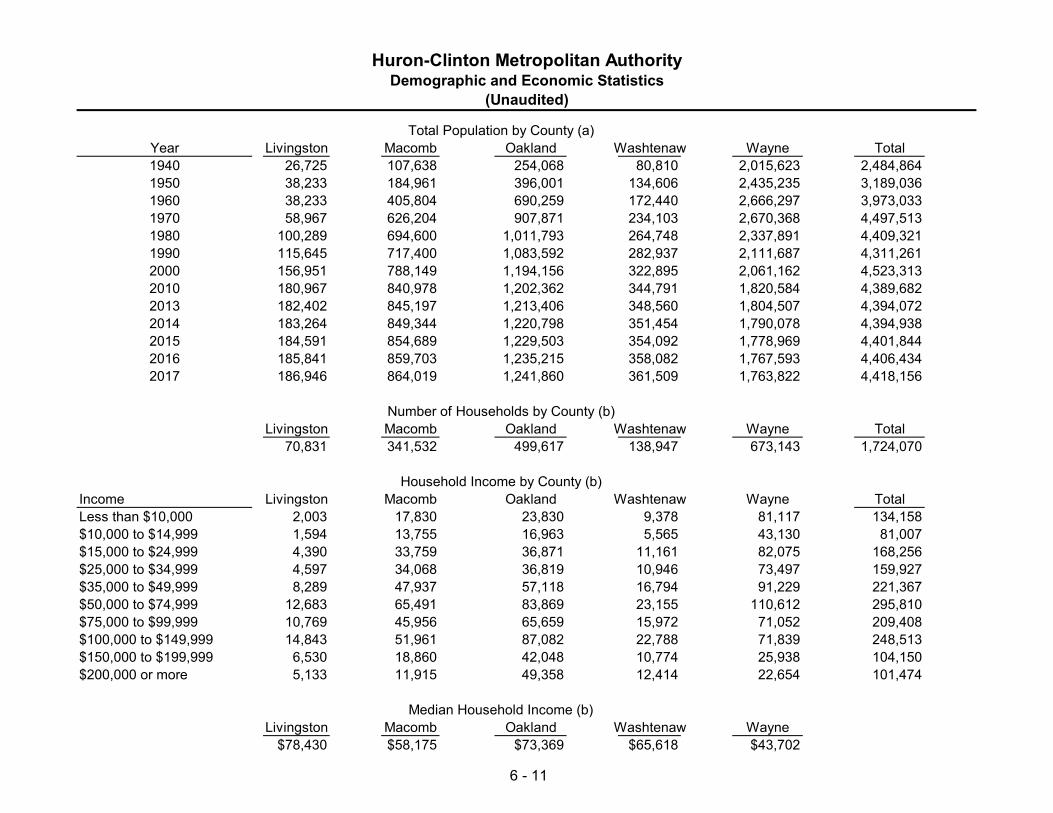
Total Population by County (a)Year Livingston Macomb Oakland Washtenaw Wayne Total1940 26,725 107,638 254,068 80,810 2,015,623 2,484,8641950 38,233 184,961 396,001 134,606 2,435,235 3,189,0361960 38,233 405,804 690,259 172,440 2,666,297 3,973,0331970 58,967 626,204 907,871 234,103 2,670,368 4,497,5131980 100,289 694,600 1,011,793 264,748 2,337,891 4,409,3211990 115,645 717,400 1,083,592 282,937 2,111,687 4,311,2612000 156,951 788,149 1,194,156 322,895 2,061,162 4,523,3132010 180,967 840,978 1,202,362 344,791 1,820,584 4,389,6822013 182,402 845,197 1,213,406 348,560 1,804,507 4,394,0722014 183,264 849,344 1,220,798 351,454 1,790,078 4,394,9382015 184,591 854,689 1,229,503 354,092 1,778,969 4,401,8442016 185,841 859,703 1,235,215 358,082 1,767,593 4,406,4342017 186,946 864,019 1,241,860 361,509 1,763,822 4,418,156
Number of Households by County (b)Livingston Macomb Oakland Washtenaw Wayne Total
70,831 341,532 499,617 138,947 673,143 1,724,070
Household Income by County (b)Income Livingston Macomb Oakland Washtenaw Wayne TotalLess than $10,000 2,003 17,830 23,830 9,378 81,117 134,158$10,000 to $14,999 1,594 13,755 16,963 5,565 43,130 81,007$15,000 to $24,999 4,390 33,759 36,871 11,161 82,075 168,256$25,000 to $34,999 4,597 34,068 36,819 10,946 73,497 159,927$35,000 to $49,999 8,289 47,937 57,118 16,794 91,229 221,367$50,000 to $74,999 12,683 65,491 83,869 23,155 110,612 295,810$75,000 to $99,999 10,769 45,956 65,659 15,972 71,052 209,408$100,000 to $149,999 14,843 51,961 87,082 22,788 71,839 248,513$150,000 to $199,999 6,530 18,860 42,048 10,774 25,938 104,150$200,000 or more 5,133 11,915 49,358 12,414 22,654 101,474
Median Household Income (b)Livingston Macomb Oakland Washtenaw Wayne
$78,430 $58,175 $73,369 $65,618 $43,702
Huron-Clinton Metropolitan AuthorityDemographic and Economic Statistics
(Unaudited)
6 - 11

Huron-Clinton Metropolitan AuthorityDemographic and Economic Statistics
(Unaudited)
Ethnicity by County (a)Ethnicity Livingston Macomb Oakland Washtenaw Wayne TotalWhite 180,154 96.37% 709,260 82.09% 939,218 75.63% 267,225 73.92% 937,802 53.17% 3,033,659 68.66%Black or African American 1,035 0.55% 95,399 11.04% 170,390 13.72% 42,966 11.89% 689,583 39.10% 999,373 22.62%American Indian & Alaska Nat 495 0.26% 2,504 0.29% 3,282 0.26% 1,214 0.34% 5,673 0.32% 13,168 0.30%Asian 1,746 0.93% 31,889 3.69% 84,806 6.83% 31,505 8.71% 54,995 3.12% 204,941 4.64%Native Hawaiian/Other Pacific 119 0.06% 372 0.04% 237 0.02% 151 0.04% 389 0.02% 1,268 0.03%Other Race 592 0.32% 4,680 0.54% 9,524 0.77% 2,651 0.73% 34,129 1.93% 51,576 1.17%Two or More Races 2,805 1.50% 19,915 2.30% 34,403 2.77% 15,797 4.37% 41,251 2.34% 114,171 2.58%
186,946 864,019 1,241,860 361,509 1,763,822 4,418,156
Age by County (a)Age Livingston Macomb Oakland Washtenaw Wayne Totalunder 5 9,481 5.07% 47,524 5.50% 68,048 5.48% 18,390 5.09% 115,340 6.54% 258,783 5.86%5 through 9 10,858 5.81% 50,782 5.88% 73,155 5.89% 18,995 5.25% 113,479 6.43% 267,269 6.05%10 through 14 13,222 7.07% 54,164 6.27% 78,762 6.34% 19,938 5.52% 119,868 6.80% 285,954 6.47%15 through 19 13,266 7.10% 53,459 6.19% 79,381 6.39% 32,385 8.96% 116,790 6.62% 295,281 6.68%20 through 24 10,848 5.80% 54,755 6.34% 74,370 5.99% 47,813 13.23% 125,083 7.09% 312,869 7.08%25 through 34 19,128 10.23% 109,070 12.62% 155,300 12.51% 50,876 14.07% 229,836 13.03% 564,210 12.77%35 through 44 22,112 11.83% 108,356 12.54% 158,333 12.75% 41,610 11.51% 215,620 12.22% 546,031 12.36%45 through 54 31,006 16.59% 128,371 14.86% 185,829 14.96% 44,470 12.30% 240,262 13.62% 629,938 14.26%55 through 59 15,362 8.22% 64,561 7.47% 94,815 7.63% 21,251 5.88% 125,009 7.09% 320,998 7.27%60 through 64 13,223 7.07% 55,666 6.44% 81,390 6.55% 20,679 5.72% 108,895 6.17% 279,853 6.33%65 through 74 17,863 9.56% 77,055 8.92% 112,677 9.07% 27,439 7.59% 144,522 8.19% 379,556 8.59%75 through 84 7,980 4.27% 40,074 4.64% 53,573 4.31% 12,149 3.36% 73,462 4.16% 187,238 4.24%85 and over 2,597 1.39% 20,182 2.34% 26,227 2.11% 5,514 1.53% 35,656 2.02% 90,176 2.04%
186,946 864,019 1,241,860 361,509 1,763,822 4,418,156
Data from 2011-2015 American Community Survey 5-Year Estimates:
(b) Selected Economic Characteristics (DP03)(a) ACS Demographic and Housing Estimates (DP05)
6 - 12

Percentage of Percentage ofTotal Region Total Region
Employer Employees Rank Employment Employees Rank Employment
Ford Motor Company 46,665 1 6.9% 106,278 1 15.3%General Motors 32,182 2 7.8% 74,549 2 12.9%University of Michigan Hospitals 31,920 3 15.4% 58,378 3 17.5%FCA US LLC (formerly Chrysler) 31,808 4 5.8% 52,208 4 8.1%Beaumont Health System 25,692 5 3.9% 14,610 10 2.6%Henry Ford Health System 15,323 6 2.4% 22,083 6 3.2%US Government/Postal Service 14,898 7 2.7% 44,576 5 7.6%Rock Ventures 14,237 8 2.0% - - -General Dynamics 11,178 9 1.9% - - -Trinity Health 9,299 10 3.7% - - -Ascension Michigan (formerly St. John) - - - 21,512 7 3.2%Detroit Public Schools - - - 17,329 8 2.2%Oakwood healthcare, Inc - - - 15,028 9 1.9%
233,202 52.5% 426,551 74.5%
Sources: Crain's Detroit Business, Michigan Department of Technology, Management, and Budget, Livingston, Macomb, Oakland, Washtenaw, and Wayne County annual financial statements.
2018 2008
Huron-Clinton Metropolitan AuthorityPrincipal Employers
Current and Ten Years Ago(Unaudited)
6 - 13

2018 2017 2016 2015 2014 2013 2012 2011 2010 2009Location
Administrative Office 65 67 58 53 50 53 54 56 51 52Lake St. Clair Metropark 55 57 56 53 51 57 55 55 59 64Kensington Metropark 94 97 96 88 82 80 81 85 95 100Lower Huron Metropark 85 89 94 88 83 84 85 86 94 91Hudson Mills Metropark 29 29 29 29 28 32 35 33 34 36Stony Creek Metropark 59 63 63 56 53 55 53 55 58 61Lake Erie Metropark 49 45 44 43 45 48 48 47 51 53Wolcott Mill Metropark 18 18 23 20 16 16 19 20 21 22Indian Springs Metropark 23 23 24 25 24 22 22 24 26 26Huron Meadows Metropark 12 12 12 12 11 11 12 14 17 18
Total 489 500 499 467 443 458 464 475 506 523
Huron-Clinton Metropolitan AuthorityFull-Time Equivalent Employees by Location
Last Ten Fiscal Years(Unaudited)
6 - 14

2018 2017 2016 2015* 2014 2013 2012 2011 2010 2009
Number of Regional Parks 13 13 13 13 13 13 13 13 13 13
Vehicle Count 2,906,524 2,921,824 2,947,885 2,859,720Estimated Attendance*** 7,266,310 7,304,560 7,369,713 7,149,300 7,939,916 8,420,298 8,866,125 8,434,169 9,203,225 9,174,119
Land (acres)All Land **** 24,508 24,508 24,521 24,521Encumbered for Recreation 14,761 14,761 14,761 14,761Leased for Farming 491 491 595 595Leased for Recreation 450 450 450 450Leased for Utilities 24 24 24 24
3,691 3,691 3,691 3,099 3,099 2,261 2,261 2,281 2,694 2,699
Trails (miles)Nature/Hiking 59 59 58 58Paved/Shared Use 90 90 84 84Equestrian 36 36 36 36Cross Country Ski 64 64 64 64 81 80 80 80 75 75Mountain Biking 19 19 19 19Maintenance Paths 81 81 81 81
Aquatic FacilitiesAquatic Centers ** 5 5Spray Pads** 2 2 4 4 4 4 4 4 4 4Pools ** 4 4 4 4 4 4 4 4Beaches 5 5 5 5 5 5 5 5 5 5Boat Launches 50 50 50 50 46 44 44 44 44 44Boat Rental Facilities-Metropark operated 4 4 6 6 5 6 6 6 5 5Boat Rental Facilities-Concessionaire operated 3 2Fishing Platforms 16 16 16 16Marinas - Number of Boat Slips 393 393 393 393 498 509 509 553 553 505
Winter FacilitiesIce Skating Areas 4 4 4 4Sledding Areas 8 8 8 8
InfrastructureBuildings 484 484 489 489Roads (miles) 68 68 68 68Parking Spaces 19,332 19,332 19,332 19,332
Huron-Clinton Metropolitan AuthorityCapital Asset Statistics by Function/Program
Last Ten Fiscal Years
General Grounds Maintenance - Acres Mowed Annually
(Unaudited)
6 - 15

2018 2017 2016 2015* 2014 2013 2012 2011 2010 2009
Huron-Clinton Metropolitan AuthorityCapital Asset Statistics by Function/Program
Last Ten Fiscal Years(Unaudited)
Great Lakes Shoreline (miles) 14 14 14 14
Inland Lakes (acres) 3,634 3,634 3,634 3,634
Recreation FacilitiesRegulation 18 Hole Courses 7 7 8 8 8 8 8 8 8 8
Number of Golf Rounds 174,580 176,231 190,527 191,605 169,157 182,333 187,868 184,837 204,839 206,271Par 3 Courses 1 1 2 2 2 2 2 2 2 2
Number of Golf Rounds 6,784 4,249 14,025 14,257 12,971 17,238 19,829 17,879 24,858 32,920Number of Foot Golf Rounds 324 784
Driving Ranges 5 5 6 6 6 5 5 5 5 5Disc Golf Courses 5 5 5 5
Disc Golf Holes 135 135 135 135 126 123 123 120 120 123Playgrounds 77 77 78 78 51 50 50 49 45 45Picnic Shelters 86 86 87 87 91 91 91 92 87 86Picnic Areas 70 70 88 88 89 90 85 85Tennis Courts 4 8 9 9 8 8 8 8 8 8Pickelball Courts 3 3Basketball Courts 15 15 15 15 18 19 19 19 19 19Sand Volleyball Courts 39 39 38 38Baseball Fields 21 22 28 28
Interpretive CentersEnvironmental Discovery Center 1 1 1 1 1 1 1 1 1 1Farm Centers 2 2 2 2 2 2 2 2 2 2Grist Mill 1 1 1 1 1 1 1 1 1 1Nature Centers 6 6 6 6 6 6 6 6 6 6Mobile Metropark 3 3 3 1 1 1 1 1 1 1Number of Visitors 1,503,582 1,487,666 1,470,541 1,382,962 1,459,000 1,549,800 1,657,759 1,681,737 1,761,071 1,757,499Number of Interpretive Programs 5,944 5,553 5,520 7,580 7,175 7,478 9,706 10,181 10,106 10,458
Special Event Facilities 6 6 6 6
Excursion Boat 1 1 1 1 1 1 1 1 1 1
Public SafetyNumber of Patrol Vehicles 36 36 36 36 36 36 39 39 37 37Number of Law Violations
Arrests 40 50 25 30 24 20 19 13 28 41Traffic Violations 330 193 333 295 225 221 175 232 305 366Other Violations 87 82 129 167 75 49 56 129 120 148
6 - 16
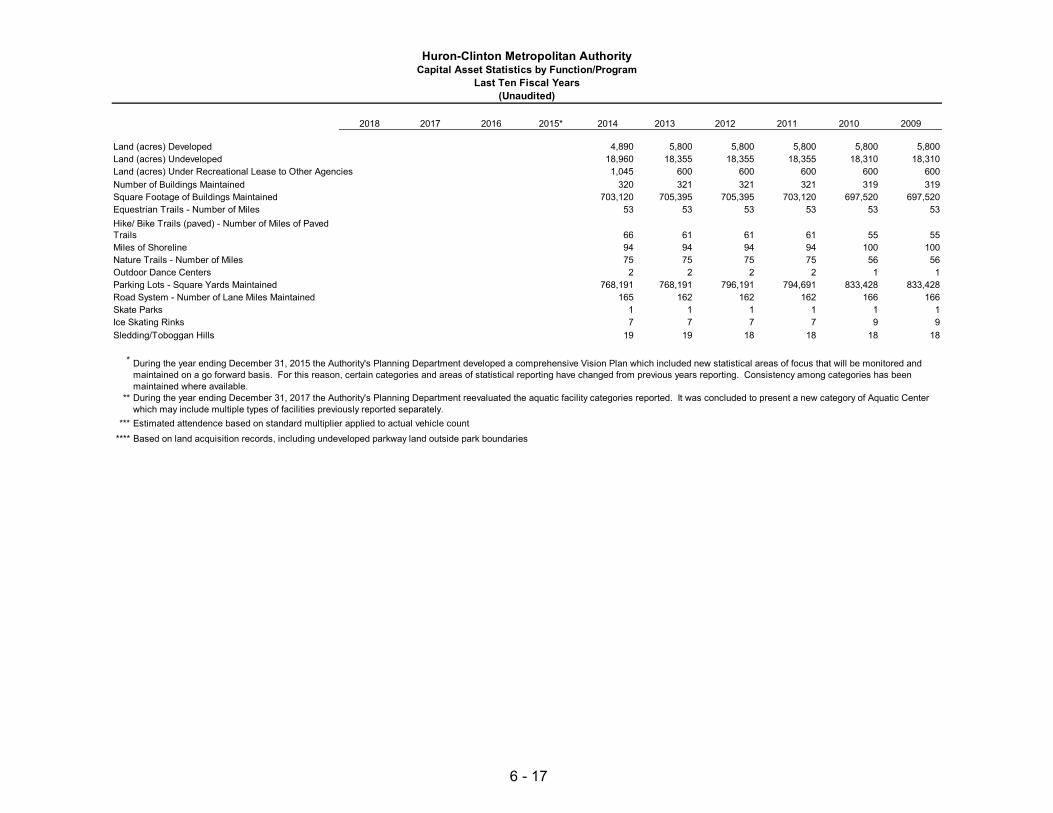
2018 2017 2016 2015* 2014 2013 2012 2011 2010 2009
Huron-Clinton Metropolitan AuthorityCapital Asset Statistics by Function/Program
Last Ten Fiscal Years(Unaudited)
Land (acres) Developed 4,890 5,800 5,800 5,800 5,800 5,800Land (acres) Undeveloped 18,960 18,355 18,355 18,355 18,310 18,310Land (acres) Under Recreational Lease to Other Agencies 1,045 600 600 600 600 600Number of Buildings Maintained 320 321 321 321 319 319Square Footage of Buildings Maintained 703,120 705,395 705,395 703,120 697,520 697,520Equestrian Trails - Number of Miles 53 53 53 53 53 53
66 61 61 61 55 55Miles of Shoreline 94 94 94 94 100 100Nature Trails - Number of Miles 75 75 75 75 56 56Outdoor Dance Centers 2 2 2 2 1 1Parking Lots - Square Yards Maintained 768,191 768,191 796,191 794,691 833,428 833,428Road System - Number of Lane Miles Maintained 165 162 162 162 166 166Skate Parks 1 1 1 1 1 1Ice Skating Rinks 7 7 7 7 9 9Sledding/Toboggan Hills 19 19 18 18 18 18
*
**
*** Estimated attendence based on standard multiplier applied to actual vehicle count**** Based on land acquisition records, including undeveloped parkway land outside park boundaries
During the year ending December 31, 2017 the Authority's Planning Department reevaluated the aquatic facility categories reported. It was concluded to present a new category of Aquatic Center which may include multiple types of facilities previously reported separately.
During the year ending December 31, 2015 the Authority's Planning Department developed a comprehensive Vision Plan which included new statistical areas of focus that will be monitored and maintained on a go forward basis. For this reason, certain categories and areas of statistical reporting have changed from previous years reporting. Consistency among categories has been maintained where available.
Hike/ Bike Trails (paved) - Number of Miles of Paved Trails
6 - 17

SupplementalMajor Capital
Capital Land Major General Park Maintenance ProjectsYear Improvements Equipment Acquisition Maintenance Administration Operations Fund Fund Total
2009 9,347,177$ 1,821,169$ 1,603,169$ 1,442,499$ 6,958,695$ 32,062,270$ 309,183$ -$ 53,544,162$ 2010 4,494,392 1,972,142 10,423 1,131,938 7,088,861 32,131,822 190,332 - 47,019,910 2011 3,456,892 965,066 565,997 1,106,658 7,075,619 31,717,979 1,078,344 - 45,966,555 2012 2,491,443 1,170,104 2,350 1,553,104 7,538,185 29,706,692 1,930,912 - 44,392,790 2013 5,068,491 1,531,932 28,820 704,328 6,990,592 28,829,491 292,196 - 43,445,850 2014 4,879,504 1,225,463 269,846 1,435,517 7,640,052 29,119,023 382,460 - 44,951,865 2015 3,212,855 1,370,378 177,591 1,786,274 7,516,737 31,518,622 94,579 - 45,677,036 2016 4,159,886 3,089,427 5,056 1,926,210 7,371,706 32,622,292 - - 49,174,577 2017 7,523,357 2,801,066 10,900 2,270,033 9,122,348 33,299,256 - - 55,026,960 2018 - 1,836,785 - 2,546,141 9,254,259 32,843,656 - 2,130,516 48,611,357
Huron-Clinton Metropolitan AuthorityMetropark General Governmental Expenditures by Type
Last Ten Fiscal Years(Unaudited)
6 - 18

2009 2010 2011 2012 2013 2014 2015 2016 2017 2018 Total (a)Capital Projects Fund
Administrative Office -$ -$ -$ -$ 15,070$ 45,000$ -$ 112,999$ 88,600$ -$ 261,669$ Lake St. Clair Metropark 3,070,170 779,453 164,896 501,752 3,388,101 247,053 252,381 1,236,529 3,877,088 253,892 13,771,315 Kensington Metropark 3,907,319 991,397 2,417,637 275,844 123,195 2,008,956 452,571 299,491 727,346 231,173 11,434,929 Dexter-Delhi Metropark 45,269 21,066 129,214 25,859 14,659 34,885 - - - - 270,952 Lower Huron/Willow/Oakwoods Metropark 1,213,040 842,785 274,389 269,893 516,245 66,796 156,782 51,322 593,005 93,124 4,077,381 Hudson Mills Metropark 103,637 324,848 158,655 97,746 525,153 303,410 110,901 36,544 56,897 40,895 1,758,686 Stony Creek Metropark 216,901 344,335 135,328 1,182,503 125,936 237,809 1,405,205 1,820,937 1,361,602 1,193,394 8,023,950 Lake Erie Metropark 221,474 714,069 118,017 36,280 55,787 351,366 27,186 223,999 408,973 34,586 2,191,737 Wolcott Mill Metropark 110,013 29,399 14,417 35,032 78,544 60,035 389,335 363,060 230,446 95,491 1,405,772 Indian Springs Metropark 373,191 312,175 41,265 37,288 167,628 325,956 371,525 15,005 155,170 4,674 1,803,877 Huron Meadows Metropark 86,163 134,865 3,074 29,246 58,173 1,198,238 46,969 - 24,230 183,287 1,764,245 Cost Share Other Agencies - - - - - - - - - - -
Total 9,347,177 4,494,392 3,456,892 2,491,443 5,068,491 4,879,504 3,212,855 4,159,886 7,523,357 2,130,516 46,764,513
EquipmentCentral Pool Equipment 56,383 167,493 274,595 107,813 172,763 630,121 231,321 313,470 157,070 200,530 2,311,559 Lake St. Clair Metropark 97,496 236,282 113,685 213,150 109,896 142,484 206,783 235,466 275,544 134,871 1,765,657 Kensington Metropark 288,600 453,310 140,575 318,761 230,212 149,257 207,324 585,804 613,122 290,650 3,277,615 Lower Huron/Willow/Oakwoods Metropark 485,485 188,961 260,665 132,884 94,976 69,759 139,967 497,397 742,245 263,752 2,876,091 Hudson Mills Metropark 133,418 85,560 40,422 12,656 117,115 82,700 36,814 156,368 29,781 125,884 820,718 Stony Creek Metropark 131,759 282,333 67,235 257,776 282,583 46,107 332,084 634,571 511,883 340,088 2,886,419 Willow/Oakwoods Metroparks 272,597 72,601 189,437 57,047 32,710 1,320 - - - - 625,712 Lake Erie Metropark 147,267 111,636 16,638 1,250 358,709 10,558 66,180 316,289 221,945 159,697 1,410,169 Wolcott Mill Metropark 60,477 19,071 22,966 8,906 11,095 35,050 41,751 169,864 86,887 128,129 584,196 Indian Springs Metropark 304,666 77,778 28,285 94,408 91,409 17,537 85,280 78,549 62,471 39,689 880,072 Huron Meadows Metropark 115,618 349,718 - 22,500 63,174 41,890 22,874 101,649 100,118 153,495 971,036
Total 1,821,169 1,972,142 965,066 1,170,104 1,531,932 1,225,463 1,370,378 3,089,427 2,801,066 1,836,785 17,783,532
Land AcquisitionLake St. Clair Metropark - - - - 19,456 72,859 177,591 5,056 - - 274,962 Kensington Metropark - - - - 2,950 - - - - - 2,950 Wolcott Mill Metropark 5,650 8,400 287,884 2,350 6,414 196,737 - - - - 507,435 Indian Springs Metropark 1,593,769 23 273,813 - - - - - - - 1,867,605 Huron Meadows 2,800 2,000 - - - - - - 10,900 - 15,700 Other Metroparks 950 - 4,300 - - 250 - - - - 5,500
Total 1,603,169 10,423 565,997 2,350 28,820 269,846 177,591 5,056 10,900 - 2,674,152
Huron-Clinton Metropolitan AuthorityMetropark General Governmental Expenditures by Park
Last Ten Fiscal Years(Unaudited)
6 - 19
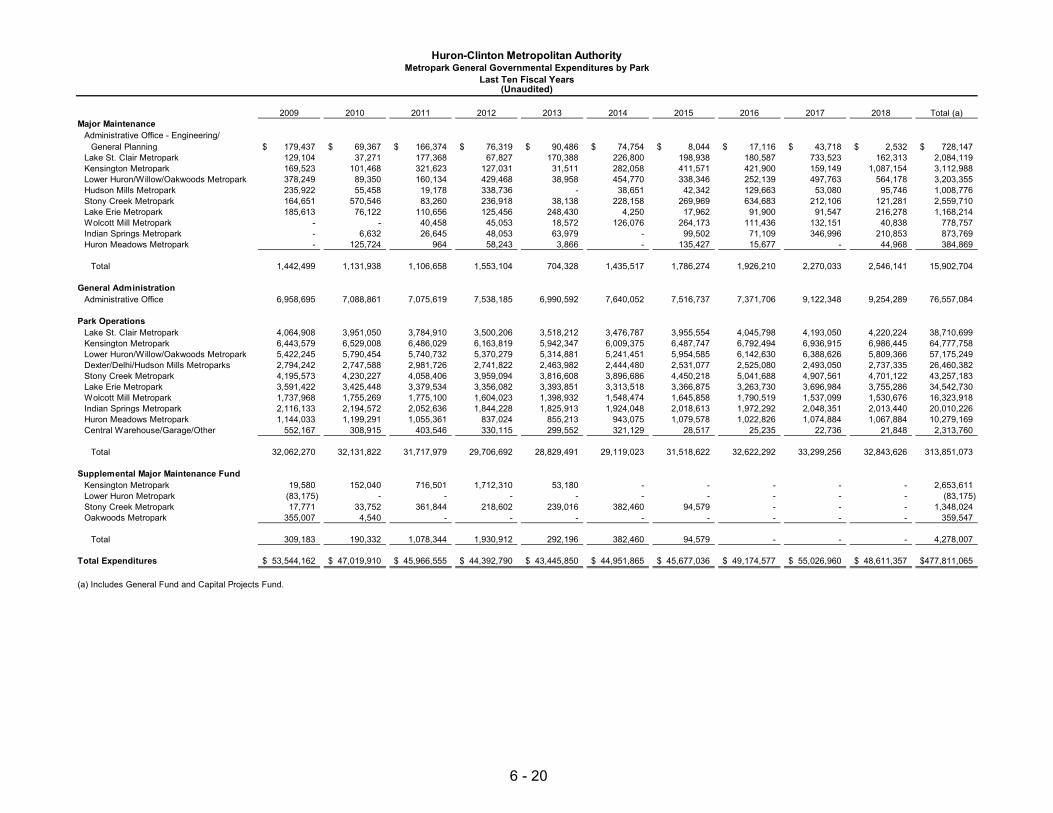
Huron-Clinton Metropolitan AuthorityMetropark General Governmental Expenditures by Park
Last Ten Fiscal Years(Unaudited)
2009 2010 2011 2012 2013 2014 2015 2016 2017 2018 Total (a)Major Maintenance
Administrative Office - Engineering/General Planning 179,437$ 69,367$ 166,374$ 76,319$ 90,486$ 74,754$ 8,044$ 17,116$ 43,718$ 2,532$ 728,147$
Lake St. Clair Metropark 129,104 37,271 177,368 67,827 170,388 226,800 198,938 180,587 733,523 162,313 2,084,119 Kensington Metropark 169,523 101,468 321,623 127,031 31,511 282,058 411,571 421,900 159,149 1,087,154 3,112,988 Lower Huron/Willow/Oakwoods Metropark 378,249 89,350 160,134 429,468 38,958 454,770 338,346 252,139 497,763 564,178 3,203,355 Hudson Mills Metropark 235,922 55,458 19,178 338,736 - 38,651 42,342 129,663 53,080 95,746 1,008,776 Stony Creek Metropark 164,651 570,546 83,260 236,918 38,138 228,158 269,969 634,683 212,106 121,281 2,559,710 Lake Erie Metropark 185,613 76,122 110,656 125,456 248,430 4,250 17,962 91,900 91,547 216,278 1,168,214 Wolcott Mill Metropark - - 40,458 45,053 18,572 126,076 264,173 111,436 132,151 40,838 778,757 Indian Springs Metropark - 6,632 26,645 48,053 63,979 - 99,502 71,109 346,996 210,853 873,769 Huron Meadows Metropark - 125,724 964 58,243 3,866 - 135,427 15,677 - 44,968 384,869
Total 1,442,499 1,131,938 1,106,658 1,553,104 704,328 1,435,517 1,786,274 1,926,210 2,270,033 2,546,141 15,902,704
General AdministrationAdministrative Office 6,958,695 7,088,861 7,075,619 7,538,185 6,990,592 7,640,052 7,516,737 7,371,706 9,122,348 9,254,289 76,557,084
Park OperationsLake St. Clair Metropark 4,064,908 3,951,050 3,784,910 3,500,206 3,518,212 3,476,787 3,955,554 4,045,798 4,193,050 4,220,224 38,710,699 Kensington Metropark 6,443,579 6,529,008 6,486,029 6,163,819 5,942,347 6,009,375 6,487,747 6,792,494 6,936,915 6,986,445 64,777,758 Lower Huron/Willow/Oakwoods Metropark 5,422,245 5,790,454 5,740,732 5,370,279 5,314,881 5,241,451 5,954,585 6,142,630 6,388,626 5,809,366 57,175,249 Dexter/Delhi/Hudson Mills Metroparks 2,794,242 2,747,588 2,981,726 2,741,822 2,463,982 2,444,480 2,531,077 2,525,080 2,493,050 2,737,335 26,460,382 Stony Creek Metropark 4,195,573 4,230,227 4,058,406 3,959,094 3,816,608 3,896,686 4,450,218 5,041,688 4,907,561 4,701,122 43,257,183 Lake Erie Metropark 3,591,422 3,425,448 3,379,534 3,356,082 3,393,851 3,313,518 3,366,875 3,263,730 3,696,984 3,755,286 34,542,730 Wolcott Mill Metropark 1,737,968 1,755,269 1,775,100 1,604,023 1,398,932 1,548,474 1,645,858 1,790,519 1,537,099 1,530,676 16,323,918 Indian Springs Metropark 2,116,133 2,194,572 2,052,636 1,844,228 1,825,913 1,924,048 2,018,613 1,972,292 2,048,351 2,013,440 20,010,226 Huron Meadows Metropark 1,144,033 1,199,291 1,055,361 837,024 855,213 943,075 1,079,578 1,022,826 1,074,884 1,067,884 10,279,169 Central Warehouse/Garage/Other 552,167 308,915 403,546 330,115 299,552 321,129 28,517 25,235 22,736 21,848 2,313,760
Total 32,062,270 32,131,822 31,717,979 29,706,692 28,829,491 29,119,023 31,518,622 32,622,292 33,299,256 32,843,626 313,851,073
Supplemental Major Maintenance FundKensington Metropark 19,580 152,040 716,501 1,712,310 53,180 - - - - - 2,653,611 Lower Huron Metropark (83,175) - - - - - - - - - (83,175) Stony Creek Metropark 17,771 33,752 361,844 218,602 239,016 382,460 94,579 - - - 1,348,024 Oakwoods Metropark 355,007 4,540 - - - - - - - - 359,547
Total 309,183 190,332 1,078,344 1,930,912 292,196 382,460 94,579 - - - 4,278,007
Total Expenditures 53,544,162$ 47,019,910$ 45,966,555$ 44,392,790$ 43,445,850$ 44,951,865$ 45,677,036$ 49,174,577$ 55,026,960$ 48,611,357$ 477,811,065$
(a) Includes General Fund and Capital Projects Fund.
6 - 20

Other Supplemental CapitalProperty Park Financing Major Projects
Year Tax Operations Interest Grants Gifts Miscellaneous Sources Maintenance Fund Total (a)
2009 35,953,354$ 13,764,068$ 717,457$ 2,029,548$ 101,219$ 73,384$ 280,543$ 586,306$ -$ 53,505,879$ 2010 34,528,432 14,715,827 384,922 317,491 57,065 24,161 411,926 525,621 - 50,965,445 2011 30,691,073 14,151,725 266,837 351,412 110,423 28,460 126,880 426,633 - 46,153,443 2012 28,384,628 15,027,250 133,184 409,538 127,231 513,164 204,213 623,420 - 45,422,628 2013 27,662,759 14,519,872 198,255 2,050,630 167,123 27,567 223,069 316,736 - 45,166,011 2014 28,125,677 16,316,176 277,461 215,614 87,407 97,013 43,551 251,281 - 45,414,180 2015 28,503,130 17,893,737 344,745 217,896 337,171 987,949 192,480 76,693 - 48,553,801 2016 29,246,499 20,130,849 287,928 76,182 130,674 339,905 319,165 131,845 - 50,663,047 2017 30,658,374 19,340,845 449,196 284,871 245,687 351,495 643,421 129,437 - 52,103,326 2018 31,675,974 19,328,560 707,124 976,902 230,832 791,122 473,716 174,459 89,585 54,448,274
(a) Includes General Fund and Capital Projects Fund.
Huron-Clinton Metropolitan AuthorityMetropark General Governmental Revenue by Source
Last Ten Fiscal Years(Unaudited)
6 - 21
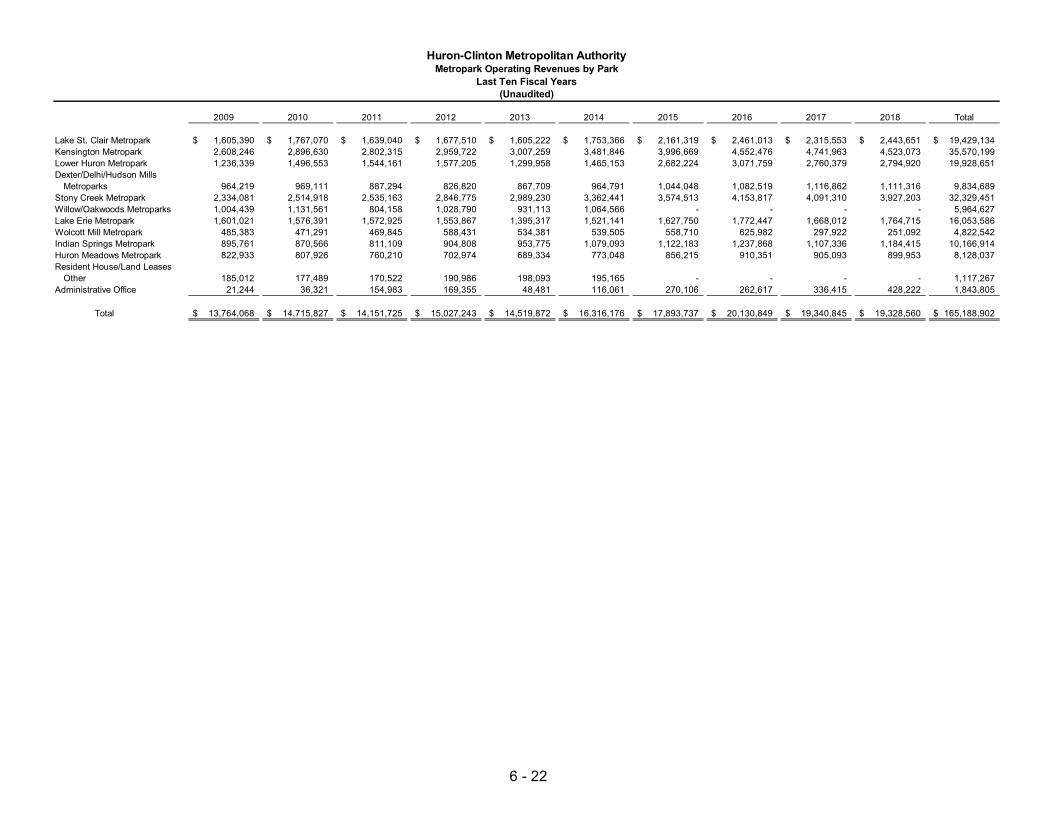
2009 2010 2011 2012 2013 2014 2015 2016 2017 2018 Total
Lake St. Clair Metropark 1,605,390$ 1,767,070$ 1,639,040$ 1,677,510$ 1,605,222$ 1,753,366$ 2,161,319$ 2,461,013$ 2,315,553$ 2,443,651$ 19,429,134$ Kensington Metropark 2,608,246 2,896,630 2,802,315 2,959,722 3,007,259 3,481,846 3,996,669 4,552,476 4,741,963 4,523,073 35,570,199 Lower Huron Metropark 1,236,339 1,496,553 1,544,161 1,577,205 1,299,958 1,465,153 2,682,224 3,071,759 2,760,379 2,794,920 19,928,651 Dexter/Delhi/Hudson Mills
Metroparks 964,219 969,111 887,294 826,820 867,709 964,791 1,044,048 1,082,519 1,116,862 1,111,316 9,834,689 Stony Creek Metropark 2,334,081 2,514,918 2,535,163 2,846,775 2,989,230 3,362,441 3,574,513 4,153,817 4,091,310 3,927,203 32,329,451 Willow/Oakwoods Metroparks 1,004,439 1,131,561 804,158 1,028,790 931,113 1,064,566 - - - - 5,964,627 Lake Erie Metropark 1,601,021 1,576,391 1,572,925 1,553,867 1,395,317 1,521,141 1,627,750 1,772,447 1,668,012 1,764,715 16,053,586 Wolcott Mill Metropark 485,383 471,291 469,845 588,431 534,381 539,505 558,710 625,982 297,922 251,092 4,822,542 Indian Springs Metropark 895,761 870,566 811,109 904,808 953,775 1,079,093 1,122,183 1,237,868 1,107,336 1,184,415 10,166,914 Huron Meadows Metropark 822,933 807,926 760,210 702,974 689,334 773,048 856,215 910,351 905,093 899,953 8,128,037 Resident House/Land Leases
Other 185,012 177,489 170,522 190,986 198,093 195,165 - - - - 1,117,267 Administrative Office 21,244 36,321 154,983 169,355 48,481 116,061 270,106 262,617 336,415 428,222 1,843,805
Total 13,764,068$ 14,715,827$ 14,151,725$ 15,027,243$ 14,519,872$ 16,316,176$ 17,893,737$ 20,130,849$ 19,340,845$ 19,328,560$ 165,188,902$
Huron-Clinton Metropolitan AuthorityMetropark Operating Revenues by Park
Last Ten Fiscal Years(Unaudited)
6 - 22

Type of Revenue 2009 2010 2011 2012 2013 2014 2015 2016 2017 2018 Total
Food Service (b) 814,336$ 803,573$ 778,782$ 730,059$ 774,520$ 1,201,877$ -$ -$ -$ -$ 5,103,147$ Aquatic 1,112,798 1,418,185 1,572,314 1,508,333 1,317,560 1,443,720 2,010,251 2,156,789 1,763,802 2,023,328 16,327,081 Dockage/ Boat Storage 373,705 390,105 396,478 371,748 366,101 362,701 383,575 394,197 372,635 332,845 3,744,090 Boat Rentals 2,732,120 275,897 326,887 338,251 357,399 389,421 460,095 476,722 436,904 419,298 6,212,994 Excursion Boat 37,532 38,555 44,441 44,668 49,598 49,634 44,102 17,098 55,502 49,785 430,915 Cross Country Skiing 41,744 45,513 55,021 26,076 48,047 86,234 62,642 32,959 37,810 55,945 491,991 Toll Collection 4,796,269 5,690,581 5,358,278 5,722,407 5,547,951 6,991,270 7,471,802 9,167,954 9,452,371 8,936,788 69,135,670 Sundries (b) 120,056 125,336 104,699 119,669 115,538 109,392 - - - - 694,690 Games/Equipment Rental (b) 41,141 38,712 4,375 17,463 28,875 32,390 - - - - 162,955 Activity Center 120,408 122,608 132,997 145,918 123,194 127,407 210,988 245,014 114,004 227,522 1,570,060 Shelter Reservations 320,730 342,550 338,830 351,044 405,270 369,415 373,751 377,988 313,010 376,057 3,568,645 Golf Course 4,930,968 4,636,348 4,041,661 4,518,659 4,332,837 4,137,391 5,345,559 5,695,553 5,033,276 5,221,081 47,893,333 Adventure/ Disc Golf 187,062 202,599 172,470 183,330 185,184 167,969 221,241 211,653 205,616 175,706 1,912,830 Special Events 21,141 25,760 48,829 41,301 83,653 56,331 157,462 220,531 102,998 16,501 774,508 Resident House/Land/Leases 118,857 107,025 113,597 131,925 137,138 127,157 131,640 130,127 136,301 224,469 1,358,236 Livestock Sales (b) 52,685 49,695 96,137 135,185 96,875 104,436 - - - - 535,013 Hay Rides (b) 38,047 37,794 37,803 34,612 42,069 48,301 - - - - 238,626 Site Location Fee (b) 29,155 18,785 24,980 16,269 30,760 38,244 - - - - 158,193 Interpretive 177,548 184,658 217,775 252,338 268,279 257,623 603,271 635,268 717,556 650,706 3,965,022 Intergovernmental (b) - - - - - - 206,713 197,395 200,946 203,787 808,841 Miscellaneous (b) 136,780 155,911 136,454 115,851 42,020 145,239 106,265 70,521 115,187 137,828 1,162,056 Other Park Revenues (a) 19,886 5,637 148,918 222,138 167,004 70,024 104,380 101,080 282,927 276,914 1,398,908
Total 16,222,968$ 14,715,827$ 14,151,726$ 15,027,244$ 14,519,872$ 16,316,176$ 17,893,737$ 20,130,849$ 19,340,845$ 19,328,560$ 167,647,804$
(a) Other Park Revenues include camping, trackless train, and mobile stage. (b) During the year ended December 31, 2015 the Authority revised their chart of accounts and reporting classifications. Certain types of operating revenues were consolidated into new or existing operating classifications. As such some historical comparisons are not available.
Huron-Clinton Metropolitan AuthorityMetropark Operating Revenues by Type
Last Ten Fiscal Years(Unaudited)
6 - 23