Panel Data Models using Stata - · PDF filePanel Data Models using Stata Source: otorres/Stata
Upload
jemimah-bakerCategory
view
217download
0
Hunting for Genes with Longitudinal Phenotype Data Using Stata
United Kingdom Stata Conference 2010September 9, 2010
John Charles “Chuck” Huber Jr, PhDAssistant Professor of Biostatistics
Department of Epidemiology and BiostatisticsSchool of Rural Public Health
Texas A&M Health Science [email protected]

Co-Authors
• Michael Hallman, PhD (Principal Investigator)• Ron Harrist, PhD• Victoria Friedel, MA• Melissa Richard, MS • Huandong Sun
All at University of Texas School of Public Health

Motivation – Project Heartbeat!
Reference: Fulton, JE, Dai, S, Grunbaum, JA, Boerwinkle, E, Labarthe, R (1999) Apolipoprotein E affects serial changesIn total and low-density lipoprotein cholesterol in adolescent girls: Project Heartbeat!. Metabolism 48(3): 285-290

Motivation
Reference: Fulton, JE, Dai, S, Grunbaum, JA, Boerwinkle, E, Labarthe, R (1999) Apolipoprotein E affects serial changesIn total and low-density lipoprotein cholesterol in adolescent girls: Project Heartbeat!. Metabolism 48(3): 285-290

Motivation
Reference: Fulton, JE, Dai, S, Grunbaum, JA, Boerwinkle, E, Labarthe, R (1999) Apolipoprotein E affects serial changesIn total and low-density lipoprotein cholesterol in adolescent girls: Project Heartbeat!. Metabolism 48(3): 285-290

Motivation
• Human genetics studies in the 1990s tended to focus on family data – Project Heartbeat! was a population-based study (no relatives)
• Genetic studies of unrelated individuals became popular in the 2000s
• Genetic markers called Single Nucleotide Polymorphisms (SNPs) became cheap to ascertain on a very large scale

What is a SNP?
Hartl & Jones (1998) pg 9, Figure 1.5

What is a SNP?
Watson et al. (2004) pg 23, Figure 2.5

What is a SNP?
• A SNP is a single nucleotide polymorphism (the individual nucleotides are called alleles)
ataagtcgatactgatgcatagctagctgactgacgcgat ataagtccatactgatgcatagctagctgactgaagcgat
ataagtccatactgatgcatagctagctgactgacgcgat
ataagtcgatactgatgcatagctagctgactgaagcgatSNP1 SNP2
Person 1 – Chromosome 1 Person 1 – Chromosome 2
Person 2 – Chromosome 1 Person 2 – Chromosome 2

Motivation
Stored Genotype Data Blood samples and
DNA available for 131 African-American and 505 non-Hispanic white children between 8 and 17 years of age.

Motivation
Stored Phenotype DataLongitudinal measurements of:Body Mass IndexTotal Cholesterol HDL & LDL CholesterolSystolic and Diastolic BPMuch, much more…..

Motivation
Let’s go gene hunting!!!

Challenges
1. Longitudinal Data – PLINK or HelixTree?2. Specialized genetic data analysis3. Need to run a very large number of graphs and models4. Multiple comparisons and replication5. Scaling up to 100,000 SNP Chips

Longitudinal Phenotype Data
No PLINK….
No HelixTree….
No dice?

Longitudinal Phenotype Data
• Stata is well equipped for longitudinal data– xtreg– xtgee– gllamm– xtmixed

Challenges
1. Longitudinal Data – PLINK or HelixTree?2. Specialized genetic data analysis3. Need to run a very large number of graphs and models4. Multiple comparisons and replication5. Scaling up to 100,000 SNP Chips

Genetic Data Analysis
1. Genotype Frequencies2. Allele Frequencies3. Hardy-Weinberg Equilibrium4. Haplotype Reconstruction5. Linkage Disequilibrium6. TagSNPs

Stata for Genetic Data Analysis
2007 UK Stata Users Group meeting:http://www.stata.com/meeting/13uk/
A brief introduction to genetic epidemiology using Stata Neil Shephard, University of Sheffield
An overview of using Stata to perform candidate gene association analysis will be presented. Areas covered will include data manipulation, Hardy–Weinberg equilibrium, calculating and plotting linkage disequilibrium, estimating haplotypes, and interfacing with external programs.

User Written Genetics Commands
Programs written by David Clayton• ginsheet- Read genotype data from text files.• gloci - Make a list of loci.• greshape - Reshape a file containing genotypes to a file of alleles.• gtab - Tabulate allele frequencies within genotypes and generate indicators (performs Hardy-Weinberg
Equilibrium testing).• gtype - Create a single genotype variable from two allele variables.• htype - Create a haplotype variable from allele variables.• mltdt - Multiple locus TDT for haplotype tagging SNPs (htSNPs).• origin - Analysis of parental origin effect in TDT trios.• pseudocc - Create a pseudo-case-control study from case-parent trios.• pscc - Experimental version of pseudocc in which there may be several groups of linked loci.• pwld - Pairwise linkage disequilibrium measures.• rclogit - Conditional logistic regression with robust standard errors.• snp2hap - Infer haplotypes of 2-locus SNP markers.• tdt - Classical TDT test.• trios - Tabulate genotypes of parent-offspring trios.

User Written Genetics Commands
Programs written by Adrian Mander• gipf - Graphical representation of log-linear models.• hapipf - Haplotype frequency estimation using an EM algorithm and log-linear modelling.• pedread - Read's pedigree data file (in pre-Makeped LINKAGE format), similar to ginsheet• pedsumm - Summarises a pre-Makeped LINKAGE file that is currently in Stata's memory.• pedraw - Draws one pedigree in the graphics window• plotmatrix - Produces LD heatmaps displaying graphically the strength of LD between markers.• profhap - Calculates profile likelihood confidence intervals for results from hapipf• swblock - A step-wise hapipf routine to identify the parsimonious model to describe the Haplotype block
pattern.• qhapipf - Analysis of quantitative traits using regression and log-linear modelling when phase is unknown.• hapblock - attempts to find the edge of areas containing high LD within a set of loci

User Written Genetics Commands
Programs written by Mario Cleves• gencc - Genetic case-control tests• genhw - Hardy-Weinberg Equilibrium tests• qtlsnp - A program for testng associations between SNPs an a quantitative trait.
Programs written by Catherine Saunders• co_power - Power calculations for Case-only study designs.• gei_matching - • geipower - Power calculations for Gene-Environment interactions.• ggipower - Power calculations for Gene-Gene interactions.• tdt_geipower - Power calculations for Gene-Environment interactions via TDT analysis.• tdt_ggipower - Power calculations for Gene-Gene interactions via TDT analysis.
Programs written by Neil Shephard• genass- Performs a number of statistical tests on your genotypic data and collates the results into a Stata
formatted data set for browsing.

User Written Genetics Commands
Programs written by Roger Newson• multproc – multiple comparison procedures and False Discovery Rates• Far too many others to list…….
Programs written by Chuck Huber• Accepted by the Stata Journal• phaseout – export genotype data to PHASE• phasein – import haplotype data from PHASE• haploviewout – export haplotype data in HaploView format for estimating and visualizing LD and other tasks• Forthcoming (when I have time to clean them up)• snpsumm – summarize allele/genotype frequencies and H-W equilibrium for large numbers of SNPs• manhattanplot – creates “Manhattan” plots from the results of a genome-wide association study (GWAS)

User Written Genetics Commands
Command: haplologit
Y. V. Marchenko, R. J. Carroll, D. Y. Lin, C. I. Amos, and R. G. Gutierrez (2008) Semiparametric analysis of case--control genetic data in the presence of environmental factors. The Stata Journal 8 (3): 305-333

User Written Genetics Commands
So Stata is well equipped for genetic data analysis!

Challenges
1. Longitudinal Data – PLINK or HelixTree?2. Specialized genetic data analysis3. Need to run a very large number of graphs and models4. Multiple comparisons and replication5. Scaling up to 100,000 SNP Chips

Looping Over Graphs and Models
)()( 3210 iitiitit SNPageSNPagePhenotypeE
(12 Phenotypes) x (1753 SNPs) x (5 Candidate Models Each)
Very simplistic structure of a model:
= 105,180 Models!

Looping Over Graphs and Models
• Looping Over Lists– Code:
* LOOPING THROUGH A SINGLE LIST OF WORDS
local SnpList "rs2239560 rs7524046 rs35610691"
foreach snp of local SnpList {
disp "Currently processing SNP `snp'"
}
– Output:Currently processing SNP rs2239560
Currently processing SNP rs7524046
Currently processing SNP rs35610691

Looping Over Graphs and Models– Code:
* LOOPING THROUGH TWO LISTS OF WORDSlocal SnpList "rs2239560 rs7524046 rs35610691"local PhenotypeList "bmi sbp tc"foreach Phenotype of local PhenotypeList {
foreach snp of local SnpList {disp "The outcome variable is `Phenotype' and the SNP
is `snp'."}
}
– Output:The outcome variable is bmi and the SNP is rs2239560.The outcome variable is bmi and the SNP is rs7524046.The outcome variable is bmi and the SNP is rs35610691.
The outcome variable is sbp and the SNP is rs2239560.The outcome variable is sbp and the SNP is rs7524046.The outcome variable is sbp and the SNP is rs35610691.
The outcome variable is tc and the SNP is rs2239560.The outcome variable is tc and the SNP is rs7524046.The outcome variable is tc and the SNP is rs35610691.

Looping Over Graphs and Models
• Lowess Curves for each Phenotype/SNP Combination:
LOOPING THROUGH TWO LISTS OF WORDS
local SnpList "rs2239560 rs7524046 rs35610691“
local PhenotypeList "bmi sbp tc“
foreach Phenotype of local PhenotypeList {
foreach snp of local SnpList {
twoway (lowess mean_`Phenotype' mean_age if `snp'=="AA", sort lcolor(red)) /*
*/ (lowess mean_`Phenotype' mean_age if `snp'=="AG", sort lcolor(green)) /*
*/ (lowess mean_`Phenotype' mean_age if `snp'=="GG", sort lcolor(blue)) /*
graph export Graph_`Phenotype'_`snp'.ps, as(ps) logo(off) replace
}
}
Note: Postscript files can be easily combined in Adobe Acrobat Professional

Looping Over Graphs and Models
• If we run many models, we need to be able to save the results to an output file.
• Commands for writing to data files– postfile: creates an output data file and describes
its structure– post: writes data to the output data file– postclose: closes the output data file

Looping Over Graphs and Models
• Longitudinal model for each Phenotype/SNP Combination:
postfile Output str16 phenotype str16 snp chi2 using OutputFile.dta, replace
local SnpList "rs2239560 rs7524046 rs35610691"
local PhenotypeList "bmi sbp tc"
foreach Phenotype of local PhenotypeList {
foreach snp of local SnpList {
xtmixed `Phenotype‘ age i.`snp‘ c.age#i.`snp‘ || Id: age, cov(unstruct)
post Output ("`Phenotype'") ("`snp'") (e(chi2))
}
}
postclose Output

Challenges
1. Longitudinal Data – PLINK or HelixTree?2. Specialized genetic data analysis3. Need to run a very large number of graphs and models4. Multiple comparisons and replication5. Scaling up to 100,000 SNP Chips

Multiple Comparisons
• In our study, we will be computing hundreds of thousands of p-values. How do we control for multiple comparisons?– False Discovery Rates– Replication in a second dataset

Multiple Comparisons
• False Discovery Rates are a collection of methods for adjusting for multiple comparisons commonly used in large scale genetics studies where the number of p-values regularly exceeds 500,000.
• Calculate a threshold p-value for determining overall statistical significance much like a Bonferroni correction.

False Discovery Rates
Reference: Benjamini, Y. & Hochberg Y. (1995) Controlling the false discovery rate: a practical and powerfulApproach to multiple testing. Journal of the Royal Statistical Society, Series B 57: 289-300
)0(0|RateDiscovery False
RPRR
VE
Copied from Benjamini & Hochberg (1995) page 291

Replication Data
• Bogalusa Heart Study– Similar longitudinal study– Included children in the 8-17 age range– 478 African-American participants– 1081 non-Hispanic White participants– Same phenotypes– Same genotypes (more or less)

Multiple Comparisons
Strategy1.Identify the SNPs in the Project Hearbeat!
sample that meet the overall threshold for statistical significance using False Discovery Rates.
2.Run the significant SNPs with the Bogalusa data to check for replication of the results.

Challenges
1. Longitudinal Data – PLINK or HelixTree?2. Specialized genetic data analysis3. Need to run a very large number of graphs and models4. Multiple comparisons and replication5. Scaling up to 100,000 SNP Chips

Scaling up to 100,000 SNPs
HELP!

Scaling up to 100,000 SNPs
• Possible Strategies:– Read data from text files in “chunks” using the
“infix” command.– Bribe Bill Gould with vast quantities of wine.– Other suggestions?

Actual Analysis
Disclaimer:
• Since this study is a work in progress, I have changed the gene and SNP names to protect the innocent.

Actual Analysis• Example Data. list id age bmi SNP1 SNP2 SNP3 if id==1, sepby(id)
+--------------------------------------------+
| id age bmi SNP1 SNP2 SNP3 |
|--------------------------------------------|
1. | 1 14.33812 26.07 AG GG GG |
2. | 1 14.6694 27.06 AG GG GG |
3. | 1 15.00616 28.33 AG GG GG |
4. | 1 15.40041 28.78 AG GG GG |
5. | 1 15.66324 29.76 AG GG GG |
6. | 1 15.97536 29.29 AG GG GG |
7. | 1 16.33128 28.28 AG GG GG |
8. | 1 16.65435 29.85 AG GG GG |
9. | 1 17.01848 28.52 AG GG GG |
10. | 1 17.30595 27.96 AG GG GG |
11. | 1 17.63997 28.28 AG GG GG |
+--------------------------------------------+

Actual Analysis
• Variable “Characteristics”
* EXAMPLE OF HOW TO ADD CHARACTERISTICS TO A VARIABLE AND EXTRACT THEM TO A LOCAL MACRO
char SNP1[chromosome] 7
char SNP1[gene] Gene1
char SNP1[position] 142702852
local TempChromosome : char SNP1[chromosome]
local TempGene : char SNP1[gene]
local TempPosition : char SNP1[position]
. disp "SNP1 is on Chromosome `TempChromosome', in `TempGene' at position `TempPosition'"
SNP1 is on Chromosome 7, in Gene1 at position 142702852

Actual Analysis
Lowess curve of BMI over age

Actual AnalysisData checking with the “snpsumm” command:. snpsumm SNP*, listgeno
Genotype Information
=================================================================
gen1, gen2 and gen3 are the genotypes
gencou~1, gencou~2, gencou~3 are the counts of each genotype
genfreq1, genfreq2 and genfreq3 are the genotype frequencies
=================================================================
+----------------------------------------------------------------------------------------------------------+
| Marker gen1 gencou~1 genfreq1 gen2 gencou~2 genfreq2 gen3 gencou~3 genfreq3 gentotal |
|----------------------------------------------------------------------------------------------------------|
1. | SNP1 AA 23 0.0375 AG 177 0.2887 GG 413 0.6737 613 |
2. | SNP2 AA 37 0.0605 AG 200 0.3268 GG 375 0.6127 612 |
3. | SNP3 AG 1 . GG 612 . . . . |
4. | SNP4 AA 35 0.0571 AG 201 0.3279 GG 377 0.6150 613 |
5. | SNP5 AA 203 0.3524 AG 259 0.4497 GG 114 0.1979 576 |
|----------------------------------------------------------------------------------------------------------|
6. | SNP6 AA 55 0.0899 AG 251 0.4101 GG 306 0.5000 612 |
7. | SNP7 AG 1 . GG 612 . . . . |
8. | SNP8 AA 8 0.0131 AG 124 0.2023 GG 481 0.7847 613 |
9. | SNP9 AA 41 0.0669 AG 204 0.3328 GG 368 0.6003 613 |
10. | SNP10 AA 51 0.0833 AC 247 0.4036 CC 314 0.5131 612 |
|----------------------------------------------------------------------------------------------------------|
11. | SNP11 AA 30 0.0489 AG 208 0.3393 GG 375 0.6117 613 |
+----------------------------------------------------------------------------------------------------------+

Actual AnalysisData checking with the “snpsumm” command:. snpsumm SNP*, listallele
Allele Information
=================================================================
a1 and a2 are the alleles
acount1 and acount2 are the counts of each allele
afreq1 and afreq2 are the counts of each allele
maf is the Minor Allele Frequency
=================================================================
+--------------------------------------------------------------------------+
| Marker a1 acount1 afreq1 a2 acount2 afreq2 atotal maf |
|--------------------------------------------------------------------------|
1. | SNP1 A 223 0.1819 G 1003 0.8181 1226 0.1819 |
2. | SNP2 A 274 0.2239 G 950 0.7761 1224 0.2239 |
3. | SNP3 G 614 . G . . . . |
4. | SNP4 A 271 0.2210 G 955 0.7790 1226 0.2210 |
5. | SNP5 A 665 0.5773 G 487 0.4227 1152 0.4227 |
|--------------------------------------------------------------------------|
6. | SNP6 A 361 0.2949 G 863 0.7051 1224 0.2949 |
7. | SNP7 G 614 . G . . . . |
8. | SNP8 A 140 0.1142 G 1086 0.8858 1226 0.1142 |
9. | SNP9 A 286 0.2333 G 940 0.7667 1226 0.2333 |
10. | SNP10 A 349 0.2851 C 875 0.7149 1224 0.2851 |
|--------------------------------------------------------------------------|
11. | SNP11 A 268 0.2186 G 958 0.7814 1226 0.2186 |
+--------------------------------------------------------------------------+

Actual AnalysisData checking with the “snpsumm” command:. snpsumm SNP*, listhw
Hardy-Weinberg Equilibrium Information
=================================================================
maf is the Minor Allele Frequency
hw_c2 is the Pearson Chi-squared
hw_c2p is the Pearson Chi-Squared p-value
hw_lr is the Likelihood Ratio Chi-squared
hw_lrp is the Likelihood Ratio Chi-Squared p-value
hw_ex is the Exact p-value
=================================================================
+------------------------------------------------------------+
| Marker maf hw_c2 hw_c2p hw_lr hw_lrp hw_ex |
|------------------------------------------------------------|
1. | SNP1 0.1819 0.54 0.4605 0.53 0.4662 0.4965 |
2. | SNP2 0.2239 2.17 0.1407 2.10 0.1470 0.1618 |
3. | SNP3 . . . . . . |
4. | SNP4 0.2210 1.40 0.2363 1.37 0.2425 0.2410 |
5. | SNP5 0.4227 3.57 0.0589 3.56 0.0591 0.0605 |
|------------------------------------------------------------|
6. | SNP6 0.2949 0.12 0.7316 0.12 0.7321 0.7705 |
7. | SNP7 . . . . . . |
8. | SNP8 0.1142 0.00 0.9979 0.00 0.9979 1.0000 |
9. | SNP9 0.2333 2.98 0.0844 2.88 0.0896 0.0901 |
10. | SNP10 0.2851 0.06 0.8050 0.06 0.8053 0.8427 |
|------------------------------------------------------------|
11. | SNP11 0.2186 0.03 0.8670 0.03 0.8673 0.9058 |
+------------------------------------------------------------+

Actual Analysis
• Reconstructing haplotypes using PHASE without leaving Stata!
local PositionList "142702852 142736196 142747932 etc.......”
phaseout SNP*, idvar(id) filename("Gene1.inp") position(`PositionList')
shell PHASE -S1234 Gene1.inp Gene1.out 100 1 100
clear
phasein Gene1.out, markers("MarkerList.txt") positions("PositionList.txt")

What is a Haplotype?
• A haplotype is the combination of one or more alleles found on the same chromosome
– Person 1 has a “gc” haplotype and a “ca” haplotype– Person 2 has a “cc” haplotype and a “ga” haplotype
ataagtcgatactgatgcatagctagctgactgacgcgat ataagtccatactgatgcatagctagctgactgaagcgat
ataagtccatactgatgcatagctagctgactgacgcgat
ataagtcgatactgatgcatagctagctgactgaagcgatSNP1 SNP2
Person 1 – Chromosome 1 Person 1 – Chromosome 2
Person 2 – Chromosome 1 Person 2 – Chromosome 2

Actual AnalysisThe resulting haplotypes are back in Stata:. list id haplotype SNP1 SNP2 SNP3 in 1/10, sepby(id)
+---------------------------------------+
| id haplotype SNP1 SNP2 SNP3 |
|---------------------------------------|
1. | 1 AGGGAAGGGCG A G G |
2. | 1 GGGGAGGGGAG G G G |
|---------------------------------------|
3. | 2 GGGGAGGGGCG G G G |
4. | 2 GGGGAGGGGCA G G G |
|---------------------------------------|
5. | 3 GGGGAGGGGAG G G G |
6. | 3 GGGAGAGGGCA G G G |
|---------------------------------------|
7. | 4 AGGGAGGGGAG A G G |
8. | 4 GGGAGGGAGCG G G G |
|---------------------------------------|
9. | 5 GGGGAGGGGAG G G G |
10. | 5 GAGGGGGGACG G A G |
+---------------------------------------+

Actual Analysis
haploviewout SNP*, idvariable(id) filename("Gene1") poslabel

Actual Analysis

Actual Analysis. multproc, pval(pvalue) meth(simes) rank(FDR_rank) critical(FDR_critical) reject(FDR_reject)
. list Chromosome Position pvalue FDR_rank FDR_critical FDR_reject in 1/22, sepby( FDR_reject)
+------------------------------------------------------------------+
| Chromo~e Position pvalue FDR_rank FDR_cri~l FDR_re~t |
|------------------------------------------------------------------|
1. | 3 1.60e+08 .0000372 1 .00003266 Yes |
2. | 8 4.59e+07 .0000465 2 .00006532 Yes |
3. | 12 9.73e+07 .0000529 3 .00009798 Yes |
4. | 7 7.08e+07 .0000661 4 .00013063 Yes |
5. | 3 2.02e+08 .0000701 5 .00016329 Yes |
6. | 11 3.02e+07 .0001106 6 .00019595 Yes |
7. | 2 2.15e+07 .0001391 7 .00022861 Yes |
8. | 5 9.80e+07 .0001418 8 .00026127 Yes |
9. | 4 9229619 .0002013 9 .00029393 Yes |
10. | 2 2.02e+08 .0002179 10 .00032658 Yes |
11. | 5 1.39e+08 .0002698 11 .00035924 Yes |
12. | 18 5.69e+07 .0003339 12 .0003919 Yes |
13. | 12 8.07e+07 .0003429 13 .00042456 Yes |
14. | 16 5.66e+07 .0004299 14 .00045722 Yes |
15. | 3 9249973 .0004815 15 .00048988 Yes |
16. | 9 1.43e+08 .0005735 16 .00052253 Yes |
17. | 19 4.66e+07 .0005778 17 .00055519 Yes |
18. | 8 2.29e+08 .0006019 18 .00058785 Yes |
19. | 13 4.65e+07 .0006124 19 .00062051 Yes |
|------------------------------------------------------------------|
20. | 1 4.39e+07 .0007301 20 .00065317 No |
21. | 5 1.52e+08 .000731 21 .00068583 No |
22. | 8 4.88e+07 .0007519 22 .00071848 No |
+------------------------------------------------------------------+
This continues for all 1753 SNPs
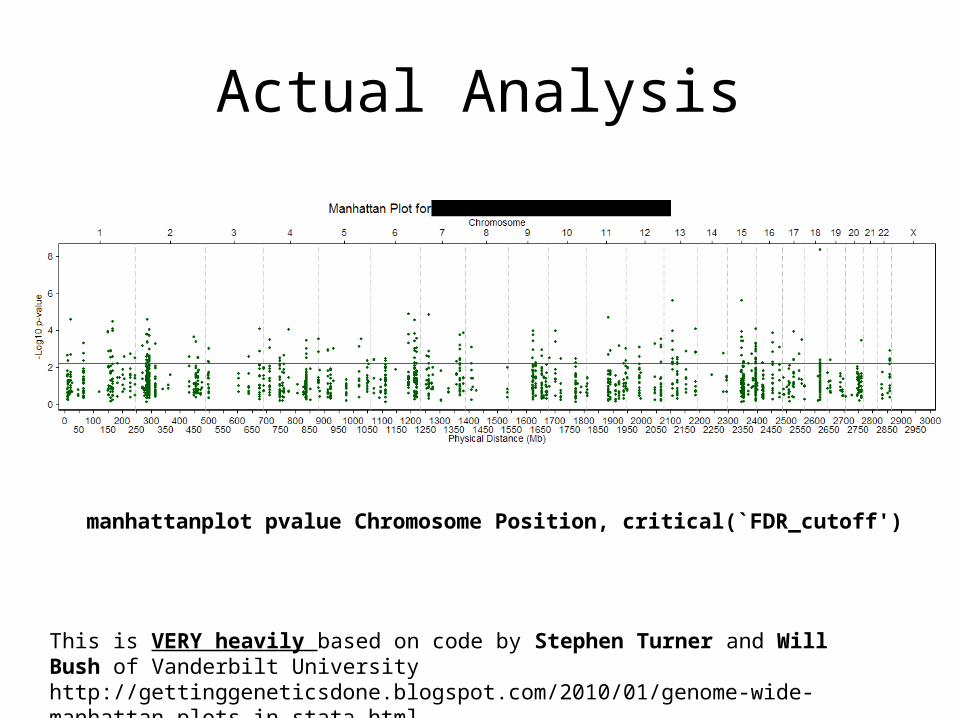
Actual Analysis
manhattanplot pvalue Chromosome Position, critical(`FDR_cutoff')
This is VERY heavily based on code by Stephen Turner and Will Bush of Vanderbilt Universityhttp://gettinggeneticsdone.blogspot.com/2010/01/genome-wide-manhattan-plots-in-stata.html

Summary
Stata is a very useful platform for doing longitudinal genome-wide association
studies!

Acknowledgements• Grant 1-R01DK073618-02 from the National Institute of Diabetes and
Digestive and Kidney Diseases• Michael Hallman, PhD
– Assistant Professor of Epidemiology, UTSPH-Houston• Ron Harrist, PhD
– Associate Professor of Biostatistics, UTSPH-Austin• Eric Boerwinkle, PhD
– Professor and Director of the Division of Epidemiology– Kozmetsky Family Chair in Human Genetics, UTSPH-Houston
• Darwin Labarthe, MD, PhD, MPH– Director of the Division for Heart Disease and Stroke Prevention, CDC-
Atlanta

References• Barrett, J., Fry, B., Maller, J., & Daly, M. (2005). Haploview: analysis and
visualization of LD and haplotype maps. Bioinformatics, 21, 263-265.• Hartl, D.L., Jones, E.W. (1998) Genetics: Principles and Analysis, 4th Ed.
Jones & Bartlett Publishers• Stephens, M., & Donnelly, P. (2003). A Comparison of Bayesian Methods
for Haplotype Reconstruction from Population Genotype Data. American Journal of Human Genetics, 73, 1162–1169.
• Stephens, M., Smith, N. J., & Donnelly, P. (2001). A New Statistical Method for Haplotype Reconstruction from Population Data. American Journal of Human Genetics, 68, 978–989.
• Watson, J.D., Baker, T.A., Bell, S.P., Gann, A., Levine, M., Losick, R. (2004) Molecular Biology of the Gene, 5th Ed. Benjamin Cummings


![[ME] Multilevel Mixed Effects - Survey Design · 2016. 2. 16. · Stata, , Stata Press, Mata, , and NetCourse are registered trademarks of StataCorp LP. Stata and Stata Press are](https://static.fdocuments.us/doc/165x107/6119d35ebac5e41ff76887ce/me-multilevel-mixed-effects-survey-design-2016-2-16-stata-stata-press.jpg)


![[ME] Multilevel Mixed Effects - Stata · PDF file[XT] Stata Longitudinal-Data/Panel-Data Reference Manual [ME] Stata Multilevel Mixed-Effects Reference Manual [MI] Stata Multiple-Imputation](https://static.fdocuments.us/doc/165x107/5a78a96c7f8b9a7b698e4b38/me-multilevel-mixed-effects-stata-xt-stata-longitudinal-datapanel-data-reference.jpg)