Hunting Creek Watershed Assessment – NPS Control Initiative … Quality/Planning... · Hunting...
39
Hunting Creek Watershed Assessment – NPS Control Initiative Quality Assurance Project Plan A Project of Carolina Land & Lakes Resource Conservation and Development Council Plan Prepared By Equinox Environmental Consultation and Design, Inc. Submitted to North Carolina Division of Water Quality January 2009
Transcript of Hunting Creek Watershed Assessment – NPS Control Initiative … Quality/Planning... · Hunting...
Hunting Creek Watershed Assessment – NPS Control Initiative
Quality Assurance Project Plan
A Project of Carolina Land & Lakes Resource Conservation and Development Council
Plan Prepared By
Equinox Environmental Consultation and Design, Inc.
Submitted to North Carolina Division of Water Quality January 2009

1
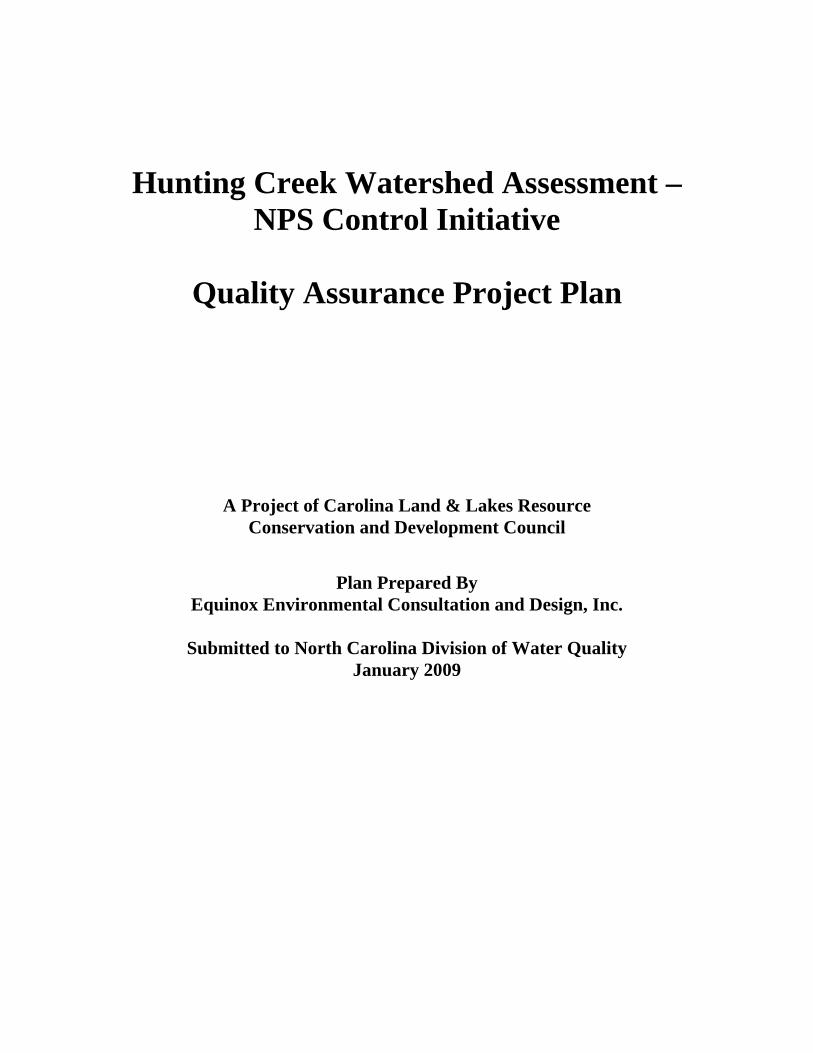
Quality Assurance Project Plan Required for certain US EPA funded grants and contracts that are awarded by the Division of Water Quality, NCDENR
NCDENR- DWQ QUALITY ASSURANCE PROJECT PLAN CHECKLIST
To first assess whether a Quality Assurance Project Plan is necessary, please answer the following four questions: 1. Is Federal money from the US EPA being spent on this activity? (If the answer is “No” then a
QAPP is not necessary; proceed to answer section A1 only. If “Yes” then proceed to # 2). 2. Will work require acquisition of environmental data generated from direct measurements
activities (i.e., water quality sampling), collected from other sources, or compiled from computerized databases? (If the answer is “No”, then a QAPP is not necessary; proceed to answer section A1 only. If “Yes” then proceed to # 3).
3. Will all instream water quality samples be analyzed by a Laboratory certified by the State of
North Carolina? Proceed to # 4.
4. Has a QAPP already been approved for your activity? (If the answer is “No” then please complete Sections A-D on the following pages. If “Yes”, then please answer section A1 and attach a copy of the approved QAPP, or provide a reference (including Agency, Telephone number, and Web Address, if available) for the complete approved QAPP, and return this form with attachments to your DWQ EPA Funds Manager).
5. Do you intend for your data to be considered for Use Support decisions, e.g., 303(d)
Yes
Yes
Yes
No
No
The following Quality Assurance Project Plan Form was adopted from the US EPA by the D
ivision of Water Quality, NCDENR.
Section A: Project Management A1. Project Title and Approval Sheet
Hunting Creek Watershed Assessment – NPS Control Initiative (Project Name) Carolina Land and Lakes RC&D (Responsible Agency) January 30, 2009 (Date) 1404 (NC DENR Contract #) Project Manager Signature
(Name/Date)
Project QA Officer Signature (Name/Date)
DWQ EPA Funds Manager
Signature of Receipt (Name/Date)
Quality Assurance Project Plan Details and Explanation All environmental projects that are funded, directly or indirectly, by the US Environmental Protection Agency (EPA) and which generate data from direct measurement activities, collect data from other sources or compile data from computerized data bases and information systems must have a Quality Assurance Project Plan (QAPP) approved prior to the collection of project data. QAPPs are required under Code of Federal Regulations 48CRF46, and 40CFR 30, 31 and 35. The QAPP documents the planning, implementation and assessment procedures of the project’s data needs. Specifically, it describes and documents the collection methods, and type and quality of data to be gathered. These criteria will vary from project to project depending on the scope of the work, expectations for the end result and perhaps overall cost of the project. Some project QAPPs must follow the national consensus standard, (ANSI/ASQC E4-1994, Specifications and Guidelines for Environmental Data Collection and Environmental Technology Programs) in order to be acceptable for their end use. Whereas other projects may use non-standardized or simplified data collection approaches because the end result, or use of the data, may not need to conform to existing data quality or may not be as critical for decision making .The overall purpose of the QAPP is to assure that appropriate methods of data collection are used and that documentation of the quality assurance approach is available for users of the data. EPA has established requirements for an acceptable QAPP. Details and explanations of these requirements can be found on EPA’s web site at http://www.epa.gov/quality1/qapps.html. Many of the required elements may already be found in your DWQ approved study proposals (e.g., Scope of Work). If so, please copy the appropriate information from your workplan to the attached DWQ/EPA QAPP form. The completed QAPP MUST be submitted to the DWQ BEFORE data collection activities begin.
2
3
A2. Table of Contents A3. Distribution List.....................................................................................................5 A4. Project/Task Organization .....................................................................................5 A5. Problem Definition/Background............................................................................8 Problem Statement .........................................................................................8 Intended Usage of Data..................................................................................10 A6. Project/Task Description .......................................................................................10 General Overview of Project .........................................................................11 Project Timetable ...........................................................................................13 A7. Quality Objectives and Criteria .............................................................................13 Data Precision, Accuracy, Measurement Range............................................13 Data Representativeness ................................................................................14 Data Comparability........................................................................................14 Data Completeness.........................................................................................14 A8. Special Training/Certification ...............................................................................15 Training Logistical Arrangements .................................................................15 Description of Training and Trainer Qualifications ......................................15 A9. Documents and Records ........................................................................................16 B1. Sampling Process Design.......................................................................................17 Rationale or Criteria for Selection of Sampling Sites....................................17 Project Monitoring Locations and Watershed Boundaries ..........................18 Sample Design Logistics ...............................................................................21 B2. Sampling Methods .................................................................................................21 Identify Sampling Equipment, Collection Methods and SOPs……………...21 Field Sampling Methods…………………………………………………….22 Sources and References used as Guidance for Typical Data Collection .......24 B3. Sampling Handling and Custody ...........................................................................25 B4. Analytical Methods................................................................................................26 B5. Quality Control .....................................................................................................27 Field QC Checks...........................................................................................27 Laboratory QC Checks .................................................................................28 Data Analysis QC Checks ............................................................................28 B6. Instrument/Equipment Testing, Inspection, and Maintenance ..............................29 B7. Instrument/Equipment Calibration and Frequency................................................29
4
2. Table of Contents (continued) B8. Inspection/Acceptance of Supplies and Consumables...........................................30 B9. Non-Direct Measurements.....................................................................................30 Non-Direct Measurements .............................................................................30 Data Recording Methods for Non-Direct Measurements ..............................30 B10. Data Management ................................................................................................31 Data Type and Data Management/Storage ....................................................31 Data Management and Analysis ....................................................................32 C1. Assessment and Response Actions ........................................................................33 C2. Reports to Management .........................................................................................33 D1. Data Review, Verification, and Validation ...........................................................35 Criteria for Accepting, Rejecting, or Qualifying Project Data .....................35 Decision Rule or “if/then” Statement ............................................................35 D2. Verification and Validation Methods ....................................................................35 D3. Reconciliation with User Requirements and DQOs..............................................36 References Cited……………………………………………………………… ……..37
Appendices Appendix I: UNC-Asheville Environmental Quality Institute Laboratory Procedures Appendix II: Equinox Environmental Fisheries Resource Inventory Standard Operating
Procedures Appendix III: Equinox Environmental Standard Operating Procedures for Measurement of
Water Quality Field Parameters Appendix IV: Equinox Environmental Standard Operating Procedures for Collection of Surface
Water Samples Appendix V: Equinox Environmental Standard Operating Procedures for NCDWQ Aquatic
Habitat Protocol for Mountain & Piedmont Streams
5
A3. Distribution List Names and telephone numbers of those receiving copies of this QAPP. Attach additional page, if necessary. (Name, Organization, Telephone)
i. Kim Nimmer, NCDWQ, 919-807-6438
ii. Dan McClure, Carolina Land & Lakes Resource Conservation and Development
Council, 828-464-5559 ext. 5
iii. Jack Huss, Carolina Land & Lakes Resource Conservation & Development Council
Board, 828-879-9567
iv. Lee Anderson, City of Morganton Development & Design, 828-438-5270
v. Mark Collins, Burke County Planning & Development, 828-439-4362
vi. Kevin Clark, Burke County Soil & Water Conservation, 828-439-9727
vii. Steve Melton, Equinox Environmental Consultation and Design, 828-253-6856
viii. Lindsay Majer, Equinox Environmental Consultation and Design, 828-253-6856
ix. Win Taylor, Equinox Environmental Consultation and Design, 828-253-6856
x. Jim Blose, Equinox Environmental Consultation and Design, 828-253-6856
xi. Sarah Marcinko, Equinox Environmental Consultation and Design, 828-253-6856
xii. Fred Grogan, Environmental Consultation and Design, 828-253-6856
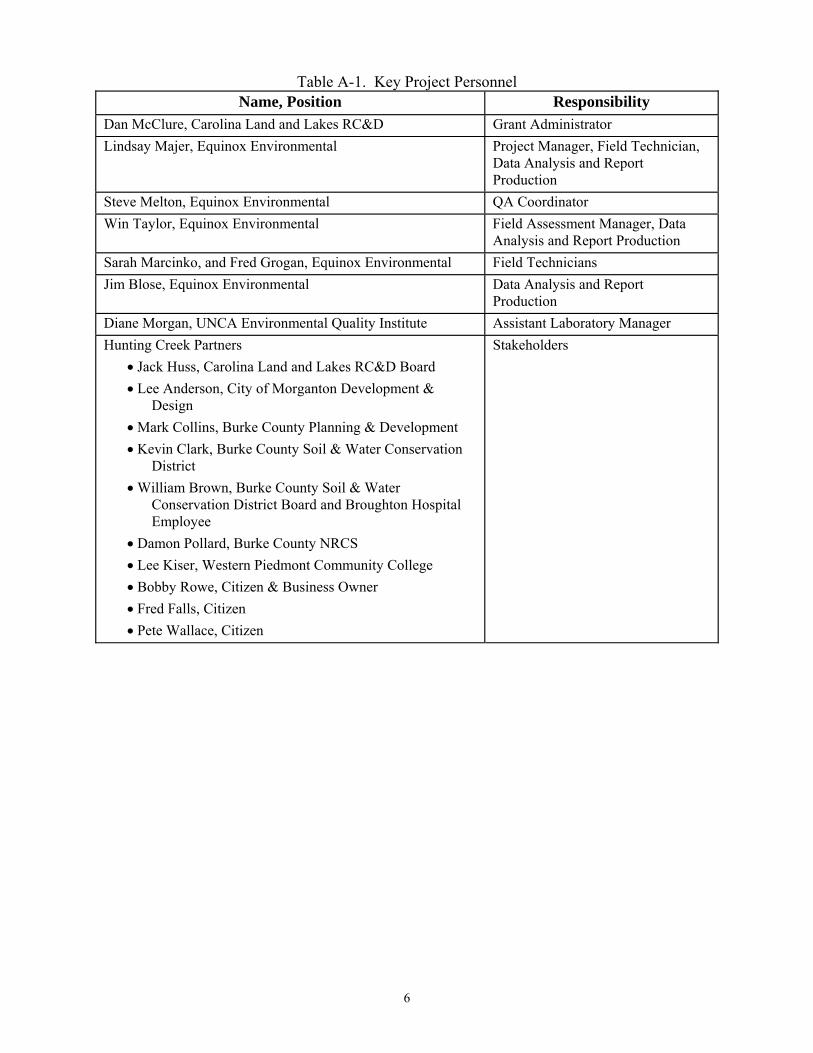
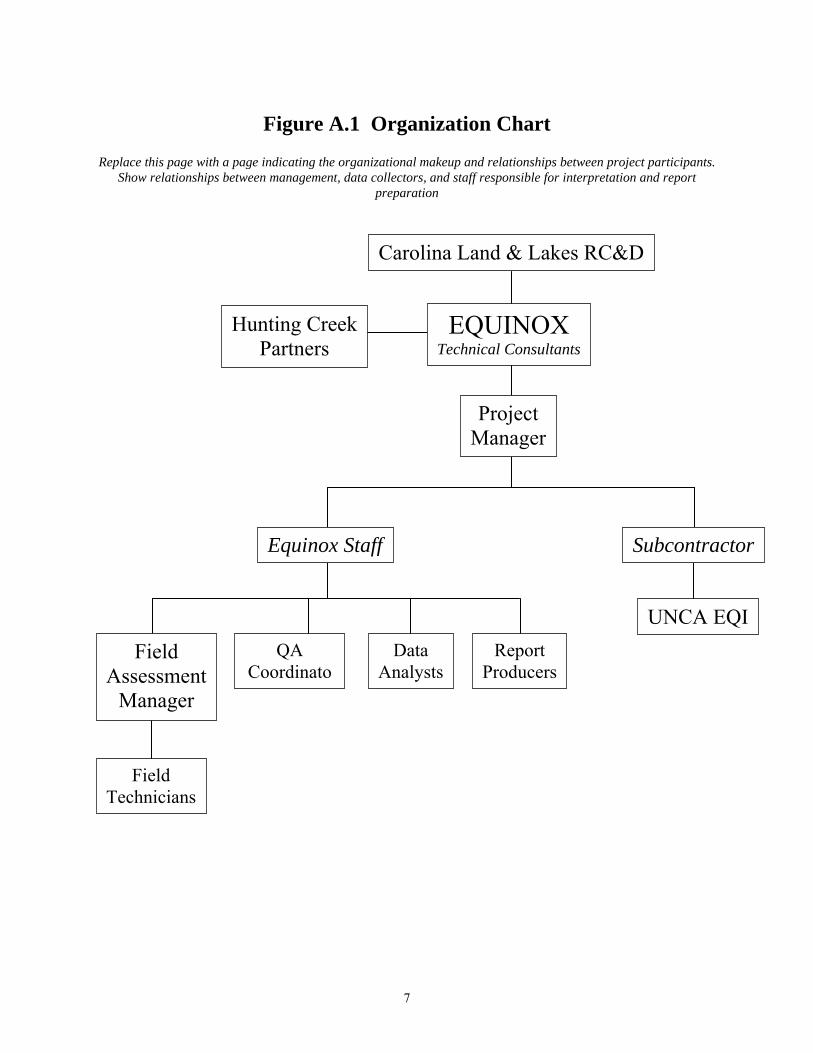
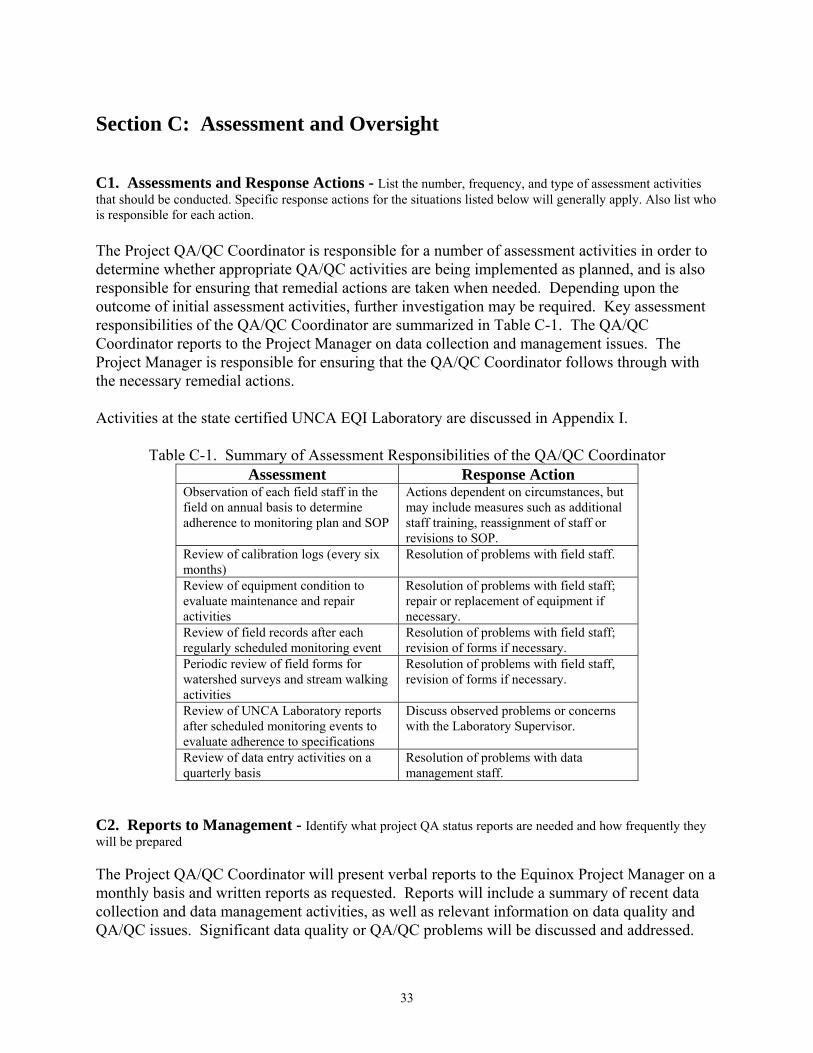
A4. Project/Task Organization The purpose of this document is to outline the quality assurance project plan (QAPP) for the project entitled Hunting Creek Watershed Assessment – NPS Control Initiative, conducted by Carolina Land and Lakes Resource Conservation and Development (RC&D) Council with funding from the US Environmental Protection Agency (USEPA) Section 319 grant program (Fiscal Year 2008). Field activities (physical, chemical and biological monitoring) will be conducted by Equinox Environmental Consultation and Design, Inc (Equinox). Laboratory analysis (nutrients and total suspended solids) will be conducted by the University of North Carolina – Asheville’s Environmental Quality Institute (EQI) Laboratory under the direction of Dr. Steve Patch. Ann Marie Traylor is the Laboratory Supervisor and the Assistant Laboratory Manager is Diane Morgan. Overall project activities will be under the management of Equinox, with Carolina Land and Lakes RC&D serving as grant administrator and ensuring project objectives are met according to timelines. Key project personnel and their corresponding responsibilities are listed in Table A-1 below. An organization chart is shown as Figure A-1.
6
Table A-1. Key Project Personnel
Name, Position Responsibility Dan McClure, Carolina Land and Lakes RC&D Grant Administrator Lindsay Majer, Equinox Environmental Project Manager, Field Technician,
Data Analysis and Report Production
Steve Melton, Equinox Environmental QA Coordinator Win Taylor, Equinox Environmental Field Assessment Manager, Data
Analysis and Report Production Sarah Marcinko, and Fred Grogan, Equinox Environmental Field Technicians Jim Blose, Equinox Environmental Data Analysis and Report
Production Diane Morgan, UNCA Environmental Quality Institute Assistant Laboratory Manager Hunting Creek Partners
• Jack Huss, Carolina Land and Lakes RC&D Board • Lee Anderson, City of Morganton Development &
Design • Mark Collins, Burke County Planning & Development • Kevin Clark, Burke County Soil & Water Conservation
District • William Brown, Burke County Soil & Water
Conservation District Board and Broughton Hospital Employee
• Damon Pollard, Burke County NRCS • Lee Kiser, Western Piedmont Community College • Bobby Rowe, Citizen & Business Owner • Fred Falls, Citizen • Pete Wallace, Citizen
Stakeholders
7
Figure A.1 Organization Chart
Replace this page with a page indicating the organizational makeup and relationships between project participants. Show relationships between management, data collectors, and staff responsible for interpretation and report
preparation
Carolina Land & Lakes RC&D
EQUINOX Hunting CreekPartners Technical Consultants
Project Manager
SubcontractorEquinox Staff
UNCA EQIQA
CoordinatoData
AnalystsReport
ProducersField
Assessment Manager
Field Technicians
A5. Problem Definition/Background
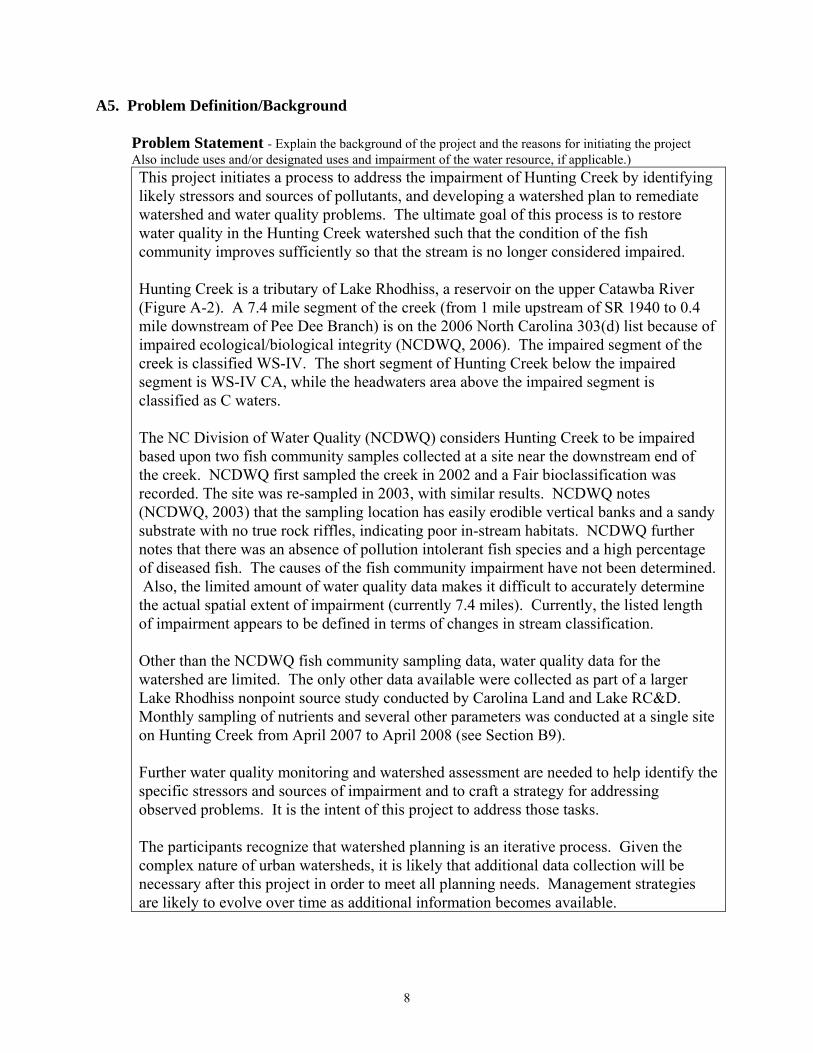
Problem Statement - Explain the background of the project and the reasons for initiating the project Also include uses and/or designated uses and impairment of the water resource, if applicable.) This project initiates a process to address the impairment of Hunting Creek by identifying likely stressors and sources of pollutants, and developing a watershed plan to remediate watershed and water quality problems. The ultimate goal of this process is to restore water quality in the Hunting Creek watershed such that the condition of the fish community improves sufficiently so that the stream is no longer considered impaired. Hunting Creek is a tributary of Lake Rhodhiss, a reservoir on the upper Catawba River (Figure A-2). A 7.4 mile segment of the creek (from 1 mile upstream of SR 1940 to 0.4 mile downstream of Pee Dee Branch) is on the 2006 North Carolina 303(d) list because of impaired ecological/biological integrity (NCDWQ, 2006). The impaired segment of the creek is classified WS-IV. The short segment of Hunting Creek below the impaired segment is WS-IV CA, while the headwaters area above the impaired segment is classified as C waters. The NC Division of Water Quality (NCDWQ) considers Hunting Creek to be impaired based upon two fish community samples collected at a site near the downstream end of the creek. NCDWQ first sampled the creek in 2002 and a Fair bioclassification was recorded. The site was re-sampled in 2003, with similar results. NCDWQ notes (NCDWQ, 2003) that the sampling location has easily erodible vertical banks and a sandy substrate with no true rock riffles, indicating poor in-stream habitats. NCDWQ further notes that there was an absence of pollution intolerant fish species and a high percentage of diseased fish. The causes of the fish community impairment have not been determined. Also, the limited amount of water quality data makes it difficult to accurately determine the actual spatial extent of impairment (currently 7.4 miles). Currently, the listed length of impairment appears to be defined in terms of changes in stream classification. Other than the NCDWQ fish community sampling data, water quality data for the watershed are limited. The only other data available were collected as part of a larger Lake Rhodhiss nonpoint source study conducted by Carolina Land and Lake RC&D. Monthly sampling of nutrients and several other parameters was conducted at a single site on Hunting Creek from April 2007 to April 2008 (see Section B9). Further water quality monitoring and watershed assessment are needed to help identify the specific stressors and sources of impairment and to craft a strategy for addressing observed problems. It is the intent of this project to address those tasks. The participants recognize that watershed planning is an iterative process. Given the complex nature of urban watersheds, it is likely that additional data collection will be necessary after this project in order to meet all planning needs. Management strategies are likely to evolve over time as additional information becomes available.
8

Location of the
Hunting Creek Watershed
���40
tu70
��18
tu64
tu70
��126
��181
BurkeCounty
McDowellCounty
CaldwellCounty
RutherfordCounty Cleveland
County
LincolnCounty
CatawbaCounty
AlexanderCounty
AveryCounty
Mitchell County
YanceyCounty
PolkCounty
GastonCounty
���40
0 2 4 6 81Miles
tu64
Morganton
Lenoir
L A K E R H O D H I S S
LAKEJAMES
Jo
hns Rive
r
C a t a w
b a R i v e r
Silver C
re e k
H
unting
Cr
eek
Henry Fork
Canoe Creek
Wa
rrior F ork
Low
er
Cre
ek
PisgahNationalForest
South MountainState Park
³Streams
Roads
Lakes
Hunting Creek Watershed
Municipalities
County Boundaries
Forest Land
CALDWELL COUNTY
BURKE COUNTY
BU
RK
E C
OU
NT
Y
McD
OW
EL
L C
OU
NT
Y
CA
TA
WB
A C
OU
NTY
B
UR
KE C
OU
NTY
Figure A-2
Intended Usage of Data - State the usage and outcomes expected from the information to be collected (e.g., remove from impaired list, show that the BMP is effective, watershed characterization or background data, environmental education, etc.). Describe type of data to be collected (e.g., screening, definitive, characterization, baseline/background). If applicable, cite technical or regulatory standards or criteria to which data will be compared.
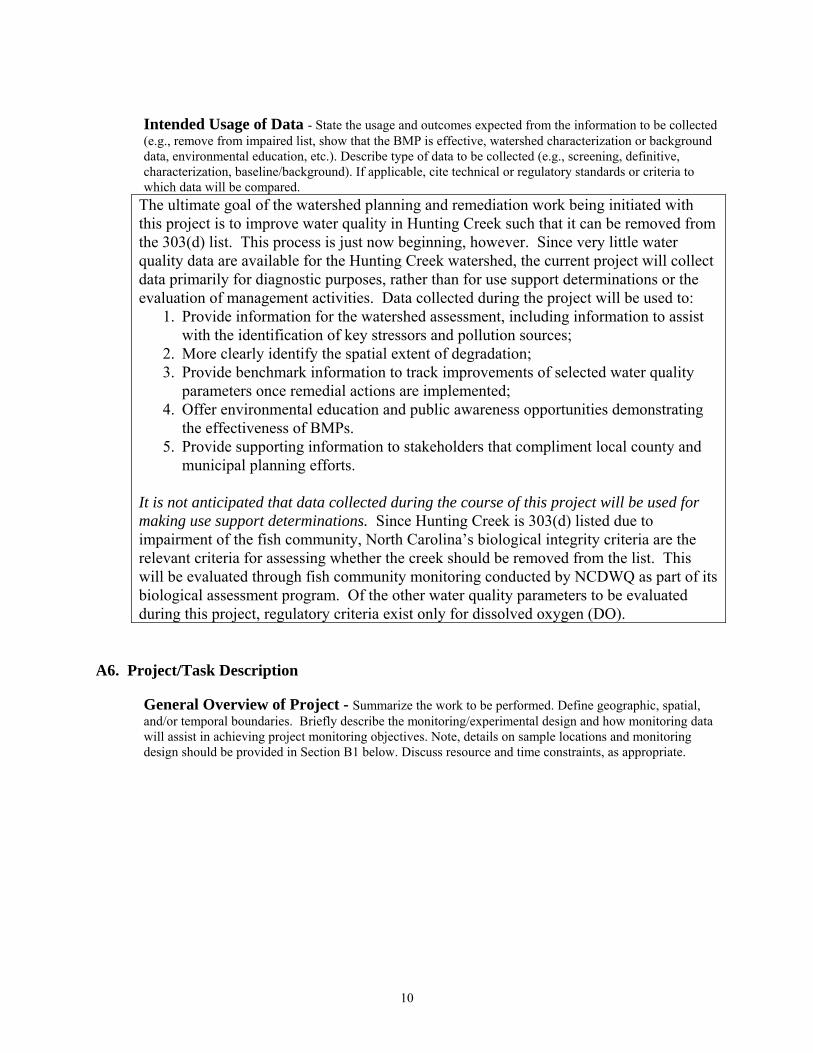
The ultimate goal of the watershed planning and remediation work being initiated with this project is to improve water quality in Hunting Creek such that it can be removed from the 303(d) list. This process is just now beginning, however. Since very little water quality data are available for the Hunting Creek watershed, the current project will collect data primarily for diagnostic purposes, rather than for use support determinations or the evaluation of management activities. Data collected during the project will be used to:
1. Provide information for the watershed assessment, including information to assist with the identification of key stressors and pollution sources;
2. More clearly identify the spatial extent of degradation; 3. Provide benchmark information to track improvements of selected water quality
parameters once remedial actions are implemented; 4. Offer environmental education and public awareness opportunities demonstrating
the effectiveness of BMPs. 5. Provide supporting information to stakeholders that compliment local county and
municipal planning efforts. It is not anticipated that data collected during the course of this project will be used for making use support determinations. Since Hunting Creek is 303(d) listed due to impairment of the fish community, North Carolina’s biological integrity criteria are the relevant criteria for assessing whether the creek should be removed from the list. This will be evaluated through fish community monitoring conducted by NCDWQ as part of its biological assessment program. Of the other water quality parameters to be evaluated during this project, regulatory criteria exist only for dissolved oxygen (DO).
A6. Project/Task Description
General Overview of Project - Summarize the work to be performed. Define geographic, spatial, and/or temporal boundaries. Briefly describe the monitoring/experimental design and how monitoring data will assist in achieving project monitoring objectives. Note, details on sample locations and monitoring design should be provided in Section B1 below. Discuss resource and time constraints, as appropriate.
10
11
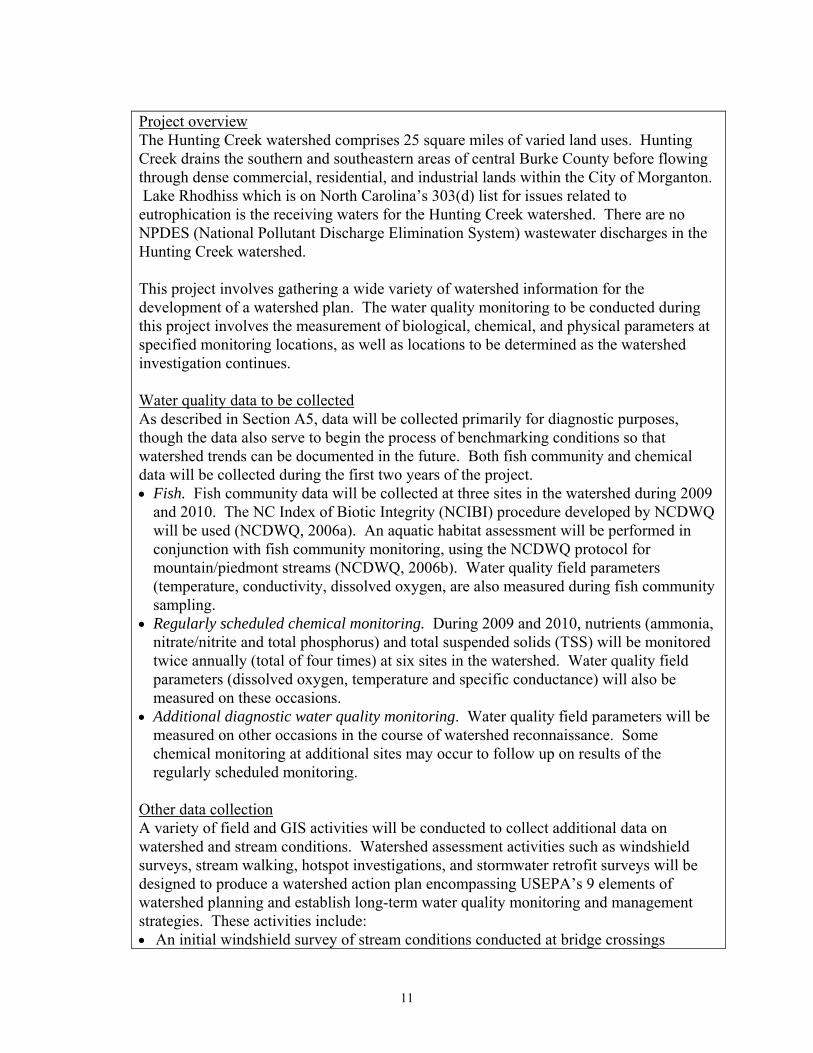
Project overview The Hunting Creek watershed comprises 25 square miles of varied land uses. Hunting Creek drains the southern and southeastern areas of central Burke County before flowing through dense commercial, residential, and industrial lands within the City of Morganton. Lake Rhodhiss which is on North Carolina’s 303(d) list for issues related to eutrophication is the receiving waters for the Hunting Creek watershed. There are no NPDES (National Pollutant Discharge Elimination System) wastewater discharges in the Hunting Creek watershed. This project involves gathering a wide variety of watershed information for the development of a watershed plan. The water quality monitoring to be conducted during this project involves the measurement of biological, chemical, and physical parameters at specified monitoring locations, as well as locations to be determined as the watershed investigation continues. Water quality data to be collected As described in Section A5, data will be collected primarily for diagnostic purposes, though the data also serve to begin the process of benchmarking conditions so that watershed trends can be documented in the future. Both fish community and chemical data will be collected during the first two years of the project. • Fish. Fish community data will be collected at three sites in the watershed during 2009
and 2010. The NC Index of Biotic Integrity (NCIBI) procedure developed by NCDWQ will be used (NCDWQ, 2006a). An aquatic habitat assessment will be performed in conjunction with fish community monitoring, using the NCDWQ protocol for mountain/piedmont streams (NCDWQ, 2006b). Water quality field parameters (temperature, conductivity, dissolved oxygen, are also measured during fish community sampling.
• Regularly scheduled chemical monitoring. During 2009 and 2010, nutrients (ammonia, nitrate/nitrite and total phosphorus) and total suspended solids (TSS) will be monitored twice annually (total of four times) at six sites in the watershed. Water quality field parameters (dissolved oxygen, temperature and specific conductance) will also be measured on these occasions.
• Additional diagnostic water quality monitoring. Water quality field parameters will be measured on other occasions in the course of watershed reconnaissance. Some chemical monitoring at additional sites may occur to follow up on results of the regularly scheduled monitoring.
Other data collection A variety of field and GIS activities will be conducted to collect additional data on watershed and stream conditions. Watershed assessment activities such as windshield surveys, stream walking, hotspot investigations, and stormwater retrofit surveys will be designed to produce a watershed action plan encompassing USEPA’s 9 elements of watershed planning and establish long-term water quality monitoring and management strategies. These activities include: • An initial windshield survey of stream conditions conducted at bridge crossings

throughout the watershed; • Walking the impaired stream segment, and selected tributary reaches as warranted, to
document stream and riparian conditions, stormwater outfalls, and potential pollution sources
• A survey of potential pollution hot spots, with a primary focus on the portions of the watershed draining the City of Morganton;
• A survey of potential stormwater retrofit and other BMP (best management practice) opportunities; and
• Creation of an updated land cover data set for the watershed based on interpretation of 2005 aerial photography.
The primary focus of the field activities will be the documentation of current conditions and the identification of stressors and sources of impairment. A grant from the NC Clean Water Management Trust Fund, which serves as part of the match for the USEPA grant, will be used for some of these activities, which will be conducted primarily in the first year of the grant. Stakeholder involvement and watershed plan development The project will also include: • Development and facilitation of a stakeholder group (Hunting Creek Partners)
representative of city and county governments, county and state agencies and other interested parties to provide key input to the development of the watershed plan;
• Identification of potential stormwater BMP site locations and other remediation projects for future proposals;
• Data synthesis to refine conclusions regarding the cause of impairment and regarding key pollution source areas; and
• Development of a watershed action plan following the NCDWQ guidance for a 9-Element Watershed Plan.
A schedule of key project activities is shown in Table A-2.
12
13
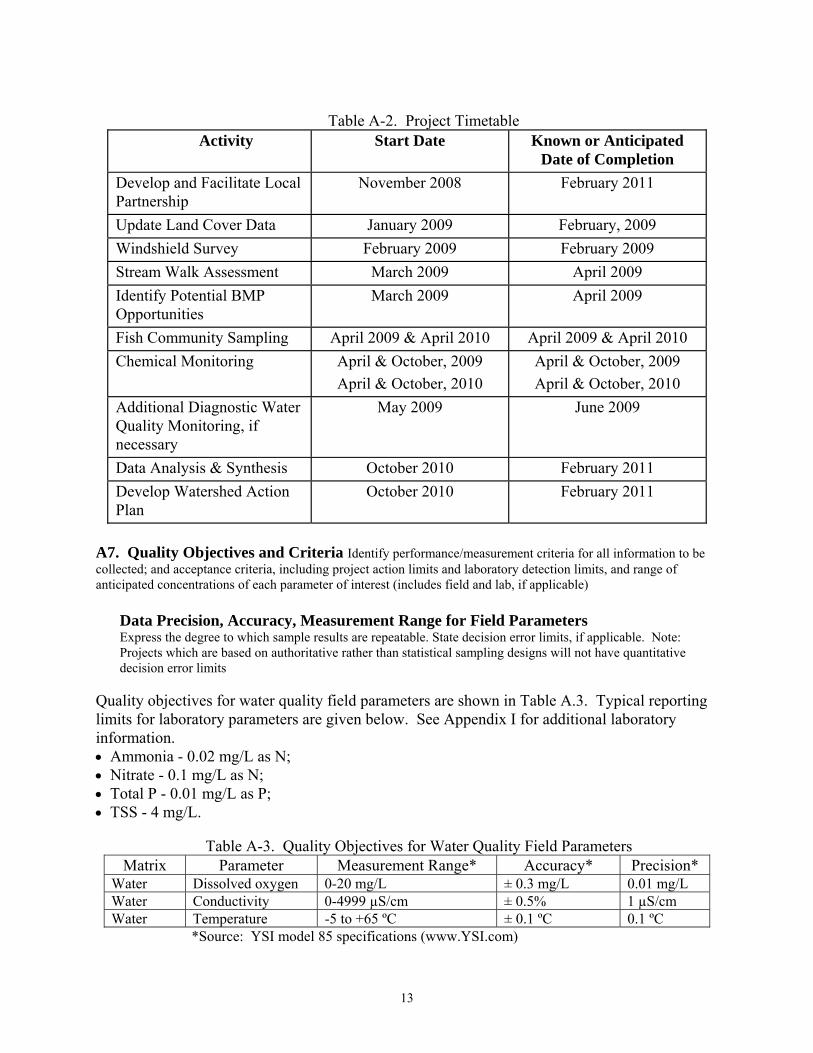
Table A-2. Project Timetable Activity Start Date Known or Anticipated
Date of Completion Develop and Facilitate Local Partnership
November 2008 February 2011
Update Land Cover Data January 2009 February, 2009 Windshield Survey February 2009 February 2009 Stream Walk Assessment March 2009 April 2009 Identify Potential BMP Opportunities
March 2009 April 2009
Fish Community Sampling April 2009 & April 2010 April 2009 & April 2010 Chemical Monitoring April & October, 2009
April & October, 2010 April & October, 2009 April & October, 2010
Additional Diagnostic Water Quality Monitoring, if necessary
May 2009 June 2009
Data Analysis & Synthesis October 2010 February 2011 Develop Watershed Action Plan
October 2010 February 2011
A7. Quality Objectives and Criteria Identify performance/measurement criteria for all information to be collected; and acceptance criteria, including project action limits and laboratory detection limits, and range of anticipated concentrations of each parameter of interest (includes field and lab, if applicable)
Data Precision, Accuracy, Measurement Range for Field Parameters Express the degree to which sample results are repeatable. State decision error limits, if applicable. Note: Projects which are based on authoritative rather than statistical sampling designs will not have quantitative decision error limits
Quality objectives for water quality field parameters are shown in Table A.3. Typical reporting limits for laboratory parameters are given below. See Appendix I for additional laboratory information. • Ammonia - 0.02 mg/L as N; • Nitrate - 0.1 mg/L as N; • Total P - 0.01 mg/L as P; • TSS - 4 mg/L.
Table A-3. Quality Objectives for Water Quality Field Parameters
Matrix Parameter Measurement Range* Accuracy* Precision* Water Dissolved oxygen 0-20 mg/L ± 0.3 mg/L 0.01 mg/L Water Conductivity 0-4999 µS/cm ± 0.5% 1 µS/cm Water Temperature -5 to +65 ºC ± 0.1 ºC 0.1 ºC
*Source: YSI model 85 specifications (www.YSI.com)
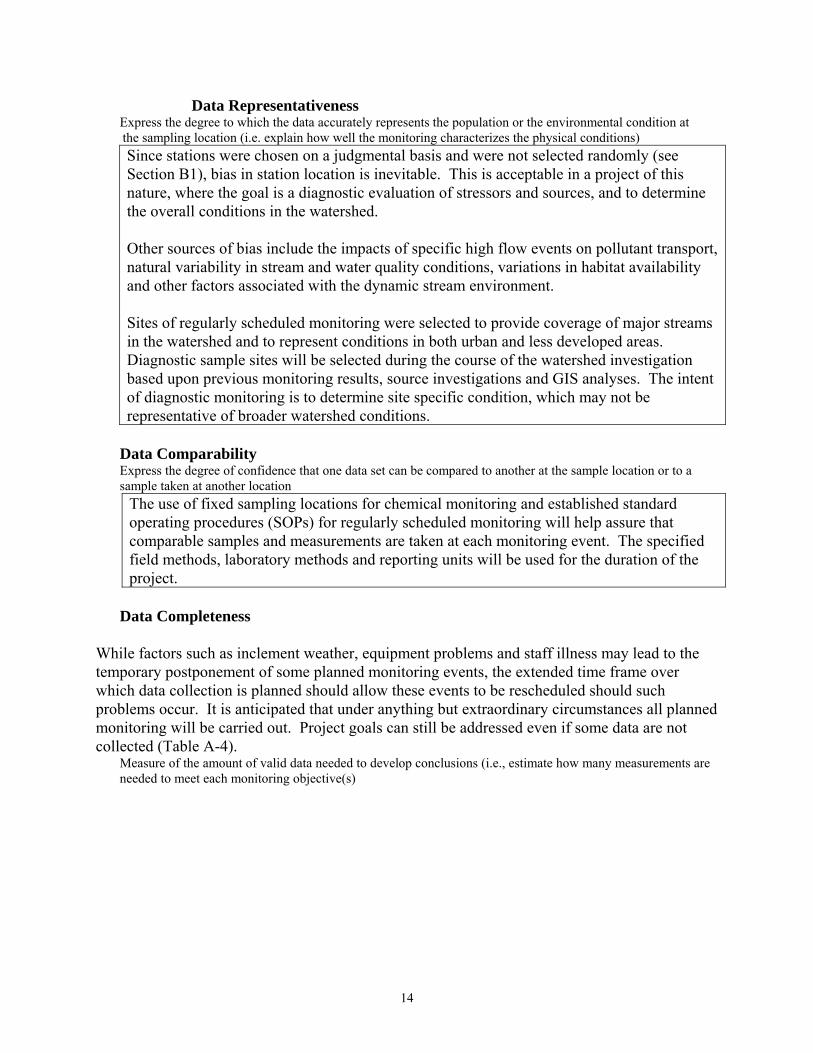
Data Representativeness Express the degree to which the data accurately represents the population or the environmental condition at the sampling location (i.e. explain how well the monitoring characterizes the physical conditions)
Since stations were chosen on a judgmental basis and were not selected randomly (see Section B1), bias in station location is inevitable. This is acceptable in a project of this nature, where the goal is a diagnostic evaluation of stressors and sources, and to determine the overall conditions in the watershed. Other sources of bias include the impacts of specific high flow events on pollutant transport, natural variability in stream and water quality conditions, variations in habitat availability and other factors associated with the dynamic stream environment. Sites of regularly scheduled monitoring were selected to provide coverage of major streams in the watershed and to represent conditions in both urban and less developed areas. Diagnostic sample sites will be selected during the course of the watershed investigation based upon previous monitoring results, source investigations and GIS analyses. The intent of diagnostic monitoring is to determine site specific condition, which may not be representative of broader watershed conditions.
Data Comparability
Express the degree of confidence that one data set can be compared to another at the sample location or to a sample taken at another location
The use of fixed sampling locations for chemical monitoring and established standard operating procedures (SOPs) for regularly scheduled monitoring will help assure that comparable samples and measurements are taken at each monitoring event. The specified field methods, laboratory methods and reporting units will be used for the duration of the project.
Data Completeness While factors such as inclement weather, equipment problems and staff illness may lead to the temporary postponement of some planned monitoring events, the extended time frame over which data collection is planned should allow these events to be rescheduled should such problems occur. It is anticipated that under anything but extraordinary circumstances all planned monitoring will be carried out. Project goals can still be addressed even if some data are not collected (Table A-4).
Measure of the amount of valid data needed to develop conclusions (i.e., estimate how many measurements are needed to meet each monitoring objective(s)
14
15
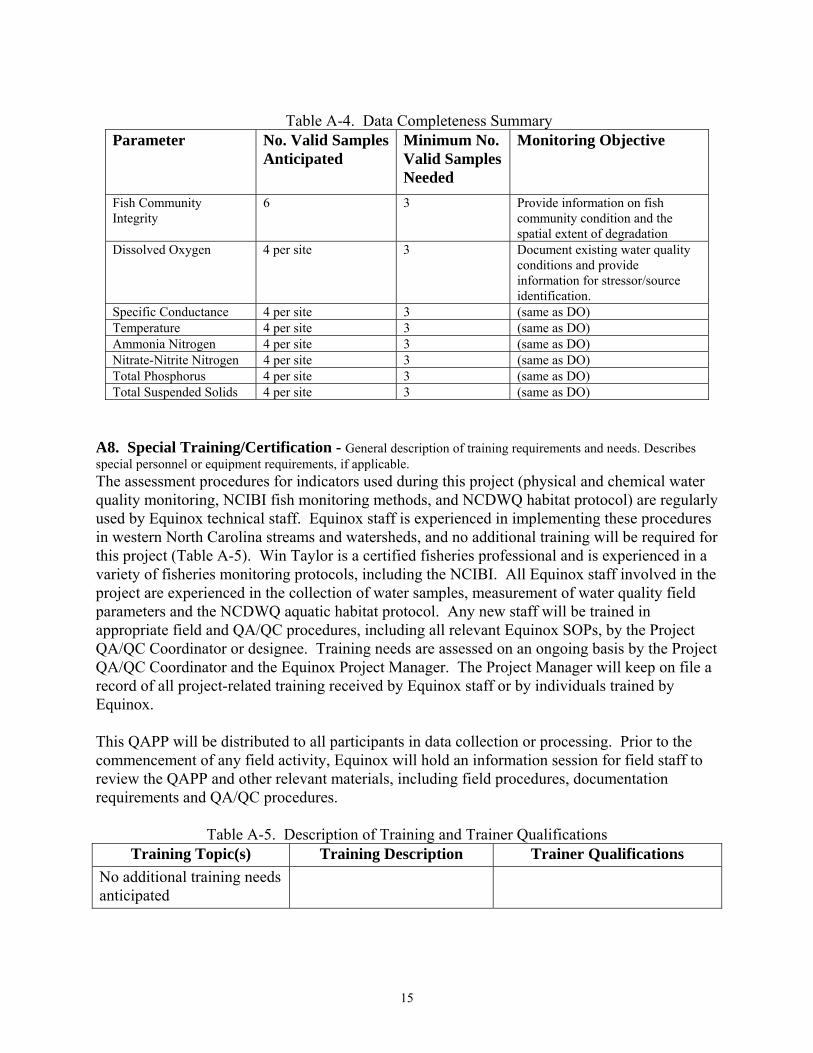
Table A-4. Data Completeness Summary Parameter No. Valid Samples
Anticipated Minimum No. Valid Samples Needed
Monitoring Objective
Fish Community Integrity
6 3 Provide information on fish community condition and the spatial extent of degradation
Dissolved Oxygen 4 per site 3 Document existing water quality conditions and provide information for stressor/source identification.
Specific Conductance 4 per site 3 (same as DO) Temperature 4 per site 3 (same as DO) Ammonia Nitrogen 4 per site 3 (same as DO) Nitrate-Nitrite Nitrogen 4 per site 3 (same as DO) Total Phosphorus 4 per site 3 (same as DO) Total Suspended Solids 4 per site 3 (same as DO)
A8. Special Training/Certification - General description of training requirements and needs. Describes special personnel or equipment requirements, if applicable. The assessment procedures for indicators used during this project (physical and chemical water quality monitoring, NCIBI fish monitoring methods, and NCDWQ habitat protocol) are regularly used by Equinox technical staff. Equinox staff is experienced in implementing these procedures in western North Carolina streams and watersheds, and no additional training will be required for this project (Table A-5). Win Taylor is a certified fisheries professional and is experienced in a variety of fisheries monitoring protocols, including the NCIBI. All Equinox staff involved in the project are experienced in the collection of water samples, measurement of water quality field parameters and the NCDWQ aquatic habitat protocol. Any new staff will be trained in appropriate field and QA/QC procedures, including all relevant Equinox SOPs, by the Project QA/QC Coordinator or designee. Training needs are assessed on an ongoing basis by the Project QA/QC Coordinator and the Equinox Project Manager. The Project Manager will keep on file a record of all project-related training received by Equinox staff or by individuals trained by Equinox. This QAPP will be distributed to all participants in data collection or processing. Prior to the commencement of any field activity, Equinox will hold an information session for field staff to review the QAPP and other relevant materials, including field procedures, documentation requirements and QA/QC procedures.
Table A-5. Description of Training and Trainer Qualifications Training Topic(s) Training Description Trainer Qualifications
No additional training needs anticipated
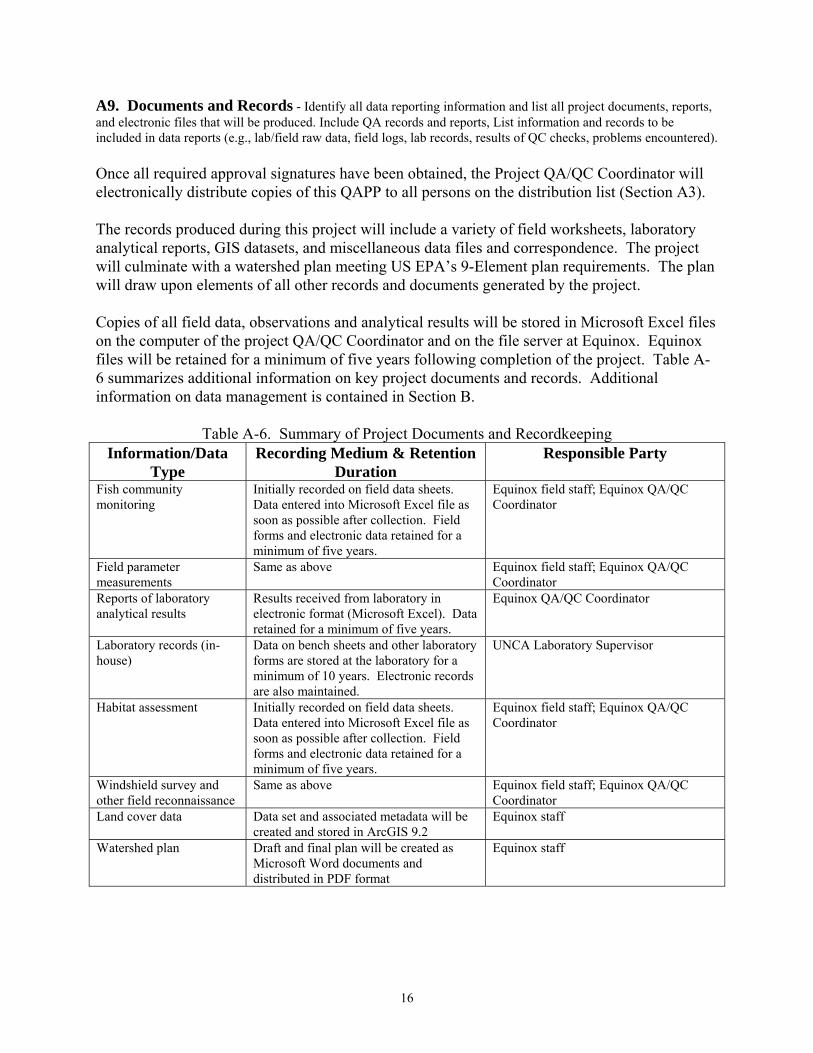
A9. Documents and Records - Identify all data reporting information and list all project documents, reports, and electronic files that will be produced. Include QA records and reports, List information and records to be included in data reports (e.g., lab/field raw data, field logs, lab records, results of QC checks, problems encountered). Once all required approval signatures have been obtained, the Project QA/QC Coordinator will electronically distribute copies of this QAPP to all persons on the distribution list (Section A3). The records produced during this project will include a variety of field worksheets, laboratory analytical reports, GIS datasets, and miscellaneous data files and correspondence. The project will culminate with a watershed plan meeting US EPA’s 9-Element plan requirements. The plan will draw upon elements of all other records and documents generated by the project. Copies of all field data, observations and analytical results will be stored in Microsoft Excel files on the computer of the project QA/QC Coordinator and on the file server at Equinox. Equinox files will be retained for a minimum of five years following completion of the project. Table A-6 summarizes additional information on key project documents and records. Additional information on data management is contained in Section B.
Table A-6. Summary of Project Documents and Recordkeeping Information/Data
Type Recording Medium & Retention
Duration Responsible Party
Fish community monitoring
Initially recorded on field data sheets. Data entered into Microsoft Excel file as soon as possible after collection. Field forms and electronic data retained for a minimum of five years.
Equinox field staff; Equinox QA/QC Coordinator
Field parameter measurements
Same as above Equinox field staff; Equinox QA/QC Coordinator
Reports of laboratory analytical results
Results received from laboratory in electronic format (Microsoft Excel). Data retained for a minimum of five years.
Equinox QA/QC Coordinator
Laboratory records (in-house)
Data on bench sheets and other laboratory forms are stored at the laboratory for a minimum of 10 years. Electronic records are also maintained.
UNCA Laboratory Supervisor
Habitat assessment Initially recorded on field data sheets. Data entered into Microsoft Excel file as soon as possible after collection. Field forms and electronic data retained for a minimum of five years.
Equinox field staff; Equinox QA/QC Coordinator
Windshield survey and other field reconnaissance
Same as above Equinox field staff; Equinox QA/QC Coordinator
Land cover data Data set and associated metadata will be created and stored in ArcGIS 9.2
Equinox staff
Watershed plan Draft and final plan will be created as Microsoft Word documents and distributed in PDF format
Equinox staff
16

17
Section B: Data Generation and Acquisition B1. Monitoring Experimental Design - Describe and justify the experimental monitoring design strategy, indicating size of the area, volume, or time period to be represented by the monitoring (detail the type and total number of sample types/matrix or test runs/trials expected and needed). Also include monitoring of covariates such as rainfall and discharge.
Rationale or Criteria for Selection of Sampling Sites- Describe and justify the experimental monitoring design strategy, indicating size of the watershed area, discharge volume, or time period to be represented by the monitoring. Describe appropriate validation study information for nonstandard sampling situations (if applicable).
The monitoring to be conducted during this project is not part of a formal water quality evaluation, but is intended to provide initial information on a watershed for which extremely limited water quality data are currently available. As discussed in Sections A5 and A6, data will be collected primarily for diagnostic purposes, though some data will also serve benchmarking (beginning development of data set for eventual documentation of trends in water quality). Planned fish community monitoring Fish community monitoring will be conducted at three sites during 2009 and 2010, using a certified fisheries biologist and NCIBI methods and monitoring protocol. The primary purpose of this monitoring is to determine whether fish impairment documented at a downstream site extends upstream or into major tributaries. The rationale for the specific sites selected is addressed below under Project Monitoring Locations. Regularly scheduled chemical monitoring Monitoring of nutrients and total suspended solids will be performed during 2009 and 2010. Sampling will occur twice per year (a total of four sampling events) at 6 sites in the Hunting Creek watershed. Samples will be collected during baseflow conditions. One additional sample may be collected at each site during a storm event if resources allow. In additional to providing information for assessing existing conditions, these data will be used to establish a baseline with which subsequent monitoring can be compared to detect improvements in watershed conditions over time, as BMPs and restorative actions are implemented. The rationale for the specific sites selected is addressed below under Project Monitoring Locations. Additional diagnostic water quality monitoring Additional monitoring of field parameters will be conducted at bridge crossings during watershed reconnaissance. These will be selected to represent all tributaries that are accessible by public roadway and to capture changes in land use. Additional nutrient and TSS analyses may be conducted at selected sites as part of the pollution source investigations. The location and sampling will depend on results of the regularly scheduled monitoring, land use analysis and other information collected during the assessment. Other data collection
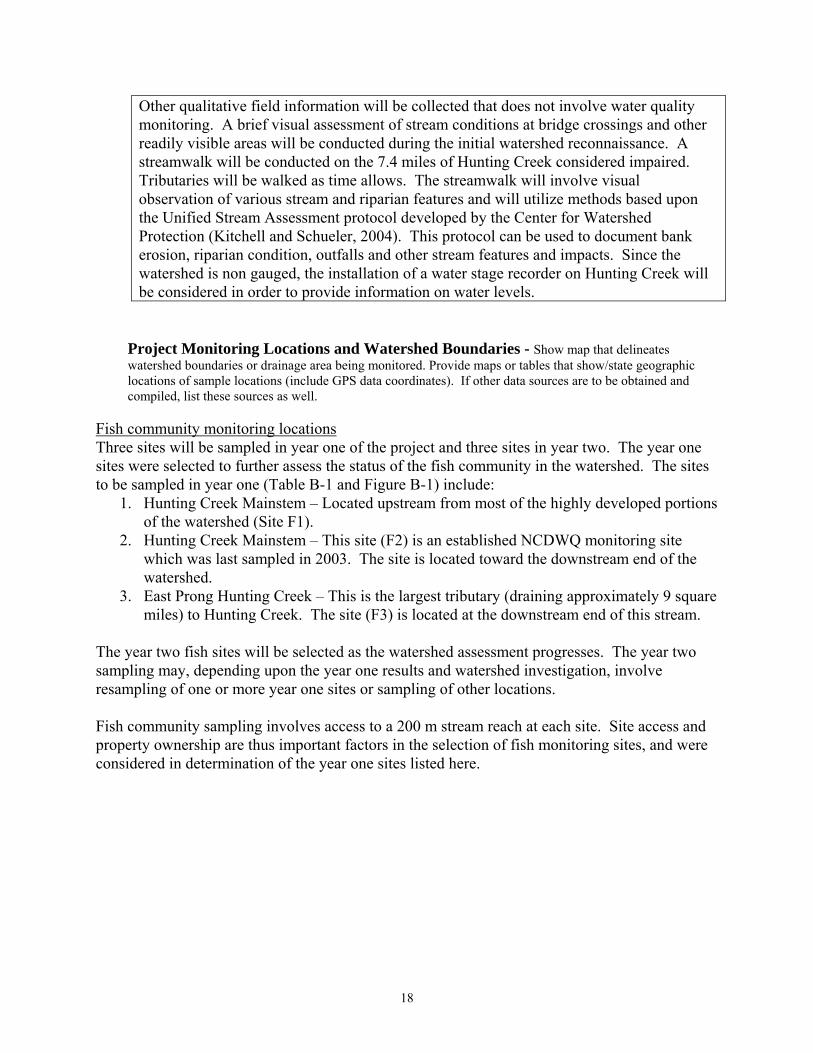
Other qualitative field information will be collected that does not involve water quality monitoring. A brief visual assessment of stream conditions at bridge crossings and other readily visible areas will be conducted during the initial watershed reconnaissance. A streamwalk will be conducted on the 7.4 miles of Hunting Creek considered impaired. Tributaries will be walked as time allows. The streamwalk will involve visual observation of various stream and riparian features and will utilize methods based upon the Unified Stream Assessment protocol developed by the Center for Watershed Protection (Kitchell and Schueler, 2004). This protocol can be used to document bank erosion, riparian condition, outfalls and other stream features and impacts. Since the watershed is non gauged, the installation of a water stage recorder on Hunting Creek will be considered in order to provide information on water levels.
Project Monitoring Locations and Watershed Boundaries - Show map that delineates watershed boundaries or drainage area being monitored. Provide maps or tables that show/state geographic locations of sample locations (include GPS data coordinates). If other data sources are to be obtained and compiled, list these sources as well.
Fish community monitoring locations Three sites will be sampled in year one of the project and three sites in year two. The year one sites were selected to further assess the status of the fish community in the watershed. The sites to be sampled in year one (Table B-1 and Figure B-1) include:
1. Hunting Creek Mainstem – Located upstream from most of the highly developed portions of the watershed (Site F1).
2. Hunting Creek Mainstem – This site (F2) is an established NCDWQ monitoring site which was last sampled in 2003. The site is located toward the downstream end of the watershed.
3. East Prong Hunting Creek – This is the largest tributary (draining approximately 9 square miles) to Hunting Creek. The site (F3) is located at the downstream end of this stream.
The year two fish sites will be selected as the watershed assessment progresses. The year two sampling may, depending upon the year one results and watershed investigation, involve resampling of one or more year one sites or sampling of other locations. Fish community sampling involves access to a 200 m stream reach at each site. Site access and property ownership are thus important factors in the selection of fish monitoring sites, and were considered in determination of the year one sites listed here.
18
19
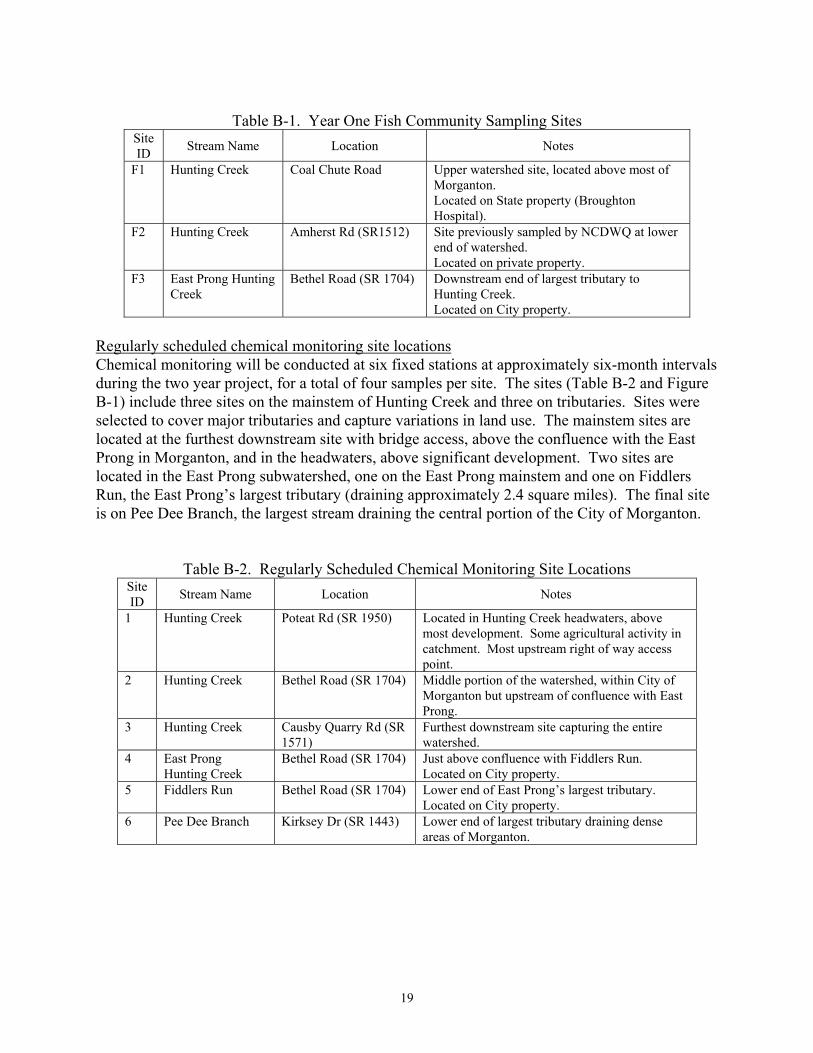
Table B-1. Year One Fish Community Sampling Sites Site ID Stream Name Location Notes
F1 Hunting Creek Coal Chute Road Upper watershed site, located above most of Morganton. Located on State property (Broughton Hospital).
F2 Hunting Creek Amherst Rd (SR1512) Site previously sampled by NCDWQ at lower end of watershed. Located on private property.
F3 East Prong Hunting Creek
Bethel Road (SR 1704) Downstream end of largest tributary to Hunting Creek. Located on City property.
Regularly scheduled chemical monitoring site locationsChemical monitoring will be conducted at six fixed stations at approximately six-month intervals during the two year project, for a total of four samples per site. The sites (Table B-2 and Figure B-1) include three sites on the mainstem of Hunting Creek and three on tributaries. Sites were selected to cover major tributaries and capture variations in land use. The mainstem sites are located at the furthest downstream site with bridge access, above the confluence with the East Prong in Morganton, and in the headwaters, above significant development. Two sites are located in the East Prong subwatershed, one on the East Prong mainstem and one on Fiddlers Run, the East Prong’s largest tributary (draining approximately 2.4 square miles). The final site is on Pee Dee Branch, the largest stream draining the central portion of the City of Morganton.
Table B-2. Regularly Scheduled Chemical Monitoring Site Locations Site ID Stream Name Location Notes
1 Hunting Creek Poteat Rd (SR 1950) Located in Hunting Creek headwaters, above most development. Some agricultural activity in catchment. Most upstream right of way access point.
2 Hunting Creek Bethel Road (SR 1704) Middle portion of the watershed, within City of Morganton but upstream of confluence with East Prong.
3 Hunting Creek Causby Quarry Rd (SR 1571)
Furthest downstream site capturing the entire watershed.
4 East Prong Hunting Creek
Bethel Road (SR 1704) Just above confluence with Fiddlers Run. Located on City property.
5 Fiddlers Run Bethel Road (SR 1704) Lower end of East Prong’s largest tributary. Located on City property.
6 Pee Dee Branch Kirksey Dr (SR 1443) Lower end of largest tributary draining dense areas of Morganton.
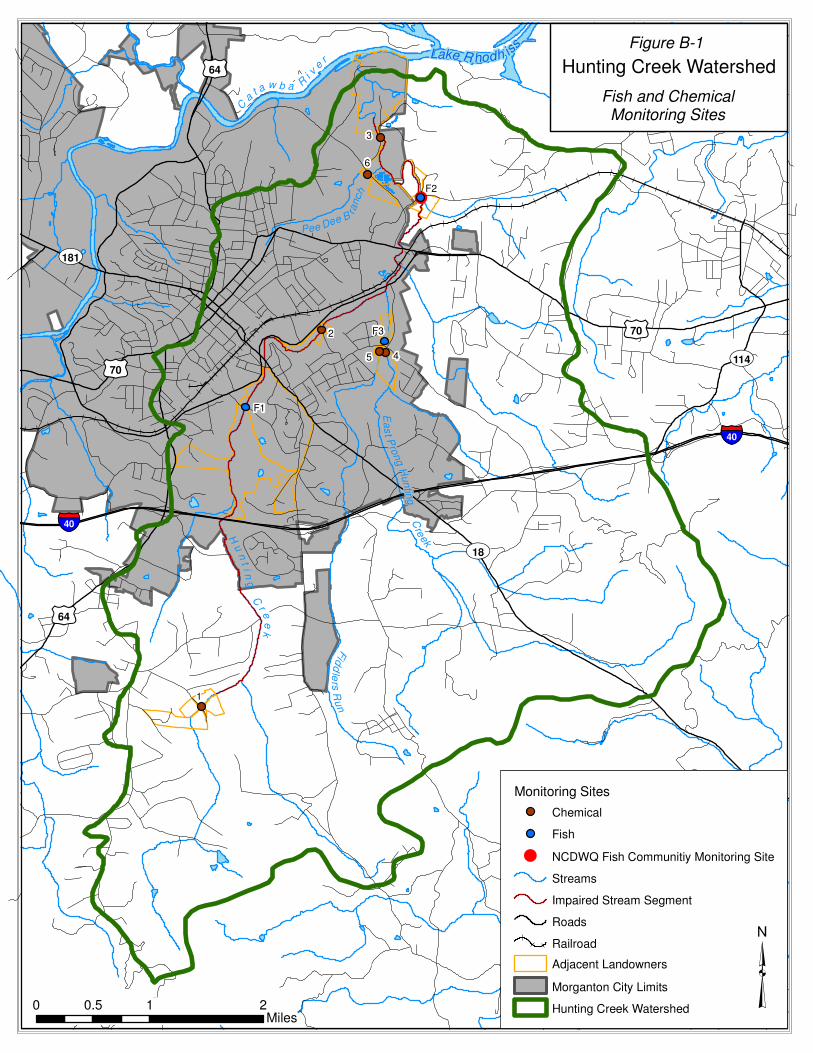
!
F1
3
6
1
5 4
F32
F2
Hunting Creek Watershed
���40
tu70
��18
tu64
tu70��114
��181
tu64
Monitoring Sites
Chemical
Fish
! NCDWQ Fish Communitiy Monitoring Site
Streams
Impaired Stream Segment
Roads
Railroad
Adjacent Landowners
Morganton City Limits
Hunting Creek Watershed0 1 20.5Miles
���40
Lake R hodh iss
C a
t a w b a R
i
v e
r
Pee Dee B
ranch
H u
n t i n
g
Ea
st P
rong H
untin
g
Fid
dle
rs R
un
Fish and ChemicalMonitoring Sites
³
Cre
ek
C r e
e k
Figure B-1
21
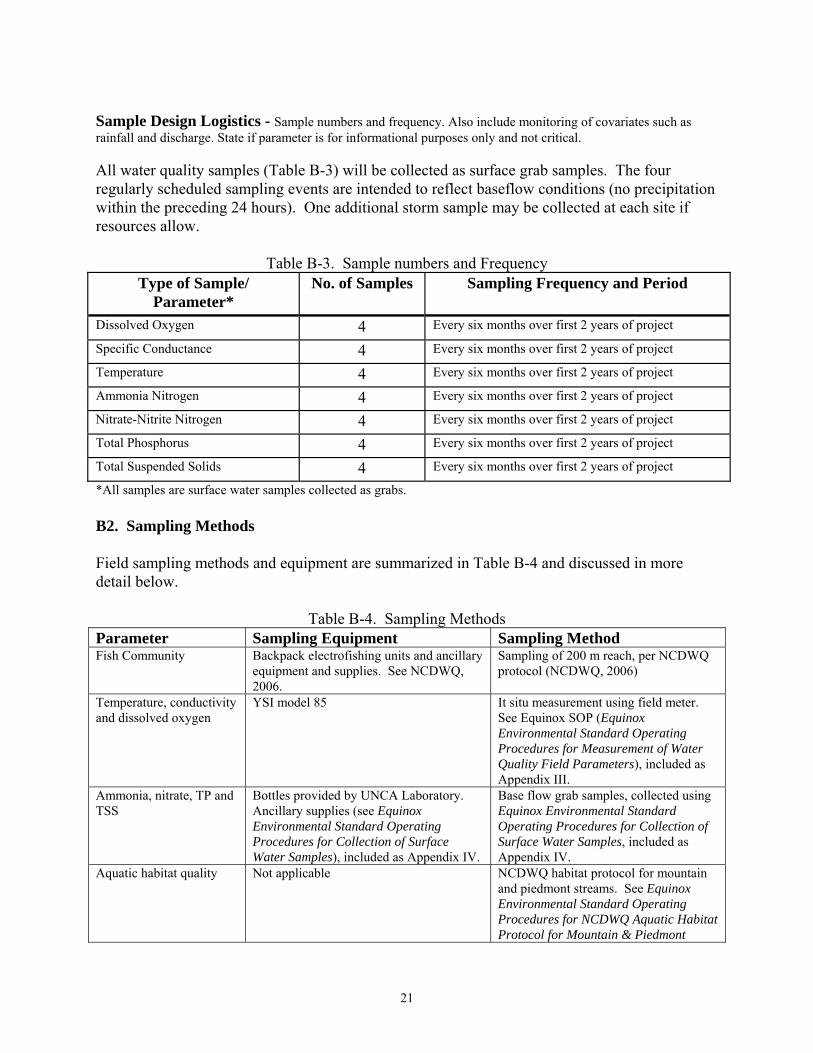
Sample Design Logistics - Sample numbers and frequency. Also include monitoring of covariates such as rainfall and discharge. State if parameter is for informational purposes only and not critical. All water quality samples (Table B-3) will be collected as surface grab samples. The four regularly scheduled sampling events are intended to reflect baseflow conditions (no precipitation within the preceding 24 hours). One additional storm sample may be collected at each site if resources allow.
Table B-3. Sample numbers and Frequency Type of Sample/
Parameter* No. of Samples Sampling Frequency and Period
Dissolved Oxygen 4 Every six months over first 2 years of project
Specific Conductance 4 Every six months over first 2 years of project
Temperature 4 Every six months over first 2 years of project
Ammonia Nitrogen 4 Every six months over first 2 years of project
Nitrate-Nitrite Nitrogen 4 Every six months over first 2 years of project
Total Phosphorus 4 Every six months over first 2 years of project
Total Suspended Solids 4 Every six months over first 2 years of project
*All samples are surface water samples collected as grabs. B2. Sampling Methods Field sampling methods and equipment are summarized in Table B-4 and discussed in more detail below.
Table B-4. Sampling Methods Parameter Sampling Equipment Sampling Method Fish Community
Backpack electrofishing units and ancillary equipment and supplies. See NCDWQ, 2006.
Sampling of 200 m reach, per NCDWQ protocol (NCDWQ, 2006)
Temperature, conductivity and dissolved oxygen
YSI model 85 It situ measurement using field meter. See Equinox SOP (Equinox Environmental Standard Operating Procedures for Measurement of Water Quality Field Parameters), included as Appendix III.
Ammonia, nitrate, TP and TSS
Bottles provided by UNCA Laboratory. Ancillary supplies (see Equinox Environmental Standard Operating Procedures for Collection of Surface Water Samples), included as Appendix IV.
Base flow grab samples, collected using Equinox Environmental Standard Operating Procedures for Collection of Surface Water Samples, included as Appendix IV.
Aquatic habitat quality Not applicable NCDWQ habitat protocol for mountain and piedmont streams. See Equinox Environmental Standard Operating Procedures for NCDWQ Aquatic Habitat Protocol for Mountain & Piedmont
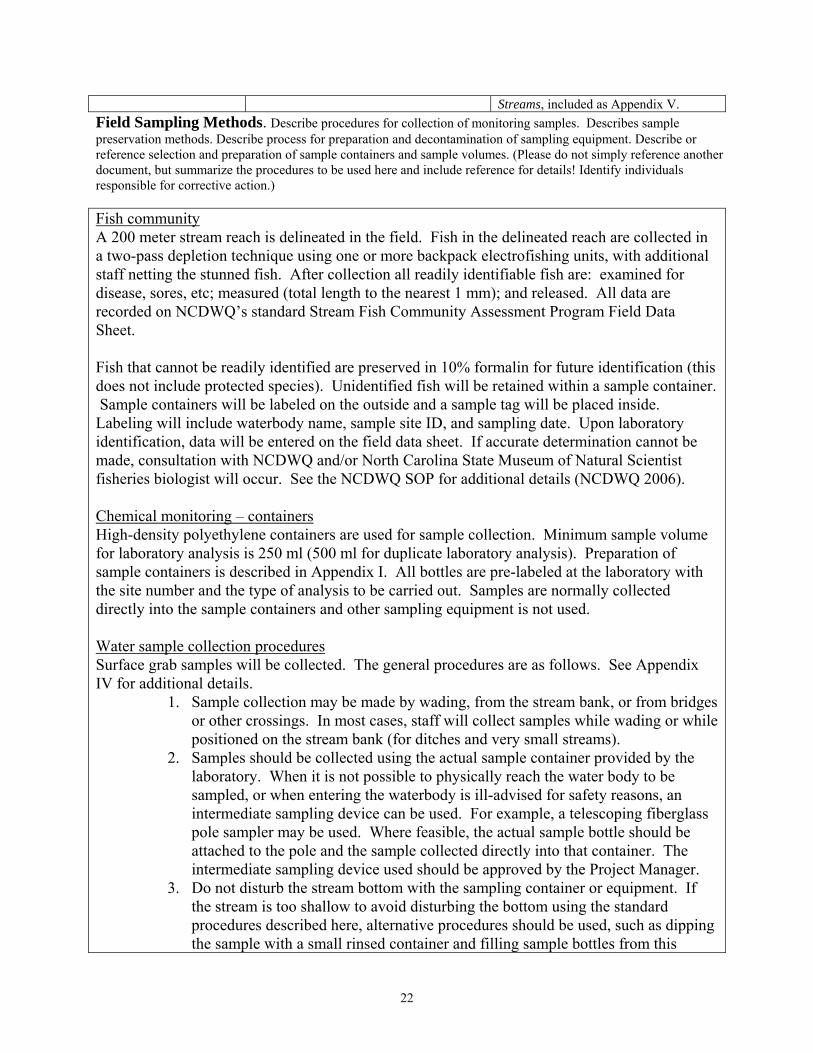
Streams, included as Appendix V. Field Sampling Methods. Describe procedures for collection of monitoring samples. Describes sample preservation methods. Describe process for preparation and decontamination of sampling equipment. Describe or reference selection and preparation of sample containers and sample volumes. (Please do not simply reference another document, but summarize the procedures to be used here and include reference for details! Identify individuals responsible for corrective action.) Fish community A 200 meter stream reach is delineated in the field. Fish in the delineated reach are collected in a two-pass depletion technique using one or more backpack electrofishing units, with additional staff netting the stunned fish. After collection all readily identifiable fish are: examined for disease, sores, etc; measured (total length to the nearest 1 mm); and released. All data are recorded on NCDWQ’s standard Stream Fish Community Assessment Program Field Data Sheet. Fish that cannot be readily identified are preserved in 10% formalin for future identification (this does not include protected species). Unidentified fish will be retained within a sample container. Sample containers will be labeled on the outside and a sample tag will be placed inside. Labeling will include waterbody name, sample site ID, and sampling date. Upon laboratory identification, data will be entered on the field data sheet. If accurate determination cannot be made, consultation with NCDWQ and/or North Carolina State Museum of Natural Scientist fisheries biologist will occur. See the NCDWQ SOP for additional details (NCDWQ 2006). Chemical monitoring – containers High-density polyethylene containers are used for sample collection. Minimum sample volume for laboratory analysis is 250 ml (500 ml for duplicate laboratory analysis). Preparation of sample containers is described in Appendix I. All bottles are pre-labeled at the laboratory with the site number and the type of analysis to be carried out. Samples are normally collected directly into the sample containers and other sampling equipment is not used. Water sample collection procedures Surface grab samples will be collected. The general procedures are as follows. See Appendix IV for additional details.
1. Sample collection may be made by wading, from the stream bank, or from bridges or other crossings. In most cases, staff will collect samples while wading or while positioned on the stream bank (for ditches and very small streams).
2. Samples should be collected using the actual sample container provided by the laboratory. When it is not possible to physically reach the water body to be sampled, or when entering the waterbody is ill-advised for safety reasons, an intermediate sampling device can be used. For example, a telescoping fiberglass pole sampler may be used. Where feasible, the actual sample bottle should be attached to the pole and the sample collected directly into that container. The intermediate sampling device used should be approved by the Project Manager.
3. Do not disturb the stream bottom with the sampling container or equipment. If the stream is too shallow to avoid disturbing the bottom using the standard procedures described here, alternative procedures should be used, such as dipping the sample with a small rinsed container and filling sample bottles from this
22
23
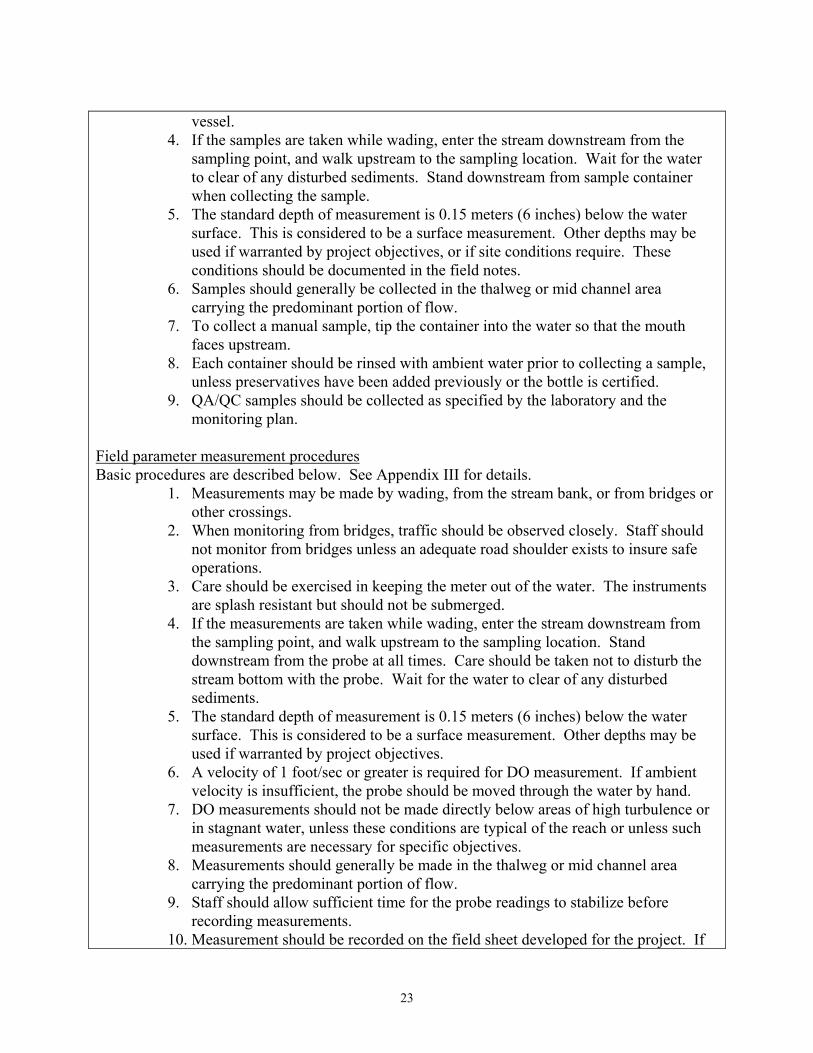
vessel. 4. If the samples are taken while wading, enter the stream downstream from the
sampling point, and walk upstream to the sampling location. Wait for the water to clear of any disturbed sediments. Stand downstream from sample container when collecting the sample.
5. The standard depth of measurement is 0.15 meters (6 inches) below the water surface. This is considered to be a surface measurement. Other depths may be used if warranted by project objectives, or if site conditions require. These conditions should be documented in the field notes.
6. Samples should generally be collected in the thalweg or mid channel area carrying the predominant portion of flow.
7. To collect a manual sample, tip the container into the water so that the mouth faces upstream.
8. Each container should be rinsed with ambient water prior to collecting a sample, unless preservatives have been added previously or the bottle is certified.
9. QA/QC samples should be collected as specified by the laboratory and the monitoring plan.
Field parameter measurement procedures Basic procedures are described below. See Appendix III for details.
1. Measurements may be made by wading, from the stream bank, or from bridges or other crossings.
2. When monitoring from bridges, traffic should be observed closely. Staff should not monitor from bridges unless an adequate road shoulder exists to insure safe operations.
3. Care should be exercised in keeping the meter out of the water. The instruments are splash resistant but should not be submerged.
4. If the measurements are taken while wading, enter the stream downstream from the sampling point, and walk upstream to the sampling location. Stand downstream from the probe at all times. Care should be taken not to disturb the stream bottom with the probe. Wait for the water to clear of any disturbed sediments.
5. The standard depth of measurement is 0.15 meters (6 inches) below the water surface. This is considered to be a surface measurement. Other depths may be used if warranted by project objectives.
6. A velocity of 1 foot/sec or greater is required for DO measurement. If ambient velocity is insufficient, the probe should be moved through the water by hand.
7. DO measurements should not be made directly below areas of high turbulence or in stagnant water, unless these conditions are typical of the reach or unless such measurements are necessary for specific objectives.
8. Measurements should generally be made in the thalweg or mid channel area carrying the predominant portion of flow.
9. Staff should allow sufficient time for the probe readings to stabilize before recording measurements.
10. Measurement should be recorded on the field sheet developed for the project. If
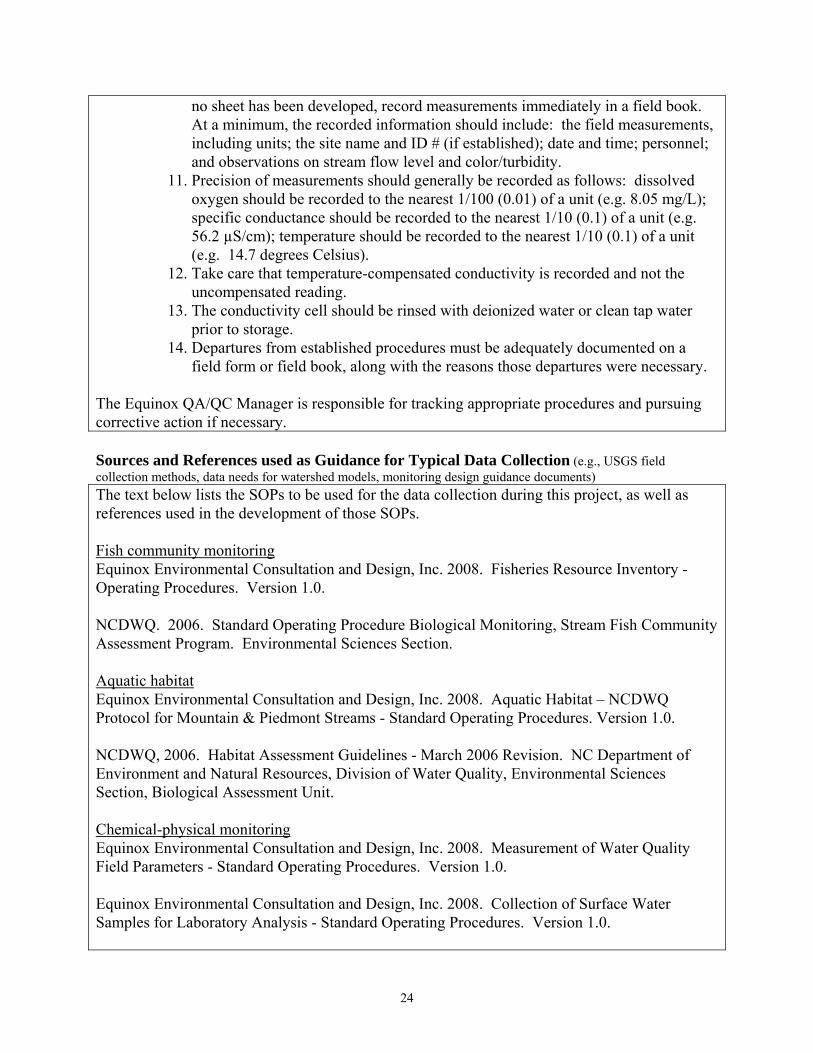
no sheet has been developed, record measurements immediately in a field book. At a minimum, the recorded information should include: the field measurements, including units; the site name and ID # (if established); date and time; personnel; and observations on stream flow level and color/turbidity.
11. Precision of measurements should generally be recorded as follows: dissolved oxygen should be recorded to the nearest 1/100 (0.01) of a unit (e.g. 8.05 mg/L); specific conductance should be recorded to the nearest 1/10 (0.1) of a unit (e.g. 56.2 µS/cm); temperature should be recorded to the nearest 1/10 (0.1) of a unit (e.g. 14.7 degrees Celsius).
12. Take care that temperature-compensated conductivity is recorded and not the uncompensated reading.
13. The conductivity cell should be rinsed with deionized water or clean tap water prior to storage.
14. Departures from established procedures must be adequately documented on a field form or field book, along with the reasons those departures were necessary.
The Equinox QA/QC Manager is responsible for tracking appropriate procedures and pursuing corrective action if necessary. Sources and References used as Guidance for Typical Data Collection (e.g., USGS field collection methods, data needs for watershed models, monitoring design guidance documents) The text below lists the SOPs to be used for the data collection during this project, as well as references used in the development of those SOPs. Fish community monitoring Equinox Environmental Consultation and Design, Inc. 2008. Fisheries Resource Inventory -Operating Procedures. Version 1.0. NCDWQ. 2006. Standard Operating Procedure Biological Monitoring, Stream Fish Community Assessment Program. Environmental Sciences Section. Aquatic habitat Equinox Environmental Consultation and Design, Inc. 2008. Aquatic Habitat – NCDWQ Protocol for Mountain & Piedmont Streams - Standard Operating Procedures. Version 1.0. NCDWQ, 2006. Habitat Assessment Guidelines - March 2006 Revision. NC Department of Environment and Natural Resources, Division of Water Quality, Environmental Sciences Section, Biological Assessment Unit. Chemical-physical monitoring Equinox Environmental Consultation and Design, Inc. 2008. Measurement of Water Quality Field Parameters - Standard Operating Procedures. Version 1.0. Equinox Environmental Consultation and Design, Inc. 2008. Collection of Surface Water Samples for Laboratory Analysis - Standard Operating Procedures. Version 1.0.
24

25
NCDWQ. 2006. Intensive Survey Unit Standard Operating Procedures Manual: Physical and Chemical Monitoring. Version 1.3. Environmental Sciences Section. NRCS. 2003. National Water Quality Handbook. USDA Natural Resources Conservation Service. Wilde, Franceska. 2005. Preparations for Water Quality Sampling. Chapter A1 of the US Geological Survey National Field Manual for the Collection of Water Quality Data. Book 1, Handbooks for Water-Resources Investigation. USGS. 2002. Processing of Water Samples. Chapter A5 of the US Geological Survey National Field Manual for the Collection of Water Quality Data. Book 1, Handbooks for Water-Resources Investigation. USGS. 2006. Collection of Water Samples. Version 2.0. Chapter A4 of the US Geological Survey National Field Manual for the Collection of Water Quality Data. Book 1, Handbooks for Water-Resources Investigation. B3. Sample Handling and Custody - Identify how the samples will be physically handled, transported, and received; and describe the documentation of sample information handling and chain-of-custody. Include maximum allowed holding times from collection to analysis and lab preservation procedures. Bottles used for all parameters will follow protocols used by the Environmental Quality Institute Laboratory at the University of North Carolina – Asheville (UNCA EQI Laboratory). See Appendix I for additional protocol details. All bottle labels will include station ID, site location, the date and time of sampling and the name of the sample collector. The chain of custody form provided by the laboratory will be completed at the time of collection. This data sheet includes the site name and number, the date and time of collection, the name and phone number of the person collecting the sample. Samples will be iced to ≤4ºC and transported by Equinox staff to the UNCA EQI Laboratory within 24 hours after they are collected. Upon arrival at the lab, samples are logged into the facility and assigned a laboratory number, which is recorded on the Sample Request Custody Form. Holding time and preservation information is summarized in Table B-5.
Table B-5. Preservation and Holding Time Requirements Parameter Maximum
Holding Time Preservation
TSS 7 days Refrigeration at 1-4° C Total Phosphorus 48 hours Refrigeration at 1-4° C
* Ammonia-N 48 hours Refrigeration at 1-4° C
* Nitrate-N 48 hours Refrigeration at 1-4° C
* *Chemical preservation is not required with a 48 hour holding time.
Sample handling procedures are summarized as follows. See Appendices I and IV for additional details.
1. Clean, nontalc gloves should be worn in the field during all operations involving the handling of sampling apparatus, samples and blanks.
2. Caution must be exercised to avoid contact with the container mouth, inside of the container or with the container cap.
3. When collecting samples, individual containers should be uncapped only when they are about to be filled. Containers should be recapped immediately.
4. Where preservatives are required and have not been previously added to the sample container, they should be added as soon as practical after sample collection. Preservation on site is preferred. Ideally, field preservation should be carried out in a location sheltered from airborne contaminants, including dust, solvents and vehicle emissions. The sample handling area should be as clean as practical.
5. Where preservatives have previously been added to the container, care should be taken not to overfill the container.
6. Samples should be immediately placed in a cooler and iced. Samples stored in an ice chest should not be submerged, which can result in cross contamination.
7. Sample containers should be handled as little as possible. When handling is necessary care should be taken to prevent contamination.
B4. Analytical Methods Identify laboratory to conduct testing and indicated if they are State certified. Identify all analytical SOPs including field and laboratory procedures (include method for every parameter being monitored). Specify needed laboratory turnaround time. Identify individuals responsible for corrective action. All laboratory analyses for this project will be carried out by the UNCA EQI Laboratory. The laboratory is certified by NCDWQ to perform these analyses with the exception of nitrate-N. Analytical methods are listed below: • Total Suspended Solids are measured by EPA method 160.2 Gravimetric Dried at 103 - 105
degrees C (Standard Method 2540 D). • Total Phosphorus sample preparation is by Standard Method 4500 B Persulfate Digestion
Method (without filtration) (Hach Method 8190) and measurement is by Standard Method 4500 PE Ascorbic Acid Method (EPA method 365.2) (Hach Method 8048).
• Nitrogen (Ammonia) is measured by EPA Method 350.2 (Hach Method 8038 - Nessler Method).
• Nitrate sample preparation is by Standard Method 4500 B Persulfate Digestion Method (without filtration) (Hach Method 8190); measurement is by Standard Method 4500 PE Ascorbic Acid Method (EPA method 365.2) (Hach Method 8048) methods.
The required turnaround time is 2 weeks. If needed, the Equinox Project Manager will pursue corrective action with the laboratory.
26

27
B5. Quality Control - Identify QC activities which will be used for each type of sampling, analysis, or measurement technique; for example, blanks, spikes, duplicates, etc., and at what frequency (also include what criteria will be used to determine if a corrective action is needed and what that corrective action will be). Field QC Checks Table B-6 outlines QC procedures for field activities.
Table B-6. Field QC Checks Activity QC Procedure
Field data recording All field forms and labeling are inspected for accuracy and completeness while still on site, and omissions and errors corrected while still in the field.
Field duplicates One set of field duplicates will be collected and transported to the laboratory for analysis during each regularly scheduled monitoring events (i.e. one sample in seven will be a field duplicate).
Meter calibration Meters are calibrated before use (see B7). Fish community sampling oversight
The Certified Fisheries Biologist will be responsible for overseeing the sampling efforts.
Fish identification Fish not readily identified in the field will be preserved and returned to the laboratory for identification. If accurate determination can not be determined, consultation with NCDWQ and/or North Carolina State Museum of Natural Scientist fisheries biologist will occur.
Sample container inspection Field staff will check all sample containers for integrity prior to use.
QA/QC Coordinator oversight The Project QA/QC Coordinator will conduct spot checks of data files, field forms, calibration records and other documentation to ensure that records and files are complete, that specified procedures are followed and that data anomalies are not apparent. Any noted discrepancies in collection or assessment methods will be immediately corrected and any data that does not meet all stated criteria will be discarded.
Team collaboration For protocols involving significant professional judgment, such as aquatic habitat assessment, forms are completed in teams of two or more people and any differences in assessment resolved.
Initial project orientation Prior to the initiation of the gathering of field samples, the Project QA/QC Coordinator will hold an information session that must be attended for all field staff. At this session, all field protocols and procedures will be reviewed. A field training session may be held at the discretion of the QA/QC Coordinator.
Meters inspection and maintenance
See Section B6
Sample bottles are used by Equinox as prepared by the UNCA EQI Laboratory. The Project QA/QC Coordinator will verify that the UNCA EQI laboratory follows all specified processing protocols.
Laboratory QC Checks - Describe Laboratory QC procedures The UNCA EQI Laboratory is certified by NCDWQ. Selected laboratory QA/QC procedures are summarized below. See Appendix I for further details. Nitrogen and Phosphorus: Each analyst constructs a five point curve annually. The slope, y-intercept and correlation coefficient are recorded. Correlation coefficient must be 0.95. A blank, a mid-range calibration check standard, and a QC standard are analyzed prior to sample analysis each day. A mid-range calibration standard is analyzed at the end of each run. The five point curve brackets the range of the analysis. If a sample falls outside of the bracketed range, either the sample is diluted to fall within the range, or high standards are prepared and checked against the curve. Results of the mid-range standard check must fall within 10% of expected. If results do not fall within the acceptable range, the test is prepared and checked. Standards may also be checked on a second Hach meter to determine meter error. A duplicate analysis is performed on 10% of the samples for each test (or generally at least once with each run if there are less than ten samples). Results must fall within established control limits for each parameter. Dilutions are prepared for samples falling over the range of the curve or when it is determined that interference exists. A digested blank is prepared for turbid total phosphorus samples. Total Suspended Solids: A standard using Whatman ashless powder is prepared and checked quarterly. The scale is checked with 2.0000 and 0.5000 weights prior to each weighing of filters. Duplicate analysis is performed on 10% of samples. General: Method blanks, calibration standards, laboratory-fortified blanks and other internal laboratory QA/QC procedures are discussed in Appendix I. Corrective action is taken by the laboratory manager whenever quality control data are outside acceptance limits. No data are reported until the problem is corrected. The sample is reanalyzed until control data are within acceptance limits. The following criteria will result in sample rejection: • Mid-range standard reference sample checks outside 10% of the expected; • Blanks that exceed an amount greater than the detection limit; or • Duplicate samples that fall outside of established control limits.
Data Analysis QC Checks- Describe data analysis QC procedures. Include what criteria will be used to determine if a corrective action is needed and what that corrective action will be. Provide or reference QC statistics used to determine precision and bias, if applicable.
• The laboratory will generally report analytical results to Equinox in electronic format. Where hard copy reports are used, paper copies of laboratory reports will be stored in project files until entered into the electronic data base, and following data base entry.
• Following electronic data entry, entries will be checked for completeness and proofread using the original laboratory or field forms. Data should also be examined for outliers that may merit additional investigation.
• When data are graphed, mapped, or used to perform calculations, these products are reviewed
28
29
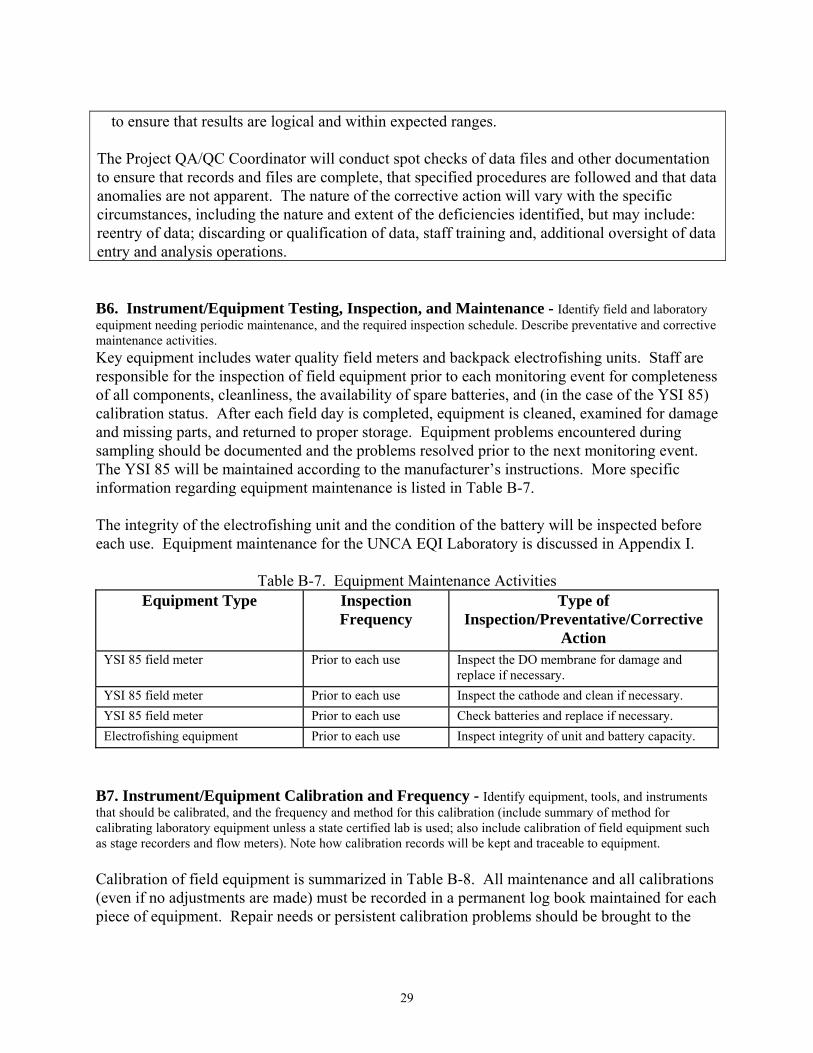
to ensure that results are logical and within expected ranges. The Project QA/QC Coordinator will conduct spot checks of data files and other documentation to ensure that records and files are complete, that specified procedures are followed and that data anomalies are not apparent. The nature of the corrective action will vary with the specific circumstances, including the nature and extent of the deficiencies identified, but may include: reentry of data; discarding or qualification of data, staff training and, additional oversight of data entry and analysis operations. B6. Instrument/Equipment Testing, Inspection, and Maintenance - Identify field and laboratory equipment needing periodic maintenance, and the required inspection schedule. Describe preventative and corrective maintenance activities. Key equipment includes water quality field meters and backpack electrofishing units. Staff are responsible for the inspection of field equipment prior to each monitoring event for completeness of all components, cleanliness, the availability of spare batteries, and (in the case of the YSI 85) calibration status. After each field day is completed, equipment is cleaned, examined for damage and missing parts, and returned to proper storage. Equipment problems encountered during sampling should be documented and the problems resolved prior to the next monitoring event. The YSI 85 will be maintained according to the manufacturer’s instructions. More specific information regarding equipment maintenance is listed in Table B-7. The integrity of the electrofishing unit and the condition of the battery will be inspected before each use. Equipment maintenance for the UNCA EQI Laboratory is discussed in Appendix I.
Table B-7. Equipment Maintenance Activities Equipment Type Inspection
Frequency Type of
Inspection/Preventative/Corrective Action
YSI 85 field meter Prior to each use Inspect the DO membrane for damage and replace if necessary.
YSI 85 field meter Prior to each use Inspect the cathode and clean if necessary. YSI 85 field meter Prior to each use Check batteries and replace if necessary. Electrofishing equipment Prior to each use Inspect integrity of unit and battery capacity.
B7. Instrument/Equipment Calibration and Frequency - Identify equipment, tools, and instruments that should be calibrated, and the frequency and method for this calibration (include summary of method for calibrating laboratory equipment unless a state certified lab is used; also include calibration of field equipment such as stage recorders and flow meters). Note how calibration records will be kept and traceable to equipment. Calibration of field equipment is summarized in Table B-8. All maintenance and all calibrations (even if no adjustments are made) must be recorded in a permanent log book maintained for each piece of equipment. Repair needs or persistent calibration problems should be brought to the

immediate attention of the Project QA/QC Coordinator. See Appendix I for information on calibration procedures at the UNCA EQI laboratory.
Table B-8. Calibration Summary Equipment Type Calibration
Frequency Standard or Calibration Instrument Used
YSI 85 - DO calibration Each field day Calibration per manufactured instructions at beginning of each field day.
YSI 85 - DO calibration At changes in site elevation
The meter should be recalibrated per manufactured instructions for elevation changes between sites.
YSI 85 - conductivity calibration
Bimonthly or more frequent if necessary
Specific conductance is calibrated at the factory and subsequent system calibration is rarely required. Calibration of specific conductance should be checked on a bimonthly basis if the meter has been in regular use. If the meter has been unused for a period of two months or more, calibration should be checked prior to use. Calibration should be checked more frequently if malfunction is suspected.
Electrofishing At each site Prior to sampling, the battery backpack electrofishing unit output voltage and frequency should be determined downstream of the sampling reach. Voltage and frequency settings are adjusted based on stream conductivity measurements, to insure adequate stunning versus fish mortality.
B8. Inspection/Acceptance of Supplies and Consumables Identify critical supplies and consumables for field and laboratory, and acceptance criteria. Note responsible individual(s). Calibration standards for the YSI 85 and other equipment and materials are purchased as needed from Ben Meadows or other similar suppliers. All equipment and supplies are inspected by the Project QA/QC Coordinator upon receipt and stored in the Equinox supply room until needed. Field staff is responsible for reporting supply needs to the Equinox Office Manager. B9. Non-Direct Measurements - Identify data sources, for example, computer databases or literature files, or models that will be accessed and used. Describe limitations of the secondary data. Document rationale for original collection of data and its relevance to this project. The field data collection activities described above will be supplemented with data from several other sources. These additional data will be used to further assess watershed conditions. Examples of additional data include: Precipitation data may be used in planning field activities and as an aid in interpreting results. Daily rainfall data are available from a long term National Weather Service Cooperative Station located in Morganton near the center of the watershed (Cooperative Station No. 315838; Latitude: 35.73083°, Longitude: -81.67167). Data available on line through the NC State Climate Office CRONOS Data base (http://www.nc-climate.ncsu.edu/cronos). Updated land use/land cover for the watershed is needed to evaluate potential pollution source
30

31
areas and aid in the calculation of pollution loadings. Equinox will develop a GIS land cover/land use dataset using the most recent aerial photography (2005). Methods will be similar to those used by Equinox in creating the land cover dataset covering the Muddy Creek watershed (McDowell County), developed for the NC Wildlife Resources Commission (Equinox, 2008). This land cover update will be provided to local governments as an outcome of this project. Aerial photography (2005) will be analyzed to identify potential source areas, areas requiring a field examination, and potential stormwater retrofit and BMP sites. Water Quality Data. From April 2007 to April 2008 a Lake Rhodhiss nonpoint source study was conducted by Carolina Land and Lake RC&D with funding from NCDWQ, Duke Energy and others. As a part of this investigation, monthly sampling was conducted at a single site on Hunting Creek from over a one year period. April 2007 to April 2008. The location of this sampling site corresponds to chemical monitoring site 3 (Figure B-1). Parameters included nutrients (ammonia, nitrate/nitrite, orthophosphate, total phosphorus, total Kjeldahl nitrogen), total suspended solids, and conductivity. These data will be used by the current project to document pollutant levels in Hunting Creek. B10. Data Management Describe data management scheme from field to final use and storage, and describe the process for data archival and retrieval. Include a summary of data analysis procedures, data transformations, and statistical analyses, if applicable. During this project, data will be generated at three primary locations: at field sites (water quality field measurements, fish community data and qualitative stream/watershed information); at the UNCA EQI Laboratory (analytical reports on water samples); and at the office of Equinox (GIS datasets and other analytical products). An overview of data types and storage is presented in Table B-9.
Table B-9. Data Type and Data Management/Storage Data Type Management and Storage
Paper field records (Equinox) Initially recorded on field data sheets. Electronic records of field data (Equinox)
Data entered into Microsoft Excel file as soon as possible after collection. Field forms and electronic data retained for a minimum of five years after completion of project.
GIS data (Equinox) Files will be stored in ArcGIS readable format and retained for a minimum of five years following completion of project.
Laboratory records (on site at UNCA)
Records are retained for a minimum of ten years. Hard copy records are filed in a safe storage environment. Computer records are backed up on storage tapes.
Reports of laboratory analyses (Equinox)
Equinox will receive electronic reports from UNCA. Reports will be retained as Microsoft Excel files for a minimum of five years after completion of project.
Data Management and Analysis. Describe data management scheme from field to final use, data compiling and data storage. Describe the process for data archival and retrieval. Include summary of data analysis procedures, data transformations, and statistical analyses, if applicable. Include project-specific calculations or algorithms, if applicable.
Field data tracking. Data will be tracked via the field data sheets completed during monitoring events, and in the case of UNCA EQI Laboratory analysis, by sample identification labels and laboratory records. Field sheets will be checked for accuracy and completeness prior to leaving the monitoring station. Hard copies of field data collected by Equinox will be stored in project files until entered into the electronic data base, and following data base entry. Electronic entry of field data. As soon as possible after data collection (generally within two weeks), all field data collected during the project will be keyed by Equinox data management staff from hard copies of field forms or UNCA EQI Laboratory reports (if these reports are not electronically available). The only exception is latitude/longitude data, which will be uploaded directly from GPS units. Data will be entered into Microsoft Excel data files. The data entered will include site and sample identification information as well as the field measurements. Units of measurement will be specified. The data will not be entered at a precision greater than that recorded in the field. Laboratory reporting. The UNCA EQI Laboratory will report analytical results to Equinox within two weeks after the completion of laboratory analyses. See Appendix I for UNCA EQI internal procedures. Data management. Following electronic data entry, Equinox data management staff will proofread entries and check them for completeness and accuracy using the original field or laboratory forms. Data will also be examined for outliers that may merit additional investigation. Selected data will be uploaded from the Excel data files into GIS software (ArcGIS 9.2) for mapping and further analysis. Any plots and summary statistics generated will be examined to assure that the results are logical in light of the nature of the data. Data analysis. Given the limited quantitative data to be generated by this project and the fact that data are intended to serve the largely descriptive/diagnostic purposes of an initial watershed assessment, formal statistical analysis and testing will not be collected. Descriptive statistics such as means and medians may be used in some cases to summarize data. Concentration data will be compared to applicable state standards where they exist. Oversight. The QA/QC coordinator will track the data entry process and insure that all field data are entered as outlined above. Data files will be stored on the computer of the QA/QC Coordinator and on the Equinox server.
32
33
Section C: Assessment and Oversight C1. Assessments and Response Actions - List the number, frequency, and type of assessment activities that should be conducted. Specific response actions for the situations listed below will generally apply. Also list who is responsible for each action. The Project QA/QC Coordinator is responsible for a number of assessment activities in order to determine whether appropriate QA/QC activities are being implemented as planned, and is also responsible for ensuring that remedial actions are taken when needed. Depending upon the outcome of initial assessment activities, further investigation may be required. Key assessment responsibilities of the QA/QC Coordinator are summarized in Table C-1. The QA/QC Coordinator reports to the Project Manager on data collection and management issues. The Project Manager is responsible for ensuring that the QA/QC Coordinator follows through with the necessary remedial actions. Activities at the state certified UNCA EQI Laboratory are discussed in Appendix I.
Table C-1. Summary of Assessment Responsibilities of the QA/QC Coordinator Assessment Response Action
Observation of each field staff in the field on annual basis to determine adherence to monitoring plan and SOP
Actions dependent on circumstances, but may include measures such as additional staff training, reassignment of staff or revisions to SOP.
Review of calibration logs (every six months)
Resolution of problems with field staff.
Review of equipment condition to evaluate maintenance and repair activities
Resolution of problems with field staff; repair or replacement of equipment if necessary.
Review of field records after each regularly scheduled monitoring event
Resolution of problems with field staff; revision of forms if necessary.
Periodic review of field forms for watershed surveys and stream walking activities
Resolution of problems with field staff, revision of forms if necessary.
Review of UNCA Laboratory reports after scheduled monitoring events to evaluate adherence to specifications
Discuss observed problems or concerns with the Laboratory Supervisor.
Review of data entry activities on a quarterly basis
Resolution of problems with data management staff.
C2. Reports to Management - Identify what project QA status reports are needed and how frequently they will be prepared The Project QA/QC Coordinator will present verbal reports to the Equinox Project Manager on a monthly basis and written reports as requested. Reports will include a summary of recent data collection and data management activities, as well as relevant information on data quality and QA/QC issues. Significant data quality or QA/QC problems will be discussed and addressed.
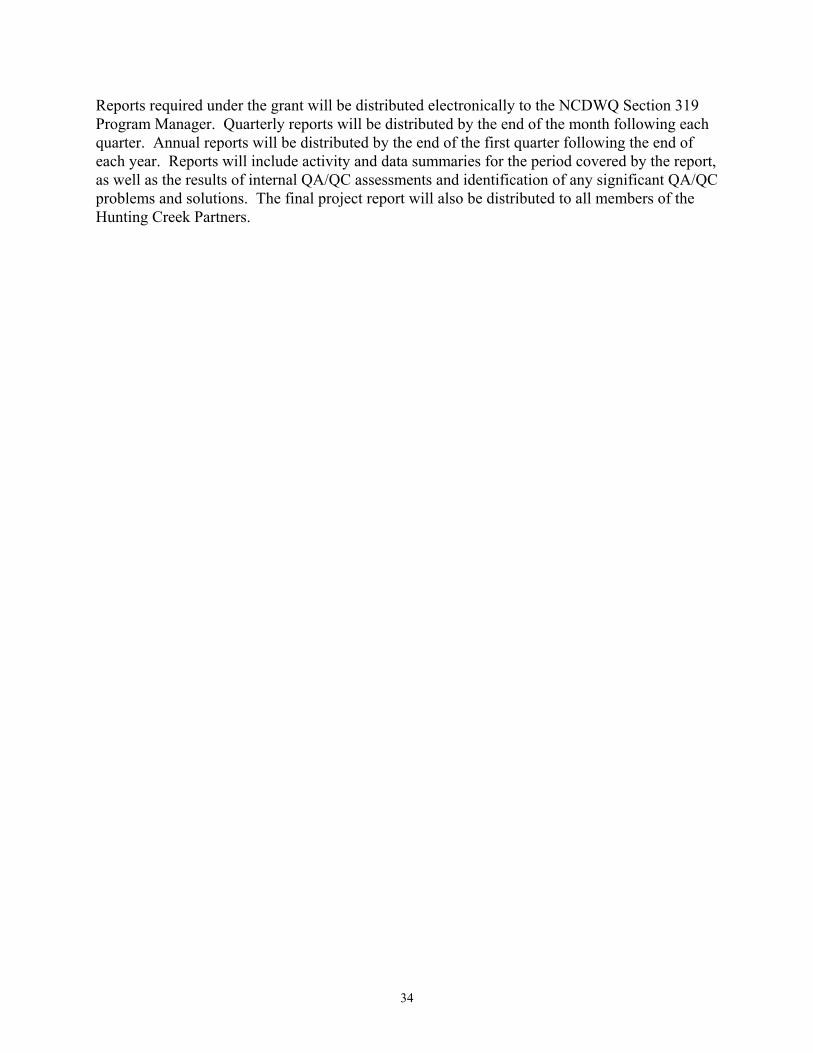
Reports required under the grant will be distributed electronically to the NCDWQ Section 319 Program Manager. Quarterly reports will be distributed by the end of the month following each quarter. Annual reports will be distributed by the end of the first quarter following the end of each year. Reports will include activity and data summaries for the period covered by the report, as well as the results of internal QA/QC assessments and identification of any significant QA/QC problems and solutions. The final project report will also be distributed to all members of the Hunting Creek Partners.
34
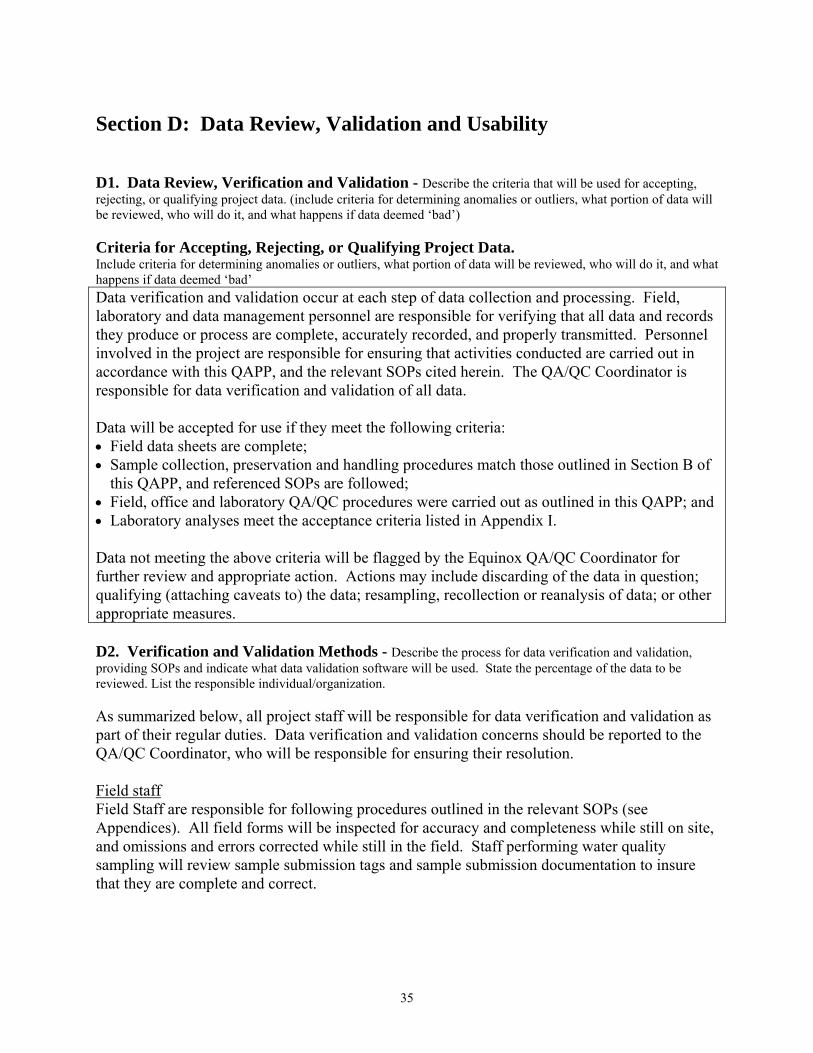
35
Section D: Data Review, Validation and Usability D1. Data Review, Verification and Validation - Describe the criteria that will be used for accepting, rejecting, or qualifying project data. (include criteria for determining anomalies or outliers, what portion of data will be reviewed, who will do it, and what happens if data deemed ‘bad’) Criteria for Accepting, Rejecting, or Qualifying Project Data. Include criteria for determining anomalies or outliers, what portion of data will be reviewed, who will do it, and what happens if data deemed ‘bad’ Data verification and validation occur at each step of data collection and processing. Field, laboratory and data management personnel are responsible for verifying that all data and records they produce or process are complete, accurately recorded, and properly transmitted. Personnel involved in the project are responsible for ensuring that activities conducted are carried out in accordance with this QAPP, and the relevant SOPs cited herein. The QA/QC Coordinator is responsible for data verification and validation of all data. Data will be accepted for use if they meet the following criteria: • Field data sheets are complete; • Sample collection, preservation and handling procedures match those outlined in Section B of
this QAPP, and referenced SOPs are followed; • Field, office and laboratory QA/QC procedures were carried out as outlined in this QAPP; and • Laboratory analyses meet the acceptance criteria listed in Appendix I. Data not meeting the above criteria will be flagged by the Equinox QA/QC Coordinator for further review and appropriate action. Actions may include discarding of the data in question; qualifying (attaching caveats to) the data; resampling, recollection or reanalysis of data; or other appropriate measures. D2. Verification and Validation Methods - Describe the process for data verification and validation, providing SOPs and indicate what data validation software will be used. State the percentage of the data to be reviewed. List the responsible individual/organization. As summarized below, all project staff will be responsible for data verification and validation as part of their regular duties. Data verification and validation concerns should be reported to the QA/QC Coordinator, who will be responsible for ensuring their resolution. Field staff Field Staff are responsible for following procedures outlined in the relevant SOPs (see Appendices). All field forms will be inspected for accuracy and completeness while still on site, and omissions and errors corrected while still in the field. Staff performing water quality sampling will review sample submission tags and sample submission documentation to insure that they are complete and correct.
Laboratory staff Standard laboratory procedures (Appendix I) include a variety of steps to ensure data integrity. UNCA EQI Laboratory staff will review all data for accuracy and completeness prior to submitting data to Equinox. Data management staff Following electronic data entry, all entries will be checked for completeness and proof-read using the original field or laboratory forms. Data will be examined for outliers that may merit additional investigation. When data are graphed, mapped, or used to perform calculations, these products should be reviewed to ensure that results are logical and within expected ranges. QA/QC coordinator The QA/QC Coordinator will be responsible for: (1) ensuring that all SOPs are followed; (2) investigating all data quality issues; (3) conducting spot checks of data files, field forms, calibration records and other documentation to ensure that records and files are complete, that specified procedures are followed and that data anomalies are not apparent; and (4) ensuring that all data quality issues are satisfactorily resolved. D3. Reconciliation with User Requirements and Data Quality Objectives
Also include how the data will be summarized to be able to report results to decision makers. Describe process for reconciling project results with data quality objectives (DQOs) and reporting limitations on use of data. Identify issue resolution procedure(s) and responsible individuals The data collected during this project are primarily intended to serve descriptive and diagnostic purposes related to the development of a watershed plan. All data collected will be presented and interpreted in the plan, which will include a discussion of key stressors and sources of pollution and recommendations for management action to address those issues. Little data are currently available for Hunting Creek, and this project represents an initial step to understand and remediate water quality problems in the watershed. Given the complex nature of urban watersheds, it is likely that additional data collection will be necessary after project completion in order to fully meet all planning needs. The data collected during this project will provide the basis for determining what additional data should be collected. The types of data to be collected during this project are diverse, including biological community data, habitat data, chemical monitoring data and other data types. A variety of methods will thus be used to review, analyze and display project data. Descriptive indicators and summary metrics will be calculated from the data collected. For example, mean or median values will be computed for nutrient data, while index values and ratings will be calculated from fish community data. Data will be plotted (e.g., using scatter plots and bar graphs) and mapped to examine spatial relationships. Given the limited quantitative data to be generated by this project and the fact that data are intended to serve primarily descriptive/diagnostic purposes, formal statistical analysis and testing will not be conducted. Periodic meetings will be held between project staff members to discuss QA/QC issues, identify
36

37
problem areas and formulate solutions to identified problems. Project progress will be presented at quarterly stakeholder meetings to allow an opportunity for stakeholders to review collected data and provide feedback. References Cited Equinox Environmental. 2008. Phase 2 – Land Cover Change in the Muddy Creek Watershed, 1998 and 2005. Report Prepared for the NC Wildlife Resources Commission. Kitchell, A and T. Schueler. 2004. Unified Stream Assessment: A User’s Manual. Version 1.0. Center for Watershed Protection. Ellicott City, MD. NCDWQ. 2003. Basinwide Assessment Report- Catawba River Basin. Environmental Sciences Branch. NCDWQ. 2006a. Standard Operating Procedure Biological Monitoring, Stream Fish Community Assessment Program. Environmental Sciences Section. NCDWQ, 2006b. Habitat Assessment Guidelines - March 2006 Revision. NC Department of Environment and Natural Resources, Division of Water Quality, Environmental Sciences Section, Biological Assessment Unit. NCDWQ. 2007. North Carolina Water Quality Assessment and Impaired Water List (2006 Integrated 305(b) and 303(d) Report). Final. Approved May 17, 2007. NCDWQ Planning Section.