Hungry Markets - Market Check HARVEST ISSUE 2017 AUSTRALIAN GRAIN REVIEW A season of ‘chalk and...
21
HARVEST ISSUE 2017 AGR AUSTRALIAN GRAIN REVIEW A season of ‘chalk and cheese’ Domestic rationing driving wheat values Poor MG milk returns shining light on grain EPRs Hungry Markets Offshore and domestic demand heats up
Transcript of Hungry Markets - Market Check HARVEST ISSUE 2017 AUSTRALIAN GRAIN REVIEW A season of ‘chalk and...
HARVEST ISSUE 2017
AGRA U S T R A L I A N G R A I N R E V I EW
A season of ‘chalk and cheese’Domestic rationing driving wheat values
Poor MG milk returns shining light on grain EPRs
Hungry MarketsOffshore and domestic demand heats up

A G R W E L C O M E A G R W E L C O M E
Editor’s comments Here at Market Check we’ve been investing significantly into our global research platform to benefit Australian growers
“Richard Perkins, Head of Marketing and Advisory, Market Check ”It’s been a rollercoaster this year in the Australian grains
market as we’ve moved from a massive crop last year pegged at 59 million tonnes (ABARES) to a potential drought market across the east coast of Australia this
season. Below-average autumn and winter rainfall, particularly for the months of June and July, throughout most regions in Queensland, New South Wales and Northern WA, combined with a dry spring has led to a large reduction in national production. As the size of the 2017/18 season’s crop decreased, domestic prices for Australian wheat ticked higher with historically high basis levels being reached in September. Queensland and Northern New South Wales moved from pricing export parity earlier in the year to import parity on the back of the smaller crops and growing feed grain demand.
The Australian combined winter crop production estimates vary, but most agree at this stage of the season it is around 34 to 36 million tonnes with a wheat crop of sub-20 million
tonnes. This is a little more than 40% below the previous season’s winter crop, which is a huge slide. Although last year’s record crop exacerbates the year-on-year drop, since 2001 there have only been two other seasons where yearly winter crop production fell by more than 40%, and those were 2002/03 and 2006/07 – both drought years. There has also been a big shift into canola with ABARES forecasting a 15% drop in combined wheat and barley planted hectares and a 22% increase in canola planted hectares.
Given the big shift in pricing dynamics, we have articles in this issue of AGR focusing more on domestic price drivers, how inelastic the export demand is for Australian wheat, and views on the future of the Australian grain supply chain. Some of the articles covering the domestic market include an analysis of the seasonal changes in the market by Lloyd George, Ag Scientia, understanding domestic drawing arcs with Andrew Retallick, Market Check and how the market is rationing demand by Mark Poole, Grain Corp.
Andrew Freeth, a Nuffield Scholar and farmer from Central West NSW, has also written a feature for this issue analysing the domestic supply chain.
The export market can’t be forgotten, though, with a growing Asian population increasingly relying on premium Australian wheat. We have a feature covering the potential inelastic demand for Australian wheat from international consumers, and we also have a feature by Will Cripps Market Check covering Chinese agricultural policies and the potential implications for Australia. On the back of some very positive feedback on our interviews in the last issue of AGR, we have decided to again interview trade participants. This time we have interviewed two prominent Indonesian flour millers to give ourselves and our readers a better idea of the uses and views on future demand for Australian wheat into the growing Asian flour milling market. Market Check caught up with Nick Ooi Eng Hooi from PT Cerestar Flour Mills and Jonathan Quek and Ms Lilik Tanojo from Bungasari Flour Mills.
We have well-known journalist Lucy Knight back covering the ACCC’s investigation into Murray Goulburn’s poor milk returns and the potential parallels in the Australian grain market with some pool operators posting estimated pool returns (EPRs). Finally, we have some interesting opinion pieces from Market Check Pools Manager Nick Crundall and Ukrainian-based Agronomist Mike Lee, followed by our regular market outlooks for this season.
Here at Market Check we’ve been investing signifcantly into our global research platform to benefit Australian growers. This research has also helped deliver another strong performance from the Strategic Pool, helping solidify our leading position within the industry. We hope you enjoy the read and gain some valuable information into the markets. As always, please feel free to call any of the Market Check team for a chat on grain markets, and all the best for the harvest this season.

C O N T E N T S
HARVEST ISSUE 2017 5
E D I T O R S
4 AUSTRALIAN GRAIN REVIEW
NEWS + VIEWS
08 Dusting off the Cash & Call strategy09 A season of ‘chalk & cheese’10 Major wheat exporter stocks tightening12 China leads growth in global feed grain demand13 Wheat returns for US farmers remain negative
AT THE FLOUR MILL
14 Market Check interviews Nick Ooi, PT Cerestar Flour Mills
16 Market Check interviews Jonathon Quek, Lilik Tanojo, Bungasari Flour Mills
14Cerestar interview with Nick Ooi
Inelasticity of export demand
FMPs & EPRs - ACCC’s inquiry into poor milk returns, shining light on grain EPRs
Mike Lee is the founder and Director of Green Square Agro Consulting providing agricultural business advice and support in the Black Sea region. Previously Mike managed and consulted for large-scale farming businesses in the Black Sea and has grown the major crops including wheat, barley, corn, soya and sunflowers.He currently operates an independent crop tour
Ben co-founded CRM AgriCommodities after realising the requirement from UK agribusinesses for bespoke, independent marketing advice and is now working with a broad range of agricultural businesses, providing them with market analysis and trading strategies. He holds MSc in Agricultural Economics from Toulouse School of Agriculture, France. He has an understanding of both global and practical farming having worked in the US and grown up on his family farm near Toulouse, where they grow a variety of crops including soybeans, sunflower and maize.
Nick is an integral member of the Market Check Pools team managing the domestic trading and execution program. He previously helped develop the Australian business for CHS Inc., the largest Co-op in the US. Nick assisted CHS in establishing a footprint in the Australian domestic market and successfully managed the CHS Pool, as well as the NSW/QLD domestic trading book. Nick has a Bachelor of Agricultural Economics from Sydney University and previous career experience with Agfarm and Meat & Livestock Australia in their Trade & Economic Services team.
Mike LeeAGRONOMIST & DIRECTOR, GREEN SQUARE AGRO CONSULTING
What is going on in Russia p33
Benjamin BodartDIRECTOR, CRM AGRICOMMODITIES
Question mark over EU wheat quality p09
Nick CrundallMANAGER – DOMESTIC MARKETS AND POOLS, MARKET CHECK
Wheat market enters uncharted territory p32
FEATURES18 Chinese agricultural policy
demand - Will Cripps
22 Inland rail: White elephant or game changer? - Andrew Freeth
26 Inelasticity of export demand - Richard Perkins
30 ACCC’s inquiry into poor milk returns, shining light on grain
EPRs - Lucy Knight
26
OPINIONS
32 Wheat market enters uncharted territory33 What is really going on in Russia?34 Domestic rationing of demand driving
wheat values35 Volatility is opportunity
MARKET UPDATES36 Wheat update 37 Barley update 38 Pulses update 39 Canola update
40 Innovative grain marketing
Chinese agricultural policy, demand and outlook
30
EditorRichard Perkins [email protected]
DesignElle McCalman | Anthony [email protected]@anthonyvdesign.com
Printing/DistributionFine Impressions
Australian Grain Review
Phone: 02 9499 4199Email: [email protected]: 02 9499 4188 Web: marketcheck.com.auMarket Check: Suite 5.01, Level 5, 9 Help Street Chatswood 2067PO Box 245, Gordon NSW 2072
Published by AgRisk Management Pty Ltd Financial Services Licence 223688, ABN 33 067 313 722. AgRisk Management is an independent, Australian-owned business that offers year-round grain marketing services to progressive Australian farmers. Our grower allied position and wealth of experience has ensured unwavering commitment to family and corporate grain producer clients for over 20 years. As a relationship-oriented business, long-term committed client partnerships are the core of our business.
Disclaimer: AgRisk Management advice is general in nature and has been prepared without taking into account clients’ individual objectives, financial situations and needs. Before acting on this advice, you should consider the appropriateness of the advice with regard to your own objectives, financial situation and needs. Before acquiring any financial products mentioned herein, please obtain a Product Disclosure Statement and consider it before making any decision about whether to acquire the product. The opinions expressed within are those of the authors and do not necessarily reflect AgRisk Management opinion or policy. No part of this magazine may be reproduced in whole or in part without the permission of the publisher. Advertising material and inserts should not be seen as AgRisk Management endorsement of products or services.
Andrew FreethDIRECTOR - DB FREETH & SONS, NUFFIELD SCHOLAR
Feature: Inland rail p22Andrew works on his family’s 5500-hectare dryland broadacre cropping and livestock enterprise at Collie, in Central-West New South Wales. He holds a Bachelor of Agricultural Economics with honours from the University of Sydney. A current Nuffield scholar & funded by GRDC, Andrew’s recently released report has unveiled a suite of recommendations for moving grain to market in an efficient, cost-effective manner, whilst considering future trends affecting the industry.
Will studied at the University of Sydney and holds a Bachelor of Agricultural Economics, during which he interned and gained valuable experience in brokerage and trading firms including Arrow Commodities, IKON and HSBC. Will has had further experience in global markets and trading of soft commodities. He is a senior client adviser and part of the pool management at Market Check, primarily focused on the management of the FX risk. He also forms part of Market Check’s global research platform analysing and developing relationships through the Asia Pacific region.
Will CrippsSENIOR COMMODITY ADVISER, MARKET CHECK
Feature: Chinese Ag policy p18
CONTRIBUTING EDITORS
HARVEST ISSUE 2017
AGRA U S T R A L I A N G R A I N R E V I EW
A season of ‘chalk and cheese’Domestic rationing driving wheat values
Poor MG milk returns shining light on grain EPRs
Hungry MarketsOffshore and domestic demand heats up
Photo by Steve Christo/Corbis via Getty Images
CONTENTS
service through Russia and Ukraine to gain insight on the condition and yield potential of the major commodity crops and writes the Agronomy-Ukraine blog.
18

6 AUSTRALIAN GRAIN REVIEW
A G R W E L C O M E
HARVEST ISSUE 2017 7
B R E T T ’ S W E L C O M E
KW1 APW1 AVG 2008-2016
PTA ASW1 AVG 2008-2016
PKE ASW1 AVG 2008-2016
Nov/Dec Cash
Jan/Apr Cash
May/Aug Cash
Hedge Harvest unwind Jan/Apr
Hedge Harvest unwind May/Aug
$270 $280 $290 $300
$220 $225 $230 $235 $245$240
$250
Nov/Dec Cash
Jan/Apr Cash
May/Aug Cash
Hedge Harvest unwind Jan/Apr
Hedge Harvest unwind May/Aug
$254 $250 $255 $260 $270$265 $275
Nov/Dec Cash
Jan/Apr Cash
May/Aug Cash
Hedge Harvest unwind Jan/Apr
Hedge Harvest unwind May/Aug
”
Proven grain marketing strategies with Brett Stevenson, Founder, Market Check
Since the deregulation of the domestic wheat market in 1989, market volatility has become a challenge for grain farmers. Deregulation of the Australian
Wheat Board export monopoly in March 2008 added to volatility in prices by exposing growers to both domestic and international market movements.
There have been 27 crops since domestic market deregulation, and there are clear trends in marketing approaches which need to be heeded. These are:• Higher than average prices at harvest are not
a market signal to sell all the crop at harvest. • Lower than average prices at harvest are not
a market signal to warehouse or store all the crop at harvest and wait for prices to rise. You might be saying, “hang on a minute, this
says I shouldn’t sell at harvest and I shouldn’t store grain because of the cost”. The answer is “yes”, this is generally correct. Three key reasons for adopting these approaches are cash flow needs at harvest; lack of education on relative values, hedging & basis; and lack of account for the forgone interest cost one could save on debt or receive on cash on deposit if storing grain post-harvest.
The correct mix of marketing options must be implemented each season to maximise returns. But to know which options to take, growers must continuously monitor regional and global supply and demand dynamics, and understand the
The correct mix of marketing options must be implemented each season to maximise returns
“
volatile markets
Adapting to relative pricing of grain to other places within Australia and to other grain-producing countries in the world. If these pricing signals are understood and growers have all the latest and relevant information at hand, they can decide the best mix of marketing options to implement. This extensive market research and collating of data to determine pricing signals is the primary reason more and more growers are outsourcing their grain marketing to companies like Market Check.
The marketing mix may include a combination of forward selling or hedging, harvest selling, holding flat price or hedged grain post-harvest, and incorporating options both pre-harvest and post-harvest. Going even further, understanding domestic supply and demand dynamics (and trading domestic grade/location spreads) will also help increase overall value of grain produced – but these strategies are harder to implement for individual growers. For example, stock can be swapped from one port zone that may have burdensome stocks, to another port zone that has tighter stocks and therefore greater upside in price potential post-harvest. Stock can also be switched between grades selling premium grades, and replaced with more “undervalued” grades that have greater upside potential post-harvest – ASW1, for example.
This is what the Market Check Strategic Pool does and is why the Strategic Pool has, on average, outperformed both selling at harvest and warehousing/storing grain over the six years it has been operating. The underlying hedging strategy has proven itself long term, but the Market Check team runs the pool as a national collaborative program offering participants access to arbitrage opportunities within and between different states, port zones and grades.
Market Check’s Strategic Pool is one of Australia’s largest and most consistently performing programs that offers access to a national post-harvest hedging strategy. Market Check’s Cash and Call Pool also benefits growers in a market where flat prices and basis levels are high. The program gives growers the benefit of price certainty and reduced carry costs through immediate physical grain sales, plus the opportunity to participate in future upside price movements through a Call Options strategy. Since deregulation, we have been developing and implementing these strategies in our managed programs to help maximise returns from grain marketing.
N E W S + V I E W S
8 AUSTRALIAN GRAIN REVIEW
N E W S + V I E W S
HARVEST ISSUE 2017 9
news
Variable weather conditions across Australia presented some significant challenges for the 2017 winter cereal crop.
It’s been a “chalk and cheese” season at the regional level, with the northern cropping areas experiencing the challenges, while most of Victoria is on track for near-average to above-average yields after good winter rainfall.
Winter crop production through Queensland and northern New South Wales is expected to be the smallest in at least a decade. Many crops were planted on marginal moisture and never got fully established with the limited winter rainfall.
The Geraldton zone – Western Australia’s northern-most winter cropping area – suffered a similar fate, with many farmers writing off crops with the dry season. Late rain will allow some farmers in the Geraldton zone to salvage some crops, but the region is expected to see its smallest harvest in several seasons.
Conversely, most of Australia’s southern cropping areas are on track for a reasonable harvest, with potentially above-average yields with a soft spring. Victoria is on track for an above-average season following a timely break to the season and a favourable winter.
Good late winter rain through most of South Australia and Western Australia’s southern cropping areas has boosted crop conditions, with many farmers saying they are already assured of average to above-average yields.
The combination of a substantially smaller than normal Queensland and northern New South Wales grain harvest, with the large domestic feed grain consumption in Southern Queensland and northern New South Wales, has already pushed northern grain prices sharply higher as buyers seek coverage.
Stock feed wheat into the feed grain demand-intensive Darling Downs jumped by $100/t in May and June to around $350/t as it became apparent the northern
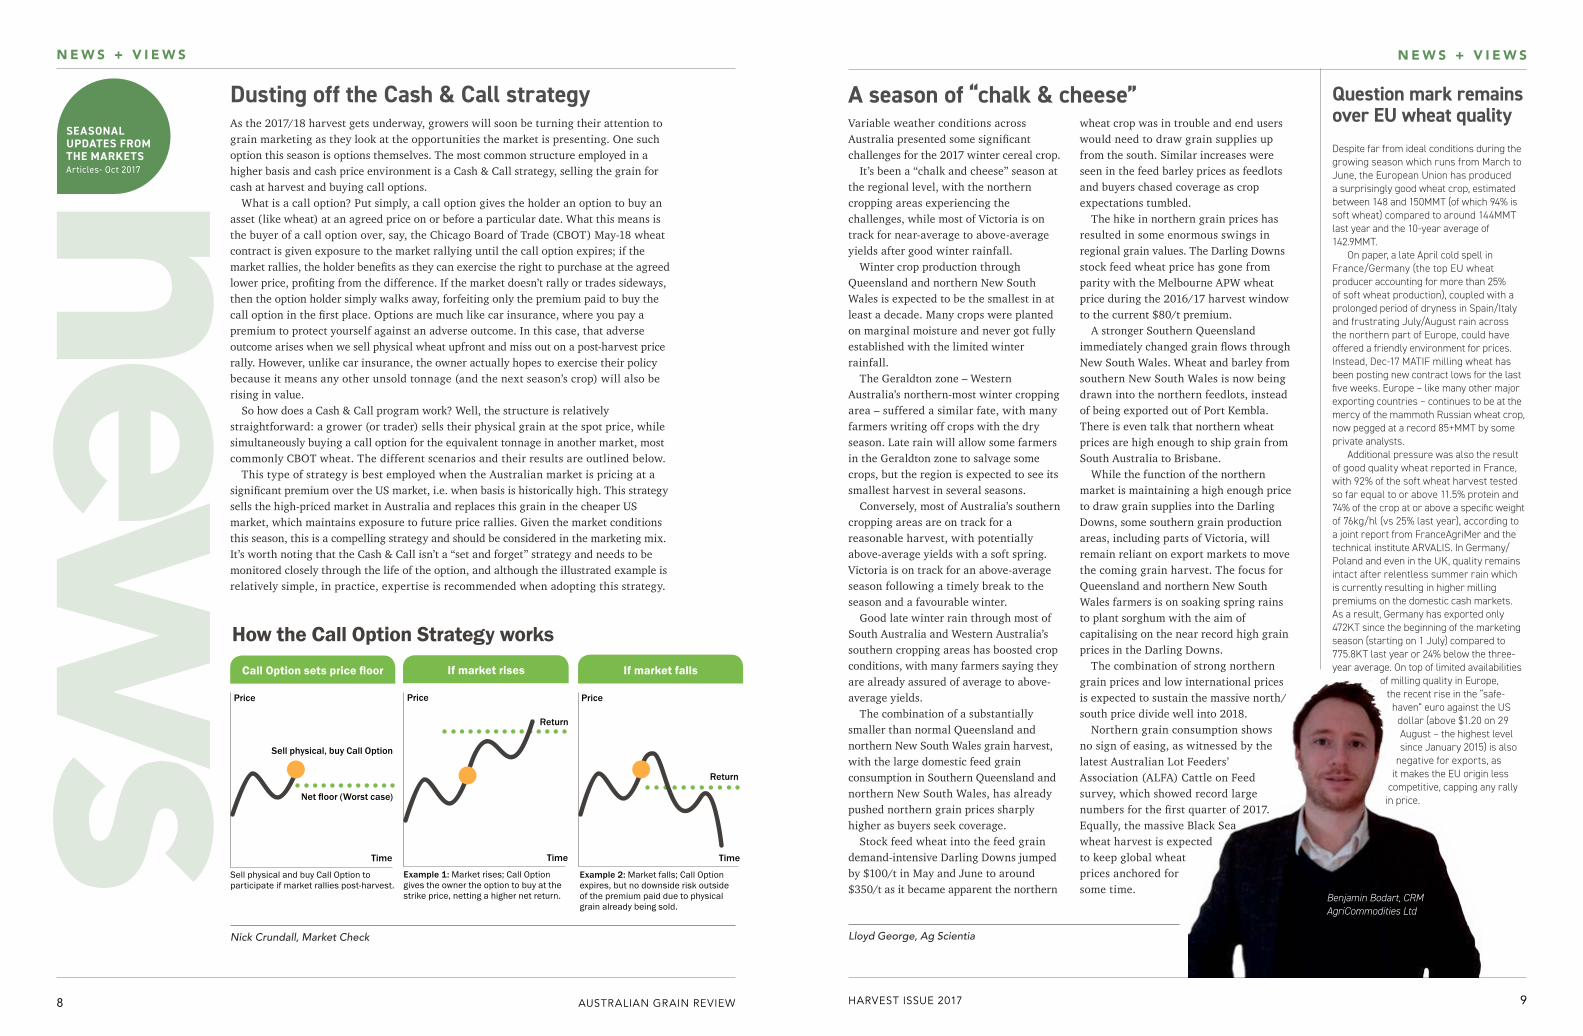
As the 2017/18 harvest gets underway, growers will soon be turning their attention to grain marketing as they look at the opportunities the market is presenting. One such option this season is options themselves. The most common structure employed in a higher basis and cash price environment is a Cash & Call strategy, selling the grain for cash at harvest and buying call options.
What is a call option? Put simply, a call option gives the holder an option to buy an asset (like wheat) at an agreed price on or before a particular date. What this means is the buyer of a call option over, say, the Chicago Board of Trade (CBOT) May-18 wheat contract is given exposure to the market rallying until the call option expires; if the market rallies, the holder benefits as they can exercise the right to purchase at the agreed lower price, profiting from the difference. If the market doesn’t rally or trades sideways, then the option holder simply walks away, forfeiting only the premium paid to buy the call option in the first place. Options are much like car insurance, where you pay a premium to protect yourself against an adverse outcome. In this case, that adverse outcome arises when we sell physical wheat upfront and miss out on a post-harvest price rally. However, unlike car insurance, the owner actually hopes to exercise their policy because it means any other unsold tonnage (and the next season’s crop) will also be rising in value.
So how does a Cash & Call program work? Well, the structure is relatively straightforward: a grower (or trader) sells their physical grain at the spot price, while simultaneously buying a call option for the equivalent tonnage in another market, most commonly CBOT wheat. The different scenarios and their results are outlined below.
This type of strategy is best employed when the Australian market is pricing at a significant premium over the US market, i.e. when basis is historically high. This strategy sells the high-priced market in Australia and replaces this grain in the cheaper US market, which maintains exposure to future price rallies. Given the market conditions this season, this is a compelling strategy and should be considered in the marketing mix. It’s worth noting that the Cash & Call isn’t a “set and forget” strategy and needs to be monitored closely through the life of the option, and although the illustrated example is relatively simple, in practice, expertise is recommended when adopting this strategy.
Lloyd George, Ag ScientiaNick Crundall, Market Check
Question mark remains over EU wheat qualityDespite far from ideal conditions during the growing season which runs from March to June, the European Union has produced a surprisingly good wheat crop, estimated between 148 and 150MMT (of which 94% is soft wheat) compared to around 144MMT last year and the 10-year average of 142.9MMT.
On paper, a late April cold spell in France/Germany (the top EU wheat producer accounting for more than 25% of soft wheat production), coupled with a prolonged period of dryness in Spain/Italy and frustrating July/August rain across the northern part of Europe, could have offered a friendly environment for prices. Instead, Dec-17 MATIF milling wheat has been posting new contract lows for the last five weeks. Europe – like many other major exporting countries – continues to be at the mercy of the mammoth Russian wheat crop, now pegged at a record 85+MMT by some private analysts.
Additional pressure was also the result of good quality wheat reported in France, with 92% of the soft wheat harvest tested so far equal to or above 11.5% protein and 74% of the crop at or above a specific weight of 76kg/hl (vs 25% last year), according to a joint report from FranceAgriMer and the technical institute ARVALIS. In Germany/Poland and even in the UK, quality remains intact after relentless summer rain which is currently resulting in higher milling premiums on the domestic cash markets. As a result, Germany has exported only 472KT since the beginning of the marketing season (starting on 1 July) compared to 775.8KT last year or 24% below the three-year average. On top of limited availabilities
of milling quality in Europe, the recent rise in the “safe-haven” euro against the US dollar (above $1.20 on 29 August – the highest level since January 2015) is also
negative for exports, as it makes the EU origin less
competitive, capping any rally in price.
A season of “chalk & cheese”SEASONAL UPDATES FROM THE MARKETSArticles- Oct 2017
Dusting off the Cash & Call strategywheat crop was in trouble and end users would need to draw grain supplies up from the south. Similar increases were seen in the feed barley prices as feedlots and buyers chased coverage as crop expectations tumbled.
The hike in northern grain prices has resulted in some enormous swings in regional grain values. The Darling Downs stock feed wheat price has gone from parity with the Melbourne APW wheat price during the 2016/17 harvest window to the current $80/t premium.
A stronger Southern Queensland immediately changed grain flows through New South Wales. Wheat and barley from southern New South Wales is now being drawn into the northern feedlots, instead of being exported out of Port Kembla. There is even talk that northern wheat prices are high enough to ship grain from South Australia to Brisbane.
While the function of the northern market is maintaining a high enough price to draw grain supplies into the Darling Downs, some southern grain production areas, including parts of Victoria, will remain reliant on export markets to move the coming grain harvest. The focus for Queensland and northern New South Wales farmers is on soaking spring rains to plant sorghum with the aim of capitalising on the near record high grain prices in the Darling Downs.
The combination of strong northern grain prices and low international prices is expected to sustain the massive north/south price divide well into 2018.
Northern grain consumption shows no sign of easing, as witnessed by the latest Australian Lot Feeders’ Association (ALFA) Cattle on Feed survey, which showed record large numbers for the first quarter of 2017. Equally, the massive Black Sea wheat harvest is expected to keep global wheat prices anchored for some time.
How the Call Option Strategy works
Return
Price
Time
If market rises
Sell physical, buy Call Option
Price
Time
Net floor (Worst case)
Call Option sets price floor
Sell physical and buy Call Option to participate if market rallies post-harvest.
Example 1: Market rises; Call Option gives the owner the option to buy at the strike price, netting a higher net return.
Return
Price
Time
If market falls
Example 2: Market falls; Call Option expires, but no downside risk outside of the premium paid due to physical grain already being sold.
Benjamin Bodart, CRM AgriCommodities Ltd

N E W S + V I E W S
10 AUSTRALIAN GRAIN REVIEW
N E W S + V I E W S
HARVEST ISSUE 2017 11
Major wheat exporter stocks tighteningEver since the USDA started reporting supply and demand estimates for the coming season, a lot has been made of the fact that global wheat stocks are set to increase yet again in 2017/18. However, those with a bullish view of the market have been quick to point out that the bulk of this increase will occur in China, meaning these additional stockpiles will not be available to the rest of the world and should therefore be disregarded when analysing the outlook for prices. Wheat stocks globally are expected to increase 11.5MMT, which is propped up by a massive 16.2MMT stock build in China. When you look at ending stocks in major exporting countries, which eliminates Chinese stocks, we are set to see a decline this season (see chart).
During the sharp but short-lived late May rally in CBOT wheat futures, this story gained plenty of airtime as part of the reason for the newfound optimism (along with the main story being drought in the US northern plains). Since then it has taken a back seat after subsequent USDA reports significantly increased the size of Russian and Ukrainian crops, and therefore the size of their
carry-over stocks. This brought about a fresh wave of bearishness in global wheat trade, quickly erasing all of the price increases observed earlier in the year.
So, where does this leave us? The fact remains that we are going to see wheat stocks in major exporting nations decline from last year’s levels, but not by as much as first thought. It does lend itself to the idea that wheat may have established a long-term bottom in prices around 380-400USc/bushel, with the growth in Chinese stocks unlikely to carry sufficient weight to pressure the market further down. But whether it can help trigger a sustained rally is another story altogether. The persistence of relatively comfortable supplies has kept managed money funds on the sell side, consumers buying hand to mouth, spot prices low, and futures carry strong.
While the decline in the availability of wheat in major exporting nations is a step in the right direction
for those who want to see higher wheat prices, my view is that it adds to the kindling but doesn’t provide the spark. We will still need to see additional disruptions to supply in some of these nations before a lasting global rally can be achieved. As it stands, most of the production risk north of the equator is behind us for another year, with lingering crop uncertainty in Australia the main concern from a supply perspective. The market has shown that we have not cut export supplies by enough to cause a serious headache for consumers. Not yet, anyway.
Tim Phelps, Market Check
As the Black Sea continues to grab headlines for their rapid increase in grain production, South America has been following suit with some eye-watering production gains in corn and soybeans. As illustrated in Chart 1, combined production has grown from 127.5Mt in 2000 to 315Mt in 2017. More recently, production increased by a massive 62Mt from 2015 to 2016!
From an export point of view, South America now plays a key role in global markets, as they look to funnel their exportable surplus to customers who once relied on other origins, i.e. displacing US soybeans into China.On the other hand, wheat production has been largely stagnant due to the more compelling
corn and soybean gross margins. However, if we dig a little deeper, important patterns emerge that need to be taken into consideration. As Australia tries to defend its market share in South East Asia from the Black Sea, a close eye needs to be kept on South America to maintain our relevance in the export market. For example, Argentina is the only major wheat
exporter in South America, increasing their exports 42% in four years. Within these numbers, exports to Asia (Australia’s core export destination) have jumped from 170,000t in FY2012/13 to 2.57Mt in FY2016/17. The beneficiaries of this have been Vietnam, Thailand and Bangladesh – all existing Australian grain customers. Fortunately for Australia, the South American up-country supply chain is relatively primitive – with the majority of movements still heavily
reliant on inefficient road freight networks that have been largely neglected. However, this won’t remain the case as capital flows into the Argentinian supply chain to move product more efficiently from paddock to port.
The scenario is similar to the Black Sea this season, where the only real cap on their exports is the limited supply chain capacity. For instance, Ukraine’s aggregate port capacity is expected to jump by nearly 100Mt in the next three years, involving 36 new port facilities.The trend of South America becoming more aggressive into Australia’s core markets is unlikely to stop, as their production increases and their exportable surplus swells. Therefore, with grain moving into the export market more efficiently and production continuing to increase, Australia will need to become more efficient in terms of production and supply chain to compete.
Nick Crundall, Market Check
Domestic drawing arcsFollowing a bumper 2016/17 season, the upcoming harvest is unfortunately looking to be the smallest in a decade. Even the best-established regions across Victoria and southern NSW (SNSW), who were looking at above-average yields during winter, have struggled through a historically cold and dry August/September period. The plenteous season last year resulted in domestic trade flows sending stocks towards their natural port terminal or into nearby markets. However, in seasons where a particular demand zone i.e. the Darling Downs in Queensland (QLD) is short on local production to satisfy demand, we see a reversal in these typical trade flows. When this occurs, we analyse what’s called “drawing arcs” to identify where and how much grain is being drawn into a certain demand centre.
Across Queensland and NSW, wheat production is forecast to decrease approximately 7.8Mt year-on-year, which leaves us with roughly 4.8Mt to satisfy domestic demand in these regions. Therefore, the function of the 2017/18 market will be to draw stocks into these northern markets, especially in QLD which requires just shy of 2Mt, but will produce only 750K. Feedlots make up the primary
contributor to this demand, with NSW and QLD comprising roughly 85-90% of national cattle feed grain consumption. For total feed consumption by poultry, pigs, cattle and dairy, these two states account for 63% of the 2016/17 feed demand for the east coast and SA.
This has already had its impact on markets, which is illustrated by comparing Figure 1 and Figure 2. Figure 1 shows the drawing arc of early 2017 following the record harvest in QLD and NNSW. Sufficient local production satisfied northern demand and therefore only pulled from NNSW, which is representative of a season with typical trade flows. In Figure 2, which is indicative of the general drawing arc we have seen in 2017/18 pricing to date, we see the north is having to reach down into Victoria to satisfy demand, a stark contrast to 12 months ago. For grain being pulled this far, we need to look back to 2013/14 when F1 barley was sent by ship from Thevenard to Brisbane. This is no small feat, as executing bulk ships interstate requires pulling a carrier off its usual route and reversing typical operations for the receiving port. This incurs additional charges, and freight rates come at relative premiums versus standard
destinations like South East Asia.
With the price spread between the QLD and South Australian market undulating around $85-$100/t, this scenario is again looking likely. Growers should be familiarising themselves now regarding long haul freight rates from southern
origins which would typically find local homes or head south to Melbourne/Geelong for export.
With all this said, northern markets won’t be able to support the entire east coast crop, meaning the residual will need to find export demand. As of mid October, Australia’s cheapest grain is priced out of SA, however values here are still US$20-$30/t above the cheapest options delivered into South East Asia, so this story is still one to play out.
Andrew Retallick, Market Check
Price hedging tools for Australian grain and oilseeds in recent years have been restricted to the ASX, but in recent months, a new player in the Agricultural Derivatives landscape has emerged. The Financial and Energy Exchange (FEX) Group, based in Sydney, has recently gained its full Australian Market Licence from ASIC, allowing it to create and offer new derivatives which will trade on its licensed OTC platform. The FEX Group wholly owns the Riemann Ag OTC products, which include the recently launched NSW Track Wheat OTC Forwards. These new contracts are based on the NSW Track wheat contract and are an electronically traded and multi-brokered market. They are cash settled daily via a centralised liquidity pool with options to deliver both AH2 and ASW1 outside of the APW1 base grade.
This OTC provides another unique and innovative marketing tool for industry as the product brings market liquidity and visibility. The NSW contract is the first listed product of a pipeline of products to come, with the goal being to design and launch a wheat contract for every producing state, allowing farmers and other trade participants better localised hedging tools. In addition, we are working new contracts for canola and barley which we hope to launch in 2018.
Pat Cogswell, SA Markets
Alternate hedging tools for Australian farmers
Cattle on Feed (consumption)
NSW
0
1
2.0
0.20
1
2
3
0.5
1.5
2.5
3.5
1.21.41.61.8
0.40.60.8
Stat
e Co
ns (M
t)
2010
/11
2011
/12
2012
/13
2013
/14
2014
/15
2015
/16
2016
/17
2017
/18
Tota
l Con
s (M
t)
VIC SAQLD WA Aus
Figure 1: Downs drawing from NNSW early 2017.
Figure 2: Downs drawing from NW VIC/NSW September 2017
South America says “hold my beer” to Russian production dominance
Corn/Soybean Production
- -
50,000 20,000
40,000
60,000
80,000
100,000
120,000
140,000
160,000
180,000
100,000
150,000
250,000
350,000
300,000
200,000
Corn Soybeans Exports
2000
2001
2002
2003
2004
2005
2006
2007
2008
2009
2010
2011
2012
2013
2014
2015
2016
2017
Argentinian wheat
- -
2,0002,000
4,000
6,000
8,000
10,000
12,000
14,000
16,000
18,000
20,000
4,000
6,000
8,000
10,000
12,000
14,000
2013 2014 2015 2016 2017
Production Exports
Wheat: Global stocks-to-use
10%
20%
30%
40%
50%
60%
70%
20012000
20022003
20042005
20062007
20082009
20102011
20122013
20142015
20162017
Major exporter stocks % of global import demand
Total global stocks % of global consumption

N E W S + V I E W S
12 AUSTRALIAN GRAIN REVIEW
N E W S + V I E W S
HARVEST ISSUE 2017 13
-
200,000
Total Supply Total Use Exports Stocks-to-use
400,000
600,000
800,000
1,000,000
1,200,000
1,400,000
1,600,000
1,800,000
0%
5%
10%
15%
20%
25%
30%
‘000
met
ric to
nnes
2000
2001
2002
2003
2004
2005
2006
2007
2008
2009
2010
2011
2012
2013
2014
2015
2016
2017
China leads growth in global feed grain demandWorld feed grain consumption is expected to increase for the 15th consecutive year led by increases in China, Iran and Vietnam this season. USDA feed grain consumption estimates for the 2017 season, which include corn, barley, sorghum, oats and rye, are forecast to increase a little over 19 million tonnes to 1.298 billion tonnes, of which China makes up 4.3 million tonnes. Conversely, supply will decrease due to lower production, which will lead to the tightest global feed grain stocks-to-use ratio since 2012. Global corn consumption is forecast to lead the way with an increase of 25.9 million tonnes, of which 6 million tonnes will be from China alone. Barley and sorghum is forecast to decrease by a combined 6.8 million tonnes due to Chinese government policy favouring domestic corn inclusion and cheaper global alternatives. But these estimates are price dependent, as was proven last season when Chinese import demand for barley and sorghum increased above estimates due to cheaper prices.
Even in the face of a crackdown by the Chinese government during 2017 on polluting feed grain enterprises, feed grain sales are expected to continue to grow next year. JCI China reported that feed sales in the first half of 2017 decreased by 0.9% on the previous year in China due to the environmental protection crackdown. According to the Chinese Ministry of Agriculture, falling poultry feed sales were offset by feed sales growth in the pork and aquaculture industries. A positive for alternative feed grains such as Australian barley and US Sorghum is that if the price relationship is favourable, the pork industry will switch from local corn. Another positive is that demand for Australian barley from the aquaculture industry remains strong, although only for the months between July and September. The combination of growth in feed grain consumption led by China and falling production should help clear the way for some support in global feed grain prices next season.
The post harvest market for lentils has been tough, with cash prices dropping from the pre-harvest highs of over $1000/t down to $650/t at harvest and then dropping further in the post-harvest market as the record 2016/17 crops in Australia and Canada hit the markets. 2017 crop shapes up to be another tough marketing environment, with strong competition from Canadian lentils expected to continue and the prospects of increased production of lentils in India also weighing on the market.
The latest Pulse Australia crop report pegged 2017/18 planted hectares increasing by 25% to 398,300 ha, with the biggest increase coming from Victoria where growers have moved across to lentils from other underperforming pulses and grains like faba beans and barley. Even with an increase in planted hectares, production is expected to be down 35% this season, as such was the size of the yields last harvest due to the near perfect growing conditions.
Malt barley premiums expected to firmIn an average year, malt barley “strike” is around 30% of Australia’s total barley production. With ABARES pegging production at around 8MMT for 2017/18, this would mean malt production of around 2.4MMT. Last year, across the east coast we saw malt premiums for varieties such as La-Trobe, Gardener and Scope peak at approximately $35/t above feed barley at harvest. Port prices ranged from $210 to $225/t at the peak of harvest time through the Victorian and NSW port zones. This coming season we expect to see malt barley maintain its premium over feed at harvest, a favourable price outlook considering feed prices are significantly higher than 2016/17. In 2014/15 we saw a similar market structure of tight domestic stocks drawing north for feed, however, the malt premium was $35/t at harvest and held its own post-harvest. This gives us a good insight into potential price action next year. Also, this season, two new malt barley varieties are seeking malt accreditation – Spartacus and Compass. While Compass barley has been grown as feed since 2015, it’s now in its second stage of accreditation alongside Spartacus and is set to hit the market in early 2018.
Internationally, we have seen Canada – Australia’s closest competitor in the malt space – also have its barley crops downgraded due to unfavourably hot weather in key growing regions. The International Grains Council (IGC) in their latest monthly report estimated that Canadian barley production will be down by at least 20% this season. IGC also pegged Australian barley production down by 42%, which is in line with local market estimates. Both nations export malt barley into the growing East Asian brewing markets, namely China. China’s rapidly increasing disposable income and growing population should see strong demand for malt barley in the future. Focusing on the short-term, though, strong Chinese demand coupled with diminishing supply will likely result in supported premiums for malt barley as we move into harvest.
Nick Weal, Market Check
Richard Perkins, Market Check
While the US winter wheat harvest is all but done, US producers in hard red winter wheat country are gearing up for another sowing season. Seeding equipment hit the fields in mid-September, with the campaign usually stretching into the end of October. With that in mind, I thought it would be worthwhile to look at what kind of profitability US wheat farmers are facing in relation to other crops as they get ready to fill the drill. Earlier in the northern hemisphere summer, when wheat prices rallied to calendar year highs, it looked like winter wheat acres would climb 10-15% after dropping to the lowest levels since 1909. Unfortunately, the recent selloff has put an increase in winter wheat acres very much in doubt.
Using Kansas State University cost of production figures with updated new crop cash prices, we can get a sense of the financial decision the growers are having to make. For a wheat/fallow farmer in south west Kansas, they are currently starting at around a US$4.03/bu cash price for July 2018 using similar basis levels experienced this past harvest. With an average yield of around 42 bushels per acre (bpa), gross revenue would be seen around US$169.26/ac. Kansas State estimates the cost of production for the
average grower including rent, seed, fertiliser, chemicals, insurance, labour and equipment being in the neighbourhood of US$234.97/ac. This would result in a negative return above direct expenses of around -US$31.71/ac (-A$98/ha) and a total loss of -US$65.71/ac (-A$203/ha). It should be pointed out that this estimate does not account for a producer owning the ground or equipment, which could be fully depreciated out and paid off – obviously that calculation would look a bit different. Nonetheless, this still allows us to take a look at wheat in comparison to other crops. For a producer in the better-yielding areas of south central Kansas where average yields are closer to 52bpa, the grower would be looking at a positive return of US$11.39/ac above direct expenses, but still a negative return of -US$34.61 when rent is factored in. When corn is examined, we see a net return of $40.77/ac before rent and -US$5.23/ac after rent. Soybeans would be US$44.96/ac to the good before rent and -US$1.04/ac after, while sorghum is seen at US$70.92/ac positive before rent and US$24.92 positive after rent.
As one can plainly see, wheat is the loss leader again this year as we step up to the starting blocks of another growing season. Unless we see a material rebound in price, it
would not appear winter wheat acres will see much, if any, increase over year-ago intentions. Another factor to consider would be fall weather, which might allow or prevent a producer from harvesting a row crop and turning around and planting winter wheat. As of the USDA crop progress report on 21 August, 40% of the Kansas corn crop was dented versus 46% on the five-year average. Despite production issues in the US Northern Plains, drought in the southern Canadian Prairies, a massive year-on-year drop in Australian production, and rain-reduced quality and yield in Germany, the world wheat balance sheet is still expected to see carryout rise by 7MMT over last year. At the current estimate of 265MMT it would be the largest outright carryout on record, while the stocks-to-use ratio of 35.9% would be the highest since 2000/01. This is due in large part to the mammoth crops in the Black Sea, which seem to get bigger with every estimate. With Russia looking to claim the top exporter spot for the second year in a row, traders and producers are realising how important this region is to price discovery.
Tregg Cronin, Halo Commodities
Wheat returns for US farmers remain negative
Lentils 2017
South Australian crop outlook
42%Australian barley production down by
For the whole Eyre Peninsula region, all the traditional rules of thumb around a typical season were thrown out the window this year. After exceptional summer rains capped off the region’s biggest production year on record, the tap was virtually turned off in key growing regions, including the traditional high rainfall zone of the Lower Eyre Peninsula (EP). Much of the EP didn’t receive breaking rains until late June/early July, with parts receiving no rain for the entire May/June period.Early planted crops in areas that did manage to jag April breaking rains struggled with the extended
dry period, with significant canola acreage having to be abandoned. The late break also meant that many growers planted a reduced cropping program, with
some growers in the Streaky Bay region not planting at all, for the second time in three years. Reasonable rains through the back end of the growing period have ensured that (at the time of writing) the EP is likely to have an ‘average’ season, a relief to many particularly because of such a shaky start. Despite this, the trade is estimating that even if the finish is kind, the region
will only produce 40-45% of what it did last year.
Tess Walch, Free Eyre
Our biggest export competitor, Canada, estimated their lentil production at 2.29 mn MT against 3.248 mn MT last year; this is 29.5% down YOY. But season-ending stocks from the record crop last year are pegged at 405,000 MT, leading to a total expected supply of 2.71 mn MT – well down on last year and forcing a reduction in exports this season.
Looking across at the sub-continent, India Kharif Urad (green/black gram) 2017/18 production is estimated at 24.97 lakh tonnes (2.497 mn MT), up 100,000 MT YOY, with the Indian government imposing import restrictions on black/green gram and pigeon peas and allowing exports of pigeon peas, black matpe and green mung to support local growers. There could be a possibility the Indian government will allow exports of lentils due to higher availability and availability of imports from various origins like Australia and Canada. This could open up marketing opportunities late this year or early
next year if the rabi crop lentil planting is above average and in good condition.
Ben McClusky, Market Check
Lentil crop in South Australia (photo: Tess Walch, Free Eyre)

G R A I N C H AT
14
G R A I N C H AT
15
AT THE FLOUR MILL Nick OoiGroup Divisional Manager, Procurement & TradeMarket Check catches up with Nick Ooi, from PT Cerestar Flour Mills, Indonesia
me to my current boss. Because I was already exposed to the grain business, albeit chicken poultry integration, the machines inside a feed mill are quite similar to a flour mill. Summing it up, from being a tyre executive to a chicken executive and then a plastic executive and finally a flour executive, I believe positive karma has been on my side.
Could you tell us a little about Cerestar’s role in Indonesia?
Indonesia is a country with a population close to 300 million. This is often described as a demographic bonus for the flour and chicken industries. Indonesians love their rice, but in the longer term the significance of rice will decline in favour of wheat flour. Rice is actually quite boring as there is nothing much in it except starch. Although not a single grain of wheat is grown in Indonesia, the people love noodles from flour, and of course, biscuits and bread. Indonesia is on track to be the biggest wheat importer, and I think for 2017, Indonesia could well import 11MMT and become quite close to overtaking Egypt as the world’s largest importer of raw wheat. Cerestar Group is bang in the middle of this exciting growth.
What volumes of wheat on average are you using, and do you see this increasing in the future?Our Group is now importing 1.0MMT of wheat for our flour needs. Australia accounts for almost 50% of this volume. On average, we do see approximately 5% compound annual growth for the local flour industry. The annual per capita consumption is still very low at 21-23kg, depending on the denominator that one uses for population.
Tell us a bit about the Cerestar Group?We commissioned our single flour mill about eight years ago in December 2009 and named it PT Cerestar Flour Mills. The “Ceres” stands for the Roman goddess of grain. If you look at our logo it has five wheat sheaves, perhaps standing for five milling lines? Right now, CFM has four lines, three of which are in the Cilegon plant and one in the Medan plant. Over in Gresik we have set up another company – PT Harvestar Flour Mill – with two lines. So our Group now has a total installed milling capacity of 3,000mt per day. Potentially, this would translate into 60,000mt of flour per month or almost 1.0MMT of milling wheat per annum.
What is your role within Cerestar?
My role is basically in procurement of wheat, packing materials, fortificant, and spares and equipment to fit a modern flour mill manufacturing plant. I had a multifaceted role in the early years because I came from an accounting background trained as a qualified ACA from the ICAEW. I was already an FCA with over 25 years’ manufacturing and costing experience behind me; I also took on the commercial role to develop the flour export market for CFM. We managed to penetrate and establish our brand in South Korea, Thailand, Singapore, PNG and the Philippines. Today, I have relinquished everything to others who are more capable than me and now I just focus on the simple task of buying.
Where are you originally from and how did you get into the flour milling business?I am a Malaysian expatriate. I used to work in Colombo, Sri Lanka, as a chicken executive for Prima Limited. Somehow, through determination and grit, I managed to stick around Colombo for 16+ years in the midst of their full-blown civil war. When I returned to Malaysia I joined a packaging factory producing anti-static carrier-tape (like chocolate boxes) for assembly plants to put their chips inside. This factory was the second-biggest player globally. I carried the title of Finance Director, but in actuality there was not much in it as the bosses were all Singaporeans and it was very much a maintenance and upkeep job – not so much my cup of tea. An angel appeared one day and introduced
How large a role does Australian wheat play in your operations?
Aussie wheat is basically hard white wheat, as opposed to red wheat from the Black Sea. The Indonesian market needs it for its natural white colour and brightness, especially for the wet noodles segment. For our Group we estimate we need about 25% for our requirements. For the rest, if Aussie wheat prices remain high like now, we can easily substitute with other origins.
Black Sea wheat trade into SE Asia has grown significantly in recent years. Do you see this trend continuing and why?
The largest segment is really general purpose flour. Indonesians use this for “gorengan” (frying
purposes) and blending for home-made noodles and cakes. Black Sea wheat being
cheap, presently US$35-$40/mt spread between 11.5% Black Sea and 10.5%
APW, has compelled every plant to switch as we are in such a
competitive price-driven market. There is not much margin to be
made in flour milling, so every cent saved is a cent earned
for our companies. It is clear that Russian
farmers are eating into the lunch of Aussie
farmers.
Interview conducted October 2017.

G R A I N C H AT
17
G R A I N C H AT
16
What are your roles within Bungasari?
Mr Jon Quek: I am involved in wheat procurement and margin management.
Ms Lilik Tanojo: I am involved in procurement and supply chain operations.
Where are you originally from and how did you get into the flour milling business?Mr Jon Quek: I’m from Singapore and was a wheat trader in Cargill prior to joining Bungasari Flour Mills. I eventually decided to move downstream to expand my knowledge about the wheat industry.
Ms Lilik Tanojo: I’m Indonesian and have been working for 11 years in procurement and supply chain operations, with the last 8 years being in the flour milling industry. One of the directors at Lumbung National Flour Mill was double-hatting in the petrochemical industry and invited me to join the flour industry. As the petrochemical industry in Indonesia has been stagnant for many years, I was eager to move to the food industry which has robust growth.
AT THE FLOUR MILL
Jonathan Quek
Lilik Tanojo
Commercial General Manager
Procurement Deputy GM
Market Check catches up with Mr Jonathan Quek and Ms Lilik Tanojo from Bungasari Flour Mills
What volumes of wheat on average are you using, and do you see this increasing in the future and why?
Mr Jon Quek: BFM has been running at full capacity, milling 400,000mt of wheat annually. As we’ve reached capacity, there is limited room for our volume to increase.
Ms Lilik Tanojo: With 100% full utilisation, the only way to increase our wheat consumption would be by expanding our manufacturing capability.
How large a role does Australian wheat play in your operations?
Mr Jon Quek: Australian wheat was an integral part of our operations, but over the years that has diminished as other origins have caught up in terms of quality, hence hastening the commoditisation of the market. Having said that, although diminished, Australian wheat still holds a differentiating factor. Whether the market will eliminate this factor eventually, or we’ve reached the bottom or there’ll be an increase in the differentiating factor, remains to be seen. It greatly depends on the origin’s wheat research efforts, pricing, and the ever-changing tastes of consumers.
Ms Lilik Tanojo: Australia has a quality and geographical advantage over other origins. A certain amount of application is still not able to be replaced. However, other origins have seen significant improvements in supply chain management and wheat quality. Indonesian millers have been able to switch a significant amount of Australian wheat with other origins.
Black Sea wheat trade into SE Asia has grown significantly in recent years. Do you see this trend continuing and why?
Mr Jon Quek: It’s hard to put a finger on it but I think the trend should continue, although we may see consumers reaching the limits of switching in the next three to five years. As mentioned, it depends on the pace of the origin’s research (quality improvements), price spreads and the tastebuds of consumers.
Ms Lilik Tanojo: I agree with Jon’s opinion.
Interview conducted October 2017.
Could you tell us a little about Bungasari’s role in Indonesia/SE Asia??Mr Jon Quek: BFM is a relatively new startup, with three shareholders providing strong support and synergy. We believe in our ability to leverage this synergy and create value for our customers in Indonesia and SE Asia.
Ms Lilik Tanojo: Bungasari is a company with strong shareholders and the synergy has enabled this company to enter the local flour market and position itself as a prospective flour manufacturer.

C O V E R S T O R Y
18 AUSTRALIAN GRAIN REVIEW
C O V E R S T O R Y
HARVEST ISSUE 2017 19
A s China is a major importer of Australian grains, it is important to understand current Chinese agricultural policies and how subsequent changes may affect supply and demand internally and also from an Australian
export perspective.
The focus of this article will be primarily on Chinese agricultural policy specific to corn and wheat.
Until recently, a focus of Chinese agricultural policies was
increasing domestic support for farmers through price support
mechanisms, direct payments, better seeds and machinery
purchases, with the aim to raise farmer income levels and ensure
long-term food security. China’s production of agricultural
commodities such as wheat and corn increased in response to
these supportive government policies. Wheat ending stocks and
stocks-to-use have increased substantially since 2012; corn is
similar, although stocks have decreased slightly from a more
recent shift in policy.
Chinese agricultural policy, demand and outlook, explained by Market Check’s Will Cripps
These policies have been effective in achieving the government’s
goals of ensuring food security and supporting farmer incomes,
although price supports have had unintended consequences and
deleterious effects on the Chinese agricultural sector. Producers
selling to state enterprises at a minimum price above international
markets have caused a growing gap between domestic and
international prices across commodity markets. For example, the
minimum wheat price in China for 2017 was set at 2360 yuan/
tonne or AUD435/tonne. With internal prices being higher than
international prices, this has caused domestic consumers to import
their requirements from relatively cheaper export destinations.
Higher levels of imports combined with increased production from
government subsidies have caused oversupply and a general glut in
Chinese corn and wheat markets.
The argument that can be made regarding subsidies is that they
can lead to oversupply if they are not structured in a way that
promotes long-term efficiency of that industry. An effective subsidy
can be targeted to solve a specific problem in the short term and
should not serve as a continual backstop for producers over the long term. The problem with China’s price support for producers
is that the incentive structure expectedly leads producers to
primarily focus on volume of production and not on promoting
quality, efficiencies or sustainable farming practices. This has been
a large contributing factor to the general glut we now see in the
Chinese domestic market.
The huge domestic stockpiles in China of wheat and corn have had a negative impact on global market sentiment and prices for wheat and corn markets.
Although, because of this artificially high internal corn price,
Chinese demand for feed grain substitutes such as US sorghum
and Australian barley has increased. This increase in demand for
substitute feed grains was favourable for Australian barley exports,
1991
1992
1993
1990
‘000
met
ric to
nnes
Stoc
ks-to
-use
ratio
1995
1996
1997
1998
1999
2000
2001
2002
2003
2004
1994
2005
2006
2007
2008
2009
2010
2011
2012
2013
2014
2015
2016
2017
20,000
0
40,000
60,000
80,000
100,000
120,000
140,000
Ending stocks, stocks to use
0%
20%
40%
60%
80%
100%
120%
Chinese wheat balance sheet
1.00 2.00 3.00 4.00 5.00 6.00 7.00 8.00 9.00 10.00
China Japan Saudi Arabia All Other Million Tonnes
2010/11
2011/12
2012/13
2013/14
2014/15
2015/16
2016/17
-
Australian barley exports by destination
1991
1992
1993
1990
‘000
met
ric to
nnes
Stoc
ks-to
-use
ratio
Chinese corn balance sheet
1995
1996
1997
1998
1999
2000
2001
2002
2003
2004
1994
2005
2006
2007
2008
2009
2010
2011
2012
2013
2014
2015
2016
2017
20,000
0
40,000
60,000
80,000
100,000
120,000
140,000
Ending stocks, stocks to use
0%
20%
40%
60%
80%
100%
120%
Chinese AG Policy
HEIHE, CHINA - NOVEMBER 22: 2016, A man works on a pile of corn at a grain storage facility to reduce the pressure on its corn stocks. (Photo by VCG/VCG via Getty Images).
particularly since 2012, and has had an overall positive impact on
reducing ending stocks and supporting prices.
Despite the pitfalls stemming from these recent policies,
agriculture still makes up approximately 10% of Chinese GCP along
with 28.3% of total employment in China, and it is important for
the government to support this industry along with guaranteeing
food security to avoid potential social unrest. The challenge for
policymakers looking forward in China is how to increase farmer
incomes and improve food security without distorting internal
market prices, incentivising inefficient farming practices, negative
environmental impacts and amassing large domestic stockpiles.
In March 2016, China announced the end of the price support
policy for corn in an attempt to alleviate excessive corn stocks,
inefficient farming practices and environmental concerns (mainly
attributed to excessive fertiliser use).

C O V E R S T O R Y
HARVEST ISSUE 2017 21
C O V E R S T O R Y
20
Market Check, while at a Chinese delegate dinner during GTA,
heard a term that should be very relevant moving forward:
“marketisation”. This process essentially is the change from a
planned to a free market economy; many view that this process will
allow for a more sustainable and efficient market for producing and
selling agricultural commodities in China, and will reduce the
unintended consequences and adverse effects that stem from
current market structure and government policies.
Will Cripps, Senior Commodity Adviser, Market Check
China’s focus over the short term has been to try and remove the price support mechanism and incentivise the consumption of existing domestic corn stockpiles.
This policy shift has the potential to reduce corn substitute
imports to China such as Australian barley; although we were
still competitively priced against internal corn pricing. This is
evidenced in estimates of over 8 million tonnes of barley exports
to China this cropping year, leaving our ending stocks and
stocks-to-use ratio lower for 2017. The internal pricing of corn in
China, even with the removal of the price support policy, is still
not adjusting as a free market should in response to supply and
demand dynamics; the government is still intervening in the
market and setting prices too high.
In regards to wheat, China is yet to eliminate price support
mechanisms and, as mentioned, the government recently set its
2017 state wheat purchase price at 2360 yuan/tonne, which is
unchanged from two years ago even though the global wheat
price has fallen substantially in that time. Similar to corn, with this
minimum price guarantee in place, area of wheat harvested has
remained constant and production is set to potentially add even
more to their burdensome domestic balance sheet this year. Feed
wheat in China is competing with barley, sorghum and corn for
consumption demand, and with these substitute feed grains
having no minimum price policy they are more competitively
priced, limiting demand for wheat and increasing ending stocks.
Chinese government policy is important to examine and
understand when looking at supply of and demand for agricultural
commodities. Attributable to government agricultural policies,
China still has enormous stockpiles of wheat and corn which
continue to weigh on market sentiment and pricing for global
grain markets. China is gradually making the move towards a free
market system for pricing of their agricultural commodities, but it
will take time. Brett Stevenson, Managing Director and Founder of
Australian barley balance sheet
1991
1992
1993
1990
‘000
met
ric to
nnes
Stoc
ks-to
-use
ratio
1995
1996
1997
1998
1999
2000
2001
2002
2003
2004
1994
2005
2006
2007
2008
2009
2010
2011
2012
2013
2014
2015
2016
2017
0
500
1,000
1,500
2,500
2,000
3,000
Ending stocks, stocks to use
0%
5%
10%
15%
25%
35%
20%
30%
40%
1990
5
10
15
25
35
30
20
01992 1994 1996 1998 2000 2002 2004 2006 2008 2010 2012 2014 2016
Ha
(mill
ions
)
Chinese wheat area harvested
Chinese demand for feed grain substitutes such as US sorghum and Australian barley has increased
“”
Chin
a co
nfro
nts
issu
e of
how
to u
se u
p ex
cess
cor
n st
ocks
© T
he F
inan
cial
Tim
es L
imite
d 20
17.

C O V E R S T O R Y
22 AUSTRALIAN GRAIN REVIEW
C O V E R S T O R Y
HARVEST ISSUE 2017 23
Many of you would have heard the term “white elephant”
– we use it here on our farm to describe a dam that
doesn’t hold water. Will this be the case for the
much-hyped Melbourne–Brisbane Inland Rail line, or
can it be the game changer our politicians and some within the
industry hope it to be? What are the opportunities (if any) for the
grower to participate and get a higher price for their grain?
In 2015 I was fortunate, with the support of a Nuffield Farming
Scholarship, to travel the world and investigate grain supply chains.
I wanted to consider how the Australian east coast supply chain
may evolve over time. This is important, as the decision for a
grower to invest in on-farm grain storage today needs to consider
the future, given grain storage assets have a lifespan in excess of 30
years. To complete my studies I travelled to France, Germany, The
Netherlands, the UK, the US, Mexico, Brazil and New Zealand. It
was a great experience which I recommend for those interested,
providing an opportunity to meet some innovative businesses run
by great teams of people.
On the grain supply chain front, the UK, Canada and the US were
the highlights. The US is the home of storing and moving grain with
a large corn crop that drives scale in grain movements supply
channels, including efficient mainline rail and
the US river and barge network. Canada is a
great case study for the impact of mainline
rail efficiency and provides an indication of
where the Australian east oast grain supply
chain will head over the next decade.
Larger trains and large efficient elevators
dominate grain movements in the US,
as can be seen in Chart 1, with trains
hauling 75+ railcars dominating corn
shipments.
What became obvious after talking with industry at home and travelling abroad, was the Australian east coast rail network was not fit for purpose for the needs of a modern grain supply chain.
Inland rail
0 150
$10/t
Western Australia
Canadian National
Current EasternAustralia
Best Practice Eastern Australia
300 450 500
Chart 2: Rail costs: Canada vs WesternAustralia vs Eastern Australia
Distance from Port
$ pe
r ton
ne
Rail transport cost$10/t higher thanbest practice
1994
1995
1996
1997
1998
1999
2000
2001
2002
2003
2004
2005
2006
2007
2008
2009
10
20
30
40
50
60
70
80railcars1 to 5 6 to 49 50 to 74 75 + railcars
railcars railcars
0 150
$10/t
Western Australia
Canadian National
Current EasternAustralia
Best Practice Eastern Australia
300 450 500
Chart 2: Rail costs: Canada vs WesternAustralia vs Eastern Australia
Distance from Port
$ pe
r ton
ne
Rail transport cost$10/t higher thanbest practice
28 tonnes) and longer trains will allow lower cost rail operations
from upcountry receivals to port. Larger, more efficient trains
need more efficient upcountry rail loading facilities; competition
and control for these sites will be important for port operators,
grain traders and growers alike. There are sceptics of the impact
that the M-B IR project will have on the supply chain, and that
scepticism is not unsurprising or misplaced.
However, the benefits of efficient mainline rail operations are
clear, having seen the impact in Canada. The Canadian rail
network has effectively been rebuilt over the last 20 years to cater
for larger trains. This is a window into what might be possible on
the east coast of Australia.
It is unrealistic to assume that Australian grain will be moved at the same cost that Canadian growers can achieve.
However, we can move closer to Canadian rail cost of execution
than our current out-of-date rail network allows us to achieve.
Canada in particular is a great place to understand the impact that
an upgraded mainline rail network, including the construction of
the Melbourne–Brisbane rail project, will have for the grains
industry on the east coast.
The Canadian grain belt is largely 1000-1400km from export ports,
with Vancouver the dominant port handling well over 50% of
Canadian grain exports. By contrast, the Australian port network
is highly fragmented and ports tend to be at the mercy of local
production for their viability. Vancouver Port supports seven
profitable port operators who provide efficient fobbing operations,
and consistent supply means they can profitably load ships at a
lower cost than their Australian counterparts due to our
inconsistent supply.
In the 2017 May budget, the federal government committed to funding the Melbourne–Brisbane Inland Rail (M-B IR) project at a cost of $8.4 billion -
“…the Commonwealth’s biggest rail project in 100 years, that will
build a dedicated high productivity rail freight corridor”.
This leads us to the potential benefits of IR. Linkages between
the grain belt and a mainline will improve port profitability and
encourage competition among port operators, keeping down
pressure on port costs for the grower. Heavier axle weights (up to
White elephant or game changer?
White elephant or game changer? Explains Andrew Freeth, Nuffield Scholar
Chart 2: Rail costs: Canada vs Western Australia vs Eastern Australia
Chart 1: Percentage of US corn by rail shipment size
And
rew
Fre
eth
(righ
t) at
Tru
epoi
nt C
o-O
pera
tive/
Car
gill
Join
t Ven
ture
site
und
er c
onst
ruct
ion
- Milf
ord,
IN, U
SA.

C O V E R S T O R Y
24 AUSTRALIAN GRAIN REVIEW HARVEST ISSUE 2017 25
On one of my visits in the US I saw the impact of efficient mainline
rail operations as a US farmer co-op partnering with Cargill to
construct a new greenfield site capable of loading a 160-car train
on a 3.2km rail loop without needing to split the train to load.
Rising tide lifts all boats
There have been some who have rightly questioned the benefit
to them of the IR line. Yes, sure, there are questions around
implementation, access and control of port and rail loading
infrastructure, to name a few. The real impact will be at the farm
gate as mainline rail allows grain across the east coast to be
executed more efficiently to export and also into some domestic
markets. Growers not directly executing grain onto the main rail
line still benefit, as domestic consumers operating via road will
have to compete in a market where grain upcountry can be more
cost-effectively exported and will have to bid up to attract grain.
The big winners are the growers who will experience lower costs to execute grain into export markets. Even if you are not directly on the main rail line, the fact that
container packers and domestic consumers will have to compete
in a market where there is less cost between the farm gate and the
port means they will have to pay a higher price to get your grain.
Stranger things have happened and there is still a lot of work to be
done, but there is great opportunity to improve farmgate returns
for the grower.
There are challenges – in particular, who controls access to key
infrastructure at the upcountry supersites. A problem may occur
Opportunity exists for growers to further expand on-farm storage capacity
Truepoint Co-Operative/Cargill Joint Venture site under construction - Milford, IN, USA.
Chart 3: Rebuilding Canadian grain elevators
Licensed primary elevators and elevator capacity from 1962-2016 (CGC)
# of Licensed primary elevators Capacity (tonnes)
Fewer but largerhigh productivityrail loading
0 1962-631963-641964-651965-661966-671967-681968-691969-701970-711971-721972-731973-741974-751975-761976-771977-781978-791979-801980-811981-821982-831983-841984-851985-861986-871987-881988-891989-901990-911991-921992-931993-941994-951995-961996-971997-981998-991999-002000-012001-022002-032003-042004-052005-062006-072007-082008-092009-102010-112011-122012-132013-142014-152015-162016-17
0
2,000,000
6,000,000
8,000,000
10,000,000
12,000,000
4,000,000
1000
2000
3000
4000
5000
6000
if efficient upcountry rail loading facilities are built by the major
multinational trading companies. Does the Australian grower need
to have a stake in upcountry rail loading infrastructure, as observed
in the US and Canada?
Opportunity exists for growers to further expand on-farm
storage capacity. However, the real opportunity may be to
investigate supply chain partnerships to invest in upcountry
grain-handling infrastructure to participate in reducing the cost
of executing grain to market.
Andrew Freeth, DB Freeth & Sons, Nuffield ScholarChart 3: Rebuilding Canadian grain elevators

C O V E R S T O R Y
26 AUSTRALIAN GRAIN REVIEW
C O V E R S T O R Y
HARVEST ISSUE 2017 27
T he 2016/17 season has seen historically large wheat exports
but isn’t a good indication of new season wheat export
demand with a crop that is forecast to be 38% smaller
(INTL FC Stone). At the end of August 2017, Australian
wheat exports sat at around 21MMT (ABS, ACF) and are forecast to
hit around 22MT by the end of the marketing year. As illustrated in
Chart 1, strong growth in demand was evident into Indonesia,
India, Philippines and China. Indonesia has consistently been a
big buyer of Australian wheat for its high quality, particularly for
the wet noodles and growing baked breads and cakes segments.
India also became a large net wheat importer due to consecutive
years of lower domestic wheat production and a growing
population. Due to India’s strict importing requirements,
Australian wheat saw strong demand from India in 2017 compared
to previous years, which helped move last year’s massive crop and
support local prices.
Inelasticity of export demand Market Check’s Richard Perkins explains what is it and the impacts it will have this year
As we move into the new marketing year, the market is trying to estimate how inelastic the export demand is for Australian wheat and at what price do we ration supplies to meet domestic demand.
The Australian five-year average for wheat exports is 18.9MMT, and
we are heading into a wheat crop that could be well under 20MMT
given recent dryness. Domestic demand for wheat is currently
pegged at 9MMT for this coming season – that only leaves around
11MMT if we do produce a 20MMT wheat crop plus some carry-in.
It is this domestic demand that is driving prices across the east
coast of Australia, as its job is to destroy enough export demand
to secure supplies. So the question is, what east coast feed grain
stocks will be available and how inelastic is the export demand
for Australian wheat?
To get a better idea of the demand elasticity in the global market for Australian wheat, we need to look back at exports during past drought seasons. Average exports for wheat across the last two Australian drought
seasons, being 2002/03 and 2006/07, was 8.7MMT. Since the last
drought in 2006, global demand for wheat has increased with
Indonesia, the largest importer of Australian wheat, nearly doubling
their wheat imports in the last decade to 10.5MMT. Although a
larger percentage of this increase was taken by alternative origins,
namely the Black Sea region, Australian wheat exports to Indonesia
doubled. Local supply chain functions also need to be taken into
consideration with a lot more capital invested in supply chain assets
to get the grain into the export pathway. Since 2006 there have
been five new grain-loading ports and many new packing facilities
that have become operational, not to mention the investment in
domestic logistical capabilities. But supply chain throughput
demand is much more elastic and would be the first to be shut off
as margins moved into negative territory. Domestic demand for
Australian wheat has also grown by 2MMT since the 2006/07
season and is arguably the most inelastic demand due to limited
alternative options.
On the flipside, during these two drought seasons, global wheat
ending stocks were tighter with the average global wheat
stocks-to-use ratio across the 2002 and 2006 seasons sitting at 25%
compared to 36% this season. As a result, this season we’ve seen
some of the highest local Australian wheat prices relative to global
benchmarks, primarily US wheat prices. The trend for Australian
wheat indicates strong demand from Asia, as seen in Chart 2.
Other3%
Melanesia3%
Australia and New Zealand4%
Chart 2: Australian average exports by region across drought years
Eastern Asia24%
Western Asia14%
Northern Africa10%
Southern Africa6%
South-Eastern Asia36%
Total wheat exports8.93MMT in 2002/038.41MMT in 2006/077.21MMT in 2007/08
Newpaper article September 24 1957, 60 years ago - history repeats itself.
Who’s buying Australian wheat?Indonesia, India, Philippines and China increase their appetite for Aussie wheat.
WHERE IN AUSTRALIA IS THE WHEAT EXPORTED FROM5 Year Avg Wheat Exports (mmt)
5.08mmt 2016-17
2.24mmt2016-17
2.05mmt 2016-17
1.84mmt 2016-17
22%
IND
ON
ESIA
9%
PH
ILIPP
INES
8% CH
INA
10%
5yr Ave2016-17
2.5mmt
8.5mmt
2.8mmt
4.3mmt
0.7mmt
4.01mmt 5yr Ave
0.81mmt 5yr Ave
0.90mmt 5yr Ave
1.40mmt 5yr Ave
Of total of 2016-17 exports (Oct-Aug)
Of total 2016-17 exports (Oct-Aug)
Of total 2016-17 exports (Oct-Aug)
Of total 2016-17 exports (Oct-Aug)
IND
IA
Chart 1: Total Australian wheat exports (Oct-Aug) 21.36mmt

C O V E R S T O R Y
HARVEST ISSUE 2017 29
C O V E R S T O R Y
28 AUSTRALIAN GRAIN REVIEW
Even in years where stocks are tight, local Asian flour millers have stated they cannot completely shut off the need for Australian wheat.
Despite much cheaper wheat options from the Black Sea, a report
commissioned by the AEGIC in September 2016 stated that “the
risk of supply disruption will make some buyers in South East Asia
wary of basing too much of their overall program around Russian
wheat”. Nick Ooi Eng Hooi from PT Cerestar Flour Mills in
Indonesia, in an interview with Market Check, said they
traditionally use around 50% Australian wheat. But in the current
market where price premiums for Australian milling wheat have
been historically high, he stated that they need about 25% for their
requirements. If 25% was used as a minimum then there could be
around 2.6MMT of Australian wheat import demand from
Indonesia this season, worst case. If a more conservative
percentage was overlayed across all major Asian importers of
Australian wheat – say 15% – it would indicate inelastic demand
for around 7MMT. Furthermore, there is traditional buying from
Middle Eastern and African destinations that needs to be satisfied.
Simon Varley, who for 10 years was a senior export wheat trader
with GrainCorp, said “there is traditional demand from countries
such as Yemen, Egypt, Kuwait and Nigeria that need 2 million
tonnes of Australian wheat every year”.
This very rough assumption of inelastic export demand for
Australian wheat combined with the exports we managed to
execute across the last two drought seasons indicates relatively
inelastic export demand for a minimum of 8 to 10MMT this season.
If we grow to 20MMT and total demand is 17MMT, including
9MMT of domestic demand, stocks are extremely tight. The bottom
line is that the high price spread for Australian wheat over global
wheat prices is warranted and the evidence suggests it could
increase further. So, for now it is a sellers’ market and I’m sure
there are a lot of growers out there that like the sound of that.
Richard Perkins, Head of Marketing & Advisory, Market Check
There is traditional demand from countries such as Yemen, Egypt, Kuwait and Nigeria that need 2 million tonnes of Australian wheat every year
Man
mak
ing
indi
an b
read
in a
tra
ditio
nal B
aker
’s s
hop,
Old
Del
hi, I
ndia
, so
uce:
Ala
my
stoc
k im
ages
.
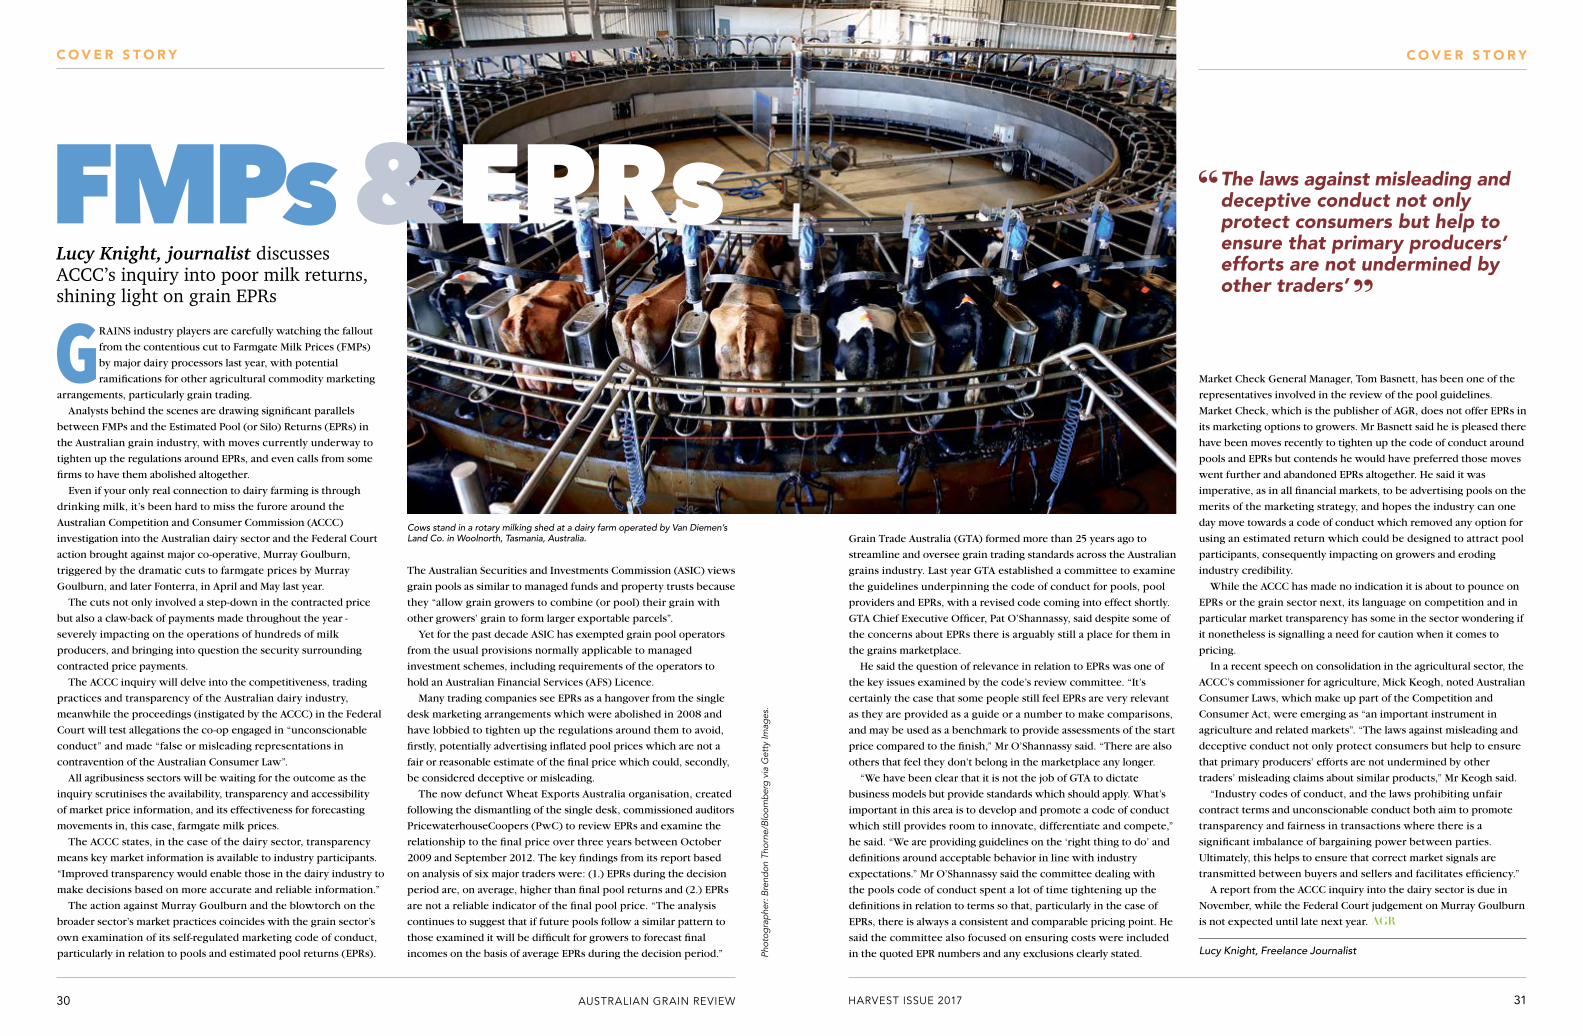
C O V E R S T O R Y
30 AUSTRALIAN GRAIN REVIEW
C O V E R S T O R Y
HARVEST ISSUE 2017 31
Cows stand in a rotary milking shed at a dairy farm operated by Van Diemen’s Land Co. in Woolnorth, Tasmania, Australia.
GRAINS industry players are carefully watching the fallout
from the contentious cut to Farmgate Milk Prices (FMPs)
by major dairy processors last year, with potential
ramifications for other agricultural commodity marketing
arrangements, particularly grain trading.
Analysts behind the scenes are drawing significant parallels
between FMPs and the Estimated Pool (or Silo) Returns (EPRs) in
the Australian grain industry, with moves currently underway to
tighten up the regulations around EPRs, and even calls from some
firms to have them abolished altogether.
Even if your only real connection to dairy farming is through
drinking milk, it’s been hard to miss the furore around the
Australian Competition and Consumer Commission (ACCC)
investigation into the Australian dairy sector and the Federal Court
action brought against major co-operative, Murray Goulburn,
triggered by the dramatic cuts to farmgate prices by Murray
Goulburn, and later Fonterra, in April and May last year.
The cuts not only involved a step-down in the contracted price
but also a claw-back of payments made throughout the year -
severely impacting on the operations of hundreds of milk
producers, and bringing into question the security surrounding
contracted price payments.
The ACCC inquiry will delve into the competitiveness, trading
practices and transparency of the Australian dairy industry,
meanwhile the proceedings (instigated by the ACCC) in the Federal
Court will test allegations the co-op engaged in “unconscionable
conduct” and made “false or misleading representations in
contravention of the Australian Consumer Law”.
All agribusiness sectors will be waiting for the outcome as the
inquiry scrutinises the availability, transparency and accessibility
of market price information, and its effectiveness for forecasting
movements in, this case, farmgate milk prices.
The ACCC states, in the case of the dairy sector, transparency
means key market information is available to industry participants.
“Improved transparency would enable those in the dairy industry to
make decisions based on more accurate and reliable information.”
The action against Murray Goulburn and the blowtorch on the
broader sector’s market practices coincides with the grain sector’s
own examination of its self-regulated marketing code of conduct,
particularly in relation to pools and estimated pool returns (EPRs).
The Australian Securities and Investments Commission (ASIC) views
grain pools as similar to managed funds and property trusts because
they “allow grain growers to combine (or pool) their grain with
other growers’ grain to form larger exportable parcels”.
Yet for the past decade ASIC has exempted grain pool operators
from the usual provisions normally applicable to managed
investment schemes, including requirements of the operators to
hold an Australian Financial Services (AFS) Licence.
Many trading companies see EPRs as a hangover from the single
desk marketing arrangements which were abolished in 2008 and
have lobbied to tighten up the regulations around them to avoid,
firstly, potentially advertising inflated pool prices which are not a
fair or reasonable estimate of the final price which could, secondly,
be considered deceptive or misleading.
The now defunct Wheat Exports Australia organisation, created
following the dismantling of the single desk, commissioned auditors
PricewaterhouseCoopers (PwC) to review EPRs and examine the
relationship to the final price over three years between October
2009 and September 2012. The key findings from its report based
on analysis of six major traders were: (1.) EPRs during the decision
period are, on average, higher than final pool returns and (2.) EPRs
are not a reliable indicator of the final pool price. “The analysis
continues to suggest that if future pools follow a similar pattern to
those examined it will be difficult for growers to forecast final
incomes on the basis of average EPRs during the decision period.”
Grain Trade Australia (GTA) formed more than 25 years ago to
streamline and oversee grain trading standards across the Australian
grains industry. Last year GTA established a committee to examine
the guidelines underpinning the code of conduct for pools, pool
providers and EPRs, with a revised code coming into effect shortly.
GTA Chief Executive Officer, Pat O’Shannassy, said despite some of
the concerns about EPRs there is arguably still a place for them in
the grains marketplace.
He said the question of relevance in relation to EPRs was one of
the key issues examined by the code’s review committee. “It’s
certainly the case that some people still feel EPRs are very relevant
as they are provided as a guide or a number to make comparisons,
and may be used as a benchmark to provide assessments of the start
price compared to the finish,” Mr O’Shannassy said. “There are also
others that feel they don’t belong in the marketplace any longer.
“We have been clear that it is not the job of GTA to dictate
business models but provide standards which should apply. What’s
important in this area is to develop and promote a code of conduct
which still provides room to innovate, differentiate and compete,”
he said. “We are providing guidelines on the ‘right thing to do’ and
definitions around acceptable behavior in line with industry
expectations.” Mr O’Shannassy said the committee dealing with
the pools code of conduct spent a lot of time tightening up the
definitions in relation to terms so that, particularly in the case of
EPRs, there is always a consistent and comparable pricing point. He
said the committee also focused on ensuring costs were included
in the quoted EPR numbers and any exclusions clearly stated.
Lucy Knight, journalist discusses ACCC’s inquiry into poor milk returns, shining light on grain EPRs
FMPs & EPRsMarket Check General Manager, Tom Basnett, has been one of the
representatives involved in the review of the pool guidelines.
Market Check, which is the publisher of AGR, does not offer EPRs in
its marketing options to growers. Mr Basnett said he is pleased there
have been moves recently to tighten up the code of conduct around
pools and EPRs but contends he would have preferred those moves
went further and abandoned EPRs altogether. He said it was
imperative, as in all financial markets, to be advertising pools on the
merits of the marketing strategy, and hopes the industry can one
day move towards a code of conduct which removed any option for
using an estimated return which could be designed to attract pool
participants, consequently impacting on growers and eroding
industry credibility.
While the ACCC has made no indication it is about to pounce on
EPRs or the grain sector next, its language on competition and in
particular market transparency has some in the sector wondering if
it nonetheless is signalling a need for caution when it comes to
pricing.
In a recent speech on consolidation in the agricultural sector, the
ACCC’s commissioner for agriculture, Mick Keogh, noted Australian
Consumer Laws, which make up part of the Competition and
Consumer Act, were emerging as “an important instrument in
agriculture and related markets”. “The laws against misleading and
deceptive conduct not only protect consumers but help to ensure
that primary producers’ efforts are not undermined by other
traders’ misleading claims about similar products,” Mr Keogh said.
“Industry codes of conduct, and the laws prohibiting unfair
contract terms and unconscionable conduct both aim to promote
transparency and fairness in transactions where there is a
significant imbalance of bargaining power between parties.
Ultimately, this helps to ensure that correct market signals are
transmitted between buyers and sellers and facilitates efficiency.”
A report from the ACCC inquiry into the dairy sector is due in
November, while the Federal Court judgement on Murray Goulburn
is not expected until late next year.
Lucy Knight, Freelance JournalistPhot
ogra
pher
: Bre
ndon
Tho
rne/
Blo
ombe
rg v
ia G
etty
Imag
es.
The laws against misleading and deceptive conduct not only protect consumers but help to ensure that primary producers’ efforts are not undermined by other traders’

O P I N I O N O P I N I O N
32 AUSTRALIAN GRAIN REVIEW HARVEST ISSUE 2016 33
O P I N I O N
What is really going on in Russia?
At the time of writing, Russia had harvested 63MMT of wheat and looked like it was going to blow last year’s record 72MMT wheat
crop out of the water with an estimated 80MMT plus crop looking increasingly likely.
Ten years ago Russia produced enough wheat for its domestic consumption, and if it did export any crop it was in such small quantities that it didn't register.
Today Russia holds the number one spot for global wheat exports. So what's happened over the last decade?
It would be easy to focus on the last three or four years and point at sanctions and the political situation as the driver of increased Russian productivity, but this would only be part of the story. I've been working in the Black Sea region in various capacities over the last decade and what I've seen is a general development and progression in farming capability.
Take tramlines as an example – wheelings deliberately left unplanted in a crop for the sprayer and fertiliser spreader to follow.
Ten years ago we had a battle with every agronomist, director, engineer, and anyone else who had an opinion. As far as they were concerned, leaving wheelings undrilled led to a drop in yield and should be avoided at all costs. But some farmers did adopt tramlines and soon realised the benefit of easier, more accurate fertiliser and chemical applications. Wheat immediately started looking better – even and uniform – localised yields and efficiency improved and more farmers saw the benefits and started to use tramline technology as a matter of course.
During the early 2000s we saw an uptake and implementation of tramlines across the Black Sea and then later decline as the more progressive farms moved onto auto-steer technology.
In my opinion it's these types of low-level technical changes that really drive Russian wheat production and much of the productivity from the Black Sea region as a whole. Russia's import substitution policy, imposed in retaliation to Western sanctions after Russia annexed Crimea, certainly doesn't hurt agricultural development, but in reality offers not much more than words. The real progress is being made on the Russian farm one small step at a time and is set to continue well into the future.
Mike Lee is the director and consultant at Green Square Agro Consulting, specialising in Black Sea agribusiness. Each year Mike and his team conduct independent crop tours across the Black Sea region to gauge crop condition and yield forecasts for the major commodity crops. Mike also writes an agribusiness blog focusing on the Black Sea region and comments frequently on his Twitter account.
agronomyukraine.blogspot.com@AgronomyUkraine
The USDA has just released their guess of 18Mt for exports next year which is highly unlikely
Mike Lee, Director & consultant, Green Square Agro Consulting
Wheat market enters uncharted territory
0 0.0%
5.0%
10.0%
15.0%
20.0%
30.0%
40.0%
25.0%
35.0%
2004/05
2005/06
2006/07
2007/08
2008/09
2009/10
2010/11
2011/12
2012/13
2013/14
2014/15
2015/16
2016/17
2017/18
1,000
2,000
3,000
4,000
5,000
6,000
7,000
8,000
9,000
10,000
End Stocks Stocks/Use
Chart 1: Australian ending stocks and stocks/use pre-ABARES cut.
0.0%
5.0%
10.0%
15.0%
20.0%
30.0%
40.0%
25.0%
35.0%
0
2004/05
2005/06
2006/07
2007/08
2008/09
2009/10
2010/11
2011/12
2012/13
2013/14
2014/15
2015/16
2016/17
2017/18
1,000
2,000
3,000
4,000
5,000
6,000
7,000
8,000
9,000
10,000
End Stocks Stocks/Use
Chart 2: Australian ending stocks and stocks/use post-ABARES cut.
As we approach the beginning of the 2017/18 season, the market is pouring over spreadsheets and organising crop tours trying
to estimate not only the size of the upcoming crop but also how much is left from last season’s record wheat crop. Whichever angle you approach the supply and demand models from, stocks are tight going into 2018. ABARES has recently entered the fray: in their September crop report they made a big revision to 2015/16 production that’s really made things interesting for the 2017/18 season. A revised 21.6Mt wheat crop (downgraded 2.6Mt from the June report) was largely expected by the market considering the
longer competitive into export channels. This occurs when domestic markets pay a higher return relative to export markets to satisfy their requirements. However, we have asset holders who need to utilise their infrastructure, along with global importers who have inelastic demand for Australian wheat, so we can’t simply turn off wheat exports altogether.
The USDA has released their guess of 18Mt for exports next year, which looks highly unlikely looking at the balance sheet which is using 13.75Mt exports for 2017/18 (Chart 2), and considering we are overpriced into every destination globally.
Our market therefore looks relatively supported whether you apply the ABARES revision or not, as the market ensures we remain largely uncompetitive on an export level throughout the 2017/18 season.
Nick Crundall, Manager - Strategy & Managed Programs, Market Check
Sunflower crop, Ukraine, Russia; photo via Mike Lee Crop Tour 2017.
unfavourable weather experienced recently. However, based on newly released census data, ABARES cut 2015/2016 wheat production by 1.9Mt based on a 1.4 million hectare drop in planted acres! The impact this has on our supply/demand models is significant.
If we look at Chart 1, which illustrates our take on the balance sheet, we can see that our stocks-to-use ratio was already tight as a forecasted 23Mt export program in the 2016/17 season helped clear the decks. Now if we look at Chart 2, which shows the balance sheet after plugging in ABARES revisions, the estimates show we truly are in uncharted territory. Worth noting, in order to keep our ending stocks from plunging into negative, which is impossible, you have to reduce export assumptions by at least 1Mt. Interestingly, they cut planted acres for 2015/16, however, didn’t make the same adjustment for 2016/17, which assumes that wheat acres increased 19% Y-O-Y in 2016 – an assumption not shared by the wider market.
So how does the market react to such a tightening of the balance sheet? The answer to this lies in our estimated exports. The reason we focus on exports is their variability versus domestic demand. The job of the market is to “ration” export demand when supply is limited by increasing our domestic price to a level where we’re no

O P I N I O N
HARVEST ISSUE 2017 35
O P I N I O N
34 AUSTRALIAN GRAIN REVIEW
What a difference six months has made for the Australian wheat market! In April 2017 Australia was
still digesting a record 35 million tonne (MMT) crop in a record global carry-out environment of 256MMT (USDA). Australian wheat exports were competing into price-sensitive demand points, such as South East Asian feed markets, against exporting origins like the Black Sea. Meanwhile, Australian farmers’ new crop planting conditions were near ideal on the back of good summer rain and ample subsoil moisture. Six months later, we are coming into harvest with east coast domestic markets now driving Australian wheat prices to ration domestic demand and turn off exports. Only a few months earlier, exports were driving Australian values. Current Australian APW1 wheat prices are at least US$50/t above Black Sea wheat prices; last year when competing into export homes, Australia was pricing closer to US$15/t over. At current premiums, Australian milling wheat is uncompetitive into the export channel and only engaging limited traditional demand.
With such a large Australian carry out (estimated by some industry analysts to be around 7MMT) on top of an estimated 21.5MMT new crop production (ABARES), the question is: Do we need to hold such high premiums? While production is still up in the air, Australian growers and trade sellers continue to be disengaged.
Domestic rationing of demand driving wheat values
This, combined with domestic consumers needing to ensure supply, means premiums are likely to be held in place until the new crop is in the bin and production is known. If all holds and Australia does produce a 21.5MMT crop, our local wheat premium over Black Sea will come under pressure to find demand. In this scenario, Australia will need to export grain from Western Australia, South Australia and Victoria. There is an inflection point at which our exportable surplus disconnects with international demand – at this point domestic demand will have secured sufficient supply and prices will be capped. The driest areas of production today, Queensland and New South Wales, are also holding the tightest carry-in stocks and account for the largest domestic demand points in the nation. Both states account for approximately 60% of Australia’s total wheat demand. The production shortfall has caused Queensland domestic markets to source grain from as far as north-west Victoria. In order to secure this supply, the delivered Darling Downs market has reached a $70-$80/t premium over relative Victorian wheat values.
Based on the supply and demand estimates today this drawing arc does not need to widen further, but if spring brings an unkind finish and New South Wales and Queensland production drops further, this drawing arc will need to draw on more Victorian grain. This could occur via road or else values will get to a level where transhipments are exported from Victoria or South Australia to fill the northern consumer demand shortage. At the end of the day, Australian wheat prices are doing the job of rationing demand, but until the size of the new crop is better known, prices will remain at current premiums.
Mark Poole, Wheat Trader, Graincorp
Volatility is opportunity
Tom Basnett, General Manager, Market Check
While the 2016/17 domestic market is finishing the year strongly, the Chicago Board of Trade (CBOT) wheat futures
market is virtually unchanged compared to 12 months ago, albeit we’ve had some volatility along the way. The nearby CBOT wheat contract (converted to AUD/MT) is trading back near the levels seen at the start of the season. A world market lacking a substantial supply-side shock and an ever-increasing Russian crop has ensured any hopes of a sustained rally in the offshore market have been extinguished for now. This was despite a healthy rally mid-season which saw CBOT wheat push A$45/t higher in only eight trading sessions. The funds got spooked, covered their short, and prices moved sharply higher.
Unfortunately, however, the market promptly gave back this whole rally and returned to levels lower than where it began.
Aside from this volatility, the market has provided a great opportunity this year: hedging into strong futures carry at harvest. When the global balance
sheet becomes burdensome, the market discounts spot/nearby values, and at the same time a carry premium builds in deferred prices. This premium in deferred contracts is not based on the market’s view of future price movements. Rather, it is purely a function of the cost of “carrying” wheat, i.e. storage and interest costs – the opposite of what one might think develops in the forward market structure. That is, the most bearish markets with the most comfortable balance sheet offer the biggest premium in deferred values.
This carry premium in deferred values gives participants the opportunity to hold physical grain here in Australia, hedge into the futures carry (i.e. sell a deferred CBOT swap or futures contract), and wait for a more attractive domestic market to sell into post-harvest. If the futures market chops along unchanged, then the carry premium realised at harvest will offset the physical cost of storage and interest, and any basis appreciation domestically will be added to our bottom line. In November 2016 growers could have sold a Dec-17 CBOT wheat swap at A$240/t – $40/t higher than the nearby contract at the time (i.e. Dec-16). Ten months later, the Dec-17 swap is now the “nearby” contract and is trading at $210/t. At time of writing, this represents a $30/t gain on the hedge, despite a relatively unchanged “nearby” futures market. In this time, holding the physical wheat in a bulk handler in SA or east coast has cost around $23/t in storage and interest, giving us a net gain of $7/t in “carry arbitrage” before we consider basis appreciation. The carry arbitrage is even more pronounced in WA due to lower storage costs. To make this proposition more compelling, the Australian market has strengthened significantly relative to the US market (i.e. basis has strengthened).
As the 2017/18 harvest approaches, this opportunity may well present itself once again. As shown in the chart, carry premiums in deferred contracts erode over time and the prospect dissipates. The strategy of taking advantage of carry in the futures market is well worth considering during harvest/port-harvest markets here in Australia. The above example is a simplistic one, and consideration needs to be given to contract maturity, hedge placement, entry/exit timing and basis risk. This strategy also forms the foundation of Market Check’s Strategic Pool, which has proved itself as a strong-performing marketing strategy again this season.
10
Nov-16 Dec-16 Jan-17 Feb-17 Mar-17 Apr-17 May-17 Jun-17 Aug-17 Sep-17Jul-17
20
30
40
50
185
195
205
215
CBOT Wheat (Dec-17)
CBOT Wheat (rolling front month)
Carry to Dec-17
225
235
245
255
265
275
-
The strategy of taking advantage of carry in the futures market is well worth considering
At current premiums, Australian milling wheat is uncompetitive into the export channel and only engaging limited traditional demand

M A R K E T O U T L O O K
36 AUSTRALIAN GRAIN REVIEW
M A R K E T O U T L O O K
HARVEST ISSUE 2017 37
exports, was estimated to have landed in China – another all-time record.
Looking at forward-pricing indicators, it’s hard to see Australian feed barley prices falling by much as we move into harvest. Not only is our production down by around 30% since last season, meaning we will need to ration around 4 million tonnes of supply, global major barley exporter stocks are forecast down by 14% and world sorghum trade – our biggest competitor into the Chinese feed grain import market – is expected to decline sharply to 6.6 million tonnes, the lowest since 2013 (IGC). Conversely, IGC is expecting Chinese feed barley import demand to decrease by 2 million tonnes due to cheaper alternatives. Primarily, one of the cheaper alternatives they are referring to is Chinese corn, with USDA expecting an increase in domestic Chinese corn consumption of 6 million tonnes this season.
So, from where we are sitting, the most important forward-looking price indicator to watch is the price spread between Australian feed barley and domestic Chinese corn, as seen in Chart below. The average price spread between Chinese corn futures and Port Adelaide F1 barley in AUD/mt landed to China was $128/t between January 2017 and May 2017. This gap closed to $94/t from June 2017 to the end of
September 2017 due to a rise in Australian barley prices as stocks tightened and falling Chinese corn futures on better local corn production estimates. Even as the spread narrowed we continued to export barley to China; so where does the spread need to be before we can ration an extra 4 million tonnes of barley that won’t be produced? China’s alternative importing options also look bleak with lower US sorghum production and lower Ukrainian and Argentinian barley production. Competition for cheaper Black Sea feed barley will also increase as Saudi demand is expected to increase by 1.1 million tonnes to a record 11.8 million tonnes this season (USDA). Bottom line, it’s hard to be bearish.
Richard Perkins, Market Check, Oct 17
Australian barley prices caught most by surprise last season as they went from strength to strength post-harvest on the back of unexpected growth in import demand from China. Australian F1 barley prices in the Port Adelaide zone, traded from lows of around $80/mt under APW1 to around $20/mt under by the end of September – a $60/mt rally post-harvest. This trend was evident across all port zones as China ramped up imports of Australian feed barley at harvest as a domestic feed substitute. Feed demand from the pork sector in China is the primary driver of the import demand for Australian barley along with smaller demand from the growing Aquaculture sector. Most of the trade expected Chinese import demand for feed barley to slow in 2017 as government subsidies favoured the inclusion of more domestic Chinese corn. But due to the large relative price discount to Chinese corn (see
chart), local Chinese importers couldn’t ignore the positive margins importing
Australian feed barley. Barley exports from Australia were a
little over 9 million tonnes from September 2016 to the end of August 2017, an all-time record. Over 5 million tonnes, or at least 55% of total barley
BARLEYpriced at over a US$20-30/t premium to our Russian counterparts. Rule of thumb dictates SEA millers will use Australian grain at $US15-$20/t over Russian, so it’s easy to see where we stand from an export competitiveness point of view.
This is in direct contrast to the east coast markets, where the Darling Downs feedlot market will incentivise the transportation of wheat from southern origins, with throughput/freight variations being the main source of price fluctuations. We’ve already seen grain from northern Victoria pricing into Queensland markets, with South Australia trading a large enough discount to potentially motivate the loading of vessels in SA to be sent around to Queensland. This has only happened once back in 2013/14 and requires a spread between the two states to widen out to approx. $100/t. However, it’s worth noting that this source of grain is unlikely to solve the QLD markets shortage due to a lack of capacity to “import” enough grain.
So, it’s all about drawing arcs this year as domestic consumers look to secure inventory in the smallest production season we’ve had in 10 years. Exports have been all but cut off on the east coast, meaning this year it’s about price differences between the haves and have nots. The domestic consumers who don’t have supply around them (NSW/QLD) are going to have to pay up to buy it from the growers who do. Therefore, when pricing grain this season, think not of our export competitiveness versus Black Sea like we did in 2016/17, but rather, is local demand bidding high enough to compete with what can be achieved by looking north?
Nick Crundall, Market Check, Oct 17
Australian wheat production is earning its reputation for variability as our 2017/18 wheat crop is projected to tumble, estimated less then 20MMT. This will completely switch the pricing signals we need to focus on this upcoming season as our exportable surplus falls to cover only inelastic demand. The 2016/17 season was all about securing export business to clear the decks of a record crop. We’ve achieved this so efficiently that our carry-out for the 2017/18 crop is historically tight, as illustrated in the chart.
Market structure will be state dependent, as WA/SA look to place our exportable surplus into our “inelastic” export demand. How much of our demand is “inelastic” is being hotly debated, with estimates as low as 8Mt to as high as 14Mt. What is known is that many of our international buyers are unable to completely switch out of using Australian grain, due to quality and colour preferences. For example, South East Asian (SEA) millers are unable to turn off Australian grain altogether in response to cheaper origins, i.e. Black Sea, but merely reduce the percentage of Australian imports used in their milling grist. Our premium into export channels over the competition this year will test their conviction, as we are currently
WHEAT
Chinese corn futures vs Port Adelaide F1 (AUD/mt)
100.00
200.00
300.00
400.00
500.00
600.00
0.008/1/2013 8/1/2014 8/1/2015 8/1/2016 8/1/2017
DCE Corn Pt Adel F1 CFR China China corn/F1 CFR China spread
PTA APW1
PTA F1$240
$280
202
230
$200
$160
-90May-16 Aug-16
F1 Spread to APW1
Nov-16 Feb-17 May-17
-28
Aug-17
-80-70-60-50-40-30-20
0.0
Production Ending Stocks Stocks/Use
0.0%
5.0%
10.0%
15.0%
25.0%
20.0%
30.0%
35.0%
40.0%
5000.0
10000.0
15000.0
20000.0
25000.0
30000.0
40000.0
35000.0
2004/05
2005/06
2006/07
2007/08
2008/09
2009/10
2010/11
2011/12
2012/13
2013/14
2014/15
2015/16
2016/17
2017/18
Australian wheat balance sheet

M A R K E T O U T L O O K
38 AUSTRALIAN GRAIN REVIEW
M A R K E T O U T L O O K
possible that the Canadian crop could fall below 18MMT, which would be lower than last year’s 19.5MMT.
All that said, the big limiting factor on canola prices is the abundance of related oil products, particularly soybeans and palm oil. The USDA dealt a blow to soybean prices in its August WASDE report, where it forecast US production above the high end of expectations. Prices have also been weighed down by the soymeal market, which is suffering under heavy feed grain supplies. Palm oil production has also recovered this season after a couple of below-trend years. We need to keep all of this in mind this season, as domestic production hiccups are not the only factor contributing to Australian canola prices. Palm oil (33%) and soybean oil (29%) dominate the global veg oil market in comparison to canola (16%), meaning canola tightness in isolation does not automatically correspond to significantly higher prices. If prices in veg oil markets can maintain some strength it should be supportive for canola, more so than
The Australian canola crop is set to decline fairly substantially from the record production achieved last year, with crop conditions highly variable across the country. Last year’s crop was pegged at 4.3MMT, of which 3.4MMT was exported (mostly to Europe) and 0.9MMT was consumed domestically, leaving carry-over stocks extremely tight at just under half a million tonnes. This season, current forecasts peg total production at 2.7MMT with most of the decline occuring in WA, where harsh sowing conditions led to lower acres planted and poor emergence. This drop in production will come straight out of the exported quantity this season, as the domestic consumptive market is concentrated on the east coast. As usual, there is reluctance to make wholesale cuts to production estimates before the key spring weather period gets underway. The global supply and demand of canola is equally tight, with crop losses in Canada compounding the Australian situation to make global production the lowest in six years. Despite record plantings, it is
lead-up to harvest as the trade is realising the crop size is greatly depleted. Central QLD is poised to take the bulk of the chickpea crops where yields are expected to be around 1-1.5t/ha; Southern QLD and NNSW chickpea crops are deteriorating quickly with yields ranging between 0-1t/ha; and to finish, the West of NSW crops are virtually non-existent. These drastic conditions in Australia and declining stocks in the sub-continent have combined for another positive year of pricing for Aussie peas.Faba beans are still suffering from a lack of export demand as economic difficulties in Egypt continue to limit available foreign currencies to purchase faba beans. The government is prioritising funds for essential stable
CANOLAPULSESsoybeans. Canola has around twice the oil content of soybeans, so it usually responds better to an uptick in oil markets.
After a tough growing season, European canola yields have actually been slightly better than expected with some minor upward revisions in France and Germany only partially offsetting their import requirement from Australia. However, something that may reduce European demand is relatively poor crush margins at current prices, with biodiesel prices suffering somewhat due to crude oil weakness.
Richard Hall, Market Check, Oct 17
“
Popularity of pulses in Australian farming rotations has grown over the years as agronomic benefits have become better known, and helped along by healthy gross margin returns. As a result, 2017 planted hectares have risen across all of the major pulses except for faba beans and lupins, according to the Pulse Australia crop update. The outlook for the 2017/18 chickpea market looks firm again with bullish news out of the sub-continent and Australia brewing the perfect storm for strong pricing. To begin, let’s look at the sub-continent and its most recent monsoonal period: this monsoonal period has marked the second consecutive season of consistent rainfall. This year’s monsoon registered 98% of its long-term average rainfall, which is about 851mm. For the average Indian grower, this amount of rain puts them in a strong position for both the rabi and kharif harvests. Despite the positive rainfall, Indian grower focus has been on developing their government wheat stocks in 2016/17, extending the demand for Australian chickpeas. Looking towards the 2017/18 marketing year, we expect demand for Aussie peas to be strong up until April/May as this is when the Indians strip their rabi crops. The 2017/18 production year is tipped to be nearly 3MMT larger than last year’s crop which came in at about 6.7MMT; this year is expected to be 9MMT. I want to highlight the importance of that delivery period for Australian chickpeas – the Indian crop is predicted to be much larger and will be hitting the marketplace around April, so it is crucial to make sales between the harvest period and April. The domestic driver in the Australian marketplace is obvious – we are currently facing an incredibly dry season while the crop is in crucial developmental stages. This has seen a sharp increase in pricing in the
The Australian canola crop is set to decline fairly substantially from the record production achieved last year”
foods, which include faba beans, but increased competition especially from the Baltic region means that the historic premiums that Australian beans were able to achieve are under pressure. Record Australian production for the 2016 crop has also meant larger carry-over stocks weighing on the market, and as yet the market hasn’t seen a huge uplift in domestic feeder demand coming forward as a result of the tightening feed grain balance sheet on the east coast. If conditions remain dry through the summer period, it is reasonable to expect increased demand for faba beans and other pulses like lupins coming forward for stock feeding.
Ed Nankivell, Ben McClusky, Market Check, Oct 2017
Chickpea crop in Gunnedah NSW 2017

Call an adviser today on 02 9499 4199 | marketcheck.com.au
Grain Marketing