HumanDimensions 2011-2012 Illinois Waterfowl R e s e a r c h...
63
Federal Aid Project Number W-112-R-21 Job Number 101.3 Wildlife Restoration Oct. 1, 2011-Sept. 30, 2012 Marc Miller, Director Illinois Department of Natural Resources Paul Vehlow Federal Aid Coordinator John E. Buhnerkempe Chief, Division of Wildlife Resources Craig A. Miller, Ph.D. Program Leader and Principal Investigator Human Dimensions Research Program Illinois Natural History Survey Prepared by Mark G. Alessi, Craig A. Miller and Linda K. Campbell 2011-2012 Illinois Waterfowl Hunter Survey: Behavior, Satisfaction, and Video-watching of Waterfowl Hunters INHS Technical Report 2012 (20) July 11, 2012 HumanDimensions R e s e a r c h P r o g r a m Illinois Natural History Survey Prairie Research Institute University of Illinois at Urbana-Champaign
Transcript of HumanDimensions 2011-2012 Illinois Waterfowl R e s e a r c h...
Federal Aid ProjectNumber W-112-R-21Job Number 101.3Wildlife Restoration
Oct. 1, 2011-Sept. 30, 2012
Marc Miller, DirectorIllinois Department of Natural
Resources
Paul VehlowFederal Aid Coordinator
John E. BuhnerkempeChief, Division of Wildlife
Resources
Craig A. Miller, Ph.D.Program Leader and Principal InvestigatorHuman Dimensions Research ProgramIllinois Natural History Survey
Prepared byMark G. Alessi,Craig A. Miller andLinda K. Campbell
2011-2012 Illinois WaterfowlHunter Survey: Behavior,
Satisfaction, and Video-watchingof Waterfowl Hunters
INHS Technical Report 2012 (20)July 11, 2012
HumanDimensionsR e s e a r c h P r o g r a m
Illinois Natural History SurveyPrairie Research InstituteUniversity of Illinois at
Urbana-Champaign

Suggested Citation:
Alessi, M.G., C.A. Miller and L.K Campbell. 2012. 2011-2012 Illinois Waterfowl Hunter Survey: Behavior,
Satisfaction, and Video-Watching of Waterfowl Hunters. Job Completion Report, Federal Aid in Wildlife
Restoration W-112-R-21. Human Dimensions Research Program Report HR-12-03/INHS Technical Report 2012
(20). Illinois Natural History Survey, Champaign, IL. 60pp.

LIST OF FIGURES, TABLES AND APPENDICES
Page
Figure 1 ................ Stamps sold, number of hunters, and waterfowl harvested in Illinois, 2000-2011 ............................................................... 5
Figure 2 ................ Percentage of hunters who hunted ducks, geese, or both during the 2011-12 Illinois waterfowl season ............................ 6
Figure 3 ................ Teal harvest and hunter activity during the Illinois September teal season, from 2000 – 2011 .......................................... 7
Figure 4 ................ Rates of teal harvest and hunter activity during the Illinois September teal season, from 2000-2011 ............................... 7
Figure 5 ................ Proportion of Mallards, Wood Ducks, and Other Ducks harvested during the 2011-2012 regular duck season .............. 10
Figure 6 ................ Illinois regular season duck harvest, 2000 – 2011 .................................................................................................................. 10
Figure 7 ................ Distribution of days afield per hunter and ducks harvested per hunter for Illinois’ 2011-2012 regular duck season....... 11
Figure 8 ................ Early September Canada goose harvest and hunter activity by zone in Illinois during 2011 ............................................. 12
Figure 9 ................ Early September Canada goose harvest and hunter activity, 2000-2011 ............................................................................. 12
Figure 10 .............. Goose harvest during Illinois’ regular goose season from 2000-2011 ................................................................................... 13
Figure 11 .............. 2011-2012 Illinois’ regular Canada goose season harvest ..................................................................................................... 14
Figure 12 .............. Distribution of days afield per hunter and geese harvested per hunter for Illinois’ 2011-2012 regular goose season ....... 14
Figure 13 .............. Distribution of the number of duck permits received by hunters before the 2011-12 Illinois duck season ........................ 16
Figure 14 .............. The influence of age on whether Illinois waterfowl hunters watched waterfowl hunting videos ....................................... 18
Table 1 .................. Summary of Illinois Migratory Waterfowl Stamps purchased, hunter activity, and waterfowl harvest
in Illinois from 1990 through 2011 hunting seasons. ............................................................................................................. 21
Table 2 .................. The percentage of waterfowl hunters who hunted exclusively ducks, exclusively geese, or both
ducks and geese in Illinois from 1990 through 2011 seasons ................................................................................................. 22
Table 3 .................. Summary of Teal harvest and hunter activity during September Teal season (Illinois, 1990-2011) .................................. 23
Table 4 ................. Teal harvest and hunter activity by zones during September Teal season (Illinois, 2011) .................................................. 24
Table 5 ................. Rates of Teal harvest and hunter activity during September Teal season (Illinois, 1990- 2011) ........................................ 25
Table 6 ................. Waterfowl harvest and hunter activity during Youth Waterfowl Hunting Days, 2000 -2011 ............................................ 26
Table 7 ................. Summary of duck and coot harvest and hunter activity during the regular duck season (Illinois 1990 -2011) ................. 27
Table 8 ................. Duck harvest and hunter activity by waterfowl zones and selected areas during the regular duck season
(Illinois 2011-2012). ................................................................................................................................................................. 28
Table 9 ................. Rates of duck harvest and hunter activity during the regular duck season (Illinois 1990-2011) ........................................ 29
Table 10 ................ Distribution of the number of days afield and number of ducks harvested in 2011-2012. Number of ducks
harvested was calculated by taking responses and applying the correction factor (Anderson et al. 1986) ........................ 30
Table 11 ................ Canada goose harvest and hunter activity during the early September Canada goose
season (Illinois 2000 -2011) ...................................................................................................................................................... 31
Table 12 ................ Summary of goose harvest and hunter activity during the regular goose season
(Illinois 1990-1991 through 2011-2012) .................................................................................................................................. 32
Table 13 ................ Distribution of the number of days afield and number of geese harvested. Number of geese harvested was
calculated by taking responses and applying the correction factor (Anderson et al. 1996) ................................................ 33
Table 14 Goose harvest and hunter activity by zones, regular season (Illinois 2011-2012) ................................................................ 34
Table 15. ............... Canada goose harvest by zone during the regular goose season (Illinois 2009-2010 through 2011-2012) .......................... 35
Table 16 ................ Summary of the number of ducks and geese crippled (Illinois 1990 - 2011 seasons) ........................................................... 36
Table 17 ................ Illinois duck hunters’ (≥ 1 day hunting ducks) levels of satisfaction with various aspects of the
2011-2012 duck seasons ........................................................................................................................................................... 37
Table 18 ................ Illinois goose hunters’ (≥ 1 day hunting geese) levels of satisfaction with various aspects of the
2011-2012 goose seasons .......................................................................................................................................................... 38
Table 19 ................ Reported reasons for hunter dissatisfaction with number of waterfowl seen while hunting .............................................. 39
Table 20 ................ Waterfowl hunting videos watching, by age .......................................................................................................................... 40
Table 21 ................ Relationship between age and frequency of watching waterfowl hunting videos ................................................................ 41
Table 22 ................ Comparison of watching waterfowl hunting videos and awareness of hunters’ partners watching videos ....................... 42
Table 23 ................ Illinois duck hunters’ preferences for duck harvest .............................................................................................................. 43
Table 24 ................ Goose hunters’ preference, by zone hunted, for current goose season or more liberal goose season ................................. 44
Table 25 ................ Hunter and non-hunter response to various questions about waterfowl hunting ............................................................... 45
Appendix A .......... Illinois Waterfowl Hunter Survey: 2011-2012 Season ........................................................................................................... 46
Appendix B .......... Cover letter sent with first mailing of the Illinois Waterfowl Hunter Survey ...................................................................... 56
Appendix C .......... Thank you reminder postcard sent as a follow-up to the mailings of the Illinois Waterfowl Hunter Survey .................... 57
Appendix D .......... Cover letter sent with second mailing of the Illinois Waterfowl Hunter Survey ................................................................. 58
Appendix E .......... Cover letter sent with third mailing of the Illinois Waterfowl Hunter Survey .................................................................... 59
Appendix F ........... Waterfowl Zone map ............................................................................................................................................................... 60
2011-2012 ILLINOIS
WATERFOWL HUNTER SURVEY: BEHAVIOR,
SATISFACTION, AND VIDEO-WATCHING OF
WATERFOWL HUNTERS
JOB COMPLETION REPORT
WILDLIFE HARVEST AND
HUMAN DIMENSIONS RESEARCH PROGRAM
STATE OF ILLINOIS
PROJECT NUMBER: W-112-R-21
STUDY 101
JOB NO. 101.3
Prepared by
Mark G. Alessi, Craig A. Miller, and Linda K. Campbell
Illinois Natural History Survey
Champaign, IL
July 11, 2012
Federal Aid in Wildlife Restoration
W-112-R-21
Illinois Department of Natural Resources
Marc Miller, Director John E. Buhnerkempe, Chief
Illinois Department of Natural Resources Division of Wildlife Resources
Equal opportunity to participate in programs of the Illinois Department of Natural Resources (IDNR)
and those funded by the U.S. Fish and Wildlife Service and other agencies is available to all individuals
regardless of race, sex, national origin, disability, age, religion or other non-merit factors. If you believe
you have been discriminated against, contact the funding source’s civil rights office and/or the Equal
Employment Opportunity Officer, IDNR, One Natural Resources Way, Springfield, IL 62702-1271;
217/785/0067; TTY 217/782/9175.

2
OBJECTIVE
To survey waterfowl (duck, goose, and coot) hunters annually to determine their activities,
harvest, characteristics, attitudes, and opinions.
ABSTRACT
A total of 2,503 (52%) Illinois waterfowl hunters responded to the 2011-2012 Illinois Waterfowl
Hunter Survey. Hunters reported spending 1,147,037 days afield, an increase of 16% from the 985,075
days devoted during the 2010-2011 license year. Waterfowl harvest increased 12% from 513,882 during
2010-2011 to 577,654 during 2011-2012. Duck harvest estimates for the regular duck season were as
follows: 222,405 mallards (Anas platyrhynchos), 54,294 wood ducks (Aix sponsa), and 150,786 other
ducks. A total of 21,227 teal (Anas spp.) were harvested during the September teal season. Goose
hunters harvested 75,061 Canada geese (Branta canadensis) during the regular Canada goose season, a
25% decrease from the 99,422 Canada geese harvested during the 2010-2011 regular goose season.
Hunters harvested 18,790 Canada geese during the September Canada goose season, a 10% increase
from the previous year. During the Youth Waterfowl Hunting Season, 6,325 adults took 8,642 youths
waterfowl hunting, a 16% increase from the 7,452 youths that participated in the 2010-2011 Youth
Waterfowl Hunting Season. We discuss the use of public duck permits, hunter satisfaction with the
waterfowl seasons, and hunter viewing habits regarding waterfowl hunting videos.

3
METHODS
A random sample of 5,000 waterfowl hunters was drawn from the population of Illinois State
Waterfowl Stamp purchasers from 2010-2011 license year (64,828 stamps sold). Hunters were notified
on 9 September 2010 that they would receive a questionnaire at the end of the 2011-2012 hunting
season. Additionally, a 1-page diary for recording their hunting activity and waterfowl harvest was
included. After incomplete and duplicate addresses were removed, the sample was reduced to 4,928.
On 1 February 2012, hunters were mailed an 8-page questionnaire (Appendix A), cover letter (Appendix
B), and a postage-paid return envelope. We received 88 (2%) questionnaires returned as undeliverable;
the sample was then reduced to 4,840. Hunters were sent a follow-up postcard (Appendix C) on 14
February 2012 thanking them for returning their questionnaire and also reminding non-respondents to
return the completed questionnaire. Non-respondents were mailed a second questionnaire and a cover
letter (Appendix D) on 28 February 2012, followed with a second postcard mailing on 19 March 2012.
A third questionnaire and cover letter (Appendix E) were mailed to non-respondents on 6 April 2012.
Estimates of number of hunters, days afield, and waterfowl harvested were computed following the
procedures outlined by Anderson et al. (1998). We compared and found a significant relationship
(R2=0.95) between the zone hunters duck hunted most often during 2010-2011 to the zone in which they
goose hunted most often during 2010-2011. Subsequently, harvest of 2011-2012 goose data were
analyzed by the zone in which respondents indicated they duck hunted. Coded data were entered and
analyzed using SPSS 19.0 (SPSS Inc. 2010). Confidence intervals are presented where appropriate.
4
SEASON LENGTHS AND BAG LIMITS
Illinois was granted permission from the U.S. Fish and Wildlife Service to incorporate a fourth
waterfowl zone beginning with the 2011-2012 regular waterfowl seasons. September goose and teal
seasons were not affected by this change for the 2011 early seasons, but September goose will be
affected starting with the 2012 season. Hunters in the northern part of the former South Zone expressed
dissatisfaction with late duck seasons, and hunters in the southern part of the former South Zone
expressed dissatisfaction with early duck seasons. The former South Zone, which ran from Interstate 70
south, was split into two zones. The South Central Zone encompasses Carlyle Lake and Rend Lake, and
the Wabash River and southern portion of Illinois comprise the South Zone. Additionally, the eastern
location of the North/Central Zone line was changed; the portion between Interstate 80 and the
Wilmington-Peotone road lie in the North duck zone and the Central goose zone (Appendix F). The
early (September) teal (Anas spp.) season length and daily bag limits remain unchanged from 2010 to
2011; hunters could hunt for 16 days and could harvest 4 teal a day. Early (September) Canada goose
(Branta canadensis) season remain unchanged from the 2010 season; hunters could hunt for 15 days
statewide and could harvest 5 geese a day, except for the South Zone where they could harvest 2 birds a
day. Length and daily bag limit of the regular duck season remain unchanged (60-day/6-bird duck
season) from 2010. Except for the addition of the South Central Zone, the regular Canada goose season
remained unchanged (85-day/2-bird Canada goose season in North and Central zone, and a 66-day/2-
bird in the South Central and South Zone).

5
RESULTS
Waterfowl Harvest and Days Afield
We received 2,503 (52%) questionnaires from hunters in the sample, of which 2,424 were usable
surveys. Of the 2,424 usable surveys, 2,035 (84%) hunters that purchased a 2010-2011 state waterfowl
stamp purchased a 2011-2012 stamp. Of these 2,035 hunters that purchased a 2011-2012 stamp, 1,549
(76%) hunters actually hunted waterfowl in Illinois during the 2011-2012 license year. The number of
waterfowl hunters increased from 50,936 during the 2010-2011 season to 52,660 during the 2011-2012
season, which is a 3% increase in hunters (Table 1, Figure 1). Hunters reported spending 1,147,037
days afield in 2011-2012, an increase of 16% from the 985,075 in 2010-2011. Total waterfowl harvest
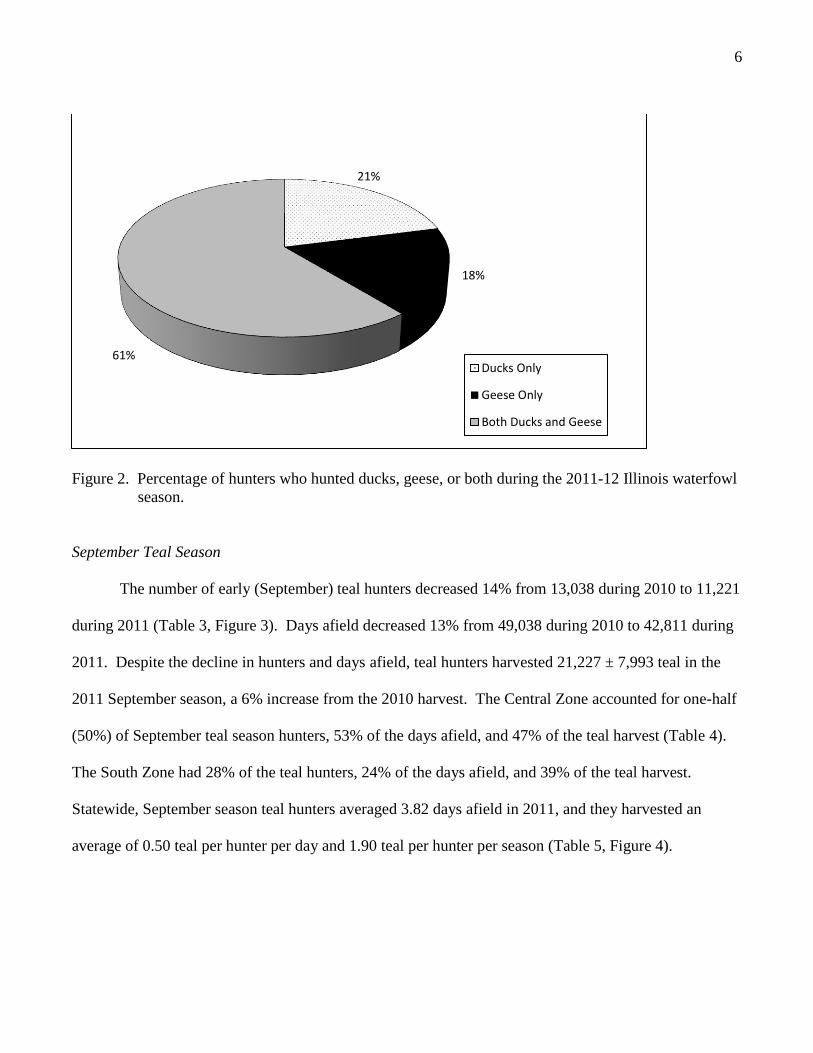
increased 12% from 513,882 birds during 2010-2011 to 577,654 birds during 2011-2012. Twenty-one
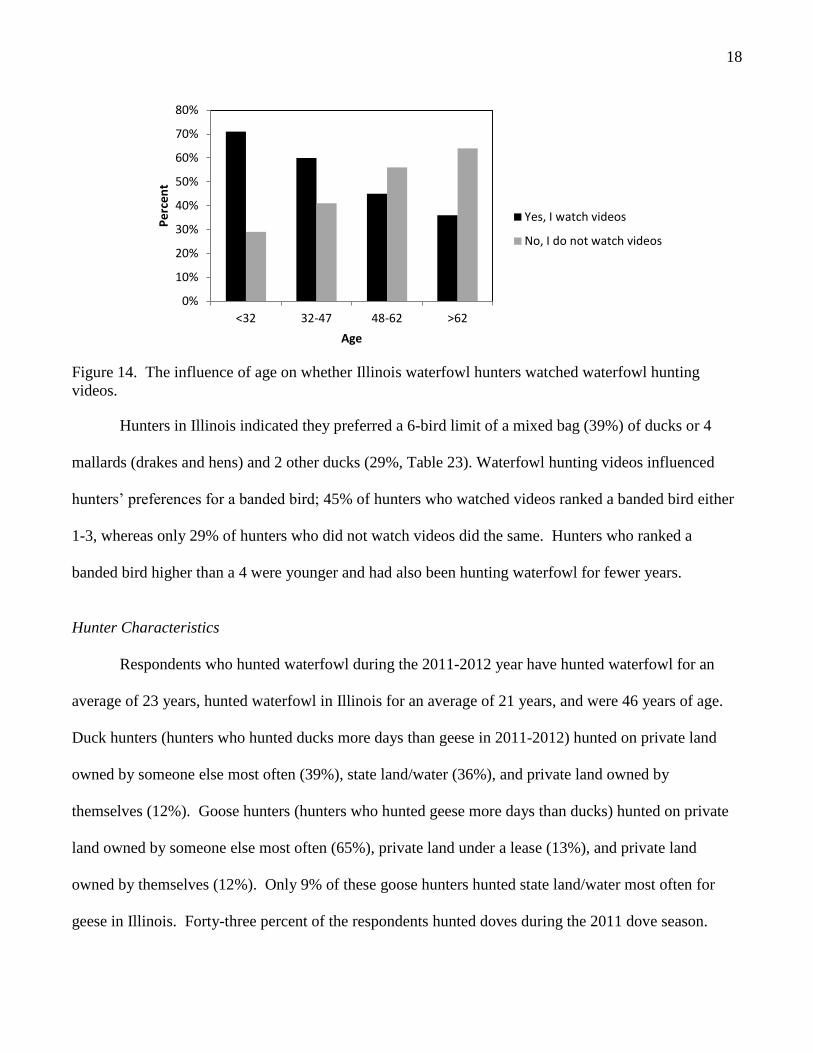
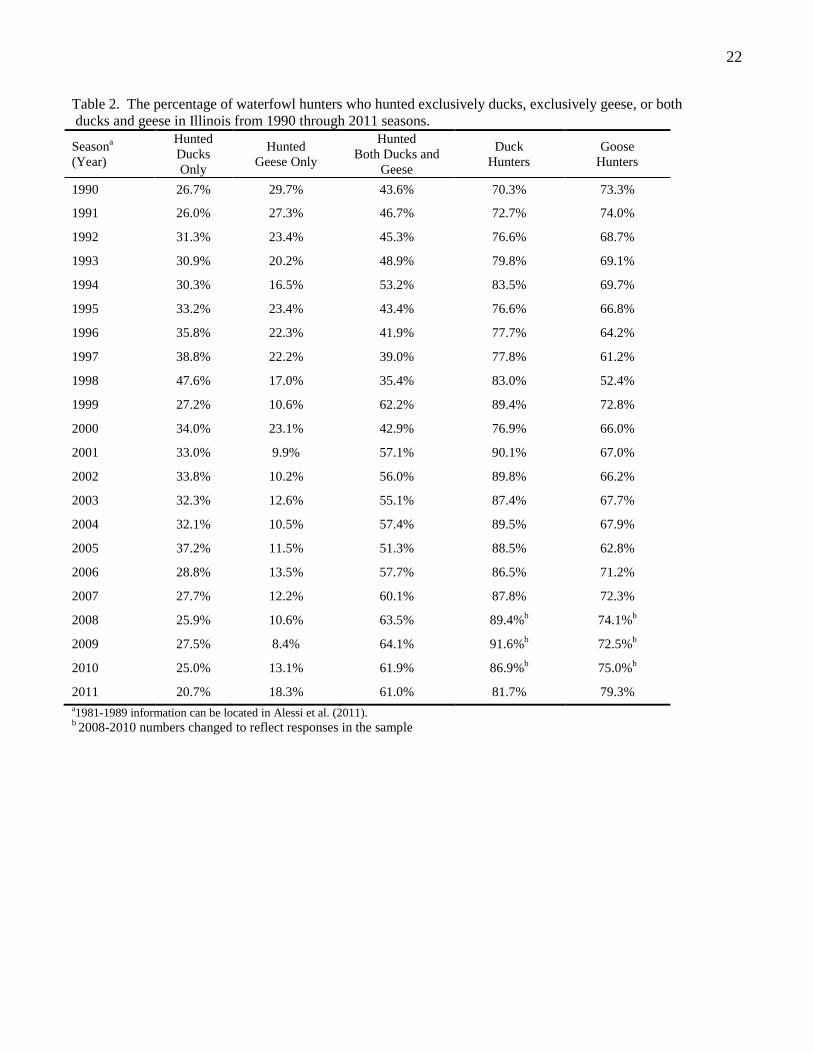
percent of the hunters hunted ducks only, 18% hunted geese only, and 61% hunted both ducks and geese
(Table 2, Figure 2).
Figure 1. Stamps sold, number of hunters, and waterfowl harvested in Illinois, 2000-2011.
0
100,000
200,000
300,000
400,000
500,000
600,000
700,000
800,000
30,000
35,000
40,000
45,000
50,000
55,000
60,000
65,000
70,000
75,000
2000 2001 2002 2003 2004 2005 2006 2007 2008 2009 2010 2011
Nu
mb
er
of
Wat
erf
ow
l Har
vest
ed
Nu
mb
er
of
Stam
ps/
Hu
nte
rs
Year
# of Stamps Sold
# of Waterfowl Hunters
# of Waterfowl Harvested
6
Figure 2. Percentage of hunters who hunted ducks, geese, or both during the 2011-12 Illinois waterfowl
season.
September Teal Season
The number of early (September) teal hunters decreased 14% from 13,038 during 2010 to 11,221
during 2011 (Table 3, Figure 3). Days afield decreased 13% from 49,038 during 2010 to 42,811 during
2011. Despite the decline in hunters and days afield, teal hunters harvested 21,227 ± 7,993 teal in the
2011 September season, a 6% increase from the 2010 harvest. The Central Zone accounted for one-half
(50%) of September teal season hunters, 53% of the days afield, and 47% of the teal harvest (Table 4).
The South Zone had 28% of the teal hunters, 24% of the days afield, and 39% of the teal harvest.
Statewide, September season teal hunters averaged 3.82 days afield in 2011, and they harvested an
average of 0.50 teal per hunter per day and 1.90 teal per hunter per season (Table 5, Figure 4).
21%
18%
61% Ducks Only
Geese Only
Both Ducks and Geese

7
Figure 3. Teal harvest and hunter activity during the Illinois September teal season, from 2000 – 2011.
Figure 4. Rates of teal harvest and hunter activity during the Illinois September teal season, from 2000-
2011.
0
10,000
20,000
30,000
40,000
50,000
60,000
70,000
2000 2001 2002 2003 2004 2005 2006 2007 2008 2009 2010 2011
Year
# of Teal Hunters
# of Days Afield
# of Teal
0
0.5
1
1.5
2
2.5
3
3.5
4
4.5
5
2000 2001 2002 2003 2004 2005 2006 2007 2008 2009 2010 2011Year
Days Afield per Hunter
Teal Harvest per Hunter per Day
Teal Harvest per Hunter per Season
8
Youth Waterfowl Hunting Season
The Youth Waterfowl Season framework remained unchanged from 2010 to 2011; youth under
16 years of age were able to hunt ducks, geese, and coots for two days before the regular duck season
opened in all four zones. The number of adults and youths that participated in the 2011 youth hunt
increased; the number of participating adults increased 16%, from 5,471 adults during 2010 to 6,325
adults during 2011, and the number of youths participating increased 16% from 7,452 youths during
2010 to 8,642 youths during 2011 (Table 6). The youth waterfowl harvest (ducks, geese, and coots
combined) increased 11%, from 10,995 in 2010 to 12,220 in 2011.
Forty-five percent of youth that participated in the 2011 youth waterfowl season had never
hunted ducks or geese before. Sixty-two percent of respondents had – in the past or this year –
introduced someone > 15 years of age to waterfowl hunting. Twenty-nine percent of hunters who
hunted during the 2011-12 duck or goose seasons took a youth hunting during the regular season duck or
goose seasons; 84% of these hunters took a youth during the regular duck season, and 59% of these
hunters took a youth during the regular goose season.
Regular Duck Season
The number of duck hunters increased by 3,169 (7%) from 43,450 during the 2010-2011 season
to 46,619 during the 2011-2012 season (Table 7). Duck hunters spent 632,712 days afield (M = 13.57
days) during the 2011-2012 season, an increase of 27% from the 499,758 days reported during the 2010-
2011 season. Mallards (Anas platyrhynchos) comprised 52% of the total regular season duck harvest,
while wood ducks (Aix sponsa) and other ducks accounted for 13% and 35%, respectively (Figure 5).
These numbers do not necessarily reflect the most often harvested ducks, but are a product of how
hunters are asked to provide their harvest data. Statewide mallard harvest in Illinois increased by 28,647
(15%) birds, from 193,758 during 2010-2011 to 222,405 during the 2011-2012 season (Table 7, Figure

9
6). Wood duck harvest increased 14,683 (37%) from 39,611 during 2010-2011 to 54,294 during 2011-
2012. The harvest of other ducks increased 29,411 (24%), from 121,375 during 2010-2011 to 150,786
during 2011-2012. Total duck harvest during 2011-2012 was 427,484, which was 21% greater than the
354,859 ducks reported for 2010-2011. The statewide coot (Fulica americana) harvest increased 145%
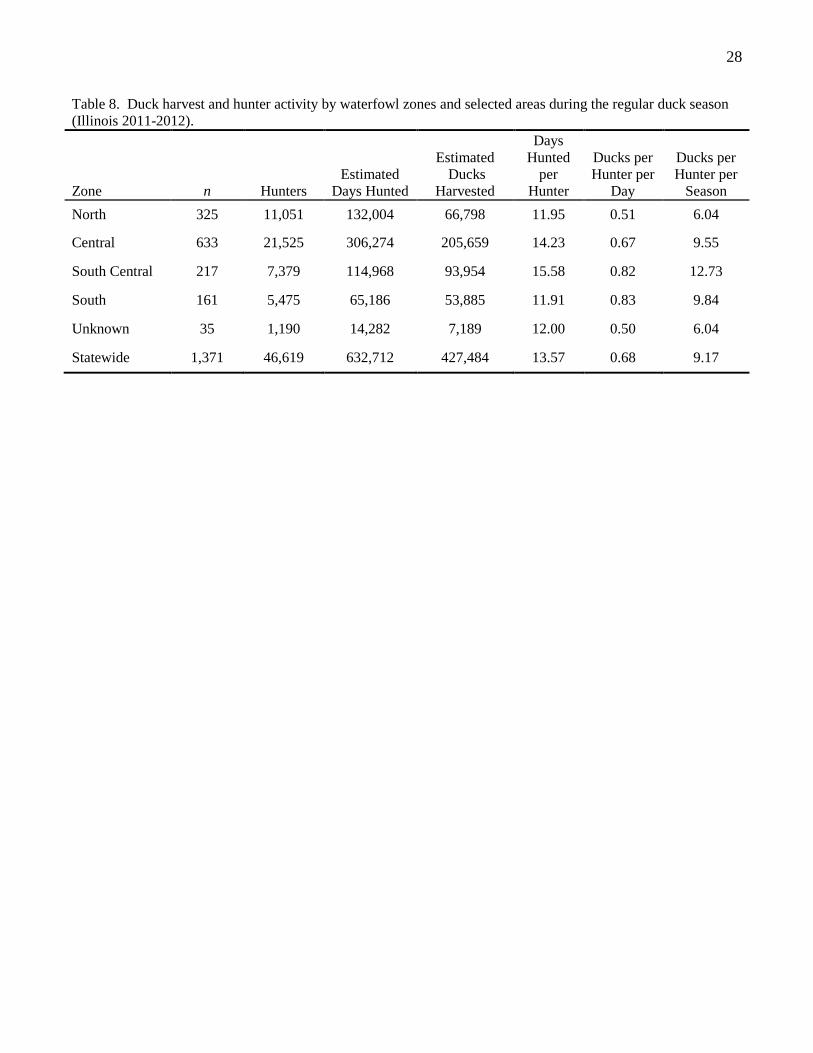
from 1,770 in 2010-2011 to 4,327 in 2011-2012. The 2011-2012 duck harvest is presented by waterfowl
zones in Table 8. Across the four waterfowl zones, the greatest number of hunters, days afield, and
ducks harvested occurred in the Central Zone. South Central Zone hunters had the highest days afield
per hunter (15.58 days) and ducks harvested per hunter per season (12.73 ducks), but South Zone
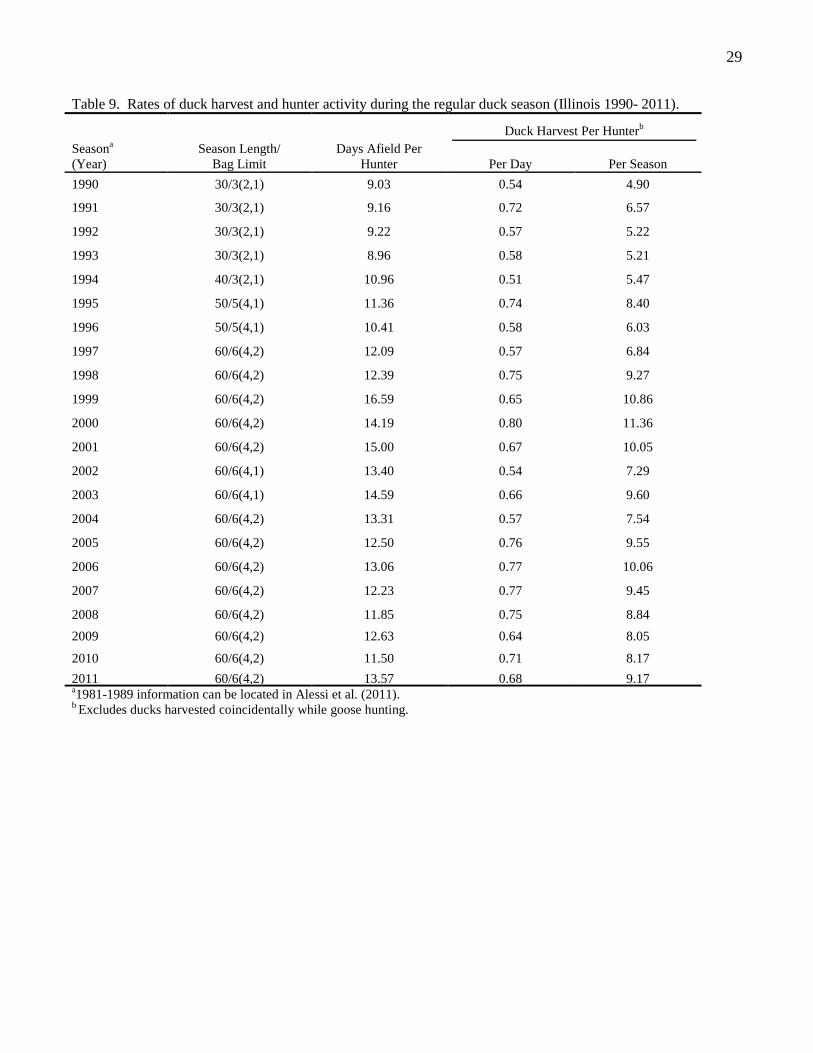
hunters harvested slightly more ducks per day (0.83 ducks, Table 8). Statewide, the duck harvest per
hunter per day decreased from 0.71 in 2010-2011 to 0.68 in 2011-2012, and duck harvest per hunter per
season increased from 8.17 in 2010-2011 to 9.17 in 2011-2012 (Table 9).
Of duck hunters who reported hunting ≥ 1 day, 29% hunted less than 5 days (Figure 7), and 15%
of duck hunters reported not harvesting any ducks. A small percentage of hunters (7%) harvested more
than 30 ducks (Table 10), and 67% of hunters used a spinning-wing decoy (SWD) during the 2011-12
duck seasons.

10
a Proportions are by mallard, wood duck, and other ducks due to how hunters are asked to report their harvest. This order (mallard, wood
duck, other ducks) is not necessarily the order of the most often harvested ducks in Illinois.
Figure 5. Proportion of Mallards, Wood Ducks, and Other Ducks harvested during the 2011-2012
regular duck seasona.
Figure 6. Illinois regular season duck harvest, 2000 – 2011.
52%
13%
35%
Mallards Wood Ducks Other Ducks
0
50,000
100,000
150,000
200,000
250,000
300,000
350,000
2000 2001 2002 2003 2004 2005 2006 2007 2008 2009 2010 2011
Mallards
Wood Ducks
Other Ducks

11
Figure 7. Distribution of days afield per hunter and ducks harvested per hunter for Illinois’ 2011-2012
regular duck season.
Early September Goose Season
An estimated 14,214 hunters participated in the early (September) Canada goose season in
Illinois during the 2011 season (Table 11), which was a 29% increase from the number of hunters that
participated in the 2010 season. The majority (56%) of these hunters were active in the Central Zone.
Hunters, regardless of the zone they hunted, collectively harvested 18,790 geese during the early season,
with 10,874 (58%) being harvested in the Central Zone (Figure 8). The number of days afield in 2011
increased 26% from 39,019 in 2010 to 49,306 in 2011, and the harvest of geese increased 10% from
17,115 in 2010 to 18,790 in 2011 (Figure 9).
0
2
4
6
8
10
1 6 11 16 21 26 31 36 41 46 51 59
Pe
rce
nt
Days Afield
0
2
4
6
8
10
12
14
16
0 5 10 15 20 25 30 35 40 45 50 55 60
Pe
rce
nt
Ducks Harvested
Regular Duck Season

12
Figure 8. Early September Canada goose harvest and hunter activity by zone in Illinois during 2011.
Figure 9. Early September Canada goose harvest and hunter activity, 2000-2011.
33%
56%
12% 34%
58%
8%
0
5,000
10,000
15,000
20,000
25,000
30,000
2000 2001 2002 2003 2004 2005 2006 2007 2008 2009 2010 2011
Year
Hunters
Geese
North Central South
Hunters Harvest

13
Regular Canada Goose Season
Canada goose harvest during the 2011-2012 regular goose season decreased 25% from 2010-
2011 (Table 12, Figure 10). An estimated 36,996 hunters spent 411,380 days afield and harvested
75,061 Canada geese during 2011-2012. Number of goose hunters in Illinois increased slightly (1%)
from 2010-2011, and number of days afield during regular Canada goose season increased 7%. These
hunters also harvested 19,862 other geese (of which 12,304 were snow/blue geese, Chen caerulescens),
for a total combined harvest of 94,923 geese (Figure 11). Goose hunters hunted an average of 11 days
for geese; mean harvest of geese was 2.57 geese per hunter per season and 86% of goose hunters
harvested ≤ 5 geese (Table 13, Figure 12).
Figure 10. Goose harvest during Illinois’ regular goose season from 2000-2011.
0
5,000
10,000
15,000
20,000
25,000
0
20,000
40,000
60,000
80,000
100,000
120,000
140,000
160,000
2000 2001 2002 2003 2004 2005 2006 2007 2008 2009 2010 2011
# o
f O
the
r G
ee
se
# o
f C
anad
a G
ee
se
Year
Canada Geese
Other Geese

14
Figure 11. 2011-2012 Illinois’ regular Canada goose season harvest.
Figure 12. Distribution of days afield per hunter and geese harvested per hunter for Illinois’ 2011-2012
regular goose season.
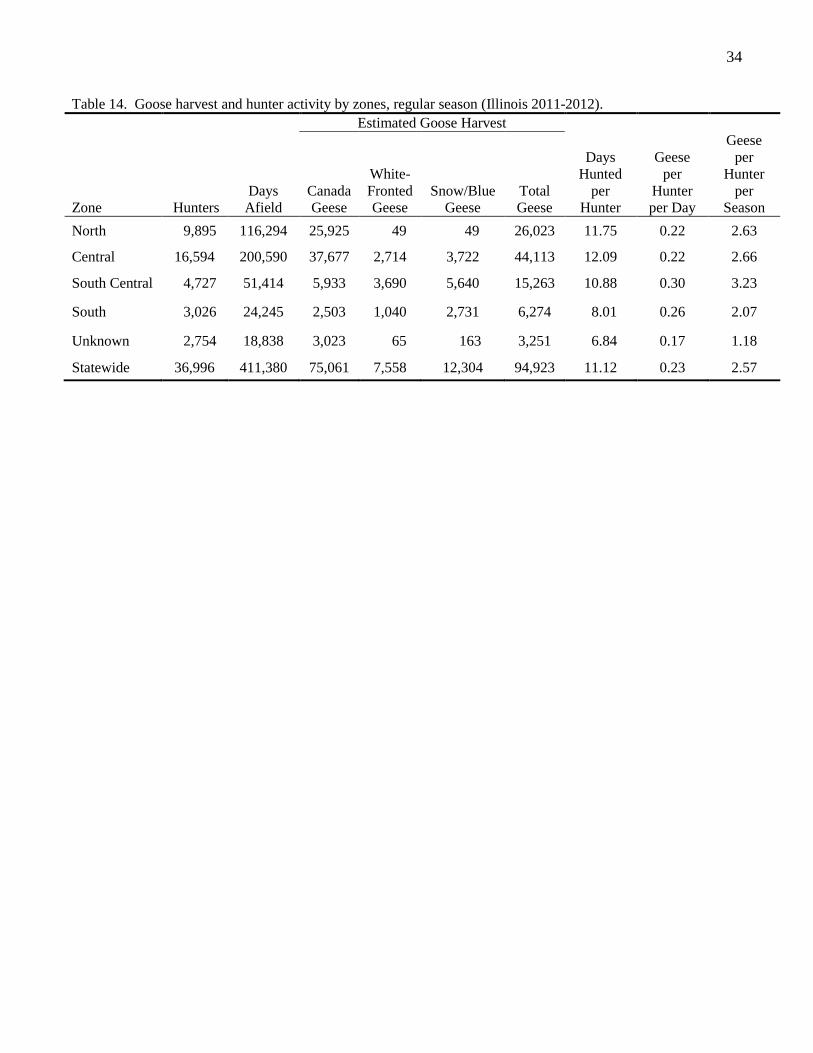
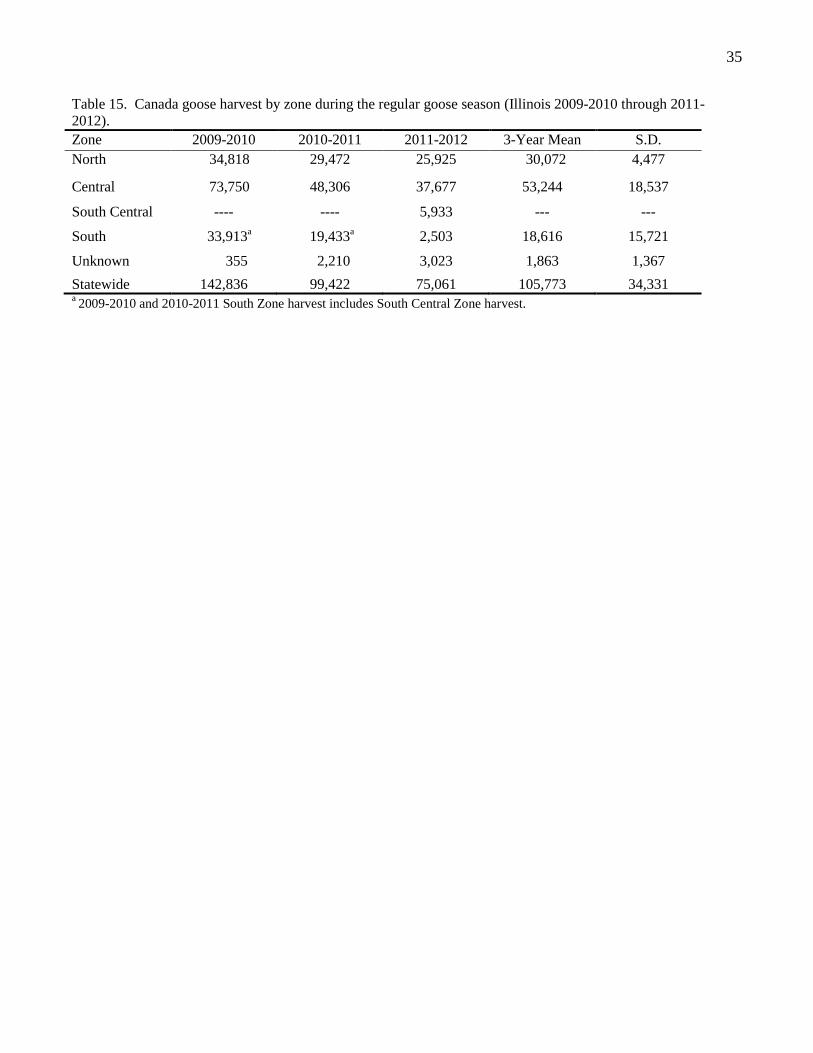
The Central Zone led the state in the number of goose hunters (45%, Table 14), days afield
(49%), and both Canada goose (50%) and total goose harvest (47%). Harvest of Canada geese is
summarized by zone and year (2009-2010 through 2011-2012) in Table 15.
79%
21%
Canada Geese Other Geese
0
2
4
6
8
10
12
14
1 6 11 16 21 26 31 36 41 46 51 56
Pe
rce
nt
Days Afield
0
5
10
15
20
25
30
35
0 5 10 15 20 25 30 35 40 45 50 55 >60
Pe
rce
nt
Geese Harvested
Harvest
15
Crippling Losses
Crippling losses (birds downed but not retrieved) were estimated at 64,268 ducks and 6,937
geese in Illinois during the 2011-2012 season (Table 16). These estimates, which are considered to be
indices because they contain information about the relative number and are not actual numbers or
abundance estimates, equate to 15.0 ducks and 7.3 geese lost per 100 harvested.
Waterfowl Hunting Effort and Public Duck Permits
Sixty percent of respondents indicated they hunt waterfowl every year in Illinois. The 40% of
hunters who do not hunt every year in Illinois is similar to the proportion of hunters who did not buy a
stamp this year (16%) and who bought a stamp but did not hunt waterfowl this year (24%). The
importance of these results is that ~40% of the waterfowl hunters may be “churn” hunters, hunters who
do not hunt waterfowl every year in Illinois.
Of the hunters who did not hunt waterfowl this past year, 25% indicated that they do not
waterfowl hunt in Illinois every year, 22% did not have enough time, and 22% indicated birds were not
available when they could hunt. Fifty-one percent of respondents prefer to hunt ducks and geese
equally, followed by 34% preferring to hunt ducks.
Illinois has many public hunting opportunities for waterfowl hunting. One opportunity is to
apply for duck permits before the season for various locations. Before the 2011-12 duck seasons began,
8% of hunters applied for these preseason duck permits. Hunters who applied for duck permits hunted
more days for ducks (M = 12.66 days) than hunters who did not apply (M = 8.93 days) for duck permits.
The majority (76%) had applied for these permits in a previous year, and 86% of hunters that applied for
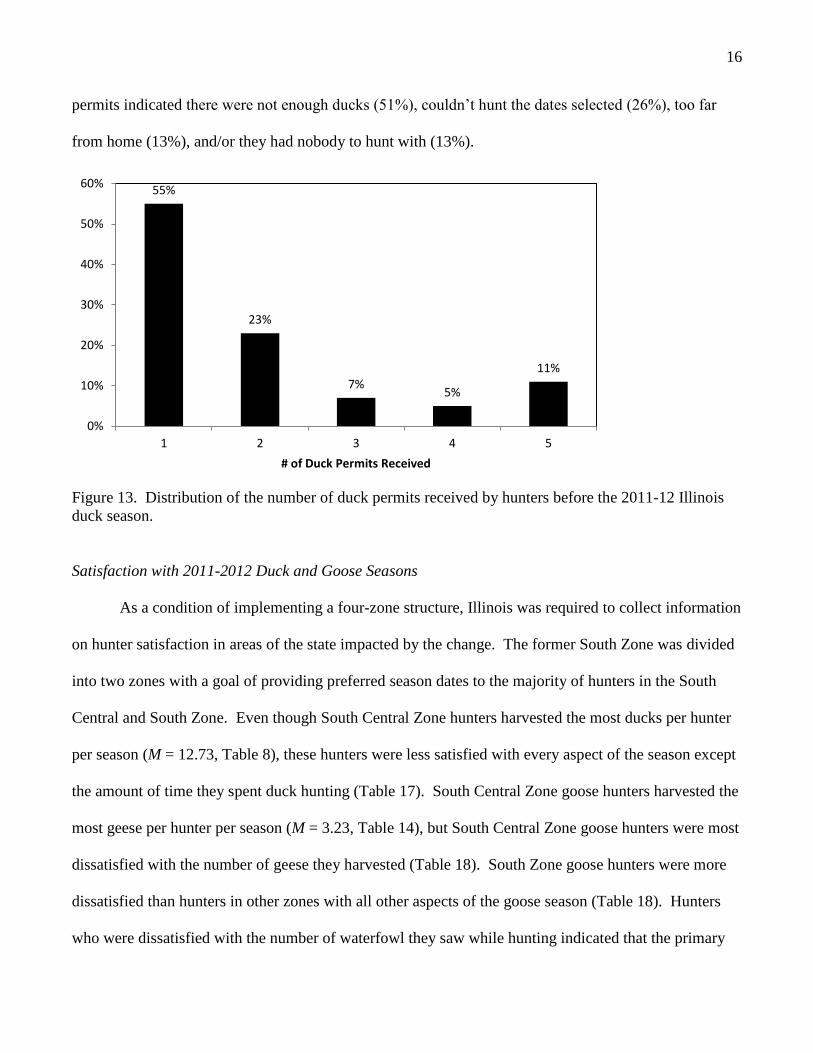
permits received a permit. The majority of hunters who received duck permits received one (55%) or
two (23%) permits (Figure 13). Sixty-eight percent of hunters who received their permits used all (50%)
or some (18%) of their permits; the remaining 32% of hunters who received and did not use their
16
permits indicated there were not enough ducks (51%), couldn’t hunt the dates selected (26%), too far
from home (13%), and/or they had nobody to hunt with (13%).
Figure 13. Distribution of the number of duck permits received by hunters before the 2011-12 Illinois
duck season.
Satisfaction with 2011-2012 Duck and Goose Seasons
As a condition of implementing a four-zone structure, Illinois was required to collect information
on hunter satisfaction in areas of the state impacted by the change. The former South Zone was divided
into two zones with a goal of providing preferred season dates to the majority of hunters in the South
Central and South Zone. Even though South Central Zone hunters harvested the most ducks per hunter
per season (M = 12.73, Table 8), these hunters were less satisfied with every aspect of the season except
the amount of time they spent duck hunting (Table 17). South Central Zone goose hunters harvested the
most geese per hunter per season (M = 3.23, Table 14), but South Central Zone goose hunters were most
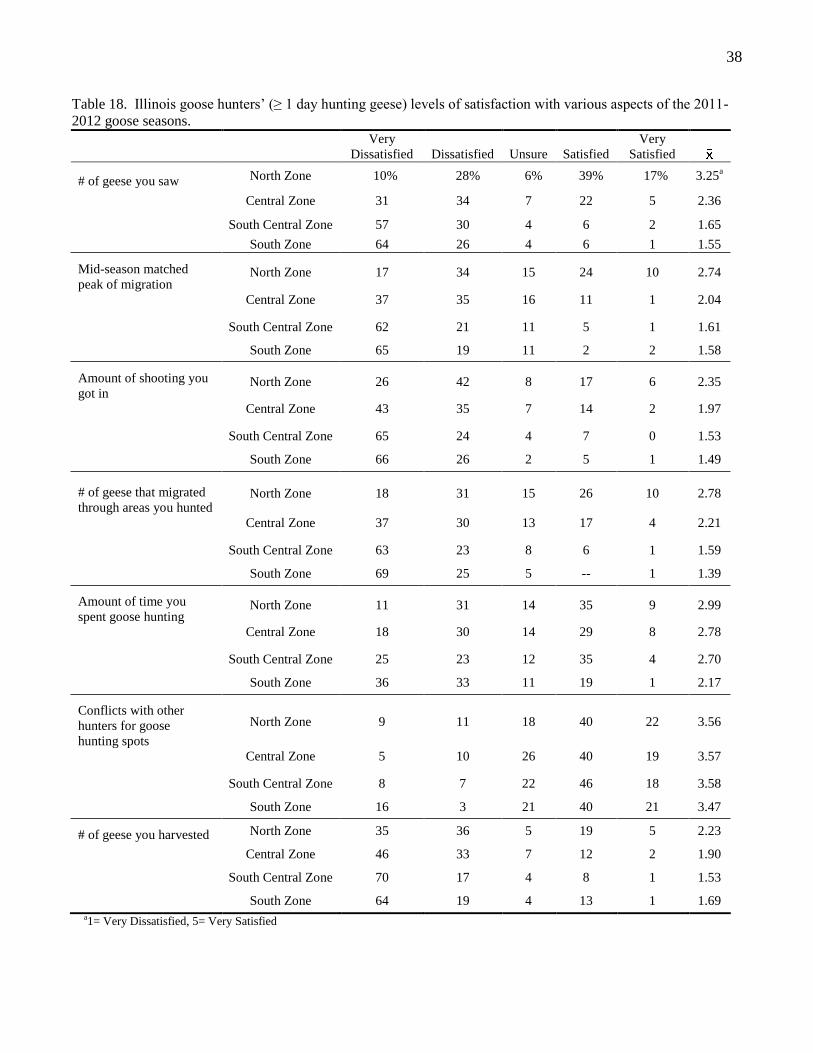
dissatisfied with the number of geese they harvested (Table 18). South Zone goose hunters were more
dissatisfied than hunters in other zones with all other aspects of the goose season (Table 18). Hunters
who were dissatisfied with the number of waterfowl they saw while hunting indicated that the primary
55%
23%
7% 5%
11%
0%
10%
20%
30%
40%
50%
60%
1 2 3 4 5
# of Duck Permits Received
17
reason they were dissatisfied was due to the warm weather/no snow up north for both duck hunters
(90%) and goose hunters (93%), which is not manageable by wildlife biologists (Table 19).
Waterfowl Hunting Videos
Numerous waterfowl hunters have perceived a market segment for the production of waterfowl
hunting videos. Consequently, who is watching these videos, what these videos convey to the viewers,
and whether these videos have any effects on the hunters watching them is currently unknown.
Specifically, anecdotal evidence suggested younger hunters are watching these videos and watching
them frequently, and observational data suggested younger hunters are more interested in obtaining
waterfowl bands than older hunters. Therefore, we hypothesized that hunters who watch videos will 1)
prefer a banded bird as their first choice over three other bag types (i.e., ranked 1 out of 4), and 2) rank a
banded bird higher than a 4.
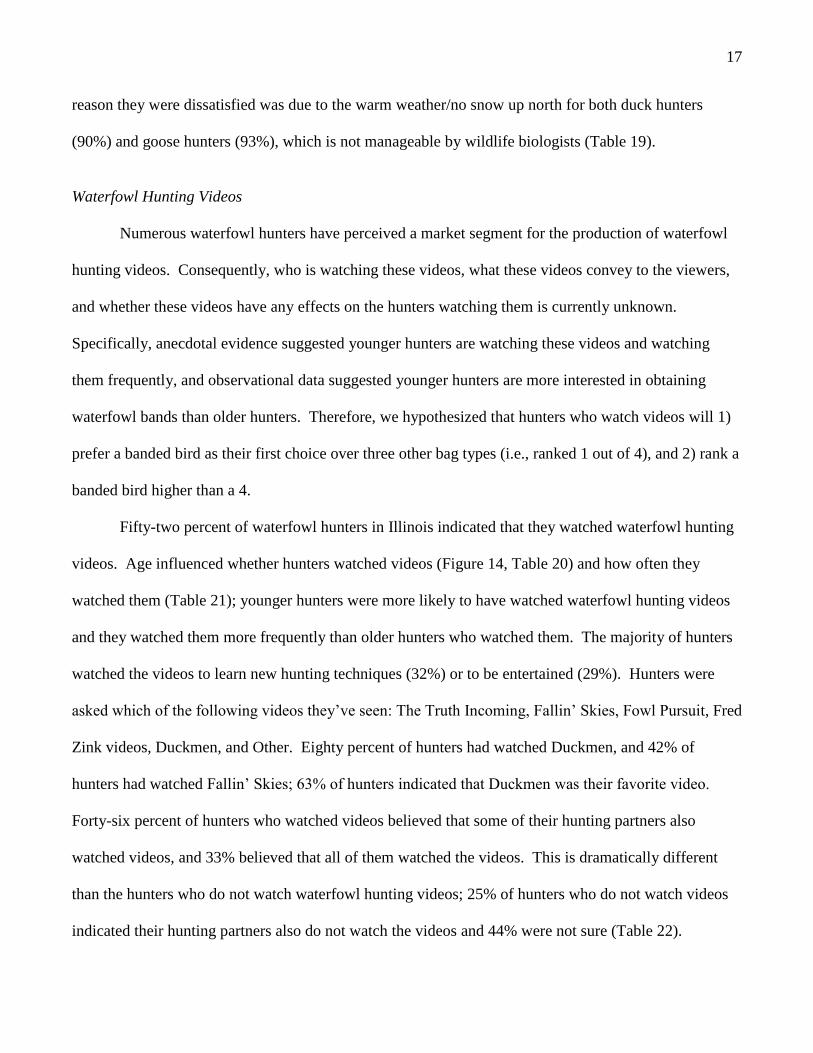
Fifty-two percent of waterfowl hunters in Illinois indicated that they watched waterfowl hunting
videos. Age influenced whether hunters watched videos (Figure 14, Table 20) and how often they
watched them (Table 21); younger hunters were more likely to have watched waterfowl hunting videos
and they watched them more frequently than older hunters who watched them. The majority of hunters
watched the videos to learn new hunting techniques (32%) or to be entertained (29%). Hunters were
asked which of the following videos they’ve seen: The Truth Incoming, Fallin’ Skies, Fowl Pursuit, Fred
Zink videos, Duckmen, and Other. Eighty percent of hunters had watched Duckmen, and 42% of
hunters had watched Fallin’ Skies; 63% of hunters indicated that Duckmen was their favorite video.
Forty-six percent of hunters who watched videos believed that some of their hunting partners also
watched videos, and 33% believed that all of them watched the videos. This is dramatically different
than the hunters who do not watch waterfowl hunting videos; 25% of hunters who do not watch videos
indicated their hunting partners also do not watch the videos and 44% were not sure (Table 22).
18
Figure 14. The influence of age on whether Illinois waterfowl hunters watched waterfowl hunting
videos.
Hunters in Illinois indicated they preferred a 6-bird limit of a mixed bag (39%) of ducks or 4
mallards (drakes and hens) and 2 other ducks (29%, Table 23). Waterfowl hunting videos influenced
hunters’ preferences for a banded bird; 45% of hunters who watched videos ranked a banded bird either
1-3, whereas only 29% of hunters who did not watch videos did the same. Hunters who ranked a
banded bird higher than a 4 were younger and had also been hunting waterfowl for fewer years.
Hunter Characteristics
Respondents who hunted waterfowl during the 2011-2012 year have hunted waterfowl for an
average of 23 years, hunted waterfowl in Illinois for an average of 21 years, and were 46 years of age.
Duck hunters (hunters who hunted ducks more days than geese in 2011-2012) hunted on private land
owned by someone else most often (39%), state land/water (36%), and private land owned by
themselves (12%). Goose hunters (hunters who hunted geese more days than ducks) hunted on private
land owned by someone else most often (65%), private land under a lease (13%), and private land
owned by themselves (12%). Only 9% of these goose hunters hunted state land/water most often for
geese in Illinois. Forty-three percent of the respondents hunted doves during the 2011 dove season.
0%
10%
20%
30%
40%
50%
60%
70%
80%
<32 32-47 48-62 >62
Pe
rce
nt
Age
Yes, I watch videos
No, I do not watch videos

19
Hunters were asked whether adults should be able to hunt Canada geese if hunting with a youth during
the youth waterfowl hunting days; 51% of hunters who took a youth hunting during the 2011 youth
waterfowl hunting days supported adults hunting Canada geese during youth waterfowl hunting days.
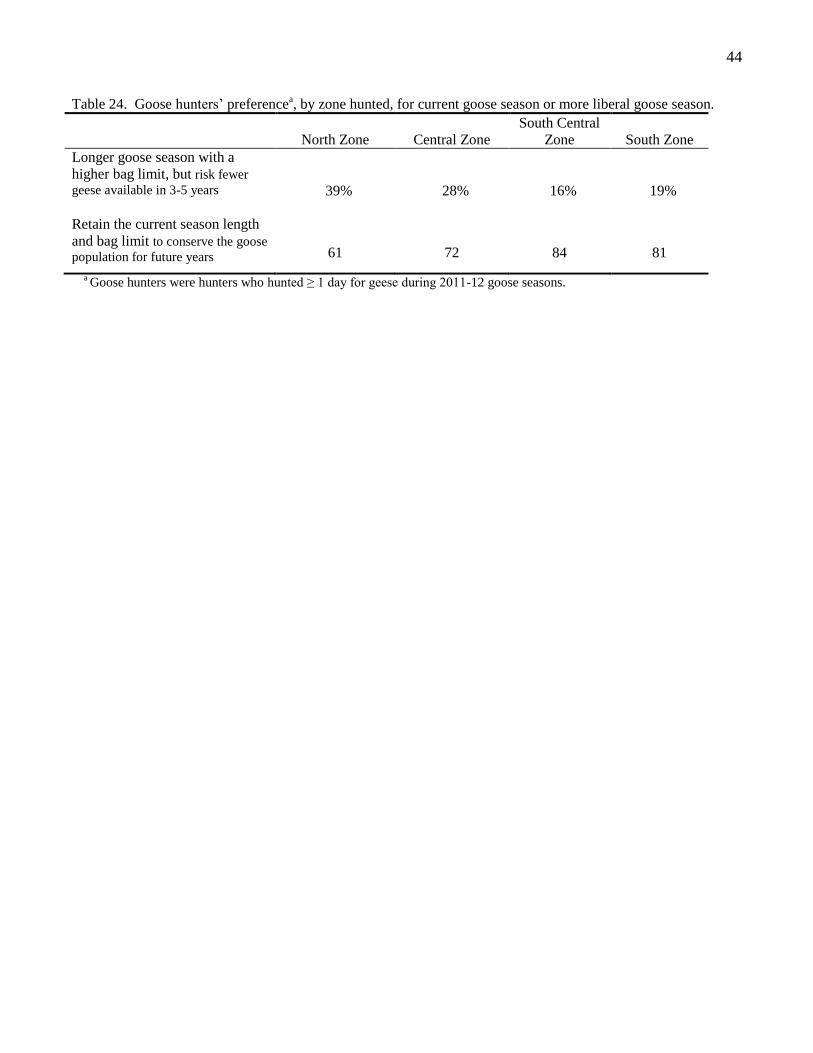
Due to discussions about liberalizing the Canada goose season in Illinois, hunters were asked whether
they prefer the current season length and bag limit or a longer goose season with a higher bag limit.
Hunters in all 4 zones indicated they want to retain the current season length and bag limit, and not risk
having fewer geese available in 3-5 years (Table 24). Hunters and non-hunters were asked questions
about waterfowl hunting, and these results can be located in Table 25.

20
REFERENCES
Alessi, M.G., C.A. Miller, and L.K Campbell. 2011. 2010-2011 Illinois Waterfowl Hunter Survey:
Behavior, Attitudes, and Participation of Waterfowl Hunters. Job Completion Report, Federal
Aid in Wildlife Restoration W-112-R-20. Human Dimensions Research Program Report HR-11-
03/INHS Technical Report 2011 (24). Illinois Natural History Survey, Champaign, IL. 61 pp.
Anderson, W.L., 1986. Illinois waterfowl harvest, hunter activity, zones for Carlyle Lake, and
shotguns, ammunitions, and boats used in 1984. Illinois Department of Natural History
Survey Resources, Waterfowl Program, Periodical Report 54. 32pp.
________, R.W. Marshalla, R.M. Whitton, and D.J. Holm. 1998. Illinois waterfowl harvest, hunter
activity, and attitudes toward youth waterfowl hunting day, quality hunting, and duck/goose
regulations, plus sex/age of hunters, 1996-97 season. Illinois Department of Natural Resources,
Waterfowl Program, Periodical Report 95. 79pp.
________, D.D. Thornburg, and R.M. Whitton. 1996. Estimating Canada goose harvest in southern
Illinois quota zones. Wildlife Society Bulletin 24:233-237.
________, and R.A. Williamson. 1994. Illinois waterfowl harvest, hunter activity, and attitudes toward
September teal season, duck shooting time, and goose hunting regulations, in 1992-93. Illinois
Department of Conservation, Waterfowl Program, Periodical Report 80. 58pp+appendix.
SPSS Inc. 2010. SPSS 19.0 for Windows. SPSS, Chicago, Illinois, USA.

21
Table 1. Summary of Illinois Migratory Waterfowl Stamps purchased, hunter activity, and waterfowl
harvest in Illinois from 1990 through 2011 hunting seasons.
Seasona
(Year) Stamps
Purchased Estimated Hunters
Estimated
Days Hunted Estimated
Waterfowl Harvested b
1990 c 55,009 (2,390)
d 55,152 708,391 270,796
1991 c
58,421 (2,130) 59,038 855,279 406,854
1992 51,261 (1,395) 51,274 714,550 292,535
1993 50,976 (995) 51,340 682,498 326,446
1994 57,543 (955) 53,226 816,185 332,803
1995 60,564 (665) 55,454 884,328 498,854
1996 62,417 (545) 56,956 836,793 376,248
1997 59,961 (480) 54,715 881,030 401,236
1998 54,550 (450) 50,288 795,561 471,072
1999 63,782 (350) 58,003 1,472,301 783,195
2000 62,701 (330) 56,954 1,115,076 708,092
2001 63,745 (300) 59,029 1,337,297 695,790
2002 61,345 (1,520) 53,428 1,054,047 504,616
2003 61,991 (260) 57,985 1,251,974 650,906
2004 60,264 54,803 1,083,910 494,775
2005 55,734 48,772 868,299 526,221
2006 63,965 58,302 1,194,801 700,571
2007 66,765 57,454 1,150,304 678,623
2008 69,590 59,379 1,175,243 660,306
2009 68,549 59,987 1,222,980 613,335
2010 64,828 50,936 985,075 513,882
2011 66,581 52,660 1,147,037 577,654 a1981-1989 information can be located in Alessi et al. (2011). bTeal, ducks, coots, and geese combined, and including September Teal and Canada goose seasons and
youth hunt. The U.S. Fish and Wildlife Service suspended the September Teal season in 1988 through 1991. cEstimates of waterfowl hunters and days afield for these years reduced to 92.48% - 96.48% of the original
estimates. Estimates of waterfowl (Teal, ducks, Coots, and geese combined) harvested reduced to
94.54% - 97.74% of original estimates. See Anderson and Williamson (1994) for explanation. d Stamps purchased for commercial art purposes. These stamps were not included in the numbers to the left.
22
Table 2. The percentage of waterfowl hunters who hunted exclusively ducks, exclusively geese, or both
ducks and geese in Illinois from 1990 through 2011 seasons.
Seasona
(Year)
Hunted
Ducks
Only
Hunted
Geese Only
Hunted
Both Ducks and
Geese
Duck
Hunters
Goose
Hunters
1990 26.7% 29.7% 43.6% 70.3% 73.3%
1991 26.0% 27.3% 46.7% 72.7% 74.0%
1992 31.3% 23.4% 45.3% 76.6% 68.7%
1993 30.9% 20.2% 48.9% 79.8% 69.1%
1994 30.3% 16.5% 53.2% 83.5% 69.7%
1995 33.2% 23.4% 43.4% 76.6% 66.8%
1996 35.8% 22.3% 41.9% 77.7% 64.2%
1997 38.8% 22.2% 39.0% 77.8% 61.2%
1998 47.6% 17.0% 35.4% 83.0% 52.4%
1999 27.2% 10.6% 62.2% 89.4% 72.8%
2000 34.0% 23.1% 42.9% 76.9% 66.0%
2001 33.0% 9.9% 57.1% 90.1% 67.0%
2002 33.8% 10.2% 56.0% 89.8% 66.2%
2003 32.3% 12.6% 55.1% 87.4% 67.7%
2004 32.1% 10.5% 57.4% 89.5% 67.9%
2005 37.2% 11.5% 51.3% 88.5% 62.8%
2006 28.8% 13.5% 57.7% 86.5% 71.2%
2007 27.7% 12.2% 60.1% 87.8% 72.3%
2008 25.9% 10.6% 63.5% 89.4%b
74.1%b
2009 27.5% 8.4% 64.1% 91.6%b
72.5%b
2010 25.0% 13.1% 61.9% 86.9%b
75.0%b
2011 20.7% 18.3% 61.0% 81.7% 79.3%
a1981-1989 information can be located in Alessi et al. (2011). b 2008-2010 numbers changed to reflect responses in the sample

23
Table 3. Summary of Teal harvest and hunter activity during September Teal season (Illinois, 1990-2011).
Seasona
(Year)
Estimated Hunters
Hunters
Estimated Days Hunted
Estimated Teal Harvest
1990 b ------ ------ ------
1991 b ------ ------ ------
1992 7,696 18,265 12,069
1993 6,474 16,722 8,562
1994 8,062 20,341 12,436
1995 9,123 24,865 19,731
1996 8,964 22,825 11,565
1997 11,819 32,179 22,005
1998 10,307 33,049 21,270
1999 20,036 74,170 55,199
2000 14,733 52,229 38,597
2001 17,222 61,199 36,013
2002 10,171 29,381 12,542
2003 10,522 34,505 20,453
2004 8,097 23,928 8,463
2005 6,686 17,708 10,953
2006 12,378 43,223 28,016
2007 13,478 48,115 29,800
2008 14,652 52,365 19,981
2009 15,436 55,139 19,222c
2010 13,038 49,038 20,127c
2011 11,221 42,811 21,227c
a1981-1989 information can be located in Alessi et al. (2011). bThe September Teal season was suspended by the U.S. Fish and Wildlife Service during these years. cThe 95% confidence intervals are: 2009 = + 7,372, 2010 = + 9,322, and 2011= + 7,993.

24
Table 4. Teal harvest and hunter activity by zones during September Teal season (Illinois, 2011).
n
Estimated Hunters
Estimated Days Hunted
Estimated Teal Harvested
North Zone 66 2,244 8,705 2,828
Central Zone 164 5,577 22,783 9,983
South Zone 91 3,094 10,371 8,296
Unknown 9 306 952 120
Statewide 330 11,221 42,811 21,227

25
Table 5. Rates of Teal harvest and hunter activity during September Teal season (Illinois, 1990-2011).
Teal Harvest Per Hunter
Seasona
(Year)
Season Length/
Bag Limit
Days Hunted
Per Hunter
Per Day
Per Season
1990b ---- ---- ---- ----
1991b ---- ---- ---- ----
1992 9/4 2.37 0.66 1.57
1993 9/4 2.58 0.51 1.32
1994 9/4 2.52 0.61 1.54
1995 9/4 2.73 0.79 2.16
1996 9/4 2.55 0.51 1.29
1997 9/4 2.72 0.68 1.86
1998 16/4 3.21 0.64 2.06
1999 16/4 3.70 0.74 2.75
2000 16/4 3.55 0.74 2.62
2001 16/4 3.55 0.59 2.09
2002 9/4 2.89 0.43 1.23
2003 16/4 3.28 0.59 1.94
2004 9/4 2.96 0.35 1.05
2005 9/4 2.65 0.62 1.64
2006 16/4 3.49 0.65 2.26
2007 16/4 3.60 0.62 2.21
2008 16/4 3.57 0.38 1.36
2009 16/4 3.57 0.35 1.25
2010 16/4 3.76 0.41 1.54
2011 16/4 3.82 0.50 1.90
a1981-1989 information can be located in Alessi et al. (2011). bSeptember Teal season was suspended by the U.S. Fish and Wildlife Service during these years.

26
Table 6. Waterfowl harvest and hunter activity during Youth Waterfowl Hunting Days, 2000 -2011.
Seasona
(Year)
Adult
Participation
Youth
Participation
Days
Hunting
Mean Youths/
Hunting Party
2000b 6,815 10,107 14,079 1.48
2001b 9,140 15,148 22,525 1.67
2002b 8,498 13,325 19,548 1.57
2003b
7,415 11,419 17,985 1.54
2004b 5,603 7,891 12,997 1.41
2005b 4,540 6,489 10,268 1.58
2006b 5,447 8,024 11,903 1.48
2007b
6,259 8,981 14,356 1.60
2008b
6,402 9,878 14,799 1.50
2009b
7,073 9,772 15,922 1.63
2010b
5,471 7,452 11,828 1.59
2011b
6,325 8,642 14,059 1.63
Year
Total
Ducks
Ducks/
Youth/Day
Total
Coots
Coots/ Youth/
Day
Total
Geese
Geese/ Youth/
Day
2000 b
8,388 0.60 38 <0.01 882 0.06
2001 b
11,727 0.52 480 0.02 971 0.04
2002 b
9,085 0.46 271 0.01 887 0.05
2003b
9,184 0.51 178 0.01 1,116 0.06
2004 b
7,477 0.58 48 <0.01 561 0.04
2005 b
5,644 0.55 583 0.06 965 0.09
2006 b
9,863 0.83 133 0.01 732 0.06
2007b
9,141 0.64 850 0.06 1,701 0.12
2008b
10,380 0.70 241 0.02 1,466 0.10
2009b
11,229 0.71 599 0.04 2,396 0.15
2010b
9,156 0.77 419 0.04 1,420 0.12
2011b
9,569 0.68 1,333 0.09 1,318 0.09
a1981-1989 information can be located in Alessi et al. (2011). b Two day season.

27
Table 7. Summary of duck and coot harvest and hunter activity during the regular duck season (Illinois 1990-
2011).
Number of Ducks
Seasona
(Year) Hunters Days Afield Mallards
Wood
Ducks
Other
Ducks Total Coots
1990b 38,759 350,119 112,370 33,253 51,562 197,185 2,287
1991b 42,911 393,247 177,221 49,556 80,793 307,570 1,101
1992 39,272 362,275 124,112 34,280 58,035 216,427 3,275
1993 40,941 366,656 134,334 39,906 43,360 217,600 1,445
1994 44,447 475,264 137,263 44,683 64,998c
246,944 3,880
1995 42,499 482,620 230,505 47,155 99,632c
377,292 3,386
1996 44,219 460,517 163,311 38,783 82,431c
284,525 3,286
1997 42,587 514,934 145,533 44,678 100,950c
291,161 3,935
1998 41,755 517,372 200,030 57,393 129,439c
386,862 2,920
1999 51,850 860,368 311,325 69,930 181,650c
562,905 3,654
2000 43,810 621,542 271,903 58,604 166,834c
497,341 2,206
2001 53,194 797,884 305,180 61,515 167,883c
534,578 2,904
2002 47,964 642,542 197,392 46,238 106,213c
349,843 1,743
2003 50,658 738,914 285,011 48,023 153,165c
486,199 1,693
2004 49,046 652,960 207,982 44,725 116,951c
369,658 1,607
2005 43,185 539,672 240,897 37,942 133,509c
412,348
2,186
2006 50,437 658,881 308,000 38,366 161,098c
507,464 3,065
2007 49,114 600,614 265,369 34,628 164,369c
464,366
3,771
2008 50,683 600,574 247,895 43,051 156,849
447,795 2,266
2009 49,648 626,832 228,211 41,549 129,795 399,555d
3,904e
2010 43,450 499,758 193,758 39,611 121,375 354,859d
1,770e
2011 46,619 632,712 222,405 54,294 150,786 427,484d
4,327e
a1981-1989 information can be located in Alessi et al. (2011). bEstimates of duck hunters, days afield, ducks and coots harvested for these years have been reduced to
92.48% - 96.48% of the original estimates. See Anderson and Williamson (1994) for explanation. cIncludes 3,760 Canvasback in 1994, 5,393 in 1995, 4,348 in 1996, 5,800 in 1997, 3,948 in 1998, 4,977 in 1999, 4,231 in
2000, 1,968 in 2001, 851 in 2002, 1,789 in 2003, 2,100 in 2004, 3,918 in 2005, 5,927 in 2006 and 5,925 in 2007. d The 95% confidence intervals are: 2009 = ± 69,698, 2010 = 60,571, and 2011 = 66,551 e The 95% confidence intervals are: 2009 = ± 3,342, 2010 = 2,435, and 2011 = 2,663
28
Table 8. Duck harvest and hunter activity by waterfowl zones and selected areas during the regular duck season
(Illinois 2011-2012).
Zone n Hunters
Estimated
Days Hunted
Estimated
Ducks
Harvested
Days
Hunted
per
Hunter
Ducks per
Hunter per
Day
Ducks per
Hunter per
Season
North 325 11,051 132,004 66,798 11.95 0.51 6.04
Central 633 21,525 306,274 205,659 14.23 0.67 9.55
South Central 217 7,379 114,968 93,954 15.58 0.82 12.73
South 161 5,475 65,186 53,885 11.91 0.83 9.84
Unknown 35 1,190 14,282 7,189 12.00 0.50 6.04
Statewide 1,371 46,619 632,712 427,484 13.57 0.68 9.17
29
Table 9. Rates of duck harvest and hunter activity during the regular duck season (Illinois 1990- 2011).
Season Length/
Bag Limit
Days Afield Per
Hunter
Duck Harvest Per Hunterb
Seasona
(Year)
Per Day
Per Season
1990 30/3(2,1) 9.03 0.54 4.90
1991 30/3(2,1) 9.16 0.72 6.57
1992 30/3(2,1) 9.22 0.57 5.22
1993 30/3(2,1) 8.96 0.58 5.21
1994 40/3(2,1) 10.96 0.51 5.47
1995 50/5(4,1) 11.36 0.74 8.40
1996 50/5(4,1) 10.41 0.58 6.03
1997 60/6(4,2) 12.09 0.57 6.84
1998 60/6(4,2) 12.39 0.75 9.27
1999 60/6(4,2) 16.59 0.65 10.86
2000 60/6(4,2) 14.19 0.80 11.36
2001 60/6(4,2) 15.00 0.67 10.05
2002 60/6(4,1) 13.40 0.54 7.29
2003 60/6(4,1) 14.59 0.66 9.60
2004 60/6(4,2) 13.31 0.57 7.54
2005 60/6(4,2) 12.50 0.76 9.55
2006 60/6(4,2) 13.06 0.77 10.06
2007 60/6(4,2) 12.23 0.77 9.45
2008 60/6(4,2) 11.85 0.75 8.84
2009 60/6(4,2) 12.63 0.64 8.05
2010 60/6(4,2) 11.50 0.71 8.17
2011 60/6(4,2) 13.57 0.68 9.17 a1981-1989 information can be located in Alessi et al. (2011).
b Excludes ducks harvested coincidentally while goose hunting.

30
Table 10. Distribution of the number of days afield and number of ducks harvested in 2011-2012. Number of
ducks harvested was calculated by taking responses and applying the correction factor (Anderson et al. 1986).
Days Hunting
Ducksa
Number of
Ducks
Harvested
0 --% 15%
1-5 35 38
6-10 21 17
11-15 13 11
16-20 11 6
21-25 6 4
26-30 5 2
>30 11 7 a Total is greater than 100 due to rounding

31
Table 11. Canada goose harvest and hunter activity during the early September Canada goose
season (Illinois 2000 -2011).
Year Waterfowl Zone
Statewide North Central South Unknown
Hunters 2000 13,289 5,410 6,908 971 0
2001 20,359 7,318 10,807 2,085 149
2002 12,459 4,517 6,665 1,135 142
2003 14,973 5,532 7,761 1,348 332
2004 11,170 4,250 6,220 984 0
2005 9,448 3,949 5,034 1,085 0
2006 12,609 4,848 6,607 1,154 0
2007 12,788
4,723 6,413 1,652 0
2008 13,157
4,934 6,690 1,533 0
2009 15,102 5,232 8,089 1,781 0
2010 11,015 3,918 5,813 1,285 0
2011 14,214 4,625 7,889 1,700 0
Days Afield 2000 47,831 17,396 27,078 3,357 0
2001 73,587 26,359 40,208 6,318 702
2002 39,485 14,303 21,049 4,092 41
2003 51,083 18,799 26,532 5,422 330
2004 37,941 14,279 19,670 2,592 0
2005 29,143 12,184 14,352 2,607 0
2006 42,444 16,735 22,621 3,088 0
2007 41,549 14,169 22,080 5,300 0
2008 45,637 17,305 23,174 5,158 0
2009 51,318 19,591 26,048 5,678 0
2010 39,019 15,929 19,236 3,854 0
2011 49,306 16,832 27,441 5,033 0
Canada Geese 2000 15,897 6,191 8,774 932 0
2001 26,021 10,979 13,170 1,580 290
2002 21,534 8,971 11,130 1,433 0
2003 15,267 5,907 7,103 2,221 36
2004 13,587 6,319 5,915 767 0
2005 9,896 4,862 4,047 987 0
2006 14,578 6,771 6,717 1,090 0
2007 16,207 6,057 8,645 1,505 0
2008 17,419 7,343 8,951 1,125 0
2009 16,212 6,101 8,336 1,774 0
2010 17,115 7,967 7,859 1,289 0
2011 18,790 6,339 10,874 1,577 0

32
Table 12. Summary of goose harvest and hunter activity during the regular goose season (Illinois 1990-1991
through 2011-2012).
Seasona
(Year) Hunters Days Afield
Number of Geese
Canada Geese Other Geese Total
1990b 40,459 346,036 67,127 (1,515
c) 1,319 (97) 68,446 (1,612)
1991b 43,692 450,807 92,239 (1,245) 2,434 (70) 94,673 (1,315)
1992 35,253 334,010 59,352 (2,679) 1,412 (170) 60,764 (2,849)
1993 35,489 299,120 93,361 (1,260) 1,314 (82) 94,675 (1,342)
1994 37,090 320,580 67,790 (1,895) 1,753 (77) 69,543 (1,972)
1995 37,060 367,341 92,478 (4,034) 3,183 (245) 95,661 (4,279)
1996 36,582 339,253 65,864 (2,527) 4,939 (114) 70,803 (2,641)
1997 33,498 295,107 61,282 (4,772) 7,572 (438) 68,854 (5,210)
1998 26,343 202,676 43,222 (2,463) 4,290 (305) 47,512 (2,968)
1999 42,246 464,769 119,611 (1,846) 14,568 (152) 134,179 (1,998)
2000 37,593 383,367 128,387 (1,406) 16,356 (0) 144,743 (1,406)
2001 39,570 382,102 64,907 (1,761) 18,189 (263) 83,096 (2,024)
2002 35,352 323,091 89,297 (3,259) 19,414 (1,433) 108,711 (4,692)
2003 39,275 409,487 83,207 (1,526) 10,458 d (342) 93,665
d (1,868)
2004 37,189 345,279 81,859 (3,418) 8,231 (349) 90,090 (3,767)
2005 30,614 271,708 74,293 (1,653) 9,353 (62) 83,646 (1,715)
2006 41,521 438,350 122,294 (1,338) 14,426 (869) 136,720 (2,207)
2007 43,046 445,670 141,205 (404) 11,582 (55) 152,787
(459)
2008 44,404 461,868 142,806 (590) 17,956 (0) 160,762 (590)
2009 44,601 473,769 142,836 (585) 17,382 (355) 160,218e (940)
2010 36,803 385,432 99,422 (534) 9,594 (46) 109,016e (580)
2011 36,996 411,380 75,061(618) 19,862 (33) 94,923e (651)
a1981-1989 information can be located in Alessi et al. (2011). bThe estimates of goose hunters and days hunted for these years have been reduced to 92.48%-96.48% of the
original estimates. The estimates for geese harvested have not been reduced (Anderson and Williamson 1994). cNumber of geese harvested while duck hunting.
dReduced by 23,151 from estimate given in 2002 report to exclude Conservation Order snow goose harvest.
eThe 95% confidence intervals are : 2009 = + 36,569, 2010 = + 22,523, and 2011= 22,387.

33
Table 13. Distribution of the number of days afield and number of geese harvested. Number of geese harvested
was calculated by taking responses and applying the correction factor (Anderson et al. 1996).
Days Hunting
Geesea
Number of Geese
Harvesteda
0 --% 31%
1-5 45 55
6-10 22 9
11-15 11 3
16-20 8 1
21-25 3 1
26-30 2 1
>30 10 1 a Total is greater than 100 due to rounding
34
Table 14. Goose harvest and hunter activity by zones, regular season (Illinois 2011-2012).
Zone
Estimated Goose Harvest
Hunters
Days
Afield
Canada
Geese
White-
Fronted
Geese
Snow/Blue
Geese
Total
Geese
Days
Hunted
per
Hunter
Geese
per
Hunter
per Day
Geese
per
Hunter
per
Season
North 9,895 116,294 25,925 49 49 26,023 11.75 0.22 2.63
Central 16,594 200,590 37,677 2,714 3,722 44,113 12.09 0.22 2.66
South Central 4,727 51,414 5,933 3,690 5,640 15,263 10.88 0.30 3.23
South 3,026 24,245 2,503 1,040 2,731 6,274 8.01 0.26 2.07
Unknown 2,754 18,838 3,023 65 163 3,251 6.84 0.17 1.18
Statewide 36,996 411,380 75,061 7,558 12,304 94,923 11.12 0.23 2.57
35
Table 15. Canada goose harvest by zone during the regular goose season (Illinois 2009-2010 through 2011-
2012).
Zone 2009-2010 2010-2011 2011-2012 3-Year Mean S.D.
North 34,818 29,472 25,925 30,072 4,477
Central 73,750 48,306 37,677 53,244 18,537
South Central ---- ---- 5,933 --- ---
South 33,913a
19,433a
2,503 18,616 15,721
Unknown 355 2,210 3,023 1,863 1,367
Statewide 142,836 99,422 75,061 105,773 34,331 a 2009-2010 and 2010-2011 South Zone harvest includes South Central Zone harvest.

36
Table 16. Summary of the number of ducks and geese crippled (Illinois 1990 - 2011 seasons).
Estimated Ducks Estimated Geese
Season a
(Year) Total Per 100 Bagged Total Per 100 Bagged
1990 b 59,007 29.9 23,895 34.9
1991 b 74,932 24.4 27,164 28.7
1992 68,027 31.4 18,631 32.1
1993 62,250 28.6 21,067 22.3
1994 65,266 26.4 16,234 23.3
1995 86,834 23.0 18,391 19.2
1996 64,324 22.6 16,641 23.5
1997 67,979 23.3 12,490 18.1
1998 74,679 19.3 5,514 11.6
1999 95,961 17.0 12,934 9.6
2000 70,423 14.2 10,071 7.0
2001 88,019 16.5 7,148 8.6
2002 59,005 16.9 6,382 5.9
2003 77,361 15.9 12,661 10.8
2004 63,765 17.2 9,433 10.5
2005 68,121 16.5 7,666 9.2
2006 83,648 16.5 14,110 10.3
2007 77,914 16.8 16,627 10.9
2008 74,044 16.5 14,166 8.8
2009 67,718 16.9 12,245 7.6
2010 57,388 16.2 9,217 8.5
2011 64,268 15.0 6,937 7.3 a1981-1989 information can be located in Alessi et al. (2011).
b The estimates of ducks and geese crippled for these years have been reduced to
92.48% - 96.48% of the original estimates. The estimates for the number of geese
crippled per 100 bagged have been similarly reduced. See Anderson and Williamson
(1994) for explanation.

37
Table 17. Illinois duck hunters’ (≥ 1 day hunting ducks) levels of satisfaction with various aspects of the 2011-
2012 duck seasons.
Zone
Very
Dissatisfied Dissatisfied Unsure Satisfied
Very
Satisfied # of Ducks you saw
North Zone 20% 32% 11% 29% 8% 2.74a
Central Zone 24 37 9 25 5 2.50
South Central Zone 31 39 9 18 3 2.23
South Zone 19 35 8 33 5 2.70
Mid-season matched
peak of migration North Zone 27 37 20 12 4 2.30
Central Zone 29 36 20 13 3 2.24
South Central Zone 39 29 18 13 1 2.07
South Zone 29 31 25 12 3 2.29
Amount of shooting you
got in North Zone 25 38 8 23 6 2.46
Central Zone 28 38 10 21 4 2.36
South Central Zone 25 40 13 19 3 2.34
South Zone 19 38 11 29 4 2.61
# of ducks that migrated
through areas you hunted North Zone 25 33 17 19 6 2.48
Central Zone 27 33 20 17 3 2.37
South Central Zone 31 38 15 14 2 2.17
South Zone 23 32 19 22 4 2.52
Amount of time you
spent duck hunting North Zone 11 30 10 36 13 3.10
Central Zone 13 31 13 36 7 2.94
South Central Zone 16 23 15 40 7 2.99
South Zone 10 33 15 39 3 2.92
Conflicts with other
hunters for duck hunting
spots
North Zone 9 13 19 36 23 3.52
Central Zone 7 10 25 42 16 3.51
South Central Zone 7 14 20 44 16 3.46
South Zone 7 12 21 43 17 3.52
# of ducks you harvested North Zone 32 35 7 22 3 2.29
Central Zone 31 36 8 21 3 2.30
South Central Zone 35 31 8 23 3 2.28
South Zone 24 37 6 30 3 2.52
a1= Very Dissatisfied, 5= Very Satisfied
38
Table 18. Illinois goose hunters’ (≥ 1 day hunting geese) levels of satisfaction with various aspects of the 2011-
2012 goose seasons.
Very
Dissatisfied Dissatisfied
Unsure Satisfied
Very
Satisfied
# of geese you saw North Zone 10% 28% 6% 39% 17% 3.25a
Central Zone 31 34 7 22 5 2.36
South Central Zone 57 30 4 6 2 1.65
South Zone 64 26 4 6 1 1.55
Mid-season matched
peak of migration North Zone 17 34 15 24 10 2.74
Central Zone 37 35 16 11 1 2.04
South Central Zone 62 21 11 5 1 1.61
South Zone 65 19 11 2 2 1.58
Amount of shooting you
got in North Zone 26 42 8 17 6 2.35
Central Zone 43 35 7 14 2 1.97
South Central Zone 65 24 4 7 0 1.53
South Zone 66 26 2 5 1 1.49
# of geese that migrated
through areas you hunted North Zone 18 31 15 26 10 2.78
Central Zone 37 30 13 17 4 2.21
South Central Zone 63 23 8 6 1 1.59
South Zone 69 25 5 -- 1 1.39
Amount of time you
spent goose hunting North Zone 11 31 14 35 9 2.99
Central Zone 18 30 14 29 8 2.78
South Central Zone 25 23 12 35 4 2.70
South Zone 36 33 11 19 1 2.17
Conflicts with other
hunters for goose
hunting spots
North Zone 9 11 18 40 22 3.56
Central Zone 5 10 26 40 19 3.57
South Central Zone 8 7 22 46 18 3.58
South Zone 16 3 21 40 21 3.47
# of geese you harvested North Zone 35 36 5 19 5 2.23
Central Zone 46 33 7 12 2 1.90
South Central Zone 70 17 4 8 1 1.53
South Zone 64 19 4 13 1 1.69 a1= Very Dissatisfied, 5= Very Satisfied

39
Table 19. Reported reasons for hunter dissatisfaction with number of waterfowl seen while hunting.
% of Dissatisfied
Duck Hunters1
% of Dissatisfied
Goose Hunters1
Warm weather/no snow up north 90% 93%
Lack of food 26 13
Too many refuge areas where ducks gather 21 20
Too high/too low water levels 15 7
Too many other hunters where I hunt 12 7
Other 27 13 1 Hunters were respondents who hunted ≥ 1 day for ducks or geese.

40
Table 20. Waterfowl hunting videos watching, by age Age
Do you watch waterfowl
hunting videos?
< 32 years
old
32-47 years
old
48-62 years
old
> 62 years
old
No 29% 41% 56% 64%
Yes 71 60 45 36

41
Table 21. Relationship between age and frequency of watching waterfowl hunting videos. Age
How often do you watch
waterfowl hunting videos?
< 32 years
old
32-47 years
old
48-62 years
old
> 62 years
old
Every week 16% 16% 12% 13%
3 times a month 25 12 14 16
5-12 times a year 34 38 31 30
< 5 times a year 26 33 44 41

42
Table 22. Comparison of watching waterfowl hunting videos and awareness
of hunters’ partners watching videos.
Do you watch waterfowl hunting videos?
Do your partners? Yes No
Yes, all of them 33% 5%
Yes, some of them 46 26
No 2 25
Not sure 20 44

43
Table 23. Illinois duck hunters’ preferences for duck harvest.
Type of bag
Rank
6-bird limit of a
mixed bag
< 6-bird limit,
but 4 drake
mallards
4 mallards and 2
other ducks
1 banded
duck
1 39% 17% 29% 18%
2 28 20 40 10
3 21 45 19 12
4 13 18 11 61
44
Table 24. Goose hunters’ preferencea, by zone hunted, for current goose season or more liberal goose season.
North Zone Central Zone
South Central
Zone South Zone
Longer goose season with a
higher bag limit, but risk fewer
geese available in 3-5 years
39%
28%
16%
19%
Retain the current season length
and bag limit to conserve the goose
population for future years
61
72
84
81
a Goose hunters were hunters who hunted ≥ 1 day for geese during 2011-12 goose seasons.

45
Table 25. Hunter and non-hunter response to various questions about waterfowl hunting.
Did not Hunt 2011-2012 Hunted in 2011-2012
Disagree Unsure Agree Disagree Unsure Agree
Waterfowl hunting is one of the most
important activities in my life.
55%
13%
32%
21%
6%
73%
I spend a lot of time in the offseason
planning for waterfowl hunting.
67
8
24
31
7
63
I am disappointed when I have no
waterfowl to show for my efforts.
49
9
43
27
5
69
I plan vacation time around
waterfowl seasons.
67
10
22
35
6
59
Some of my best days of waterfowl
hunting have been when I come
home empty-handed.
41
15
44
39
11
50
Hunting with friends and family is an
important part of my hunting.
7
2
90
3
1
97
Waterfowl hunting determines much
of my lifestyle.
69
10
21
35
11
54
Waterfowl hunting is a test of skill. 11 8 81 6 5 90
My closest friends are waterfowl
hunters.
27
11
63
13
4
82
I spend a lot of time before the
season scouting the area I will hunt.
64
11
25
37
8
55
I enjoy introducing new people to
waterfowl hunting.
27
19
54
12
15
73
Seeing waterfowl is important for a
satisfying hunt.
13
8
80
4
2
94
I would rather go waterfowl hunting
than do any other recreation.
72
10
19
33
11
57
I am disappointed if I do not get any
shots at waterfowl while hunting.
43
10
48
29
7
65
I hunt waterfowl for the challenge. 23 11 66 12 7 81
It takes skill to consistently harvest
waterfowl.
10
6
85
6
4
90

46
Appendix A
Illinois Waterfowl Hunter Survey
2011-2012 Season
Illinois Department of Natural Resources
Division of Wildlife Resources
and
Illinois Natural History Survey
The Department of Natural Resources is requesting disclosure of information that is necessary to
accomplish the statutory purpose as outlined under the Illinois Compiled Statutes, The Wildlife Code,
Chapter 520. Disclosure of information is voluntary. This study is funded by the federal Wildlife
Restoration Fund through your purchase of sporting arms and ammunition.
THANK YOU FOR YOUR COOPERATION!
All of your responses will be kept confidential.
Please return this survey in the postage-paid return envelope provided.
47
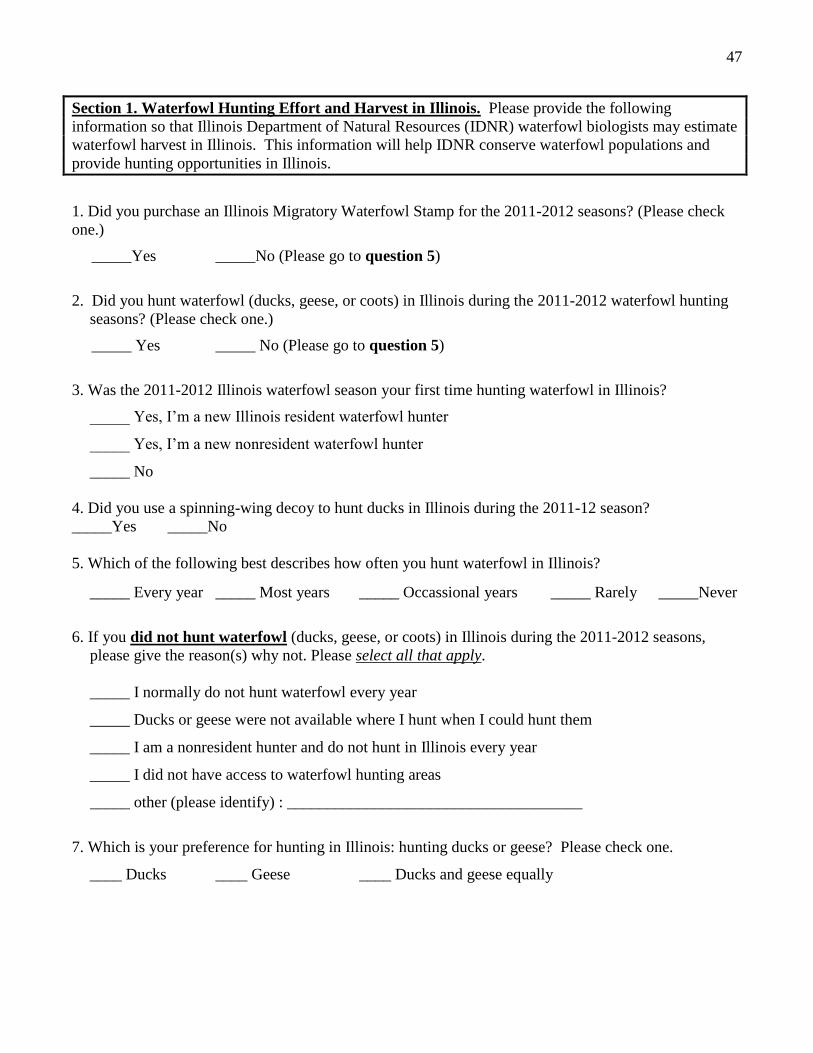
Section 1. Waterfowl Hunting Effort and Harvest in Illinois. Please provide the following
information so that Illinois Department of Natural Resources (IDNR) waterfowl biologists may estimate
waterfowl harvest in Illinois. This information will help IDNR conserve waterfowl populations and
provide hunting opportunities in Illinois.
1. Did you purchase an Illinois Migratory Waterfowl Stamp for the 2011-2012 seasons? (Please check
one.)
_____Yes _____No (Please go to question 5)
2. Did you hunt waterfowl (ducks, geese, or coots) in Illinois during the 2011-2012 waterfowl hunting
seasons? (Please check one.)
_____ Yes _____ No (Please go to question 5)
3. Was the 2011-2012 Illinois waterfowl season your first time hunting waterfowl in Illinois?
_____ Yes, I’m a new Illinois resident waterfowl hunter
_____ Yes, I’m a new nonresident waterfowl hunter
_____ No
4. Did you use a spinning-wing decoy to hunt ducks in Illinois during the 2011-12 season?
_____Yes _____No
5. Which of the following best describes how often you hunt waterfowl in Illinois?
_____ Every year _____ Most years _____ Occassional years _____ Rarely _____Never
6. If you did not hunt waterfowl (ducks, geese, or coots) in Illinois during the 2011-2012 seasons,
please give the reason(s) why not. Please select all that apply.
_____ I normally do not hunt waterfowl every year
_____ Ducks or geese were not available where I hunt when I could hunt them
_____ I am a nonresident hunter and do not hunt in Illinois every year
_____ I did not have access to waterfowl hunting areas
_____ other (please identify) : _____________________________________
7. Which is your preference for hunting in Illinois: hunting ducks or geese? Please check one.
____ Ducks ____ Geese ____ Ducks and geese equally

48
8. Did you apply online for IDNRs 2011 daily public duck permits (Rice Lake walk-in, Banner Marsh,
etc.)?
_____Yes _____No (Please go to Question 9)
Was this your first year applying for these permits? _____Yes _____No
Were you successfull in getting a permit? _____Yes _____No
If “Yes,” how many permits? ______ permits
If “Yes,” did you hunt using your permit(s)?
_____Yes, all permits ____Yes, some permits _____No
How many permits did you use? _____ permits used
If not, please provide the reason why not by choosing all that apply from the list below:
____ not enough ducks ____ site was iced over
____ poor habitat quality at site ____ too far from home
____ couldn’t hunt dates selected ____ no one to hunt with
____ other (please identify): ___________________________
If you did not hunt waterfowl in Illinois please go to Section 4
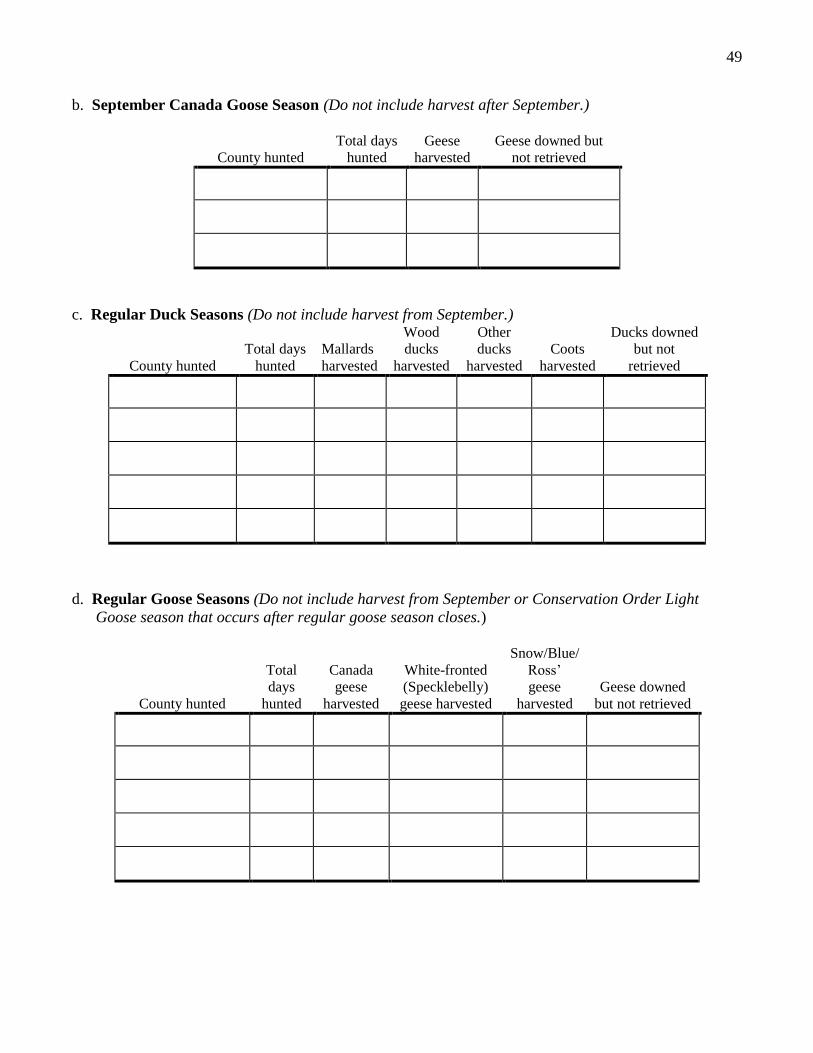
9. Please report your hunting effort and harvest in Illinois between September 2011 and January 2012 in
the following tables.
Include only your personal effort and harvest (DO NOT include harvests for party).
Count part of 1 day as 1 whole day.
Only report days hunted in the table for the species you targeted that day.
a. September Teal Season (Do not include harvest after September.)
County hunted
Total days
hunted
Teal
harvested
Teal downed but
not retrieved
49
b. September Canada Goose Season (Do not include harvest after September.)
County hunted
Total days
hunted
Geese
harvested
Geese downed but
not retrieved
c. Regular Duck Seasons (Do not include harvest from September.)
County hunted
Total days
hunted
Mallards
harvested
Wood
ducks
harvested
Other
ducks
harvested
Coots
harvested
Ducks downed
but not
retrieved
d. Regular Goose Seasons (Do not include harvest from September or Conservation Order Light
Goose season that occurs after regular goose season closes.)
County hunted
Total
days
hunted
Canada
geese
harvested
White-fronted
(Specklebelly)
geese harvested
Snow/Blue/
Ross’
geese
harvested
Geese downed
but not retrieved
50
10. In which zone did you hunt ducks most often during 2011-2012? (Please check one.)
____ North Zone ____ Central Zone ____South Central Zone ____ South Zone
11. In which of the following zones did you hunt opening day of duck season? (Please check all that
apply.)
____ North Zone ____ Central Zone ____South Central Zone ____ South Zone
12. Did you use the map provided with this questionnaire to determine the zone you hunted?
____ Yes ____ No
Section 2. Youth Hunts. Please answer the following questions about mentoring youth hunters in
Illinois. Please note: “Youths” are defined as hunters under 16 years old.
1. Did you take a youth (less than 16 years old) hunting during the 2011 Youth Waterfowl Hunting
Days?
____ Yes ____ No
If “Yes,” was this at least one youth’s first time duck or goose hunting?
____ Yes ____ No
a. For each youth you hunted with, please report information about all youths that hunted and enter 0
if the youth did not harvest any ducks, geese, or coots.
Age
Number
of Days
hunted
County
hunted
Mallards
harvested
Wood
ducks
harvested
Other
ducks
harvested
Geese
harvested
Coots
harvested
Youth 1
Youth 2
Youth 3
Youth 4
2. Have you ever introduced a hunter ≥ 16 years old to waterfowl hunting?
____ Yes ____ No

51
3. Did you take a youth (<16 years of age) hunting during the 2011-12 regular duck or goose seasons in
Illinois?
____ Yes If “Yes,” please check which season(s): ____ Regular Duck Season
____ Regular Goose Season ____ No
Section 3. Satisfaction. Please tell us about your satisfaction with the 2011-12 duck and/or goose
seasons by answering the following statements.
1. Please rate your SATISFACTION with the 2011-12 duck season in Illinois for each of the
following by circling the number that matches your response.
Very
Dissatisfied
Dissatisfied
Unsure
Satisfied
Very
Satisfied
Number of ducks you saw. 1 2 3 4 5
Mid-season matched peak of duck
migration.
1 2 3 4 5
Amount of shooting you got in. 1 2 3 4 5
Number of ducks that migrated through
areas you hunted.
1
2
3
4
5
Amount of time you spent duck hunting. 1 2 3 4 5
Conflicts with other hunters for duck
hunting spots.
1
2
3
4
5
Number of ducks you harvested. 1 2 3 4 5
2. Please rate your SATISFACTION with the 2011-12 regular Canada goose season in Illinois for
each of the following by circling the number that matches your response.
Very
Dissatisfied
Dissatisfied
Unsure
Satisfied
Very
Satisfied
Number of geese you saw. 1 2 3 4 5
Mid-season matched peak goose migration. 1 2 3 4 5
Amount of shooting you got in. 1 2 3 4 5
Number of geese that migrated through
areas you hunted.
1
2
3
4
5
Amount of time you spent goose hunting. 1 2 3 4 5
Conflicts with other hunters for goose
hunting spots.
1
2
3
4
5
Number of geese you harvested. 1 2 3 4 5

52
3. If you were dissatisfied with number of ducks seen while hunting, which of the following factors do
you feel contributed most to the lack of birds? Please check all that apply.
____ Warm weather/no snow up north ____ Too many refuge areas where ducks gather
____ Lack of food ____ Too high/too low water levels
____ Too many other hunters where I hunt
____ Other (Please identify): ____________________________
4. If you were dissatisfied with number of Canada geese seen while hunting during the regular goose
season, which of the following factors do you feel contributed most to the lack of birds? Please check
all that apply.
____ Warm weather/no snow up north ____ Too many refuge areas where geese gather
____ Lack of food ____Too high/too low water levels
____ Too many other hunters where I hunt
____ Other (Please identify): ____________________________
Section 4. Waterfowl Hunting Videos. A number of waterfowl hunting videos are available on the
market. Please tell us about your waterfowl video viewing to help us understand the role these videos
play in waterfowl hunting in Illinois.
1. Do you watch waterfowl hunting videos?
____ Yes
____ No (Please go to Section 5)
2. If “yes”, how often do you watch waterfowl hunting videos?
____ Every week ____ Between 5 and 12 times in the past year
____ About 3 times a month ____ Less than 5 times in the past year
3. Which of the following best describes why you watch waterfowl hunting videos? Please choose one
response.
____ to learn new hunting techniques ____ to learn about waterfowl
____ to get ideas where to take hunting trips ____ to see hunts in different locations
____ to be entertained ____ to watch ducks and geese get harvested
____ remind me of my own memorable hunts
53
4. Which of the following waterfowl hunting videos have you seen? Please check all that apply.
____The Truth Incoming (Primos) ____Fred Zink Videos
____Fallin’ Skies (Jeff Foiles) ____Duckmen (Duck Commander)
____Fowl Pursuit (Shawn Stahl)
____Other (Please identify): _____________________________
5. Which of the following waterfowl hunting videos are your favorites? Please check all that apply.
____The Truth Incoming (Primos) ____Fred Zink Videos
____Fallin’ Skies (Jeff Foiles) ____Duckmen (Duck Commander)
____Fowl Pursuit (Shawn Stahl)
____Other (Please identify): _____________________________
6. Do your waterfowl hunting partners watch waterfowl hunting videos?
____ Yes, all of them ____ Yes, some of them
____ No ____ Not sure
54
Section 5. Attitudes Toward Waterfowl Hunting. Please state if you agree or disagree with the
following statements by circling the number that matches your response.
Strongly
Disagree
Disagree
Slightly
Disagree
Unsure
Slightly
Agree
Agree
Strongly
Agree
Waterfowl hunting is one of the
most important activities in my
life.
1
2
3
4
5
6
7
I spend a lot of time in the off-
season planning for waterfowl
hunting.
1
2
3
4
5
6
7
I am disappointed when I have no
waterfowl to show for my efforts.
1
2
3
4
5
6
7
I plan vacation time around
waterfowl seasons.
1
2
3
4
5
6
7
________________________________________________________________________________________
Some of my best days of
waterfowl hunting have been
when I come home empty-handed.
1
2
3
4
5
6
7
Hunting with friends and family is
an important part of my hunting.
1
2
3
4
5
6
7
Waterfowl hunting determines
much of my lifestyle.
1
2
3
4
5
6
7
Waterfowl hunting is a test of
skill.
1 2 3 4 5 6 7
___________________________________________________________________________________
My closest friends are waterfowl
hunters.
1
2
3
4
5
6
7
I spend a lot of time before the
season scouting the area I will
hunt.
1
2
3
4
5
6
7
I enjoy introducing new people to
waterfowl hunting.
1
2
3
4
5
6
7
Seeing waterfowl is important for
a satisfying hunt.
1
2
3
4
5
6
7
________________________________________________________________________________________
I would rather go waterfowl
hunting than do any other
recreation.
1
2
3
4 5 6 7
I am disappointed if I do not get
any shots at waterfowl while
hunting.
1
2
3
4
5
6
7
I hunt waterfowl for the challenge. 1 2 3 4 5 6 7
It takes skill to consistently
harvest waterfowl.
1
2
3
4
5
6
7

55
Section 6. Background Information. The following questions allow us to understand more about the
people involved in waterfowl hunting in Illinois. All responses are kept confidential. 1. How many years total have you hunted waterfowl? ______ years
2. How many years have you hunted waterfowl in Illinois? ______ years
3. Did you hunt doves during the 2011-2012 season? ____ Yes ____ No
4. What is your county of residence? ________________________ County
5. Please give your age. ______ years
6. Should adults be able to hunt Canada geese when accompanying a youth during youth hunts? ____
Yes ____ No
7. Please give your preference for one of the following by checking the statement that matches your
preference:
____ a longer regular Canada goose season with a higher bag limit now, but risk fewer geese available
in 3-5 years
____ retaining the current season length and bag limit to conserve the goose population for future years
8. Which type of land do you hunt most often for waterfowl? Please choose one.
____ Private land owned by me
____ Private land owned by someone who gave me permission
____ Private land under a lease
____ state land/water
____ federal land/water
9. A quality duck hunt means different things to different hunters. Please rank in order from highest to
lowest the quality of the following harvests.
1 = Highest, 4 = Lowest
____6-bird Limit of mixed bag (gadwall, teal, mallards including some hens, wood ducks, etc.)
____Less than 6-bird limit, but 4 drake mallards
____6-bird limit: 4 mallards (hens and drakes) and 2 other ducks
____Only one duck, but with a band

56
Appendix B
February 1, 2012
Dear Waterfowl Hunter,
I am writing to ask for your help in a study of Illinois waterfowl hunters. This study, jointly conducted
by the Illinois Department of Natural Resources and the Illinois Natural History Survey, is an effort to
learn about waterfowl hunting activities in Illinois. Results of this study will help waterfowl managers
make decisions to improve hunting opportunities and to better manage Illinois’ duck and goose
populations.
You are part of a group of Illinois waterfowl hunters selected from throughout the state to provide
information about your hunting activities during the 2011-2012 waterfowl hunting seasons in Illinois.
Please take a few minutes to complete the enclosed questionnaire, even if you did not hunt ducks or
geese in Illinois during the 2011-2012 seasons. Please refer to the harvest record card we sent you in
September to complete the harvest portion of the questionnaire. We have included the Illinois waterfowl
zone map on the back of this letter if you need it to determine the zone you hunted.
Your responses are completely confidential. Your response to this questionnaire is completely
voluntary, and by responding you will help us effectively manage waterfowl and hunting in Illinois.
You may access the results of this and other studies of hunters and hunting in Illinois at
http://www.inhs.illinois.edu/programs/hd/. You may also find information about Illinois Department of
Natural Resources wildlife management programs and wildlife in Illinois at
http://dnr.state.il.us/orc/wildliferesources/.
ILLINOIS NATURAL HISTORY SURVEY Institute of Natural Resource Sustainability
University of Illinois at Urbana-Champaign

57
Appendix C

58
Appendix D
March 1, 2012
Dear Waterfowl Hunter,
As one of a select group of Illinois waterfowl hunters, you have been asked to provide information about
your waterfowl hunting activities. We recently mailed you a survey questionnaire regarding your
hunting experiences in Illinois during the 2011-2012 waterfowl season. We have not received your
completed questionnaire. Perhaps you recently mailed the questionnaire and it has not yet arrived in our
office. If so, we thank you.
If you have not returned your completed questionnaire to us, please do so as soon as possible. We have
enclosed another copy of the questionnaire. The information you and other selected hunters furnish
our biologists is vital for proper waterfowl management and allows us to safeguard waterfowl
populations while maximizing hunting opportunities.
This survey is limited to those hunters selected. Please take 15 minutes to complete the enclosed
questionnaire even if you were not successful. A stamped envelope is provided for you to return the
questionnaire to us.
Thank you for helping with this important study.
ILLINOIS NATURAL HISTORY SURVEY
Institute of Natural Resource Sustainability
University of Illinois at Urbana-Champaign

59
Appendix E
April 3, 2012
Dear Waterfowl Hunter,
As one of a select group of Illinois waterfowl hunters, you have been asked to provide information about
your waterfowl hunting activities. We recently mailed you a survey questionnaire regarding your
hunting experiences in Illinois during the 2011-2012 waterfowl season. We have not received your
completed questionnaire. Perhaps you recently mailed the questionnaire and it has not yet arrived in our
office. If so, we thank you.
If you have not returned your completed questionnaire to us, please do so as soon as possible. We have
enclosed another copy of the questionnaire. The information you and other selected hunters furnish
our biologists is vital for proper waterfowl management and allows us to safeguard waterfowl
populations while maximizing hunting opportunities.
This survey is limited to those hunters selected. Please take 15 minutes to complete the enclosed
questionnaire even if you were not successful. A stamped envelope is provided for you to return the
questionnaire to us.
Thank you for helping with this important study.
Institute of Natural Resource Sustainability
University of Illinois at Urbana-Champaign
ILLINOIS NATURAL HISTORY SURVEY

60
Appendix F