Human responses to lighting based on LED lighting … report concerns Human responses to lighting...
51
CRCE-RDD 01-2016 Human responses to lighting based on LED lighting solutions Commissioned by the Chartered Institution of Building Services Engineers and the Society of Light and Lighting
Transcript of Human responses to lighting based on LED lighting … report concerns Human responses to lighting...

CRCE-RDD 01-2016
Human responses to lighting based on LED lighting solutions
Commissioned by the Chartered Institution of Building Services Engineers and the Society of Light and Lighting

About Public Health England
Public Health England exists to protect and improve the nation's health and wellbeing, and
reduce health inequalities. It does this through world-class science, knowledge and intelligence,
advocacy, partnerships and the delivery of specialist public health services. PHE is an
operationally autonomous executive agency of the Department of Health.
Public Health England
133–155 Waterloo Road
Wellington House
London SE1 8UG
T: 020 7654 8000
www.gov.uk/phe
Twitter: @PHE_uk
Facebook: www.facebook.com/PublicHealthEngland
© Crown copyright 2016
You may re-use this information (excluding logos) free of charge in any format or medium, under
the terms of the Open Government Licence v3.0. To view this licence, visit OGL or email
[email protected]. Where we have identified any third party copyright information
you will need to obtain permission from the copyright holders concerned.
Published April 2016
PHE publications gateway number: 2015449
Mr S
Nicholas, S
imoncnicholas@
aol.com, 16:42P
M 13/05/2016,

CRCE-RDD 01-2016
This study was commissioned and funded by Chartered Institution of Building Services Engineers and the Society of Light and Lighting.
Centre for Radiation, Chemical and Environmental Hazards Public Health England Chilton, Didcot Oxfordshire OX11 0RQ
Approval: January 2016 Publication: April 2016 Contract report: CRCE-RDD 01-2016
This report from the PHE Centre for Radiation, Chemical and Environmental Hazards reflects understanding and evaluation of the current scientific evidence as presented and referenced in this document.
Human Responses to Lighting based on LED Lighting Solutions
Commissioned by the Chartered Institution of Building Services Engineers and the Society of Light and Lighting
L. L. A. Price, M. Khazova and J. B. O’Hagan
Abstract
LED technology is advancing rapidly and LEDs are being used for lighting in an increasingly
wide variety of situations. Energy efficiency data are favourable, but there is a lack of data
relating to the effects on health and lighting quality of the current generation of LED lighting
solutions. This report seeks to directly address the areas where data are lacking based on up
to date knowledge of human responses to light, and international exposure guidelines, applied
to measurements taken of a range of LED lighting products currently on sale to the public,
businesses and commissioners of outdoor lighting projects in the UK.
Mr
S N
icho
las,
Sim
oncn
icho
las@
aol.c
om, 1
6:42
PM
13/
05/2
016,

iii
Executive Summary
This report concerns Human responses to lighting based on LED lighting solutions and has
been produced by Public Health England, PHE, for the Chartered Institution of Building
Services Engineers, CIBSE, and the specialist professional body for lighting, the Society of
Light and Lighting, SLL.
A range of LED luminaires was tested, which is subdivided into three main categories:
Table 1: LED lighting applications
Application Description
Domestic use (or home use) LED replacements for light bulbs, spots and other energy efficient light bulbs
Office and commercial use LED panels, from smaller wall panels up to 600 mm square ceiling panels
Street lighting Overhead LED lighting typically used for roads and public areas
The health hazards and the positive impacts from lighting are not exclusive to LEDs, or even
to artificial light. LEDs are just one of many technologies used to create artificial light. The
importance of LEDs lies in their potential to provide increasingly ergonomically efficient lighting
for many applications. The current definition of energy efficiency used in lighting is based on
luminous flux. This definition does not always reflect the cost of producing the desired human
responses, because it concentrates on only one of a range of effects of lighting on the human
body, namely brightness.
It is also hard for energy efficiency measures to capture negative impacts or the changes in
the demands on lighting over 24 hours. With a wide choice of lighting technologies, the
appropriate measures, including energy efficiency measures, should be selected when
deciding which solution and lighting technology is appropriate for any given situation.
Inevitably, a balance must be struck between energy efficiency and competing factors.
The aim is to describe the light output measured with respect to the main human responses to
light as currently understood. The analysis is divided into three packages or work packages:
Table 2: Work package descriptions
Package Scope
Colour The colour, colour rendering and illuminance of a range of fixed brightness and dimmable LEDs
Flicker The variation in illuminance at high frequencies of a range of fixed brightness and dimmable LEDs
Spectrum The potential for LED street lighting at night to cause unwanted disruption to healthy circadian rhythms
AND
The ocular safety of all LED types measured against international exposure guidelines
Mr S
Nicholas, S
imoncnicholas@
aol.com, 16:42P
M 13/05/2016,

Mr
S N
icho
las,
Sim
oncn
icho
las@
aol.c
om, 1
6:42
PM
13/
05/2
016,

v
Contents
Abstract i
Executive Summary iii
1 Introduction 1 1.1 Colour 1 1.2 Flicker 1 1.3 Spectrum 2 1.3.1 Harm 3 1.3.2 Benefit 4 1.3.3 Effects on other species 4
2 Types of lamps and measurements 5 2.1 Design 6 2.2 Measurements 7 2.2.1 Spectral irradiance 7 2.2.2 Measurement positions for spectral irradiance 8 2.2.3 Modulation 8 2.2.4 Dimming and power 8
3 Colour package 9 3.1 Spectral irradiance and illuminance 9 3.2 Lamp colour 10 3.3 Colour quality and colour rendering 11 3.3.1 Colour Rendering Index and Colour Quality Scale 11 3.3.2 Gamut area and TM-30 12 3.3.3 Spectral richness metrics FSCI and Spectral Entropy 12
4 Flicker package 13 4.1 Flickering light 13 4.2 Quantifying flicker 13 4.2.1 Percent flicker 14 4.2.2 Flicker index 15 4.3 Safety 16 4.4 Dimming and effects on flicker and energy efficiency 16
5 Spectrum package 17 5.1 Circadian rhythms and non-visual effects of light 17 5.1.1 Regulation of circadian rhythms and disruption of sleep by light 17 5.1.2 The role of artificial lighting 18 5.2 Blue light hazard and hotspots 18 5.3 LED street lighting 19 5.4 LED tablets and e-readers 20
6 Domestic-class LEDs – results 21 6.1 Batch variation 21 6.2 Colour rendering and CCT 21 6.3 Flicker and dimming 23 6.4 Power consumption and dimming 27
Mr S
Nicholas, S
imoncnicholas@
aol.com, 16:42P
M 13/05/2016,

vi
6.5 Ocular safety 30 6.6 Miscellaneous issues 30
7 Office-class LEDs – results 32 7.1 Batch variation 32 7.2 Colour rendering and CCT 32 7.3 Flicker and dimming 33 7.4 Power consumption and dimming 33 7.5 Ocular safety 34 7.6 Miscellaneous issues 34
8 Street-class LEDs – results 35 8.1 Batch variation 35 8.2 Colour rendering and CCT 35 8.3 Flicker 36 8.4 Power consumption 37 8.5 Ocular safety 37 8.6 Miscellaneous issues 38
9 Conclusions 39 9.1 Flicker 39 9.2 Spectrum 40 9.3 Power consumption and dimming 41 9.4 Conclusion 41
10 References 42
Appendix A Flicker and other types of domestic lamp 44
Mr
S N
icho
las,
Sim
oncn
icho
las@
aol.c
om, 1
6:42
PM
13/
05/2
016,

1
1 Introduction
Light emitting diodes (LEDs) are being promoted for a wide range of lighting applications on
the basis of increased energy efficiency compared with some other technologies. However,
lighting quality and its positive or negative impact on human health are also important. This
report presents the results of a study of a varied purposive sample of over 100 LED lamps and
luminaires for domestic, office and street lighting. Up to 3 lamps from each model were tested.
Altogether there were 38 distinct LED models and 8 models of non-LED domestic lighting for
comparison.
The requested work was subdivided into three work packages summarised in Table 2 and
explained below: Colour, Flicker and Spectrum.
1.1 Colour
The colour package relates to the colour, colour rendering and illuminance of a range of fixed
brightness and dimmable LEDs (see Table 2 on page iii).
The two most widely used metrics of light are illuminance, EV, and correlated colour
temperature TCP, broadly speaking describing the amount and colorimetric blueness of
lighting. The quality of lighting has been measured using the International Commission on
Illumination (CIE) General CRI (Color Rendering Index), Ra. Due to the selection process of its
test colours, the CRI system represents a subjective solution to the colour rendering problem
as it relates to incandescent and fluorescent lighting.
The opportunity with LEDs to manipulate spectral power distributions, whilst maintaining
colour (or blueness), means that LEDs are often unfairly promoted or penalised by this scale.
Colour rendering phenomena have meant that it has never been possible to evaluate colour
appearance under lighting without considering spectrum, but the consequence of LED
technology in particular is that colour aspects of lighting are now more immediately linked with
the finer resolution of spectra than ever before.
This report considers the range of colour metrics and how well they represent an observer’s
experience of LEDs.
1.2 Flicker
The flicker package relates to the variation in illuminance at high frequencies of a range of
fixed brightness and dimmable LEDs (see Table 2 on page iii).
Flicker may occur because the output of a source is changing with time, or because of
movement of the source or the observer. Not everyone has the same sensitivity to flicker and
this presents challenges for unambiguous assessments. Traditionally, flicker has only been
considered in the frequency range that can be observed (up to about 80 Hz). However, some
people are sensitive to flicker at higher frequencies and possibly up to 1 kHz without there
being any visual sensation of the flicker. The visual system of the eye does provide a natural
filter for high frequencies and this is discussed later.
Mr S
Nicholas, S
imoncnicholas@
aol.com, 16:42P
M 13/05/2016,

2
Most sources operating from a 50 Hz mains supply will have a degree of flicker, but the
magnitude will be dependent on several factors. For example, an incandescent lamp will
flicker at 100 Hz, but due to the thermal inertia of the hot filament, this will manifest as a ripple
on the emitted optical radiation. With LEDs it is possible to modulate the drive current to the
emitter and the optical radiation emitted may follow that drive current with very little lag.
Methods used to dim some light sources may involve modulating the drive current and
therefore convert a source that does not flicker without the dimmer into one that does.
1.3 Spectrum
The spectrum package relates to risk versus benefit of human exposure to optical radiation.
The package is restricted to considering the potential for LED street lighting at night to cause
unwanted disruption to healthy circadian rhythms AND the ocular safety of all LED types measured against international exposure guidelines (see Table 2 on page iii).
Humans originally evolved under optical radiation from the sun. Whether the exposure is to
ultraviolet radiation, visible radiation (light) or infrared radiation, there is generally an optimum
level of exposure to the eye and/or the skin that provides maximum benefit (Figure 1). It
should be noted that there are no scales on the Figure: these depend on a range of factors, as
described below.
Figure 1: Risk vs Benefit curve for human exposure to optical radiation
For ultraviolet radiation, too much exposure is likely to trigger sunburn or photokeratitis in the
short-term and possibly cancer (of the eye or skin) in the long term. However, too little
ultraviolet radiation impacts on vitamin D status, which has implications for bone health. Light
Mr
S N
icho
las,
Sim
oncn
icho
las@
aol.c
om, 1
6:42
PM
13/
05/2
016,

3
is needed to be able to see, to entrain the circadian rhythm and has an alerting effect. Too
much light can cause dazzle, glare and afterimages and, at higher levels of exposure, eye or
skin injuries. However, there are times when the greatest benefit is from no light at all, for
example when trying to get to sleep. Therefore, knowledge of the activity being carried out
may be relevant. Insufficient exposure to infrared radiation, for completeness, may mean that
we get cold, whilst too much may cause over-heating or burns.
Metrics for both harm and benefit require knowledge of the spectrum and exposure profile of
optical radiation received by the person.
1.3.1 Harm
The International Commission on Non-ionizing Radiation Protection publishes guidelines on
exposure limits for human exposure to optical radiation (ICNIRP, 2004 and 2013). These
guidelines are quite mature and represent levels below which harm is very unlikely to occur in
most of the population.
The Control of Artificial Optical Radiation at Work Regulations 2010 refers to exposure limit
values in the Artificial Optical Radiation Directive of 2006 (EC, 2006). These exposure limits
are based on the ICNIRP guidelines, but for visible and infrared radiation refer to a 1997
edition. The Regulations require an assessment to determine if people at work who are
exposed to artificial optical radiation (including from light sources) are likely to exceed the
exposure limit values. This assessment can be theoretical if appropriate data are available. If
those at work are likely to exceed the exposure limits then measures need to be put into place
to ensure that those workers are not at risk.
When considering personal exposures, the Regulations also require the employer to take
account of workers who may be particularly photosensitive. However, this only needs to be
done if a worker reports that they are particularly photosensitive or if symptoms arise following
exposure to the source of optical radiation. There is no need for an employer to carry out this
specific assessment just in case an employee may be photosensitive. Whilst this requirement
applies only to employers and does not extend to persons who are not at work, there are
many situations in which a more general duty of care may apply.
When considering the exposure of an individual for comparison with the exposure limits, it is
important to consider what is reasonable. For example, unless there was a specific application
that required a worker to do so, intentional staring at optical radiation sources other than
screens or indicator lights would not be considered normal behaviour. It is also important to
recognise that the Regulations do not apply to people who are not workers (at that time).
However, the ICNIRP guidelines could be used as good practice for compliance with more
general health and safety legislation, such as the Health and Safety at Work etc. Act 1974 and
Regulations made under that Act, such as the Management of Health and Safety at Work
Regulations 1999.
The ICNIRP guidelines consider primarily two types of limits: those that have a maximum
value accumulated over a period of time, for example during a working day; and those that
have a peak instantaneous level that should not be exceeded. The former applies to the
ultraviolet limits and the blue light hazard and is termed “time-weighted averaging”, whereas
the latter applies to thermal hazards, often from intense short pulses. Time-weighted
averaging is an important concept because it can be used to take account of real exposure
Mr S
Nicholas, S
imoncnicholas@
aol.com, 16:42P
M 13/05/2016,

4
scenarios during a day. For example, someone may get very close to a source, but only for a
short time, and then spend longer times at some distance from the source.
Although exposure to light may not cause direct harm to the eye or the skin, it can still
compromise a person’s ability to carry out certain activities. For example a high luminance
source in an observer’s field of view may be a source of glare, which could be annoying or
compromise vision. Light incident on the eye may also cause distraction, glare and
afterimages with the impact on the individual being dependent on the activity they are trying to
carry out, the ambient light level (coupled with the degree of light adaptation) and age. In
general for illumination sources, these effects occur at exposure levels much lower than the
ICNIRP guideline levels for harm.
1.3.2 Benefit
The metrics for determining the beneficial effects of exposure to optical radiation are not as
well defined as those for harm. The beneficial effects are also likely to be dependent on
personal factors, such as the task being undertaken, time of day, prior light exposure history
and age. Minimising light at night is appropriate for most people to assist with good quality
sleep, although some people feel more comfortable with a low level of light at night. Light
during the day is needed to allow people to go about their daily lives and is important for
circadian rhythm entrainment. However, the specific optical radiation stimuli required and how
that interacts with exposure profile (timing) are still open to scientific debate.
The spectral luminous efficiency function, V(λ), provides a reasonable indicator for the visual
response of the eye to different wavelengths, but it does not directly account for requirements
of the individual carrying out specific tasks. Lucas et al (2014) proposed that spectral
measurements should be carried out in order to determine the impact of the optical radiation
on the five retinal sensors (three types of cones, the rods and the intrinsically photosensitive
retinal ganglion cells). It is important that any pre-receptoral filtration (particularly as the lens
changes with age) is taken into account. Using this approach, it is possible to compare
different spectra to determine the impact on a number of beneficial effects of light through the
eye pathway.
1.3.3 Effects on other species
This report concentrates on the impact of the optical radiation from LEDs on human health. It
does not specifically cover the impact on flora and fauna. However, it is recognised that most
living systems benefit from a 24 hour light/dark cycle.
The report does not specifically address issues relating to impact of LED lighting on dark skies
and light pollution. However, some of the findings will be relevant to the discussions in these
areas.
Mr
S N
icho
las,
Sim
oncn
icho
las@
aol.c
om, 1
6:42
PM
13/
05/2
016,
5
2 Types of lamps and measurements
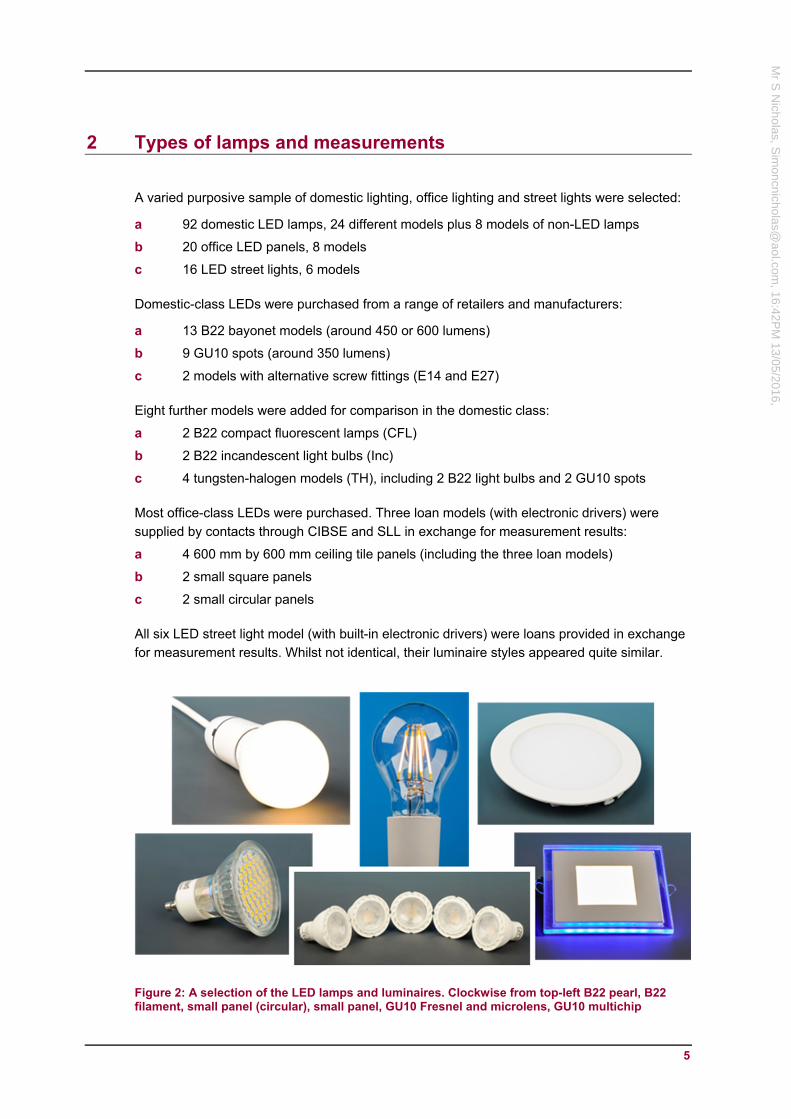
A varied purposive sample of domestic lighting, office lighting and street lights were selected:
a 92 domestic LED lamps, 24 different models plus 8 models of non-LED lamps
b 20 office LED panels, 8 models
c 16 LED street lights, 6 models
Domestic-class LEDs were purchased from a range of retailers and manufacturers:
a 13 B22 bayonet models (around 450 or 600 lumens)
b 9 GU10 spots (around 350 lumens)
c 2 models with alternative screw fittings (E14 and E27)
Eight further models were added for comparison in the domestic class:
a 2 B22 compact fluorescent lamps (CFL)
b 2 B22 incandescent light bulbs (Inc)
c 4 tungsten-halogen models (TH), including 2 B22 light bulbs and 2 GU10 spots
Most office-class LEDs were purchased. Three loan models (with electronic drivers) were
supplied by contacts through CIBSE and SLL in exchange for measurement results:
a 4 600 mm by 600 mm ceiling tile panels (including the three loan models)
b 2 small square panels
c 2 small circular panels
All six LED street light model (with built-in electronic drivers) were loans provided in exchange
for measurement results. Whilst not identical, their luminaire styles appeared quite similar.
Figure 2: A selection of the LED lamps and luminaires. Clockwise from top-left B22 pearl, B22 filament, small panel (circular), small panel, GU10 Fresnel and microlens, GU10 multichip
Mr S
Nicholas, S
imoncnicholas@
aol.com, 16:42P
M 13/05/2016,
6
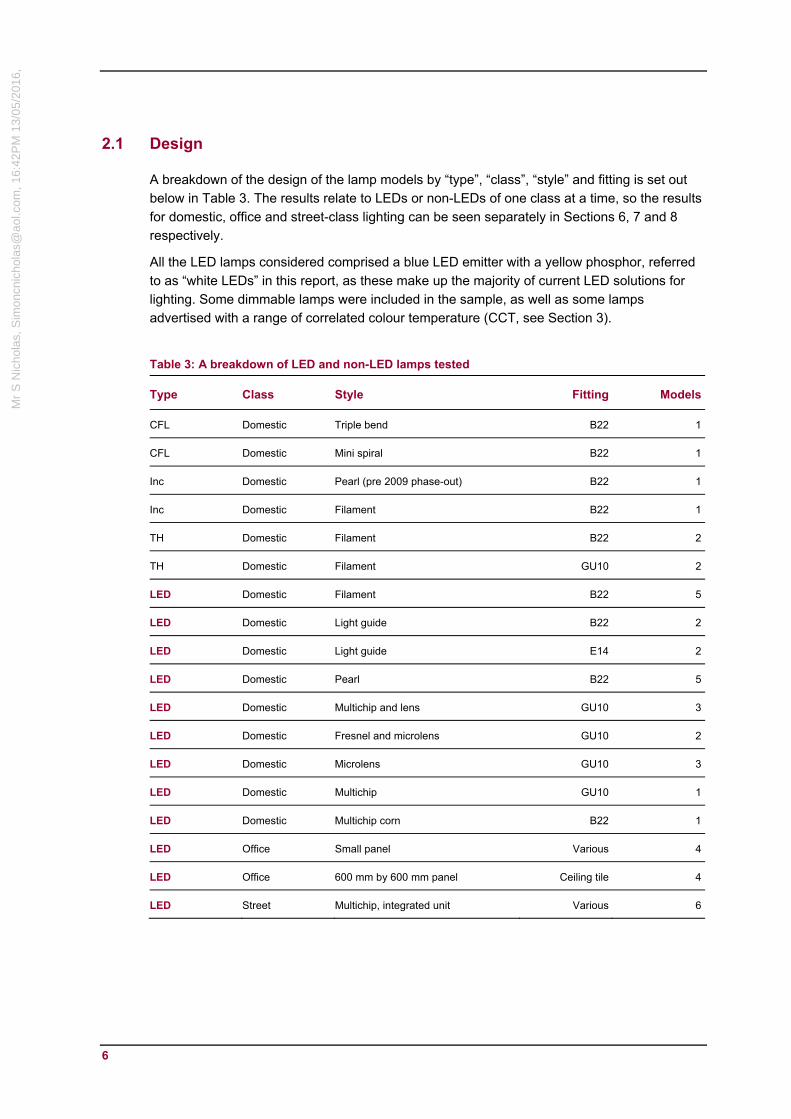
2.1 Design
A breakdown of the design of the lamp models by “type”, “class”, “style” and fitting is set out
below in Table 3. The results relate to LEDs or non-LEDs of one class at a time, so the results
for domestic, office and street-class lighting can be seen separately in Sections 6, 7 and 8
respectively.
All the LED lamps considered comprised a blue LED emitter with a yellow phosphor, referred
to as “white LEDs” in this report, as these make up the majority of current LED solutions for
lighting. Some dimmable lamps were included in the sample, as well as some lamps
advertised with a range of correlated colour temperature (CCT, see Section 3).
Table 3: A breakdown of LED and non-LED lamps tested
Type Class Style Fitting Models
CFL Domestic Triple bend B22 1
CFL Domestic Mini spiral B22 1
Inc Domestic Pearl (pre 2009 phase-out) B22 1
Inc Domestic Filament B22 1
TH Domestic Filament B22 2
TH Domestic Filament GU10 2
LED Domestic Filament B22 5
LED Domestic Light guide B22 2
LED Domestic Light guide E14 2
LED Domestic Pearl B22 5
LED Domestic Multichip and lens GU10 3
LED Domestic Fresnel and microlens GU10 2
LED Domestic Microlens GU10 3
LED Domestic Multichip GU10 1
LED Domestic Multichip corn B22 1
LED Office Small panel Various 4
LED Office 600 mm by 600 mm panel Ceiling tile 4
LED Street Multichip, integrated unit Various 6
Mr
S N
icho
las,
Sim
oncn
icho
las@
aol.c
om, 1
6:42
PM
13/
05/2
016,

7
2.2 Measurements
2.2.1 Spectral irradiance
The spectral irradiance at 300 mm from each lamp was measured in a darkened, temperature-
controlled laboratory at 22°C using high spectral resolution instruments with calibrations for
wavelength position, cosine response, and an absolute sensitivity calibration traceable to
international standards. Measurement accuracy was estimated at approximately 5%, but for
colorimetry and comparisons between different wavelengths or lamps, relative measurements
were considerably more accurate.
The raw data were processed to give 1 nm spectral irradiance data for LEDs from 350 nm to
799 nm and for non-LEDs, which may emit below 350 nm, from 250 nm to 799 nm.
The more exacting colorimetry standards and calculations call for 1 nm resolution spectral
data from 360 nm to 830 nm (Wyszecki and Stiles, 1982). Supplementary measurements
confirmed that the region between 800 nm and 830 nm made negligible differences to the
results in this study. In any case, the spectral irradiance of the LEDs was extrapolated up to
830 nm for illuminance and colorimetry calculations.
Table 4: Matrix of optical measurements and other data collected
LED (non-LED) Domestic Small panels 600 mm panels Street lights
Number
Models
Source
92 (23)
24 (8)
Purchase
12
4
Purchase
3
1
Purchase
5
3
Loan
16
6
Loan
All lamps and packs
Photographs
Cost, pack information
All lamps, three per model (see note)
Spectral power distribution
Warmed-up
During first warm-up
Other angles
Cross-section
Flicker (modulation)
Power meter
Note
Spectral irradiance, modulation and power meter measurements were taken for at least three lamps per model, where possible, and also for at least one lamp per dimmable model, over the full range of dimming.
Mr S
Nicholas, S
imoncnicholas@
aol.com, 16:42P
M 13/05/2016,

8
2.2.2 Measurement positions for spectral irradiance
Table 4 summarises all the measurement data and other data collected.
Spectral irradiance measurements directly in front of the lamps were taken at the start and
end of the measurements in other configurations. The first was taken at least 2 minutes after
turning on the lamp. The second was used for all the colour results.
For domestic lamps, the measurements were made 300 mm directly in front of the lamp, and
additional measurements were taken at 30° and 60° for BC22, E14 and E27 lamps and at 20°
and 30° for GU10 lamps.
For office-class small panels, measurements were made 300 mm directly in front of the lamp,
and the additional measurements were taken at 30° and 60°. For large panels, the spectral
irradiance measurements were taken in the parallel plane 2 m from the panel face, with the
additional measurements taken at lateral offsets of −100 mm and from +100 mm to +1000
mm, with no changes in angle of either the lamp or instrument input optics.
For street lights, a single spectral irradiance measurement was recorded once the lamp had
warmed up in the parallel plane 2 m from the luminaire face. Real-time measurement data
were used to confirm that the light output had stabilised.
2.2.3 Modulation
After warm-up, the modulation profiles of models from all lamp classes were measured with a
30 kHz sampling frequency, for one second, by placing a photovoltaic detector adjacent to the
lamp surface. After subtracting the residual dark signal, the detector response is proportional
to the instantaneous illuminance. Flicker frequency, Percent flicker and Flicker index were all
calculated from the acquired data (CIE, 2011 - see http://eilv.cie.co.at).
2.2.4 Dimming and power
Nine domestic-class lamp models and all four office-class small panels were described as
dimmable on the packaging. For these, spectral irradiance, flicker and power meter
measurements were taken with the lamp when connected to a basic rheostat dimmer,
described as being LED compatible.
The dimming settings used included maximum (100%) and approximately 70%, 50%, 30%,
10% and at minimum non-zero output, using the peak spectral irradiance as a rough guide.
The true illuminance ratio to 100% was calculated afterwards and used to analyse the power
consumption data with respect to their relative energy efficiency.
Power meter measurements were taken corresponding to the main measurements of spectral
irradiance and during dimming. Both the power meter and dimmer switch were inexpensive
consumer items that were purchased directly online.
Mr
S N
icho
las,
Sim
oncn
icho
las@
aol.c
om, 1
6:42
PM
13/
05/2
016,

9
3 Colour package
This package covers spectral irradiance measurements and the analysis relating to the
resulting visible qualities of the lighting, including illuminance, colour temperature and tint,
colour rendering, warm-up and batch variations.
Sections 3-5 set out the tests applied to the lamp measurements, including examples, usually
drawn from the LED sample. The results are presented in Sections 6-8, separately for
domestic, office and outdoor classes of lighting.
3.1 Spectral irradiance and illuminance
Figure 3 shows the typical spectral irradiance distributions of three “white LEDs”. A peak in the
blue region, from a single colour LED emitting at around 440 nm to 460 nm, is partly converted
by a phosphor to provide broad yellow-orange emission at longer wavelengths, around 500
nm to 700 nm. The spectral irradiance is lower in between these two regions, from around 460
nm to 500 nm. The overall spectrum balances the inputs to the three cone types in the human
retina, so that white coloured light is created.
If the phosphor dominates, the CCT is lower (see Section 3.2 below), and the colour is a
yellowish or “warm” white. If the blue peak dominates, the CCT is higher and a “cooler” blueish
colour results. The set of lamps shown in Figure 3 are domestic multichip and lens GU10 LED
spots from the same manufacturer with a range of CCT values. Spectral differences, including
differences in CCT, affect the efficiency and light quality, as well as the colour.
0
50
100
150
400 500 600 700 800
spectral irradiance,
mW.m
‐2.nm‐1
wavelength, nm
0.1
1
10
100
400 500 600 700 800
spectral irradiance,
mW.m
‐2.nm‐1
wavelength, nm
Figure 3: Spectral irradiance at 300 mm for multichip and lens GU10s with a range of CCT values (6520 K green, 4130 K red and 3010 K blue). The graph on the right uses a semi-logarithmic scale.
These are not the only spectral power distributions available with LED lighting. For example, it
is also possible to combine different colour LED peaks to provide a white coloured light. RGB
and four-colour LEDs, and colour tuneable LEDs, use this approach. Colour tuneable LEDs
often add one or more phosphors to the mix; by varying the proportions of the different LED
channels, they create different overall colours. RGB, four-colour and colour tuneable LEDs
were excluded here, and the products tested all had a single, blue, LED peak.
Lamp illuminances at 300 mm were calculated from spectral irradiance measurements.
Although illuminance and luminous flux are closely related, these illuminance measurements
Mr S
Nicholas, S
imoncnicholas@
aol.com, 16:42P
M 13/05/2016,

10
would not provide a reliable test of the stated lumen output. However, they can be used to
study batch variation, warm-up and other dimming variation, which is discussed later.
3.2 Lamp colour
Correlated Colour Temperature (CCT) is a measure of the blueness of any light source (CIE,
2011) that can be applied to artificial lighting as well as to different daylight conditions. It is
used for categorising the appearance of lamps, and quickly conveys colour differences arising
from differences in the overall spectral distribution.
Daylight has a CCT of around 6000 K to 7000 K on a clear day and around 4000 K to 5000 K
on a cloudy day. Lamps with a CCT below approximately 3500 K have a warmer tint than
daylight. Above 3500 K lamps have a noticeably cooler tint. A CCT of around 2700 K is very
typical for domestic lighting, although some people prefer higher CCT lighting.
Figure 4: The CIE 1960 uniform colour space diagram (u, v) used for calculating CCT, with mapping of the CIE 1931 colour space (x, y) in grey and (u’, v’) scale markings. Lamps with higher CCTs appear closer to the left end of the Planckian locus (dotted orange line).
Two lamps with the same CCT may still have colour differences, i.e. other than blue or yellow
tints. One measure of this is called Duv (sometimes written ∆uv), another measure of distance
in colour space from neutrality (i.e. the distance in Figure 4 from the Planckian locus). Duv and
CCT values are independent and together they specify an exact colour. Lamps with large
positive Duv values have a greenish tint, large negative Duv values a purplish tint.
Large Duv values (i.e. greenish or purplish tints) are usually not considered desirable. This is
different to CCT, where different values may be preferred by different people or for lighting
used for different purposes. For a light source to have a recognised CCT value, the allowed
Duv range given by the CIE is from −0.05 to +0.05 and LED lighting is expected to be between
−0.006 and +0.006 (ANSI, 2008; Boyce, 2014).
If multiple lamps are installed in one location, the colour of the lamps should be consistent.
This means that any replacement lamps should also be of the same colour. This may not be
0
0.1
0.2
0.3
0.4
0.5
0.6
0 0.1 0.2 0.3 0.4 0.5 0.6
v' = 1.5 v
u = u'
x = 0.1 x = 0.2 x=0.3, etc.
y = 0.1
0.2
0.3, etc.
x+y=1\
8 CRI samples
15 CQS samples
‐‐‐ Spectrum locus‐‐‐ Planckian locus
Mr
S N
icho
las,
Sim
oncn
icho
las@
aol.c
om, 1
6:42
PM
13/
05/2
016,

11
as easy to achieve with LEDs as with incandescent and tungsten-halogen lamps. If this is
important to the end user, the CCT and Duv values should be stated sufficiently accurately
and adhered to for future replacements. Duv values are hardly ever stated, however.
3.3 Colour quality and colour rendering
Colour measurements simplify the spectral power distribution of a lamp to what can be seen
directly, but they can be inadequate for some measures of a lamp’s performance. Perhaps
surprisingly, direct colour measurements including CCT do not provide enough information to
predict the colour quality of light in practical use. For example, the colour of clothes in daylight,
or at home, may not match their colour in the shop even if the light in all three situations has
the same colour and intensity.
To determine the ability of a light source to preserve expected or desired relationships
between object colours, its spectral power distribution has to be measured, and one or more
colour rendering factor of some sort calculated from it. For evaluation purposes this report
uses the lighting quality fidelity metric CQS Qa in conjunction with gamut metric TM-30 Rg and
spectral richness metric, HSp, as explained below (in 3.3.1 to 3.3.3). The CRI and TM-30
colour fidelity metrics are also calculated for reference.
3.3.1 Colour Rendering Index and Colour Quality Scale
The Colour Rendering Index (CRI) and the Colour Quality Scale (CQS) provide systems for
calculating the quality of lighting (Boyce, 2014; Davis and Ohno, 2010). The CRI metric Ra is
an average score based on how well the illuminant renders the first eight colour samples in
the CRI system. It is almost exclusively quoted as the main measure of colour rendering
despite having been shown to penalise LED against CFL lighting.
Both CRI and CQS systems use a reference lamp with the same CCT as the lamp’s own
spectral power distribution as a proxy for its ideal colour rendering properties. This is a
successful concept that avoids CCT-induced bias in either index. Both metrics consider how
the lamp changes the colour reflected off a number of defined coloured surfaces or “samples”.
The position in the CIE 1960 uniform colour space of the first eight CRI colour samples and
the 15 CQS colour samples are shown in Figure 4 as though the samples were illuminated by
an equal energy spectrum. As this spectrum has a relatively high CCT of 5456 K, the position
of the samples are all shifted towards the left, and slightly downward by this illuminant relative
to a warmer lamp, such as an incandescent light bulb with a CCT below 3000 K. This shift is
relatively large, so a 3000 K illuminant is a poor reference for the equal energy spectrum. The
CRI and CQS metrics depend on the much smaller changes in position of the samples relative
to a reference lamp with the same CCT.
There is still no widely accepted new system, perhaps due to the complexity of the subject and
the increasing complexity of the proposed replacements. The CQS is just one of a number of
proposals designed to address the CRI’s shortcomings, and is based on a similar design. It
has a revised set of 15 colour samples, and it provides more than one value to describe colour
rendering properties. The metric CQS Qa is the system’s “lighting quality fidelity metric” which
is a direct replacement for the CRI Ra, and is considered to be fairer towards LED lighting.
Mr S
Nicholas, S
imoncnicholas@
aol.com, 16:42P
M 13/05/2016,

12
3.3.2 Gamut area and TM-30
Another approach with some value is to use a metric like CRI Ra together with gamut values,
e.g. the area in colour space between a set of colour samples. Gamut Area Index (GAI) is
based on the colour space and samples in the CRI system (Rea and Freyssinier-Nova, 2008).
GAI is calculated by joining the green diamonds in Figure 4 with straight lines, for a particular
lamp, and comparing the area inside to the area for the equal energy spectrum (Rea, 2013).
By definition, this means the GAI for the equal energy spectrum is 100%. The larger the area
between the samples, the larger the GAI value and the greater is the theoretical ability of the
illuminant to produce more vivid saturated colours towards the perimeter of the colour space.
A similar CQS metric can be calculated based on the 15 CQS colour samples, and a recent
proposal with 99 colour samples, TM-30 (David, 2015), is slightly more complex, but shares
the same 2-metric system suggested by Rea and Freyssinier-Nova (2008).
The measurement data collected here indicated the GAI method systematically gives higher
values for illumination with a higher CCT value. Using an alternative approach to spectral
richness without the CCT-bias in gamut area is another option, which is considered next.
Gamut metric TM-30 Rg was found to avoid this CCT bias, as suggested by Smet et al (2015).
3.3.3 Spectral richness metrics FSCI and Spectral Entropy
Two measures of the “richness” of the spectral power distribution (e.g. Figure 3 above) have
been suggested: Spectral Entropy (Price, 2012) and the Full Spectrum Color Index (FSCI)
(Rea and Freyssinier-Nova, 2008). Spectral Entropy, denoted HSp, also avoids the CCT
association of GAI but retains other predictive components of a lamp’s colour rendering
properties. HSp is not currently widely used, but follows a promising complementary approach
to both colour quality and gamut area calculations (Table 5).
A spectral power distribution that favours any certain wavelengths reduces HSp from 100%.
HSp gives the mathematical information in the 5 nm resolution spectrum between 380 nm and
780 nm (Price, 2012). A flat spectrum has the maximum information; a single wavelength
source (e.g. a single colour laser beam) has the minimum. To make comparisons easier to
read, the complementary metric Spectral redundancy, 100% - HSp, is used in the results in
Sections 6-8, with low Spectral redundancy values being associated with better colour
rendering.
Table 5: Spectral entropy and spectral richness metrics compared to colour based metrics
Advantage Details
Simple Substantially more direct justification and calculation than FSCI and much easier calculations than CRI, CQS, TM-30 and their associated gamut areas.
Robust High degree of objectivity and results are unbiased by CCT over normal ranges. The ranking between a wide range of different types of lamp is based on central psychophysical principles.
Performance Spectral entropy evaluates spectral information efficiently. Like other spectral richness metrics, however, it does not value colour preference or use colorimetry functions. This suggests that more than two metrics may be required to fully understand the colour rendering properties of a lamp, including a colour fidelity metric, an advanced gamut metric and a spectral richness metric.
Mr
S N
icho
las,
Sim
oncn
icho
las@
aol.c
om, 1
6:42
PM
13/
05/2
016,

13
4 Flicker package
The irradiance from many lamps varies regularly several times every second. This package
analyses high frequency variations of the irradiance from the lamps. It considers whether the
light output modulation is perceptible or may have adverse health effects.
4.1 Flickering light
Flicker has the potential to trigger seizures, migraines, headaches and may be visually
uncomfortable or a persistent distraction. The IEEE (Institute of Electrical and Electronics
Engineers) in the USA has recently published an extensive review of the effects along with
guidance. The IEEE report also highlights gaps that currently exist in the research data
relating to health effects (IEEE, 2015).
Modulation is the general term often used to describe the periodic variation of light when
considering flicker. However, there is no widely agreed definition of the modulation
frequencies and amplitudes that are deemed sufficient to count as flicker. Flicker may be
thought of as modulation which has a biological effect. This is the sense of the word used in
this report: modulation at physiologically-relevant frequencies and with levels and periodic
patterns of variation that together produce a measurable human response.
Evolution optimised our eyes and brains in a non-flickering environment and vision was
certainly not evolved to protect our eyes from the effects of prolonged exposures to flicker.
Whilst flicker has often been defined based on conscious human awareness of modulation
(i.e. perceptible flicker), this style of definition is now increasingly challenged. It is known that
retinal photoreceptors can react rapidly to changes in light levels in a few milliseconds.
Throughout human evolution this has been important to recognise threats, which usually
moved and reflected changing light patterns towards the eyes. For some time now,
physiological and health-related responses to flicker have been documented at higher
frequencies than psychophysical experiments based on whether flicker was visible (Brindley,
1962; Wilkins, 1989; Berman 1991). In the latest reviews there are a variety of both known
and strongly suspected negative subconscious health effects from flicker (IEEE, 2015).
4.2 Quantifying flicker
For the purposes of this report, two established measures of flicker have been used, known as
Percent flicker and Flicker index. These are explained below. Neither one is based on the
physiology of the eye, however, so they have limitations. For example 100% Percent flicker at
30 kHz is not physiologically relevant, whereas 40% Percent flicker at 30 Hz certainly is. In
fact visual performance can be reduced at frequencies as high as 100 Hz (Jaén, 2011) and
120 Hz (Veitch and McColl, 1995), which are above the frequency at which flicker is
considered to become invisible.
Following IEEE (2015) and Wilkins et al (2015), this report highlights the need for a practical
flicker metric that satisfies both users’ and manufacturers’ needs. As retinal photoreceptors
are the physiological entry point for modulation information, it is proposed here for future work
Mr S
Nicholas, S
imoncnicholas@
aol.com, 16:42P
M 13/05/2016,

14
that taking account of photoreceptor reaction times may offer a possible way to analyse
imperceptible flicker for protecting against a range of adverse effects, including health effects.
4.2.1 Percent flicker
Percent flicker is the most widely quoted measure of the amount of flicker in the light given off
from lamps. It should be given along with the flicker frequency.
As an example, Figure 5 provides the following results from measuring a TH filament lamp:
a There are ten cycles in the period of 0.1 s
b The curve is smooth and has an approximately sinusoidal waveform
c The maximum relative illuminance is around 0.95
d The minimum relative illuminance is around 0.75
The number of cycles is equivalent to one every 0.01 s which corresponds to a frequency of
100 Hz, or twice the UK mains frequency.
Percent flicker is calculated from the difference divided by the sum of the maximum and
minimum relative illuminance:
Percent flicker
The Inc and TH lamps had Percent flicker between 9.6% and 12.4% at 100 Hz. For 100 Hz
flicker, Public Health England have used 15% (and before as the Health Protection Agency)
as a rule of thumb for new lighting technologies, based on these values. In other words, the
idea has been that flicker should be no worse from new technologies than from the old ones.
Figure 5: Modulation or flicker of a TH lamp. Equation 4.1 draws its values from this chart. For this reason, the maximum relative illuminance has been normalised to 1.
0.0
0.2
0.4
0.6
0.8
1.0
0.10 0.12 0.14 0.16 0.18 0.20
Rel
ativ
e ill
umin
ance
Time, s
Mr
S N
icho
las,
Sim
oncn
icho
las@
aol.c
om, 1
6:42
PM
13/
05/2
016,

15
This provides some justification for avoiding greater levels of flicker, but it has never been
possible to point to exact evidence, or a precise physiological justification for the value. One
known weakness of using Percent flicker is that the shape of the waveform matters as well as
the range of relative illuminance. A square wave is less innocuous than a sinusoidal one, and
there are many other relevant factors.
4.2.2 Flicker index
Flicker index attempts to account for the weaknesses in the Percent flicker by comparing the
areas in charts like Figures 5 and 6 above and below the average relative illuminance during
one cycle (i.e. during 0.01 s if 100 Hz is the lowest modulation frequency).
Figure 6 illustrates two cycles of a complex non-sinusoidal modulation pattern. It is not one of
the lights measured in this study, but is used as an illustration. To simplify the calculations, the
average relative illuminance has been set equal to 1 (this does not affect the result).
Figure 6: An example complex modulating light time series (here the average relative illuminance is deliberately set to 1 to simplify the calculation in Equation 4.2).
Flicker index is calculated as the difference of the area above divided by the sum of the areas
above and below the average relative illuminance:
Flicker index
Flicker index values allow for the shape of the waveform. Although it is an improvement,
compared to Percent flicker, it is not clear that it is the right approach. For example, the
relationship between the flicker frequency and the frequencies at which there is an effect is
still not taken into account. It is also significantly less widely used, although in reality it is not
much more complicated to evaluate.
0.0
1.0
0.10 0.11 0.12
Rel
ativ
e ill
umin
ance
Time, s
Mr S
Nicholas, S
imoncnicholas@
aol.com, 16:42P
M 13/05/2016,

16
4.3 Safety
Even if it is not deemed as flicker, the pattern of light created by modulation in general may
interact with eye movement, object movement and other modulated light sources to create
hazards. For example, fast rotating machinery in homes, factories or on roads at night may
appear stationary or slow moving when illuminated by a modulating light source. Car and
street lights may cause a string of separate after-images as the eye moves. This category of
hazard is beyond the scope of this report, but clearly these undesirable effects could be
eliminated with modulation-free illumination.
4.4 Dimming and effects on flicker and energy efficiency
Some LED suppliers recommend a specialist LED dimmer, which may cost several times the
value of the lamps. The LED dimming capacity with a perfect dimmer has not been tested, and
only one lamp was connected to the dimmer at any one time. The flicker-dimming
measurement relate only to the inexpensive rheostatic dimmer that was used.
The usual measure of energy efficiency is luminous efficiency. It is based on the visual
response to light and the energy used, and these were assessed using spectral power
distribution measurements and an electrical power meter (Figure 7). Note that this measure of
energy efficiency does not consider other human responses or the colour quality. Taking these
aspects into account may shift the preferred balance of wavelengths from the visual response.
Figure 7: The commercial grade electrical power meter used
When dimming incandescent and TH lamps, the colour changes to a warmer colour; this is
potentially advantageous for controlling the non-visual stimulus strength of the light
environment as the shorter wavelengths are reduced substantially more than longer
wavelengths. An in-depth explanation is given in the next Section. Intuitively, it is widely
believed that warmer colours may be appropriate in conjunction with dimmer lighting, for
creating relaxed environments, e.g. evening illumination. In contrast, the LED lamps selected
were not designed to change colour when dimmed.
Mr
S N
icho
las,
Sim
oncn
icho
las@
aol.c
om, 1
6:42
PM
13/
05/2
016,

17
5 Spectrum package
This package considers the potential role of street lighting to cause sleep disruption at night
and the potentially harmful effects of light on the retina. The spectral power distributions of the
LED streetlights were measured and photographs of the light emission pattern were taken to
support comparisons to other technologies, and as the basis of optical radiation safety
assessments.
5.1 Circadian rhythms and non-visual effects of light
Some of the terminology in the field of photobiology is not self-explanatory. Starting with
circadian rhythms, this scientific term is often associated with daily periodic biological
activities. Circadian literally means “approximately one day” (Andersen, 2012).
The light information for vision follows a different pathway to the light information that governs
unconscious responses to ambient light. “Non-visual” or “non-image-forming” photoreception
and responses are terms commonly used to describe the photobiological effects related to this
second pathway (Lucas et al, 2014). Confusingly non-visual refers only to this second
pathway from the retina to the brain, and other more direct effects of visible and UV radiation
on skin and other tissues are not intended to be included. The damaging effects that very
bright light sources can have on the eye, including the retina, are excluded too.
Information in the “non-visual” pathway is regulated by one special type of retinal ganglion cell,
or “RGC”. Intrinsically-photosensitive retinal ganglion cells, “ipRGCs” or “pRGCs”, are RGCs
which contain a photopigment called melanopsin. Melanopsin in the eye reacts to wavelengths
across the visible spectrum and is most sensitive to ambient light at 490 nm (Lucas et al,
2014), a wavelength which appears bluish-green. Melanopsin enables ipRGCs to detect light
themselves. Like the RGCs used in vision, ipRGCs also receive information about the light
derived from the rods and cones.
5.1.1 Regulation of circadian rhythms and disruption of sleep by light
Ambient light levels are the main information our bodies use to synchronise themselves
(Andersen, 2012). From the timing of sleepiness, hunger, arousal and our willingness to be
active through to the unconscious physiological patterns such as the preparation of our
internal organs for daily activities and the ‘decision’ of waking from sleep.
Regular disruption of this complex timing mechanism will lead to tiredness, sleep disruption,
below optimal performance, reduced well-being and cumulative effects on long-term health.
The non-visual effects of light can be both positive and harmful to health and well-being. The
darkness at night is of equal importance as having adequate light during the day. Following
the natural pattern of day and night may be beneficial for health, but this needs to be balanced
with the benefits of having light for reading, socialising and personal safety after the sun has
set. Artificial lighting, even if it is sometimes over-used or misused, represents a great
improvement in our quality of life.
Mr S
Nicholas, S
imoncnicholas@
aol.com, 16:42P
M 13/05/2016,

18
5.1.2 The role of artificial lighting
Daylight quickly reaches much higher levels than typical artificial lighting, but artificial lighting
can be extended into the night. When we are indoors, the design of buildings, windows, and
artificial lighting, as well as the conditions outside, blinds and curtains, governs the proportion
of daylight and artificial light exposures.
As the pattern of the light exposure is changed by artificial light and indoor environments, it is
possible for the system of timing derived from light exposures to be disrupted. For example,
rotating shift and on-off night shift workers may be exposed to light during the night, and have
long periods of relative darkness during the day, when resting. Indoor daytime workers, and
residents in nursing homes, schools, prisons and hospitals, typically have a delayed, flattened
and elongated light exposure. Compared to natural light levels, which consistently rise in the
morning and fall in the evening, this exposure profile reduces the timing information.
Exposure to light in the late evening or at night can have an immediate alerting effect,
suppress the secretion of the hormone melatonin, delay the timing and reduce the function of
the circadian system. The severity of the effect depends on the dose and timing - how much
light, for how long, the spectral power distribution and whether the exposure occurs early, in
the middle or late during the night-time (e.g. as reviewed in Chang 2015 and Chellappa 2013).
Laboratory studies in sleep research centres have shown that there are both immediate
effects, and effects that are delayed for up to a few days. Changes occur in the quality, timing
and length of sleep immediately following the exposure, and further effects will follow due to
the change in the behaviour of the regulatory timing system (i.e. circadian rhythms) in
preparing the body for activities throughout the following few days.
As the main focus here is potential sleep disruption at night from LED street lighting, this
section considers how it may be different from other street lighting as well as from unlit night
environments. However, the complexity and remaining uncertainties in the science of non-
visual responses applies to any artificial lighting, so it would be wrong for LEDs alone to be
associated with these far-reaching effects.
5.2 Blue light hazard and hotspots
None of the LED sources assessed as part of this study emitted any ultraviolet radiation and
the thermal hazard was trivial. Therefore, only the blue light hazard was considered.
Blue light is known to be phototoxic for the retina. The International Commission on Non-
ionizing Radiation Protection (ICNIRP) regularly reviews the biological evidence and publishes
exposure guidelines. Adverse health effects are very unlikely from exposure to light that is
within the guideline limits.
Some wavelengths are more effective at causing harm than others, with the peak effect very
close to the sensitivity of the short wavelength cones, in other words blue light at around
440 nm. The blue LEDs used in street, office and domestic LED lighting generally emit at
around 450 nm to 460 nm. For this reason, there are concerns that the guidelines may be
exceeded, especially by lights with hotspots arising from LED chips in direct view.
Mr
S N
icho
las,
Sim
oncn
icho
las@
aol.c
om, 1
6:42
PM
13/
05/2
016,

19
Glare from lighting, including from hotspots, can be uncomfortable and reduce the visibility of
nearby objects even for lighting within retinal safety limits. Visual impairment effects are
transient, but should nevertheless be considered as adverse human responses.
5.3 LED street lighting
LED street lighting is being installed in many places around the UK and overseas, so it is
important to understand the differences this means for both the lighting quality and any effects
on people. Other street lighting technologies have generally been associated with lower CCTs,
and sometimes orange light of very low spectral richness, so the appearance of LED street
lights with higher CCTs and more day-like colour rendering, is less familiar at night.
The colour rendering of white LED light is typically better than alternative street lighting
technologies, which it is argued may help with road and personal safety. The colour qualities
of LED lighting may make the lit environment outside more visually stimulating, inviting or
distracting, depending on the observer’s point of view.
Figure 8: An LED street light taken from the lamps measured.
The non-visual effects of street lighting can be caused by direct light, light reflected from lit
objects and the contribution to scattered light from the sky. Light pollution may be cited as a
reason both for and against switching to LED street lighting. Light scattering in the atmosphere
is greater for shorter wavelengths and the non-visual system is also relatively more sensitive
to shorter wavelengths of visible light. The blue LED component is preferentially scattered,
and the resulting sky-glow may activate the non-visual system more than other street light
conditions. The effect would be greatest for the higher CCT LED street lights, which it is
anticipated would increase sky glow by a factor of 5, and lights that emit above a certain angle
from the vertical (Baddiley and Wainscoat, 2015). Due to the small emitter size, the light from
LED street lights can in theory be carefully directed, so there is a potential for light spill from
street lighting to be reduced by LED technology. This places a secondary demand on the
preferred beam-shaping optics for LED streetlights – the light source needs to be
simultaneously directional and diffuse (without hotspots or glare).
Another advantage LED lighting has for reducing light pollution is the ability to turn on and off
almost instantly. The differences in timing are only a few minutes, and the disruptive non-
Mr S
Nicholas, S
imoncnicholas@
aol.com, 16:42P
M 13/05/2016,

20
visual effects of light at night continue to accumulate over periods of hours, so this seems a
minor advantage for circadian rhythms.
Related to human non-visual responses, the effect on other species in the environment of light
at night are of importance for a wider review of the unwanted or unplanned effects of any type
of street lighting. Although there are ways in which light at night causes environmental
changes that have immediate as well as delayed effects on human quality of life, these are not
within the scope of this report.
5.4 LED tablets and e-readers
LEDs are associated with tablets and e-readers, but the light exposures from e-readers are
not necessarily equivalent in illuminance or spectrum to an LED for general lighting. News
articles often appear relating to people’s concerns about these devices and the concerns may
spill over to LED lighting with little supporting evidence.
A recent study (Chang et al, 2015) showed that reading from these devices for 4 hours before
sleep can suppress and shift the onset of melatonin secretion compared to a print book. The
results should be interpreted with care, as a very dim room light condition was used for
reading from a print book, rather than a well-directed reading light.
PHE recently looked at potential retinal phototoxicity relating to “blue light” from a range of
screens including monitors, laptops, mobile phones, as well as tablets and e-reader similar to
those in Chang et al (2015). In the blue light study (O’Hagan et al, 2016) the light measured
from these devices was shown to be well within long-established international guidelines or
safety limits (ICNIRP, 2013).
Mr
S N
icho
las,
Sim
oncn
icho
las@
aol.c
om, 1
6:42
PM
13/
05/2
016,

21
6 Domestic-class LEDs – results
6.1 Batch variation
When measuring the spectral irradiance of the domestic LED lamps, the spectral power
distributions of the lamps were measured shortly after first being switched on, and then left to
stabilise before the representative measurements were taken. Using these data, the
illuminance at 300 mm reduced by around 6.6% on average during the measurements, i.e.
when operating the lamp for the first time, and the range was between a 0.6% and 16.8%
reduction.
However, the measurement timings varied between lamps. For some of the lamps which were
not measured in the first few seconds after being switched on, the change in illuminance may
be understated, and these results should only be taken as a broad indication of the change in
illuminance over around 20 to 30 minutes.
Batch variations in relative spectral power distributions were not significant, at 300 mm directly
in front of the lamp and at two further angles for each domestic LED lamp model. Broadly
speaking, variations in illuminance remained within a 20% range, and colour variations tended
to be associated with the cheaper models. There were, as would be expected, significant
variations in illuminance etc. between different angles for any given lamp.
Under dimming, there were no significant colour changes. In contrast, Inc and TH lamps shift
to warmer colours when dimmed. Further details relating to flicker and power consumption
when dimming are given below (Sections 6.3 and 6.4).
6.2 Colour rendering and CCT
Table 6 sets out the CCT and colour rendering metrics for all the domestic LED models and
domestic non-LEDs tested.
The last two models of lamp listed were excluded from the analysis below (see note to the
table) as they were purposively selected as being effectively older designs that have largely
been replaced. It is expected that customers would tend to avoid buying lamps with visible
bare LED chips for aesthetic reasons, despite being cheaper. Whilst the LED element is
visible in filament lamps, the source of the light is spatially distributed in a similar way to the
filament in an incandescent light bulb.
All of the other 22 models tested stated a CCT value. A large number of the models available
had CCT values approximately in the range of 2700 K to 3000 K. The lamps were therefore
deliberately selected so that only a small number were outside this range, including a set of
three models from the same manufacturer that appeared otherwise identical.
The domestic lamps performed well against the colour space tolerances described in
Section 3. All the Duv values were within the range −0.006 to +0.006, and using the equivalent
CCT test, only one model had a slightly misstated CCT, measured at 2841 K (unrounded)
rather than 2700 K. Notably, this was the lamp with substantially better colour rendering
properties than the other lamps, arguably an advantage outweighing this slight discrepancy
which essentially only requires a restatement.
Mr S
Nicholas, S
imoncnicholas@
aol.com, 16:42P
M 13/05/2016,

22
All the models with stated CCT values also had CRI Ra values over 80. Rather than increase
the scores of all the LED lamps, the switch to CQS Qa appears to reduce some of these colour
quality scores, but typically by less than the reduction in the scores for the two CFLs. The
domestic LED lamps’ CQS Qa values were approximately 80-84 (79.9 to 83.8) or better (one
model: 88.1), whereas both CFLs scored approximately 75.5 and all the Inc and TH lamps
scored approximately 97. A similar picture emerges with the new fidelity metric proposed by
IES, TM-30 Rf. Based on limited data, the related gamut area metric, TM-30 Rg, is
independent of CCT, although the best domestic result is for the highest CCT lamp tested.
For CCT below 3500 K, TM-30 Rg identifies a relatively inexpensive pearl light bulb with a
good all-round colour rendering performance. The other metrics, including HSp, pick out an
alternative LED filament light bulb, this time relatively expensive. Neither model was marked
as dimmable.
Table 6: The measured colour rendering statistics and CCTs for the domestic lamps.
Style CCT, K CRI, Ra CQS, Qa TM-30, Rf TM-30, Rg 100% - HSp
CFL triple tube CFL mini spiral
28402840
80.080.7
75.175.8
69.2 70.2
103.3 103.0
28.027.9
Incandescent pearl Incandescent filament Tungsten Halogen filament .. .. ..
274026302690272027402780
99.599.599.699.799.299.5
97.196.596.897.396.697.3
99.5 99.6 99.6 99.7 99.1 99.4
99.6 99.7 99.7 99.8 99.3 99.5
5.56.36.75.75.45.1
LED filament .. .. .. .. LED light guide .. .. .. LED pearl .. .. .. .. LED multichip and lens .. .. LED Fresnel and microlens .. LED microlens .. ..
2660271027302750284026102650268027502630268027002740295030104130652027803990271029203050
81.282.682.183.289.782.181.981.080.981.682.380.883.481.382.584.184.982.684.282.482.282.7
80.983.182.883.788.180.880.979.981.380.681.781.581.582.081.382.980.983.483.882.482.783.1
79.6 83.3 82.7 83.4 86.6 82.2 82.2 80.5 81.4 81.5 82.8 81.0 82.2 82.1 81.3 82.2 80.6 83.6 82.0 83.6 83.2 80.3
88.0 92.7 92.0 92.4 95.9 96.4 96.3 97.5 92.9 95.6 96.1 90.3 98.2 96.0 97.0 97.3 98.3 92.8 92.1 95.1 95.5 90.5
10.29.6
10.29.67.69.49.69.29.99.29.3
10.38.89.59.59.0
10.110.2
9.29.69.39.4
LED multichip, flat array LED multichip, corn array
29702990
60.262.0
62.863.8
63.3 63.9
83.8 85.3
11.410.2
Note
CCT values in excess of 3500 K (‘cool’ white) and the best colour rendering metric scores highlighted for each group.
The last two LED lamps are different from the sample in a number of ways: outlying poor colour rendering, the LED chips are directly visible, the CCTs of the lamps were not stated, they were bought from an internet only retailer and they were the least energy efficient and the corn array was also unbranded.
Mr
S N
icho
las,
Sim
oncn
icho
las@
aol.c
om, 1
6:42
PM
13/
05/2
016,

23
The metrics show there are only minor variations between Inc and TH lamps or between
CFLs, but there are clear systematic differences in colour rendering between the different
technology types. A similar contrast is evident between LEDs in the different parts of Table 6
and the equivalent tables for office, Table 9, and street lighting, Table 12.
This overall comparison also shows that carefully selected gamut and spectral richness
metrics provide independent information about the colour quality. HSp is regularly in agreement
with at least one other metric in identifying the best performing lamp (shown as 100% - HSp).
Colour fidelity and gamut metrics can be seen as specialised tools to study lighting quality
based on human colour perception, tools that isolate different aspects of the more general
radiometric measures of spectral richness.
6.3 Flicker and dimming
The primary flicker frequency for all the undimmed domestic LED lamps was 100 Hz, often
combined with higher frequencies over 1 kHz. In these cases only the 100 Hz flicker was
considered physiologically relevant, but Flicker index was taken to be a more robust metric for
making comparisons. Both Percent flicker and Flicker index were calculated in Table 7 taking
into account several cycles over 0.333 s. The calculation includes all the domestic LED and
non-LED lamps and the table appears later in this section.
Shorter periods of data from three examples are shown below in Figure 9 corresponding to
Percent flicker values of 97.2%, 46.9% and 10.3% (blue, red and green curves respectively).
These values are taken from Table 7. The corresponding Flicker index values are 17.2%,
13.7% and 2.2% respectively. The TH and Incandescent lamps (red and green diamonds)
provide a useful benchmark, which have a Flicker index of around 3.5%, whether dimmed or
undimmed. Of the examples in Figure 9, only the model shown with the green line provides
low flicker levels (almost flicker-free).
Both GU10 and B22 LEDs included low and high levels of undimmed flicker at 100 Hz; the
Fresnel lens GU10 LED spots and B22 LED filament light bulbs were low or similar compared
to TH and Inc lamps on both flicker metrics. Percent flicker overstated the true effect of the
modulation for CFLs tested due to the presence of high frequencies, but this was much less
noticeable for most of the LEDs.
Nine models of domestic LEDs tested were marked as dimmable, including three models from
the same manufacturer with different colour temperatures. Their output reduced to between
approximately 1% and 20% of the maximum illuminance, depending on the model of lamp.
This minimum output achieved was below 2% for 2 models, below 5% for 4 more models,
including the three with a range of colour temperatures, and the 3 remaining models were only
able to be dimmed to 13.3%, 17.9% and 19.9% of their maximum output.
Figure 9 illustrates the main waveforms seen:
a Red shows a relatively smooth, slightly distorted sinusoidal waveform
b Blue shows a broadened version of this, with almost 100% flicker
c Green shows very high frequency modulation that is not physiologically relevant
d Similarly, blue also shows an approximately 3.5 kHz modulation component
Mr S
Nicholas, S
imoncnicholas@
aol.com, 16:42P
M 13/05/2016,

24
Figure 9: Three examples of modulation measured from undimmed domestic LED lamps. Normalised voltage is proportional to the changing levels of luminous output from the lamp.
Figure 10 illustrates the relationship between flicker from domestic lamps, differences in
technology and unit costs for undimmed Percent flicker at 100 Hz and Flicker index (“flicker
metrics”). As noted earlier, the TH lamps (red discs, also includes Incandescent light bulbs)
provide a useful benchmark.
There are three models with Percent flicker close to 100% and Flicker index close to 17%,
which were all similar designs, simply with different CCTs. Counting these as a single model,
and using Flicker index, shown in the second panel of Figure 10:
a fewer than half the LED models exhibited lower flicker levels than TH lamps
b unit costs were not linked to lower flicker levels, at least below £10
c even for the seven more expensive LED models only four exhibited lower flicker levels
than TH lamps
0
0.1
0.2
0.3
0.4
0.5
0.6
0.7
0.8
0.9
1
0 0.01 0.02 0.03 0.04 0.05
Nor
mal
ised
vol
tage
Time, s
0
0.1
0.2
0.3
0.4
0.5
0.6
0.7
0.8
0.9
1
0 0.002 0.004 0.006 0.008 0.01
Nor
mal
ised
vol
tage
Time, s
Mr
S N
icho
las,
Sim
oncn
icho
las@
aol.c
om, 1
6:42
PM
13/
05/2
016,

25
Figure 10: Flicker metrics against unit cost for all the domestic lamp models measured.
It is noticeable that many of the dimmable lamps had high levels of flicker before dimming.
Two of the undimmed examples from Figure 9 are shown as dimmed in Figure 11
corresponding to Percent flicker of 100% and 94.8% (blue and green respectively). Figure 11
also illustrates the difference between waveforms with low and high duty cycles (blue and
green respectively). The light indicated in blue is off most of the 0.01 s period, whereas the
opposite is true for the other LED lamp; low duty cycles increase the problem caused by
flicker. This is one reason why Flicker index is a better metric than Percent flicker.
Table 7 only shows the two ends of the dimming range, and the behaviour at 50% and 10%
(where possible) was also considered. With the dimmer connected, only four of the nine
models provided low levels of flicker (Flicker index < 3.5%, and no component frequencies
below 100 Hz) when undimmed, four again when dimmed to 50% of the maximum output, and
two when dimmed to 10%. Mostly performance on the Flicker index metric reduced with
dimming, but occasionally there were slight improvements in moving to the next level down.
Hence Table 7 shows three lamps with low flicker at the lowest level of dimming.
0%
10%
20%
30%
40%
50%
60%
70%
80%
90%
100%
£0 £5 £10 £15 £20 £25
Per
cent
flic
ker
unit cost (per lamp)
TH
CFL
Undimmabe LED
Dimmable LED
0%
5%
10%
15%
20%
25%
30%
£0 £5 £10 £15 £20 £25
Flic
ker
inde
x
unit cost (per lamp)
TH
CFL
Undimmabe LED
Dimmable LED
Mr S
Nicholas, S
imoncnicholas@
aol.com, 16:42P
M 13/05/2016,

26
Figure 11: Two examples of modulation measured from domestic LED lamps dimmed to minimum working setting on the dimmer. Normalised voltage is proportional to the changing levels of luminous output from the lamp over time.
It is arguably counter-intuitive that higher levels of undimmed flicker are often associated with
the dimmable LED models. However, this may relate to differences in the electronics in
dimmable models, and the relationship has a small number of exceptions in both the
dimmable and undimmable categories. Together with the results from the office class, the
conclusion is that very few LED lamps or panels are available on the market that provide
acceptable low-flicker illumination when fully dimmed with an LED-compatible rheostatic
dimmer. It would be expensive for individuals to identify these lamps by trial and error; the
three dimmable domestic models that performed best on the flicker metric cost approximately
£4, £9 and £20 per lamp, compared to the other dimmable LED models at £6.50 to £12 per
lamp, so price is also no indication. Note that if more than one LED lamp were connected at
once to the same dimmer, the resulting output may be further deteriorated.
-0.2
0
0.2
0.4
0.6
0.8
1
0 0.01 0.02 0.03 0.04 0.05
Nor
mal
ised
vol
tage
Time, s
0
0.1
0.2
0.3
0.4
0.5
0.6
0.7
0.8
0.9
1
0 0.002 0.004 0.006 0.008 0.01
Nor
mal
ised
vol
tage
Time, s
Mr
S N
icho
las,
Sim
oncn
icho
las@
aol.c
om, 1
6:42
PM
13/
05/2
016,

27
Table 7: Flicker measurements and undimmed illuminance at approximately 300 mm.
Style
Undimmed illuminance,
lux
Undimmed Percent
flicker %
UndimmedFlicker
index %
Dimmed to, % of
maximum
Dimmed Percent
flicker %
Dimmed Flicker
index %
CFL triple tube CFL mini spiral
406622
55.726.9
17.25.1
--
- -
--
Incandescent pearl Incandescent filament Tungsten Halogen filament .. .. ..
715589
88339
52167688
-9.9
11.011.912.012.3
-3.23.43.73.83.9
-0.20.40.42.20.8
- 11.7 12.3 14.9 15.1 15.5
-2.93.13.64.04.1
LED filament .. .. .. .. LED light guide .. .. .. LED pearl .. .. .. .. LED multichip and lens .. .. LED Fresnel and microlens .. LED microlens .. ..
3386889465
428548319335356927619
1124141141354055400248284884
1217576976912
1.44.14.3
16.21.2
54.918.110.3
0.63.0
14.620.065.869.497.097.997.2
0.50.48.9
76.662.0
0.21.01.14.10.1
16.15.62.20.10.83.95.9
20.119.516.617.317.2
0.10.12.8
23.017.5
-----
17.919.9
4.7-
1.7----
4.64.74.6
-13.3
1.1--
- - - - -
68.6 35.2 94.8
- 21.4
- - - -
100.0 100.0 100.0
- 0.8
14.3 - -
-----
23.79.7
30.7-
3.0----
86.887.286.6
-0.11.8
--
LED multichip, flat array LED multichip, corn array
535127
46.984.8
13.7
25.6
--
- -
--
Note
Undimmed illuminances were measured without the dimmer attached. % of maximum illumination is measured as the ratio of minimum and maximum illuminances achieved with the dimmer attached.
Further details relating to power consumption and dimming are given in Section 6.4 below.
Appendix A provides additional details about the flicker measured in the non-LED lamps.
6.4 Power consumption and dimming
Undimmed, the range of actual power consumed is shown in Table 8 for the domestic lamps.
This was between 1.5% and 12.5% more than stated for the LEDs. For comparison, the range
of the non-LED lighting was from -7.7% to 19.1%. This range of variation for LEDs, 11%, is
much less than the 26.8% range for the non-LED lamps tested, even though there were over
three times as many LED models included. Domestic LED batch variation was insignificant.
Mr S
Nicholas, S
imoncnicholas@
aol.com, 16:42P
M 13/05/2016,

28
Note that, at around 250 V, the electrical source in the testing laboratory was towards the
upper tolerance for UK voltage. This may help explain the power consumption being higher
than stated, which may be stated for 230 V. These values are also based on the commercial
power meter used, which may plausibly under or over-estimate the power consumption by 5%
or more.
In summary, there may be very little difference between the actual and stated power on
average and it is the range of results which is of interest. The variations for the LEDs tested
were smaller on average than for the non-LED products. Also note that the maximum
additional power implied by these values was 0.5 W for LEDs, much lower than the additional
5.3 W for non-LED lighting.
Table 8: Electrical measurements from the power meter and unconfirmed total luminous output.
Style CCT, K
RMS current,
mA
Active power,
W
Apparent power
|VA|, W
Power factor,
%
Total luminous
output, lm
CFL triple tube CFL mini spiral
28402840
7090
12.013.7
19.9 22.8
60 59
600741
Incandescent pearl Incandescent filament Tungsten-Halogen filament .. .. ..
274026302690272027402780
240250180180170170
62.062.345.645.743.644.8
62.0 62.3 45.6 45.7 43.6 44.8
100 100 100 100 100 100
700665630625300350
LED filament .. .. .. .. LED light guide .. .. .. LED pearl .. .. .. .. LED multichip and lens .. .. LED Fresnel and microlens .. LED microlens .. ..
2660271027302750284026102650268027502630268027002740295030104130652027803990271029203050
30303030303020405030305040402020204020404040
4.24.24.24.24.46.26.46.66.87.15.77.45.39.35.35.35.15.15.46.14.74.9
8.1 8.1 8.1 8.1 8.8 7.4 7.4
12.4 12.7
8.1 8.8
14.8 10.5 11.2
6.3 6.3 6.0
10.2 7.1
11.0 11.2 12.0
51 52 52 52 49 79 86 51 53 87 65 51 50 81 83 83 85 50 76 55 42 38
470470470470400470470470470470470470470810400400400370346400345330
LED multichip, flat array LED multichip, corn array
29702990
3050
3.94.1
8.4 13.7
45 31
--
Note
Power factor is a dimensionless ratio of Apparent power to Actual power. Apparent power = |VA| has the units of power, W. Engineers may sometimes name the units of Apparent power VA to avoid confusion with Actual power. This unit is equivalent to W. VA is the formula for Complex power, S = VA, rather than Apparent power. Differences between the ratio of actual power to apparent power and power factor, arise as it was not possible to record readings simultaneously.
Mr
S N
icho
las,
Sim
oncn
icho
las@
aol.c
om, 1
6:42
PM
13/
05/2
016,

29
Figure 12 shows the change in energy efficiency when dimming the domestic LEDs, with the
undimmed condition shown to the right. At first some of the lamps increase in efficiency, and
some reduce in efficiency as the light is dimmed (tracking individual lines to the left from the
right hand side). Relative energy efficiency is the energy efficiency relative to the energy
efficiency when the lamp was undimmed (but connected to the dimmer). Dimmable office
LEDs had similar results (not shown).
Figure 12: Relative energy efficiency of light production for dimmable domestic LEDs.
Inc and TH types all followed the same curve as Figure 13. Note that, putting colour changes
aside, the relative energy efficiency of dimmed LEDs compared favourably to dimmed Inc and
TH lamps (the LED curves tend to remain higher to the left of the graphs), down to about 5%.
Figure 13: Relative energy efficiency of light production for a 60W pearl Incandescent light bulb.
0%
20%
40%
60%
80%
100%
120%
140%
0% 20% 40% 60% 80% 100%
Rel
ativ
e ef
ficie
ncy
Relative illuminance
0%
20%
40%
60%
80%
100%
120%
140%
0% 20% 40% 60% 80% 100%
Rel
ativ
e ef
ficie
ncy
Relative illuminance
Mr S
Nicholas, S
imoncnicholas@
aol.com, 16:42P
M 13/05/2016,

30
On continuing to dim, some of the LED lamps eventually turn off, whereas the relative
efficiency of others reduces to similar levels as Inc and TH lamps (see Figure 14). The lamps
where energy efficiency reduced most quickly (i.e. on the right hand side in Figure 12) were
capable of dimming much further, i.e. reaching a much lower percentage of their original
output. There appears to be a trade-off between preserving efficiency on dimming and
achieving a wider dimmable range (using an LED compatible rheostatic dimmer).
Figure 14: Relative energy efficiency of light production at the dimming limit for dimmable domestic LEDs, with the line for Inc and TH lamps from Figure 13 reproduced for comparison.
6.5 Ocular safety
None of the domestic LED lamps measured emitted ultra-violet radiation or more than
negligible amounts of infrared radiation. None of the lamps measured were bright enough to
cause retinal damage in normal use at reasonable distances.
Moreover, the assessments carried out place them as comparable with traditional light bulbs.
6.6 Miscellaneous issues
Some of the domestic LED lamps had active components that were not fully enclosed, and
this was observed previously outside of this study. Although this does not create an optical
radiation hazard, it is obviously necessary for manufacturers to consider all aspects of safety.
There could be safety issues raised if:
a the heatsink is accessible to direct contact
b the wiring for the LED chips is accessible to direct contact or excessive moisture
c the phosphor, the LED chip, or other small parts can fall off or out of the lamp and
direct contact may also present a problem for toxic materials, if any.
0%
20%
40%
60%
80%
100%
120%
140%
0% 5% 10% 15% 20% 25%
Rel
ativ
e ef
ficie
ncy
Dimming limit (relative illuminance)
Mr
S N
icho
las,
Sim
oncn
icho
las@
aol.c
om, 1
6:42
PM
13/
05/2
016,
31
At least one lamp type tested had holes in the outer casing, presumably for heat management
and/or to reduce the chance of condensation. There has been public concern in the UK about
electrical safety of some LED lamps (LuxLive, 2015), which was a feature in the BBC’s Fake
Britain show. As these aspects are beyond the scope of the study, no further investigations
were conducted relating to these issues. Compliance with relevant IEC safety standards
should prevent these issues arising. Failure to do so may put consumers at risk.
Unexpected condensation was found in the cases of all models of the clear “miniglobe”
domestic LED lighting tested. This was not seen in the filament and GU10 models tested or in
any of the office or street classes of lighting. It was not possible during testing to investigate
whether condensation was ever present in domestic pearl models. The presence of moisture
in the casing of an LED lamp (or almost any device) has the potential to degrade various
aspects of its integrity over time.
Mr S
Nicholas, S
imoncnicholas@
aol.com, 16:42P
M 13/05/2016,

32
7 Office-class LEDs – results
7.1 Batch variation
The large panels were measured at a distance of 2m, and at different offsets from the centre
rather than at different angles. For all the small panels but only for one of the large panels
(row 7 in Tables 9, 10 and 11) three lamps were tested from each batch. For the other large
600 mm by 600 mm panels, only one lamp was available. Otherwise the results for batch
variation and spatial uniformity of the relative spectral power distributions were similar to the
results for the domestic lamps.
Note that one of the small panels had a blue-coloured LED strip surround, producing
observable coloured variations in the illumination of objects sufficiently close to the lamp.
7.2 Colour rendering and CCT
Table 9: The measured colour rendering statistics for all the lamps tested, lamp style and CCTs.
Style CCT, K CRI, Ra CQS, Qa TM-30, Rf TM-30, Rg 100% - HSp
Small panels .. .. ..
2790304050406610
80.673.686.373.3
80.371.883.571.7
80.8 69.6 82.9 70.6
95.7 97.9 95.3 93.5
9.59.78.8
10.7
600 mm by 600 mm panels .. .. ..
3110386038604810
82.381.882.782.1
83.582.783.180.9
83.1 81.4 82.2 79.5
96.7 98.0 96.4 91.0
9.17.98.09.2
Note
CCT values in excess of 3500 K (‘cool’ white) and the best colour rendering metric scores highlighted for each group.
Table 9 shows the CCT values and colour rendering metric scores for all the office-class LED
panels tested. CCT values were also stated by the manufacturers for seven of the models.
One model claimed 3000 K but was measured to be 2791K (unrounded); this was the largest
discrepancy measured for any lamp of any class on the CIE 1960 uniform colour space (see
Section 3 Figure 4). As for the domestic lamps, all the Duv values were within the range
−0.006 to +0.006. No large 2700 K panels were seen that might be considered preferable for
evening lighting in residential and healthcare establishments.
Three models of the small panels tested were marked as having CRI Ra values “>80”; of these
one of the panels Ra was over 86, and the other two were below 74. The larger panels were
loaned; as such they did not come with colour rendering information, but all four models had
both CRI and CQS colour quality values over 80. The market for the 600 mm by 600 mm
panels appears to have better quality options available, comparable with the domestic market.
Just as noted above for domestic lamps, TM-30 Rf largely reproduces the CQS lighting quality
metric results. However it is interesting here that the large panel favoured by the gamut area
and spectral redundancy metrics is not the same lamp the CRI metric favours, and that one of
the large panels does not retain a score over 80 when switching to Rf.
Mr
S N
icho
las,
Sim
oncn
icho
las@
aol.c
om, 1
6:42
PM
13/
05/2
016,

33
7.3 Flicker and dimming
The results are shown in Table 10 for the flicker measurements from the undimmed panels.
The small panels exhibiting close to 100% flicker had a similar waveform to the blue lines in
Figure 9 above (Section 6.3), and the third small panel listed had a smooth sinusoidal
waveform. Again the primary flicker frequency in each case was 100 Hz.
For the large panels, a large contribution to the Percent flicker was caused by high frequency
modulation. As a result only the final panel listed had significant flicker assessed using the
Flicker index metric, which had a smooth, but slightly distorted, sinusoidal waveform.
All four models of small panels and none of the large panels were marked as dimmable. The
output of the dimmable office LED panels tested reduced to around 8.5%, 18%, 17% and 32%
of their maximum illuminance (in the order shown in Table 10). As with the domestic lamps,
therefore, the higher levels of undimmed flicker were loosely associated with dimmable
models.
With one exception dimming the small dimmable panels to the lowest level gave rise to high
levels of flicker. Together with the results from the domestic class, the conclusion is that very
few LED lamps are available on the market that provide acceptable low-flicker illumination
when dimmed with an LED-compatible rheostatic dimmer.
Further details relating to power consumption and dimming are given in Section 7.4.
Table 10: Flicker measurements and undimmed illuminance at approximately 300 mm (small panels) or 2 m (large panels).
Style
Undimmed illuminance,
lux
Undimmed Percent
flicker %
UndimmedFlicker
index %
Dimmed to, % of
maximum
Dimmed Percent
flicker %
Dimmed Flicker
index %
Small panels .. .. ..
3099506
2342732
1.4100.0
30.697.5
0.322.2
9.521.4
8.518.232.017.1
14.4 100.0
54.5 100.0
3.072.616.574.1
600 mm by 600 mm panels .. .. ..
306314337315
6.513.0
1.835.6
1.22.80.2
10.5
----
- - - -
----
Note
Undimmed illuminances were measured without the dimmer attached. % of maximum illumination is measured as the ratio of minimum and maximum illuminances achieved with the dimmer attached.
7.4 Power consumption and dimming
The electrical measurements for the office LED panels are shown in Table 11 alongside the
manufacturers’ stated luminous output, where these were given.
The undimmed power consumption of two models of office lighting panels appeared to be
significantly lower than stated (by approximately15%). Both were small panels produced by
Mr S
Nicholas, S
imoncnicholas@
aol.com, 16:42P
M 13/05/2016,

34
the same manufacturer. The differences are large enough to suggest there is some
unexplained factor. For example, this might be explained if the stated value is over the full
lifetime rather than the first use. However, without further investigation, care should be used in
interpreting these values.
Table 11: Electrical measurements from the power meter and unconfirmed total luminous output.
Style CCT, K
RMS current,
mA
Active power,
W
Apparent power
|VA|, W
Power factor,
%
Stated luminous
output, lm
Small panels .. .. ..
2790304050406610
50275330
12.37.7
12.48.5
13.3 8.4
15.0 9.1
92 92 83 93
760-
850-
600 mm by 600 mm panels .. .. ..
3110386038604810
120180170170
27.343.841.241.7
30.2 45.7 43.0 43.7
91 96 95 95
--
38253900
These values represent quite different levels of dimming capability. All the dimmable panels
performed less well than the median result of the domestic dimmable lamps.
7.5 Ocular safety
None of the office LED lighting measured emitted ultra-violet radiation or more than negligible
amounts of infrared radiation. None of the panels measured were bright enough to cause
retinal damage in normal use at reasonable distances. Moreover, white LED panels were
more innocuous and more visually comfortable than the domestic LEDs, as the emitted light is
evenly spread over a larger area.
7.6 Miscellaneous issues
There has been considerable research into using workplace lighting to enhance productivity.
Relatively recently, attention has turned to the use of high CCT lighting as a replacement or
addition to existing lighting as a means to increase productivity in office environments.
The theory is based on accessing and controlling the non-visual effects of light. The focus is
often on short-term attention, alertness and user preferences. Relatively few studies consider
effects on circadian rhythms, medium and long-term health effects, absenteeism, seasonal
variations or even medium and long-term productivity effects. It remains to be proven what net
benefits controlling the non-visual effects of light has on office workers and for their
employers, or indeed what intervention strategy is optimal in the medium and longer terms.
In contrast to experimentation with CCT, based on Jaén et al (2011) and Veitch and McColl
(1995), installing low flicker illumination would appear to be a simple way to improve
productivity whilst reducing energy consumption, and without any of the same potential for
unplanned consequences.
Mr
S N
icho
las,
Sim
oncn
icho
las@
aol.c
om, 1
6:42
PM
13/
05/2
016,

35
8 Street-class LEDs – results
8.1 Batch variation
The street lights were measured at a distance of approximately 2m, directly opposite the
centre of the luminaire only. Batch variations of the relative spectral power distributions were
similar to the results for the domestic lamps and office lamps, with two exceptions.
The power consumption (see Section 8.4 Table 14 below) from one of three lamps provided
from one manufacturer was around 10% higher than the other two. These lamps have been
analysed as three separate models below. Another lamp from a different batch differed in
colour from the other two. From a third manufacturer, only one lamp was provided. In effect,
the batch consistency was acceptable in three out of five models where more than one lamp
was provided.
None of the street lights were suitable for use with the rheostatic dimmer used in this study,
and none were supplied with alternative dimmers.
8.2 Colour rendering and CCT
Table 12: The measured colour rendering statistics for all the lamps tested, lamp style and CCTs.
Style CCT, K CRI, Ra CQS, Qa TM-30, Rf TM-30, Rg 100% - HSp
Multichip .. .. .. .. .. .. ..
36703680368036903960432048406400
72.572.672.072.376.275.477.972.5
74.074.073.273.874.270.874.571.4
71.371.369.571.072.266.773.665.4
96.2 96.3 97.1 96.2 97.9
100.5 95.7
100.3
9.910.010.110.3
9.510.0
9.610.9
Note
The first, third and fourth were from a single batch. The colour properties were similar, although the lamp in the third row, which had higher illuminance and power consumption, exhibits slightly lower colour fidelity scores and a higher gamut area.
The sixth row represents two out of three of its batch. The third lamp in this batch was excluded. The slight variation in its relative spectral power distribution, colour and CCT (4270 K) only produced minimal changes to the colour rendering metrics.
Table 12 shows the CCT values and colour rendering metric scores for all the street light class
LEDs tested.
For one street light model Duv value was -0.0131 (row 6 in Table 12), so the CCT value
shown in Figure 4 is not compliant with (ANSI, 2008). The same model, nominally 4000 K
street light, had a CCT value of 4321 K (unrounded). All the remaining models had Duv values
within the range −0.006 to +0.006.
As the street lamps were loaned, it was not confirmed whether it was advertised as 4000 K. It
is also worth noting, this is only slightly misstated in terms of the additional distance in the CIE
1960 uniform colour space (see Section 3 Figure 4).
Mr S
Nicholas, S
imoncnicholas@
aol.com, 16:42P
M 13/05/2016,

36
All the measured CCT values were in excess of 3500 K, despite these colour temperatures
providing additional stimulation to the non-visual system. Additional non-visual stimulation may
have short term benefits for road safety, but repeated exposure at night may be detrimental to
health, depending on the dose, i.e. the light exposure received by a person. The systems and
lamps needed to switch between high CCT and low CCT lighting at different hours of darkness
would be expensive (certainly at the present time), so lower CCTs are likely to be more
suitable for street lighting.
There have been arguments that higher colour temperature street lighting provides better
colour rendering. However, the evidence from the street lights measured shows that the CRI
Ra and CQS Qa values were noticeably below 80. For practical reasons, no alternative street
lighting technologies were tested, and it is clear that low and high pressure sodium lights do
have inferior colour rendering to LED street lighting (Boyce, 2014).
The TM-30 gamut area is higher again for a lamp with a high CCT of around 6500 K, and it
may be worth investigating if this metric has a weakness in favour of these high CCT values,
perhaps for this type of LED spectra although this was not observed however for the 6600 K
small LED panel (Table 9).
Using the data from all classes of lamp measured in this study, Rg appears relatively
uncorrelated to either colour temperature or colour fidelity, which is a requirement other gamut
area metrics failed, although this is not sufficient by itself to validate the metric. Another
concern is the results from the CFL measurements demonstrate that Rg can be high for lamps
with ‘spikey’ spectra, i.e. for sources with undesirable high values of spectral redundancy.
8.3 Flicker
The LED street lights tested had lower flicker than might be expected from other LED lighting
technologies (comparing Table 13 to Tables 7 and 10), and lower than the other LED lighting
applications on average. It should be noted that the sample tested was not selected randomly
and not very wide. Conclusions should be drawn with care, but it demonstrates that it is
possible for LEDs and LED street lights to be flicker free, or at least to have the very low
flicker levels of the better products tested.
Table 13: Flicker measurements and illuminance at approximately 2 m.
Style
Undimmedilluminanceat ~2 m, lux
Undimmed Percent
flicker %
UndimmedFlicker
index %
Dimmed to, % of
maximum
Dimmed Percent
flicker %
Dimmed Flicker
index %
Multichip .. .. .. .. .. .. ..
635184695629
58197208434
13.12.9
12.916.0
2.40.96.83.7
3.50.43.44.20.30.21.80.5
- - - - - - - -
- - - - - - - -
--------
Note
The LED street lights were not tested for dimming.
Mr
S N
icho
las,
Sim
oncn
icho
las@
aol.c
om, 1
6:42
PM
13/
05/2
016,

37
The batch analysed as three models in Table 12 (as well as in Tables 13 and 14) had
approximately 13% to 16% Percent flicker and Flicker index values of approximately 3.5% to
4.5%. The single lamp had a Flicker index of 1.8%. Flicker index was 0.5% or less for all the
other street lights, illustrating that it is possible to design LED lighting which is effectively
flicker-free (as was asserted in Section 3). All quoted values are based on 100 Hz flicker, and
no other physiologically relevant frequency of flicker was observed.
8.4 Power consumption
The power consumption of one street light appeared to be significantly lower than stated, and
one lamp from the varied batch of three had a 10% higher power consumption than the other
two. The differences are large enough to suggest there is some unexplained factor. If the
consumption on first use is over-stated, it is possible the stated value is over the full lifetime.
Without further investigation, care should be used in interpreting these values.
Table 14 shows the electrical measurements from the commercial grade power meter, and
illuminance measurements at approximately 2 m. Note that these supplementary
measurements were not carried out to the level of accuracy necessary to derive specifications
or energy efficiency, but are merely given as a rough indication.
Table 14: Electrical measurements from the power meter and illuminance at approximately 2 m.
Style CCT, K
RMS current,
A
Active power,
W
Apparent power
|VA|, W
Power factor,
%
Illuminanceat ~2m,
lux
Multichip .. .. .. .. .. .. ..
36703680368036903960432048406400
320130360320
60160190260
77.029.886.377.0
9.437.544.158.8
80.934.190.181.017.641.048.265.9
94 87 95 94 54 91 91 89
635184695629
58197208434
Note
The total luminous output was only stated for the 6400 K model. The stated total luminous output of 7600 lumens was not confirmed as part of this study.
8.5 Ocular safety
None of the street lamps measured emitted ultra-violet radiation or more than negligible
amounts of infrared radiation. The LED lamps measured were not bright enough to cause
retinal damage in normal use at reasonable distances.
Detailed assessments were made for the street lights. Those assessments do not cover the
safety of street lights close-up, for example work in close proximity by service engineers.
However, at a distance of 2 m, reaching the exposure limit values for the Blue Light Hazard
would require steady fixation for over 2½ hours, based on conservative calculations. LED
street lights could, in theory, be fitted close to a window, balcony, ledge or simply close to the
Mr S
Nicholas, S
imoncnicholas@
aol.com, 16:42P
M 13/05/2016,

38
ground instead of at a normal height. This should be avoided, or appropriate assessments
carried out.
8.6 Miscellaneous issues
The current design of LED street lights consists of discrete bright spots of light, which may
result in temporary visual impairment after looking directly into the lamp. Members of the
public have complained of debilitating after-images due to exposure to LED street lights, as
well as experiencing visual discomfort and distraction. Ayama, 2015, also showed effects from
LED street lights of various CCT values to be evaluated by study participants as “dazzling”
and “very dazzling” in a realistic scenario.
Hotspots were observed for all the LED street light models tested. As an example, Figure 15
shows one of the units and the inset shows an image of it turned-on, but filtered to reduce the
light transmitted by one million times. The hotspots can then be seen clearly. It would be
advisable to design the LED luminaire so that hotspots are not visible within the road user’s
normal field of view. Although there is currently no agreement on the definition of hotspots that
may cause concern, low-cost plastic beam-shaping optics could be used to diffuse the source
and to tailor the footprint of the light pattern at ground level. Alternatively, the LEDs could be
recessed.
Figure 15: One of the LED street lights tested. The inset shows a light controlled photographic image of the LED chips under attenuation by 6 orders of magnitude. Note that similar hotspots were observed on all the models tested.
Mr
S N
icho
las,
Sim
oncn
icho
las@
aol.c
om, 1
6:42
PM
13/
05/2
016,

39
9 Conclusions
Light emitting diodes (LEDs) are being promoted for a wide range of lighting applications on
the basis of increased energy efficiency compared with some other technologies. However,
lighting quality and positive or negative impact on human health are also important. This report
presents the results of a study of a varied purposive sample of over 100 LED lamps and
luminaires for domestic, office and street lighting. Up to 3 lamps from each model were tested.
Altogether there were 38 distinct LED models and 8 models of non-LED domestic lighting for
comparison.
The types of LED lamps selected all consisted of a blue LED combined with one or more
phosphors to produce a white light source.
Although all were approximately ‘white’, the subtler changes in lamp colour from yellow to
blue, as specified by Correlated Colour Temperature (CCT), and from green to purple, as
specified by Duv, were examined.
For LED domestic, office and street lighting, CCT values were reasonably accurate, where
stated, and Duv values were largely within acceptable bounds. However, colour-matching
replacement LED lamps may need manufacturers to provide more colour information than just
CCT, and to increase the accuracy of any information already given.
Traditional measures of colour rendering are not always appropriate for LEDs, so the
performance of the LEDs was also assessed with some more recent methodologies.
For domestic LEDs, no clear associations were observed in our non-random sample between
colour rendering and the lamp cost. However, the colour rendering of domestic LEDs was
consistently better than LED street lights, with office panels results being more varied. In
addition, the street lights were consistently blue-rich, with CCTs between 3600 K and 6400 K.
This finding is somewhat at odds with the arguments often put forward in favour of using
LEDs, and using high CCTs, for street lighting in order to improve colour rendering.
Light levels, based on illuminance at 300 mm, reduced by around 6.6% on average shortly
after first use (the full range being 0.6% to 16.8%). Batch variations in illuminance at 300 mm,
CCT and colour rendering between lamps of the same model were all insignificant.
9.1 Flicker
LEDs are not the only lighting technology that flickers and the electronics that drive LEDs
could be designed to eliminate flicker. Despite this, and based on previous experience, when
this project started it was expected that flicker would be found in a proportion of the products
from across the market.
The LEDs that were found to flicker flickered predominantly at 100 Hz. Percent flicker across
all “classes” covered almost the entire range of 0% to 100%. The LED street lights “Class”
was an exception, with Percent flicker ranging from 0% to approximately 16%.
Flicker index was used to compare flicker levels in domestic and office LED lighting to non-
LED technologies. Around half the domestic and office LEDs, and all the LED street lights,
Mr S
Nicholas, S
imoncnicholas@
aol.com, 16:42P
M 13/05/2016,

40
had lower levels of flicker than alternative technologies, but the flicker levels were usually
much higher in the remaining domestic and office LEDs.
Below around £10 per unit, there was no link found between unit costs and flicker measures.
Although there was less flicker at £10 per unit or above the sample was too small to draw any
definite conclusions.
The implications of flicker from the sources tested range in severity from annoying to
debilitating. The number of people who are seriously affected by flickering light at 100 Hz is
unknown, but it likely to be small. However the general wellbeing and visual performance of a
greater number of people may be affected, so it would be prudent to ensure that LED lighting
installed in public areas does not flicker, or at least flickers no more than incandescent lamps.
If LED lamps sold for the domestic market cause a problem with flicker, it would be
appropriate for retailers to accept the return of these lamps.
Another serious consideration for locations where flickering light sources are used is the
strobe effect on moving equipment. Although this problem is widely recognised in industry due
to issues from magnetically-ballasted fluorescent lamps, the use of flickering light sources in
the home could present similar problems. It is reasonably foreseeable that, for example, food
mixer blades running at high speed could appear stationary.
9.2 Spectrum
The LED street light measurements were limited to a non-random sample of loaned units
provided by manufacturers for the purposes of this study. This section relates to potential
adverse visual and health effects of the spectrum and light distribution provided by LED
lighting at night.
In normal use at reasonable distances and through normal behaviour, none of the LEDs
measured presented any optical radiation hazards as defined by international exposure
guidelines, developed by the International Commission on Non-Ionizing Radiation Protection,
ICNIRP.
The debate about light pollution at night in residential buildings and the night time environment
in general is not unique to LED lighting. However, the roll-out of LED street lighting is
accelerating how much of our night time is lit with high-CCT white light sources. This may be
concerning, as increased levels of blue light exposure in the evening have been shown to
cause melatonin suppression and subsequent phase delays in the melatonin cycle.
LED street lighting could be produced which is low in blue light, and with a diffuse distribution
of light at the source. The samples provided for this study proved to be exclusively high CCT
LEDs with hotspots of very high luminance and this may indicate the prevailing LED street
light design.
However, ascribing these concerns to LEDs in a wider sense risks losing the benefits LED
lighting technology may be able to offer street lighting. Therefore, due to the high capital
outlay and the potential long-term impact of an inappropriate installation, any new LED street
light installations should be subject to an assessment involving qualified lighting professionals,
who should consider the conclusions of this report and any future evidence.
Mr
S N
icho
las,
Sim
oncn
icho
las@
aol.c
om, 1
6:42
PM
13/
05/2
016,

41
9.3 Power consumption and dimming
The stated electrical wattages of the lamps were reasonably accurate, especially compared to
other types of lamps; the actual power consumption of two office lighting panels and one
street light appeared to be significantly lower than stated. Aside from the street lighting, no
significant batch variations in the measured wattage were observed.
Using a commercial grade power meter, the average power factors depended on the
application-class: domestic 60% (31% to 87%), office 92% (83% to 96%), and street lighting
84% (54% to 95%).
Dimmable domestic LED lamps and small office LED panels were also measured using a
standard rheostatic dimmer to control the illuminance levels. The domestic lamps reached as
low as 1% to 20% of their maximum illuminance at the lowest possible setting, with an
average limit of 8% of maximum illuminance. The office lighting reached as low as 8.5% to
32%, of their maximum illuminance at the lowest possible setting, with an average limit of 20%
of maximum illuminance.
Power factors reduced significantly during dimming, for dimmable domestic lamps using a
standard rheostatic dimmer. Flicker generally increased during dimming, in some cases
significantly. The flicker from one domestic LED model increased significantly on dimming
from below the levels from alternative lighting technologies, to above it. For all but two
dimmable LEDs the Flicker index increased significantly (including all four small LED office
panels).
9.4 Conclusion
Compared to other existing lighting technologies, LEDs present valid energy efficient options
for lighting, and the quality and range of LED lighting has improved significantly over the last
five years. However, the differences in costs of the LED lamps tested were not found to be
strongly associated with better lighting quality in terms of colour rendering or flicker.
There are signs that manufacturers are beginning to appreciate the human factors that will
govern public acceptance and attitudes towards LEDs. There may be further to go yet for this
new lighting technology, particularly in the office and outdoor lighting markets. Whilst there are
some concerns about LED lighting, they often relate to the current status of a design, or are
equally applicable to other lighting types.
It is concluded that flicker from LED lighting may be a risk factor for some adverse health
effects in an unknown, but probably small, proportion of the population. Where possible, the
flicker should be no greater than would be experienced from incandescent lamps to minimise
adverse health effects.
Consideration should be given to reducing the CCT of LED lighting to avoid potential adverse
effects on melatonin production in the evening. The science is not yet mature enough to state
a threshold CCT that should not be exceeded in general lighting applications. However, some
of the sources assessed in this study produced higher CCTs than many people in the UK
would find comfortable.
Mr S
Nicholas, S
imoncnicholas@
aol.com, 16:42P
M 13/05/2016,

42
10 References
ANSI, American National Standards Institute (2008). ANSI Standard C78.377, Specifications for the chromaticity of
solid state lighting products. ANSI, Washington, DC.
Andersen M, Mardaljevic J and Lockley SW (2012). A framework for predicting the non-visual effects of daylight–
Part I: photobiology-based model. Lighting Research and Technology, 44(1), 37-53.
Ayama M, Iwata M, Mori T, Iwasaki H, Kohko S, Inoue Y, Itsuki H and Kyoto, N (2015). Discomfort glare of led street
lights with different correlated color temperatures. in Proceedings CIE Session 2015, Vol. 1, Part 1.
Berman SM, Greenhouse DS, Bailey IL, Clear RD and Raasch TW (1991). Human electroretinogram responses to
video displays, fluorescent lighting, and other high frequency sources. Optometry & Vision Science, 68(8), 645-662.
Boyce PR (2014). Human factors in lighting. CRC Press, Boca Raton, FL.
Brindley GS (1962). Beats produced by simultaneous stimulation of the human eye with intermittent light and
intermittent or alternating electric current. The Journal of Physiology, 164(1), 157-167.
Chang AM, Aeschbach D, Duffy JF and Czeisler CA (2015). Evening use of light-emitting eReaders negatively affects
sleep, circadian timing, and next-morning alertness. Proceedings of the National Academy of Sciences, 112(4), 1232-
1237.
Chellappa SL, Steiner R, Oelhafen P, Lang D, Götz T, Krebs J and Cajochen C (2013). Acute exposure to evening
blue‐enriched light impacts on human sleep. Journal of Sleep Research, 22(5), 573-580.
CIE, Commission Internationale de l’Eclairage (2011). CIE S 017/E: 2011, ILV: International Lighting Vocabulary. CIE,
Vienna. [Also see the free on-line version at http://eilv.cie.co.at]
Control of Artificial Optical Radiation at Work Regulations 2010. Statutory Instrument 2010 Number 1140.
David A, Fini PT, Houser KW, Ohno Y, Royer MP, Smet KA, Wei M and Whitehead L (2015). Development of the IES
method for evaluating the color rendition of light sources. Optics Express, 23(12), 15888-15906.
Davis W and Ohno Y (2010). Color quality scale. Optical Engineering, 49(3), 033602-033602.
EC (2006). Directive 2006/25/EC of the European Parliament and of the Council of 5 April 2006 on the minimum
health and safety requirements regarding the exposure of workers to risks arising from physical agents (artificial
optical radiation) (19th individual Directive within the meaning of Article 16(1) of Directive 89/391/EEC). OJ L 114,
27.4.2006, p.38.
ICNIRP (2004). Guidelines on limits of exposure to ultraviolet radiation of wavelengths between 180 nm and 400 nm
incoherent optical radiation). Health Physics 87, 171-186.
ICNIRP (2013). Guidelines on limits of exposure to incoherent visible and infrared radiation. Health Physics. 105, 74-
96.
IEEE, Institute of Electrical and Electronics Engineers (2015). IEEE SA-P1789: 2015, Recommended Practices for
Modulating Current in High-Brightness LEDs for Mitigating Health Risks to Viewers. IEEE, New York.
Jaén EM, Colombo EM, and Kirschbaum CF (2011). A simple visual task to assess flicker effects on visual
performance. Lighting Research and Technology, 43(4). 457-472.
Lucas RJ, Peirson SN, Berson DM, Brown TM, Cooper, HM, Czeisler CA, Figueiro MG, Gamlin PD, Lockley SW,
O’Hagan JB, Price LLA, Provencio I, Skene DJ and Brainard GC (2014). Measuring and using light in the melanopsin
age. Trends in neurosciences, 37(1), 1-9.
LuxLive reporter (2015). Cheap LEDs: buyer beware, LuxLive. Online 20 February 2015, retrieved 1 December 2015,
luxreview.com/article/2015/02/cheap-leds-buyer-beware
Mr
S N
icho
las,
Sim
oncn
icho
las@
aol.c
om, 1
6:42
PM
13/
05/2
016,

43
O’Hagan JB, Khazova M and Price LLA (2016). Low-energy light bulbs, computers, tablets and the blue light hazard.
Eye, 30, 230-233.
Price LLA (2012). Entropy, color, and color rendering. JOSA A, 29(12), 2557-2565.
Rea MS (2013). Value metrics for better lighting. SPIE Press.
Rea MS and Freyssinier-Nova JP (2008). Color rendering: A tale of two metrics. Color research and application,
33(3), 192-202.
Smet KA, David A and Whitehead L (2015). Why color space uniformity and sample set spectral uniformity are
essential for color rendering measures. Leukos, 12(1-2), 39-50.
Veitch JA and McColl SL (1995). Modulation of fluorescent light: Flicker rate and light source effects on visual
performance and visual comfort. Lighting Research and Technology, 27(4), 243-256.
Wilkins AS (2015). Physiological basis for visual discomfort: application in lighting design, in 28th Session of the CIE.
Manchester, 2015. CIE, Vienna. 29-38. (May also appear under the title Spatial and temporal pattern discomfort).
Wilkins AJ, Nimmo-Smith I, Slater AI and Bedocs L (1989). Fluorescent lighting, headaches and eyestrain. Lighting
Research and Technology, 21(1), 11-18.
Wyszecki G and Stiles WS (1982). Color Science: Concepts and Methods, Quantitative Data and Formulae. John
Wiley and Sons, Inc., Hoboken, New Jersey, second edition, 2000.
Mr S
Nicholas, S
imoncnicholas@
aol.com, 16:42P
M 13/05/2016,

44
Appendix A Flicker and other types of domestic lamp
As stated earlier, 100 Hz was the lowest modulation frequency produced by the LEDs tested.
This was also true of the Inc and TH lamps and was to be expected, as these lamps have no
additional electronic drivers. The flicker frequency for Inc and TH lamps is determined by the
effects of the current increasing twice in the 50 Hz AC mains cycle, one time in each direction.
CFLs, which contain electronic drivers, may also flicker at lower frequencies:
a 100 Hz was the dominant flicker frequency (excluding high frequency modulation)
b One model had around 1% flicker at 5 Hz in 2 out of the 3 lamps tested
c For the other CFL model, 2 out of the 4 lamps tested had marginal flicker at 10 Hz,
and a third had marginal flicker at 30 Hz.
This report is primarily interested in LEDs, but these CFL results are being followed-up to
determine whether further actions are needed.
There are also examples of magnetically ballasted fluorescent tubes flickering at 50 Hz, which
the recent IEEE report confirms is inappropriate. This is not uncommon when the ballast
(rather than the tube) ages and needs replacing. Magnetic ballasts are out-dated technology,
and should be replaced by electronic drivers which are also more efficient (Wilkins, 1989).
Mr
S N
icho
las,
Sim
oncn
icho
las@
aol.c
om, 1
6:42
PM
13/
05/2
016,