Human Resources Indicators (June 2011) Resources HR value for money indicators guidance 1)...
29
1 Human Resources HR value for money indicators guidance 1) Introduction This document sets out the indicators for the HR Function. The guidance below starts by defining the scope of the HR function and goes onto identify key questions which reflect the requirements of a modern, value for money HR function that the indicators are aiming to help organisations explore. The scope and key questions are included as background information as well as the primary and secondary indicators. 2) Scope The following activities are defined as within the scope of the HR function: • HR Strategy/change management/organisation development; • Employee relations: staff terms and conditions of employment, industrial relations, diversity and equalities in employment, tribunal claims, grievance and discipline, employee involvement and staff communications, commissioning of employee assistance and welfare, and commissioning of occupational health assessment and testing. • Resourcing: workforce planning, workforce remodelling, job analysis and design, agency and other contingent labour, recruitment and selection, redeployment and transfers, redundancy Transfer of Undertakings (Protection of Employment) Regulations, (TUPE); • Individual performance management: competency and skills planning/ frameworks, performance standards, employee appraisal, secondments, absence management; • Reward and recognition: pay and reward strategy, flexible benefits, post grading, employee recognition schemes; • Learning and development: strategy, training needs analysis, commissioning, delivery and evaluation of learning and development; • Health and safety: policy and procedure development, incident management, compliance and inspection regime. The following activities are outside the scope: • Pensions administration; • Payroll (this is covered under the Finance Function although we recognise that in some organisations this falls under the HR Function. If this is the case please also refer to secondary indicator 10 in the Finance indicators guidance which relate to Payroll); • Ensuring equality and diversity in the delivery of services; • Delivery of occupational health assessment and testing; and • Delivery of employee assistance and welfare. 3) Key questions In order to help derive our VFM indicators for the HR function, we have identified some key questions that reflect a modern, value for money HR function which we hope the indicators will help to explore:
Transcript of Human Resources Indicators (June 2011) Resources HR value for money indicators guidance 1)...

1
Human Resources
HR value for money indicators guidance 1) Introduction This document sets out the indicators for the HR Function. The guidance below starts by defining the scope of the HR function and goes onto identify key questions which reflect the requirements of a modern, value for money HR function that the indicators are aiming to help organisations explore. The scope and key questions are included as background information as well as the primary and secondary indicators. 2) Scope The following activities are defined as within the scope of the HR function:
• HR Strategy/change management/organisation development;
• Employee relations: staff terms and conditions of employment, industrial relations, diversity
and equalities in employment, tribunal claims, grievance and discipline, employee involvement and staff communications, commissioning of employee assistance and welfare, and commissioning of occupational health assessment and testing.
• Resourcing: workforce planning, workforce remodelling, job analysis and design, agency
and other contingent labour, recruitment and selection, redeployment and transfers, redundancy Transfer of Undertakings (Protection of Employment) Regulations, (TUPE);
• Individual performance management: competency and skills planning/ frameworks,
performance standards, employee appraisal, secondments, absence management;
• Reward and recognition: pay and reward strategy, flexible benefits, post grading, employee
recognition schemes;
• Learning and development: strategy, training needs analysis, commissioning, delivery and
evaluation of learning and development;
• Health and safety: policy and procedure development, incident management, compliance
and inspection regime. The following activities are outside the scope:
• Pensions administration;
• Payroll (this is covered under the Finance Function although we recognise that in some
organisations this falls under the HR Function. If this is the case please also refer to secondary indicator 10 in the Finance indicators guidance which relate to Payroll);
• Ensuring equality and diversity in the delivery of services;
• Delivery of occupational health assessment and testing; and
• Delivery of employee assistance and welfare.
3) Key questions In order to help derive our VFM indicators for the HR function, we have identified some key questions that reflect a modern, value for money HR function which we hope the indicators will help to explore:
2
• Is the HR function cost-effective?
• Are HR processes operated in an efficient and timely manner?
• Is the HR function effectively supporting the organisation in ensuring it has the right people,
in the right place, at the right time?
• Is the HR function proactively planning for future resource needs and taking appropriate
action to address gaps?
• Does HR ensure there is appropriate investment in terms of capacity building within the
organisation including leadership development?
• Is the HR function helping to effectively promote and manage the health, safety and
wellbeing of staff?
• Is the HR function helping the organisation to effectively manage individual employee
performance?
• Does the HR function help to ensure the organisation appropriately recognises and rewards
employees?
• Does the HR function help to ensure a diverse workforce?
• Are internal customers satisfied with the services provided by HR?
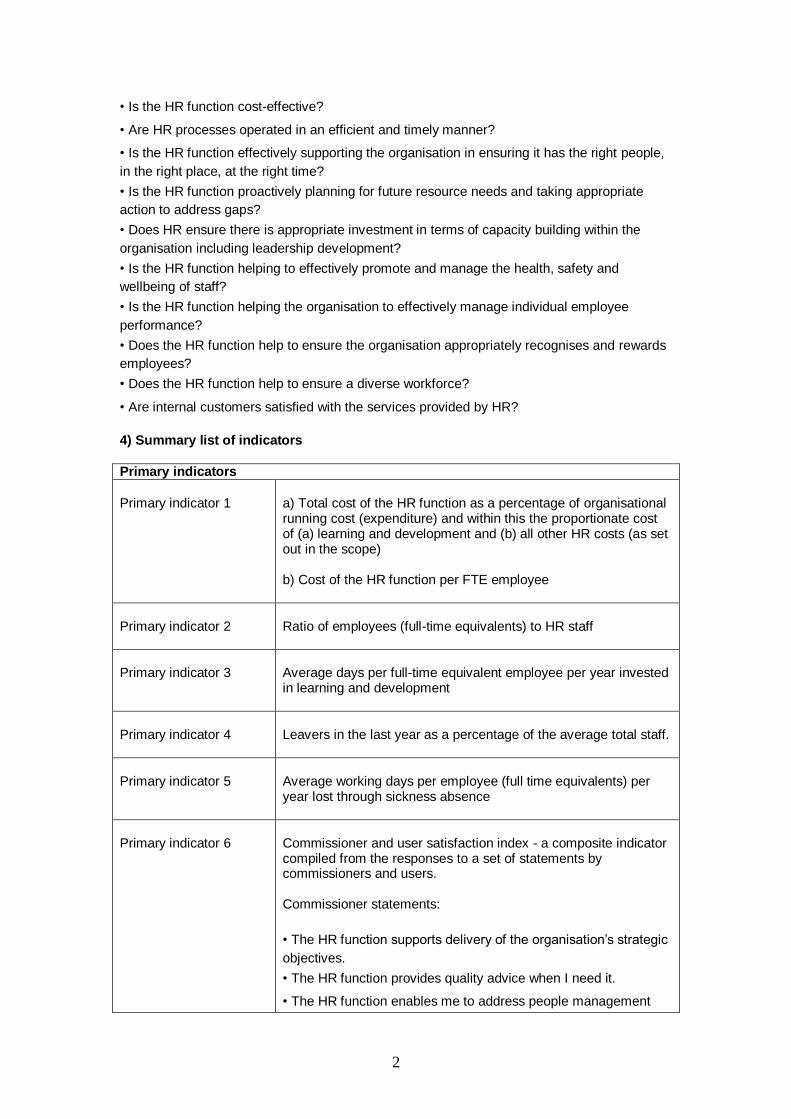
4) Summary list of indicators
Primary indicators
Primary indicator 1
a) Total cost of the HR function as a percentage of organisational running cost (expenditure) and within this the proportionate cost of (a) learning and development and (b) all other HR costs (as set out in the scope) b) Cost of the HR function per FTE employee
Primary indicator 2
Ratio of employees (full-time equivalents) to HR staff
Primary indicator 3
Average days per full-time equivalent employee per year invested in learning and development
Primary indicator 4
Leavers in the last year as a percentage of the average total staff.
Primary indicator 5
Average working days per employee (full time equivalents) per year lost through sickness absence
Primary indicator 6
Commissioner and user satisfaction index - a composite indicator compiled from the responses to a set of statements by commissioners and users. Commissioner statements:
• The HR function supports delivery of the organisation’s strategic
objectives.
• The HR function provides quality advice when I need it.
• The HR function enables me to address people management

3
issues.
• The HR function anticipates the organisation’s workforce issues
and addresses them.
• The HR function provides value for money.
User statements:
• The organisation offers flexible remuneration and benefits
options which take account of the different needs of staff.
• The organisation takes the well-being of staff seriously.
• The appraisal process helps me set measurable objectives
which make clear what is expected of me.
• I receive appropriate learning and development in relation to my
needs.
• I know where to go if I have a query relating to an HR issue.
Primary indicator 7
Management practice indicator – the number practices that have been adopted by the organisation out of a possible total of 10. 1) Within the last three years the HR Function has rationalised the number of sets of Terms and Conditions in use in the organisation by five per cent. 2) The organisation has undertaken equality impact assessments across all key service areas within the last three years, and is implementing an action plan which targets areas of vulnerability. 3) There is employee self-service through desktop access to modify non-sensitive HR data. 4) All employees have clear and measurable outcome based targets set at least annually. 5) All employees have had the opportunity for a formal, documented performance review at least on an annual basis which can track personal/professional improvement. 6) The organisation carries out a survey of staff satisfaction levels at least biennial, publishes the results, has developed an action plan and monitors delivery of that plan on at least a quarterly basis 7) The organisation explicitly requests that employees declare that they have complied with any Continuous Professional Development (CPD) requirements of their professional institute (where applicable). 8) The organisation has a statement which anticipates the workforce requirements of the organisation over the medium-term (at least 3 years) and an action plan agreed by the Executive / Corporate Management Team which sets out how those requirements are met and is monitored on a 6 monthly or more frequent basis.

4
9) A comprehensive professional development programme is in place for professional HR staff which ensures that they receive at least five days of continuing professional development per annum. 10) It is possible to apply on-line for all vacancies for which external applications are invited.
Secondary indicators
Secondary indicator 1
Cost of learning and development activity as percentage of the total pay-bill
Secondary indicator 2
Cost of agency staff as a percentage of the total pay-bill (excluding those counted in secondary indicator 3)
Secondary indicator 3
Percentage of posts currently in the leadership of the organisation which are filled by people who are not permanent in that position.
Secondary indicator 4
Average elapsed time (working days) from a vacancy occurring to the acceptance of an offer for the same post.
Secondary indicator 5
Cost of recruitment per post filled
Secondary indicator 6
Reported injuries, diseases and dangerous occurrences per 1,000 employees per year
Secondary indicator 7
Percentage of people that are still in post after 12 months service
Secondary indicator 8
Cases of disciplinary action per 1,000 employees
Secondary indicator 9
Percentage of staff who receive (at least) an annual face to face performance appraisal
Secondary indicator 10
Percentage of leadership posts occupied by women
Secondary indicator 11
Percentage of employees who consider themselves to have a disability
Secondary indicator 12
Percentage of employees aged 50 or over
Secondary indicator 13
Percentage of Black and Minority Ethnic (BME) employees in the workforce

5
5) Detailed definitions for Primary indicators
Reference number
Primary indicator 1
Description
a) Total cost of the HR function as a percentage of organisational running cost (expenditure) and within this the proportionate cost of (a) learning and development and (b) all other HR costs (as set out in the scope) b) Cost of the HR function per FTE employee
Rationale and expected impact on behaviour
This is a high-level indicator of the cost-effectiveness of the HR function. In most circumstances organisations would aim to reduce their HR costs over time. However organisations that score poorly on measures designed to test the effectiveness of the HR function (for example primary indicators 4, 5, 6 and 7) and also spend less on HR than the benchmark for their peers, will wish to consider whether extra investment would secure better value for money. Organisations that spend more than their peer organisations may wish to consider whether this is because, for example, they have an above average score against effectiveness criteria or whether there is scope for efficiency savings (for example evidenced by a disproportionately high cost of recruitment per vacancy, secondary indicator 5). Learning and development is critical in helping to shape a workforce to meet ever changing business needs. There is a clear link between on-going learning, motivation and the achievement of corporate goals.
Definition
The indicator should be based on figures for the latest financial year. This indicator includes the costs of HR secondary 1, learning and development. The cost of the function is per full time employee. Total cost of the HR function should include:
• Employee costs for all HR staff only (including employers NI,
pension and recruitment costs). Where HR staff are devolved in the organisation, include the total cost of those staff who spend more than 50 per cent of their time on HR activities. Where time recording is used exact costs of HR staff should be used.
• IT costs
• Accommodation costs
• Supplies / consumables

6
• Outsourcing costs
• Recruitment costs
• Learning and development costs
• Other costs
Part (a) Organisational running costs (expenditure) Organisational running costs (expenditure) are the costs for delivering the primary responsibilities / remit of the organisation. Pension cost adjustments as required under FRS 17 should be excluded from organisational running costs – in-year service costs should be included. It should also exclude transfer payments, capital programme spend, and programme spend grants, precepts and other funds which simply flow through to another body, for example grants made to voluntary organisations. It should include payments made to any contractors for services which are within the main remit of the organisation (for example a refuse contract in a local authority. Part (b) Employees For this part the denominator should be based on full time equivalent employees. Include permanent staff only. Staff on fixed term contracts and temporary staff that have been employed by the organisation for over a year should be considered permanent. Casual staff (i.e. those not employed on a regular basis but when a particular need arises) and those employed by outside contractors (e.g. private companies), are not to be counted. Example (a) To calculate the cost of the HR function as a percentage of organisational running costs (expenditure) Organisational running costs (expenditure) = £32 million Cost of HR function = £300,000 Cost of HR as a percentage of organisational costs is therefore 300,000 / 32,000,000 = 0.94 per cent (b) To calculate the cost of the HR function per employee. Cost of HR function = £300,000 Employees = 5,000 Cost per employee is therefore 300,000 / 5,000 = £60
7
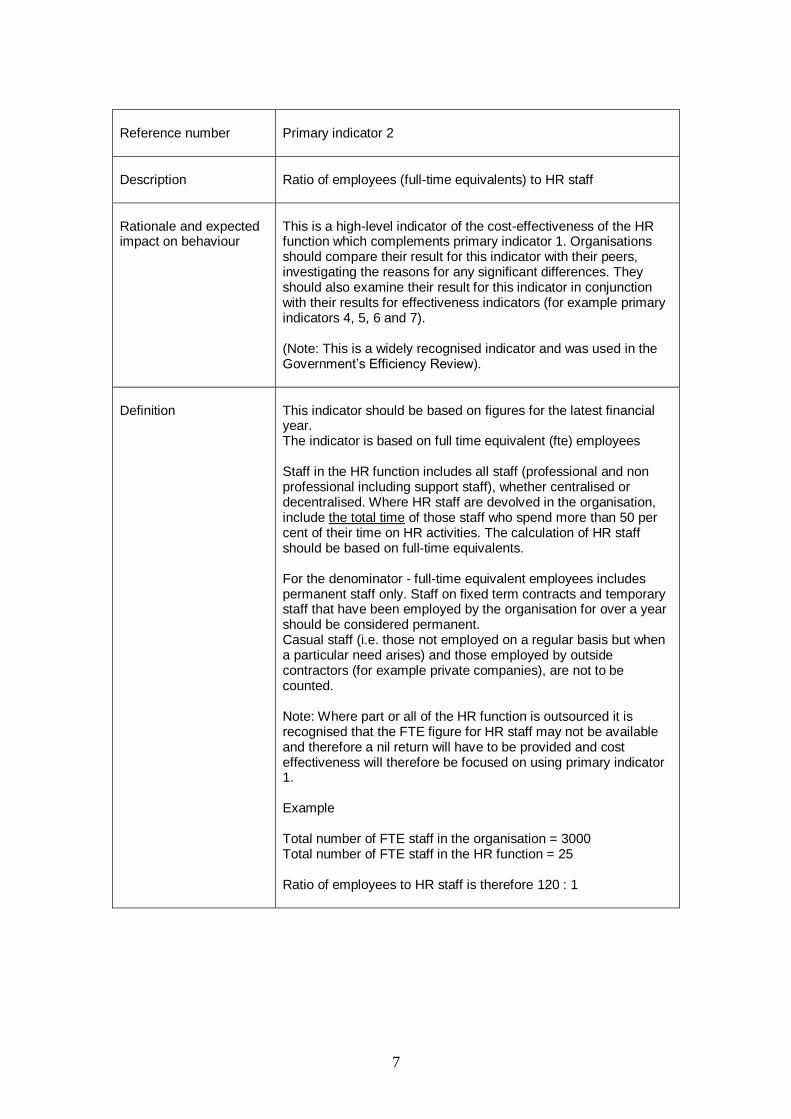
Reference number
Primary indicator 2
Description
Ratio of employees (full-time equivalents) to HR staff
Rationale and expected impact on behaviour
This is a high-level indicator of the cost-effectiveness of the HR function which complements primary indicator 1. Organisations should compare their result for this indicator with their peers, investigating the reasons for any significant differences. They should also examine their result for this indicator in conjunction with their results for effectiveness indicators (for example primary indicators 4, 5, 6 and 7). (Note: This is a widely recognised indicator and was used in the Government’s Efficiency Review).
Definition
This indicator should be based on figures for the latest financial year. The indicator is based on full time equivalent (fte) employees Staff in the HR function includes all staff (professional and non professional including support staff), whether centralised or decentralised. Where HR staff are devolved in the organisation, include the total time of those staff who spend more than 50 per cent of their time on HR activities. The calculation of HR staff should be based on full-time equivalents. For the denominator - full-time equivalent employees includes permanent staff only. Staff on fixed term contracts and temporary staff that have been employed by the organisation for over a year should be considered permanent. Casual staff (i.e. those not employed on a regular basis but when a particular need arises) and those employed by outside contractors (for example private companies), are not to be counted. Note: Where part or all of the HR function is outsourced it is recognised that the FTE figure for HR staff may not be available and therefore a nil return will have to be provided and cost effectiveness will therefore be focused on using primary indicator 1. Example Total number of FTE staff in the organisation = 3000 Total number of FTE staff in the HR function = 25 Ratio of employees to HR staff is therefore 120 : 1
8
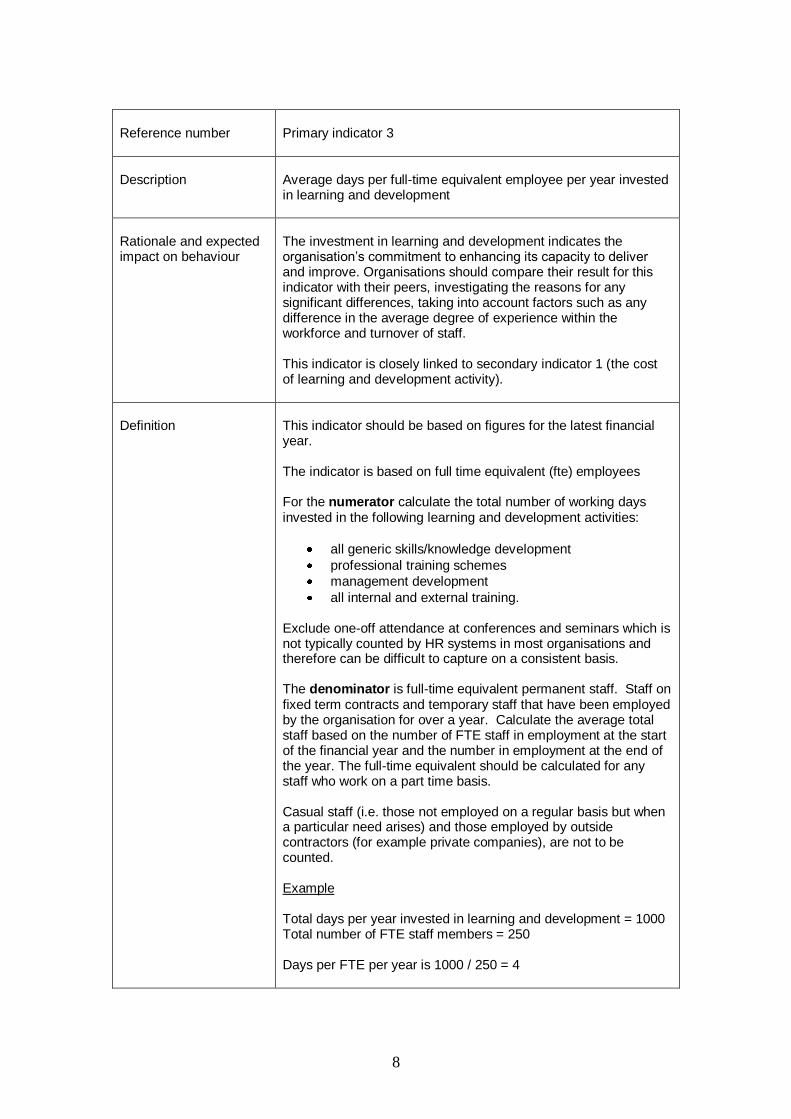
Reference number
Primary indicator 3
Description
Average days per full-time equivalent employee per year invested in learning and development
Rationale and expected impact on behaviour
The investment in learning and development indicates the organisation’s commitment to enhancing its capacity to deliver and improve. Organisations should compare their result for this indicator with their peers, investigating the reasons for any significant differences, taking into account factors such as any difference in the average degree of experience within the workforce and turnover of staff. This indicator is closely linked to secondary indicator 1 (the cost of learning and development activity).
Definition
This indicator should be based on figures for the latest financial year. The indicator is based on full time equivalent (fte) employees For the numerator calculate the total number of working days invested in the following learning and development activities:
all generic skills/knowledge development
professional training schemes
management development
all internal and external training.
Exclude one-off attendance at conferences and seminars which is not typically counted by HR systems in most organisations and therefore can be difficult to capture on a consistent basis. The denominator is full-time equivalent permanent staff. Staff on fixed term contracts and temporary staff that have been employed by the organisation for over a year. Calculate the average total staff based on the number of FTE staff in employment at the start of the financial year and the number in employment at the end of the year. The full-time equivalent should be calculated for any staff who work on a part time basis. Casual staff (i.e. those not employed on a regular basis but when a particular need arises) and those employed by outside contractors (for example private companies), are not to be counted. Example Total days per year invested in learning and development = 1000 Total number of FTE staff members = 250 Days per FTE per year is 1000 / 250 = 4

9
Reference number
Primary indicator 4
Description
Leavers in the last year as a percentage of the average total staff.
Rationale and expected impact on behaviour
This indicator aims to look at the stability of the workforce. Some turnover in an organisation is accepted as healthy but a high level of turnover can indicate problems in organisational leadership, culture and management and can impact on organisational performance (for example through loss of capacity, loss of valuable skills and knowledge etc). Organisations may wish to compare their turnover rates with their peers, examining whether there are robust reasons for any significant differences. In most circumstances organisations would seek to reduce the percentage of leavers over time.
Definition
This indicator should be based on figures for the latest financial year. The indicator is based on actual leavers and full time equivalent (fte) employees for the denominator The numerator should be based on all permanent staff who leave voluntarily during the year. Exclude staff who leave due to retirement or expiry of fixed-term contracts, casual staff and those employed by outside contractors. The denominator is the total number of FTE permanent staff and staff on fixed term contracts and temporary staff that have been employed by the authority for over a year. Calculate the FTE average in employment at the start of the financial year and the number in employment at the end of the year. The full-time equivalent should be calculated for any staff who work on a part time basis. Exclude casual staff (i.e. those not employed on a regular basis but when a particular need arises) and those employed by outside contractors (for example private companies), from both the numerator and the denominator. Example Total number of staff at the beginning of the financial year = 250 Total number of staff at the end of the financial year = 220 Number of leavers in the last year = 10 Leavers as a percentage of total staff is 10 / (250 + 220 / 2) x 100 per cent = 4.3 per cent

10
Reference number
Primary indicator 5
Description
Average working days per employee (full time equivalent) per year lost through sickness absence.
Rationale and expected impact on behaviour
Looks at the effectiveness of the HR function in terms of impact on the overall levels of sickness absence in the organisation through development of processes and procedures, and training for managers. Organisations should aim to reduce the number of days lost through sickness absence over time.
Definition
The indicator is based on full time equivalent (fte) employees This indicator should be based on figures for the latest financial year. It includes all permanent staff and those temporary or fixed term staff who have been employed for over a year. Agency staff are excluded. The numerator is the total number of working days lost due to sickness absence, which includes, absence which is self-certified, certified by a GP, long-term (even if staff are unpaid), industrial injury or disability. Where an employee reports sick part way through a working day/shift, authorities should record the information to the nearest half-day/shift. Authorised leave which is not sickness absence, for example, maternity, paternity, adoption, maternity support, or parental leave should not be included The denominator is the average number of all FTE staff employed during the financial year. (Working days/shifts, means days/shifts scheduled for work after holidays/leave days have been excluded).
For part-time staff, the organisation should calculate the FTE for both the numerator and denominator on a consistent basis. For example, where the standard working week for full time employees is 36.25 hours, someone working a 15 hr week counts as 41% FTE, therefore, such an employee with 9 shifts lost due to sickness absence would have 9 X .41 = 3.7 days sickness absence. Example Total number of days lost per year through sickness absence = 700 Total number of FTE staff = 500
Days lost per employee is 700 / 500 = 1.4
It should be noted that in smaller organisations a small number of long-term absences could potentially distort the result. In drilling down from this indicator organisations should ask how the overall figure is made up (for example is it due to a large number of short-term absences, or alternatively a small number of long term absences).

11
Reference number
Primary indicator 6
Description
Commissioner and user satisfaction index - a composite indicator compiled from the responses to a set of statements by commissioners and users.
Rationale and expected impact on behaviour
This indicator examines the effectiveness of the HR function by assessing the perceptions of its commissioners and users. The statements have been identified because they are considered to indicate whether the function communicates effectively with its commissioners and users, and is responsive to the requirements of the organisation. Over time, organisations should seek to increase the proportion of commissioners and users agreeing with the statements. It is unlikely that an organisation will report a figure of 5 and to avoid rounding they should report to one decimal place. (Organisations may wish to incorporate these statements into existing surveys of users and commissioners.)
Definition
The commissioner and user statements are as follows: Commissioners are defined as senior management for example, senior decision-makers within the organisation. Users are those internal staff that use the function, for example, frontline managers and staff. Commissioner statements:
The HR function supports delivery of the organisation’s strategic objectives.
The HR function provides quality advice when I need it.
The HR function enables me to address people management issues.
The HR function anticipates the organisation’s workforce issues and addresses them.
The HR function provides value for money. User statements:
The organisation offers flexible working, remuneration and benefits options which take account of the different needs of staff.
The organisation takes the well-being of staff seriously.
The appraisal process helps me set measurable objectives which make clear what is expected of me.

12
I receive appropriate learning and development in relation to my needs.
I know where to go if I have a query relating to an HR issue.
Apply to permanent staff only. Staff on fixed term contracts and temporary staff that have been employed by the authority for over a year should be considered permanent.

13
Reference number
Primary indicator 7
Description
Management practice indicator – the number of practices that have been adopted by the organisation out of a possible total of 10.
Rationale and expected impact on behaviour
The aim of this indicator is to assess the extent to which the HR function achieves a set of key management practices which will provide an indication of whether it is a well-run, modernised and mature function. It is not anticipated that most organisations will have adopted all of the practices listed when first measuring themselves against this indicator set. However organisations should expect that the number of practices that they have adopted would increase over time. (The list of practices will be updated, if appropriate, in future revisions of the indicator set).
Definition
The management practices indicator consists of 10 statements of management practice. The respondent should assess whether their organisation follows each practice as set out below: 1) Within the last three years the HR Function has reviewed and rationalised the number of sets of Terms and Conditions in use in the organisation by at least five per cent. 2) The organisation has undertaken equality impact assessments across all key service areas within the last three years, and is implementing an action plan which targets areas of vulnerability. 3) There is employee self-service through desktop access to modify non-sensitive HR data. 4) All employees have clear and measurable outcome based targets set at least annually. 5) All employees have had a formal, documented performance review at least on an annual basis which can track personal/professional improvement. 6) The organisation carries out a survey of staff satisfaction levels at least biennial, publishes the results, has developed an action plan and monitors delivery of that plan on at least a quarterly basis. 7) The organisation explicitly requests that employees declare that they have complied with any Continuous Professional Development (CPD) requirements of their professional institute (where applicable). 8) The organisation has a statement which anticipates the workforce requirements of the organisation over the medium-term

14
(at least 3 years) and an action plan agreed by the Executive / Corporate Management Team which sets out how those requirements are met and is monitored on a 6 monthly or more frequent basis. 9) A comprehensive professional development programme is in place for professional HR staff. 10) It is possible to apply on-line for all vacancies for which external applications are invited. For each practice tick ‘yes’ if the organisation has fully implemented that practice. For each practice tick ‘no’ if the organisation:
• Does not have that practice in place;
• Has the intention to develop this practice but it is
currently not in place; or
• Is currently implementing this practice but it is not yet fully in
place. The organisation should then count the number of questions where they answered ‘yes’ in order to calculate their score. The maximum score is therefore 10.

15
6) Detailed definitions for Secondary indicators
Reference number
Secondary indicator 1
Description
Cost of learning and development activity as a percentage of the total pay-bill.
Rationale and expected impact on behaviour
The level of expenditure on learning and development indicates the organisation’s commitment to enhancing its capacity to deliver and improve. This complements primary indicator 3 (average days invested in learning and development per employee). In both cases organisations should compare their results with their peers, investigating the reasons for any significant differences, taking into account factors such as any difference in the average degree of experience within the workforce and turnover of staff.
Definition
This indicator should be based on figures for the latest financial year. Include all formal learning and development activities, including generic skills/knowledge, professional qualifications, management development, but exclude one-off attendance at conferences, seminars, etc. Includes all internal and external training. For internal training, include the costs of development and delivery (costs of the trainer, the venue and materials etc.), but exclude the cost of the delegate’s time away from work, and any replacement staffing costs that may be incurred. For external training, include the cost of course fees and any associated direct costs such as travel costs and other expenses, but exclude the cost of the delegate’s time away from work, and any replacement staffing costs that may be incurred. The total pay-bill should be calculated as the total cost of gross pay (including London weighting, performance related pay, honoraria and market supplements) in a year and excluding overtime and fringe benefits (such as leases of free cars, health insurance, PCs, mobiles and other non-cash benefits). Example Total cost of learning and development activity = £2 million Total pay-bill = £20 million Cost as a percentage of the overall pay bill is 2,000,000 / 20,000,000 = 10 per cent

16
Reference number
Secondary indicator 2
Description
Cost of agency staff as a percentage of the total pay-bill (excluding those counted in secondary indicator 3)
Rationale and expected impact on behaviour
Reliance on agency staff can increase costs significantly and not necessarily represent value for money. Most organisations would therefore aim to reduce the proportion of their pay-bill spent on agency staff although they may (of course) need to use agency staff to good effect to manage variability in workload especially at short notice.
Definition
This indicator should be based on figures for the latest financial year. The cost of agency staff should be calculated as the total cost of all agency staff employed throughout the year, including any fees and charges that may apply such as brokerage or commission payable. Local authorities should exclude all supply teachers. Exclude any staff who are included in the numerator for secondary indicator 3 (i.e. any interim staff in leadership posts). The total pay-bill should be calculated as the total cost of gross pay (including employer’s on-cost (NI and superannuation) London weighting, performance related pay, honoraria and market supplements) in a year and excluding overtime and fringe benefits (such as leases of free cars, health insurance, PCs, mobiles and other non-cash benefits). Example Cost of agency staff = £300,000 Total pay-bill = £2 million Cost of agency staff as a percentage of the overall pay bill is 300,000 / 2,000,000 x 100 per cent = 15 per cent

17
Reference number
Secondary indicator 3
Description
Percentage of posts currently in the leadership of the organisation which are filled by people who are not permanent in that position.
Rationale and expected impact on behaviour
The degree of stability of the leadership of an organisation is a critical feature in terms of organisational performance and culture. Organisations performing at a sub-optimal level tend to have a significant proportion of non-permanent staff in leadership positions. In most cases organisations would therefore aim to reduce the percentage of non-permanent staff in leadership positions.
Definition
These posts would be where people are (1) acting up from a lower graded post (2) interim managers on a short term contract (3) management consultants or (4) vacant posts. Normally, the leadership of an organisation would be defined as the top five per cent of earners, although this will vary according to the size of the organisation. In smaller organisations, the leadership team should be self-defined but as a minimum they should include the second tier or Assistant Director level depending upon which is lower, and should include as a minimum all posts which are in the top five per cent of earners. To calculate the top five per cent of earners rank all staff by gross pay including part-timers as the appropriate fraction of an FTE. Draw a line where you reach five per cent of the FTEs counting down from the top (but if some people just below this point are on an identical salary to those just above it, include all people on that salary). The indicator should be based on the current position at time of completion i.e. a snapshot in time. Example Number of leadership posts in the organisation which are filled by people who are not permanent in that position = 3 Total number of posts in the leadership of the organisation = 70 Percentage of non-permanent staff is 3 / 70 = 4.3 per cent

18
Reference number
Secondary indicator 4
Description
Average elapsed time (working days) from a vacancy occurring to the acceptance of an offer for the same post.
Rationale and expected impact on behaviour
This is an indicator of efficiency for a key HR process – recruitment to fill vacant posts. Organisations should generally aim to reduce the number of working days needed to fill vacant posts. This indicator complements secondary indicator 5.
Definition
This indicator should be based on figures for the latest financial year. Elapsed time should be measured in working days. Vacancy occurs on the date of resignation or dismissal - retirements (for whatever reason) are excluded, as is recruitment to new posts, for example, created because of restructuring. Thus, we propose to focus on vacancies that are unscheduled rather than planned. The appointment of both temporary and permanent staff is included, as well as recruitment to both temporary and permanent posts, and part time as well as full time posts. Appointments refer to internal and external appointments that have been filled though a competitive selection process. The filling of vacant posts by agency staff is excluded, as are ‘as and when’ employees. Acceptance of an offer can be taken as verbal confirmation of a contract.

19
Reference number
Secondary indicator 5
Description
Cost of recruitment per post filled
Rationale and expected impact on behaviour
This complements secondary indicator 4. While organisations should usually aim to reduce the unit cost of recruitment, they should examine the result of this indicator in conjunction with primary indicator 4 (leavers as a proportion of total staff) and secondary indicator 7 (the percentage of staff still in post after 12 months). Where organisations spend less on recruitment than their peers but have below average staff retention they may wish to consider whether extra investment in recruitment is likely to offer better value for money.
Definition
This indicator should be based on figures for the latest financial year. Posts filled relate to internal and external appointments that have been filled through a competitive selection process. Cost should be the sum of HR staff time – plus direct outlays such as advertising, recruitment agencies’ fees, assessment centres, reimbursement of expenses, bounties paid to staff. Include all staff costs related to all recruitment processing activities from when a vacancy occurs to acceptance of an offer. Exclude any relocation payments and recruitment premiums (for example ‘Golden Hellos’) paid to candidates. The indicator should cover all posts filled but exclude the recruitment of casual staff, and the recruitment of management consultants and interim managers.

20
Reference number
Secondary indicator 6
Description
Reported injuries, diseases and dangerous occurrences per 1,000 employees per year
Rationale and expected impact on behaviour
This measures the effectiveness of the organisation’s health and safety procedures. Organisations would expect to achieve a period-on-period reduction in the number of incidents although organisations reporting extremely low figures compared to their peers may wish to consider whether all relevant occurrences are correctly reported.
Definition
The indicator is based on full time equivalent (fte) employees This indicator should be based on figures for the latest financial year. This indicator is based on the Reporting of Injuries, Diseases and Dangerous Occurrences Regulations, 1995 (RIDDOR), which came into force on 1 April 1996. RIDDOR '95 requires the reporting of work-related accidents, diseases and dangerous occurrences – specifically deaths, major injuries, accidents resulting in over three day injury, diseases, dangerous occurrences and gas incidents. It applies to all work activities, but not to all incidents. The indicator should be based on all employees including casual staff but exclude those employed by outside contractors (for example private companies). Example Total number of reported injuries, diseases and dangerous occurrences in the latest financial year= 44 Total number of staff = 3500 Reported incidents per 1,000 employees is 44 / (3500 / 1000) = 12.5 Note: In some sectors the nature of the service provided increases the risk of injuries and dangerous occurrences (for example Fire and Police). It is therefore important to understand the context and use appropriate cross-sector comparisons.
21
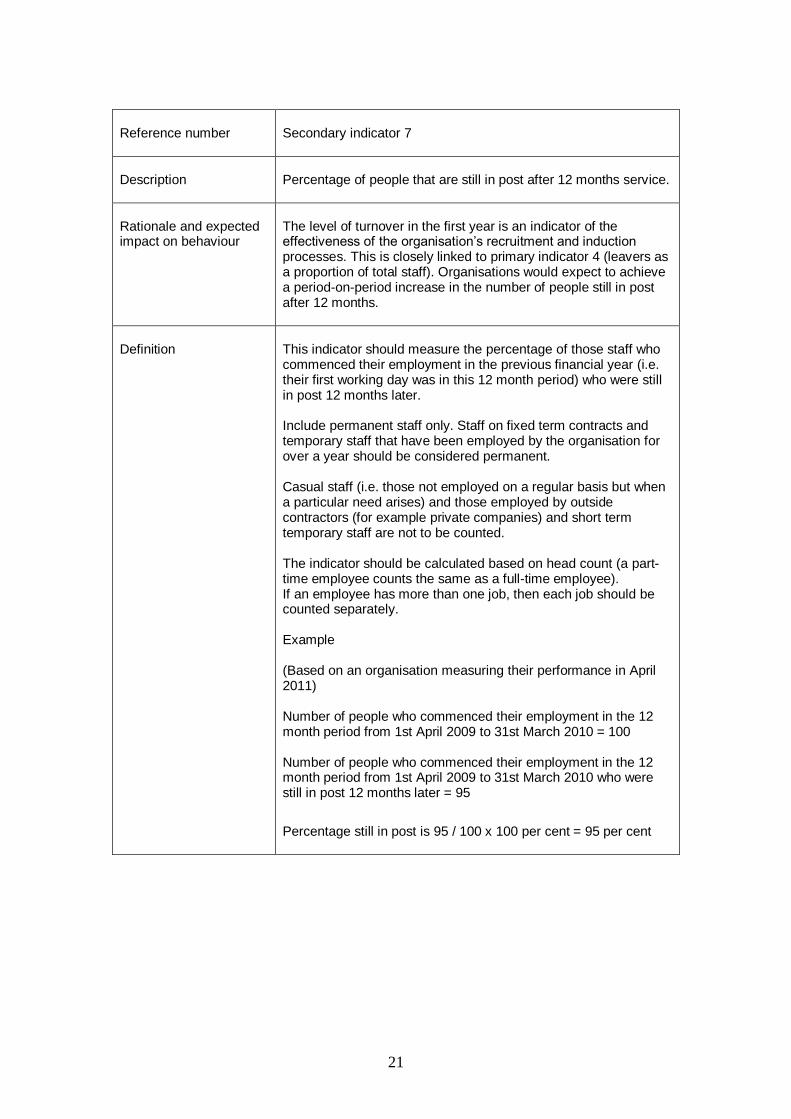
Reference number
Secondary indicator 7
Description
Percentage of people that are still in post after 12 months service.
Rationale and expected impact on behaviour
The level of turnover in the first year is an indicator of the effectiveness of the organisation’s recruitment and induction processes. This is closely linked to primary indicator 4 (leavers as a proportion of total staff). Organisations would expect to achieve a period-on-period increase in the number of people still in post after 12 months.
Definition
This indicator should measure the percentage of those staff who commenced their employment in the previous financial year (i.e. their first working day was in this 12 month period) who were still in post 12 months later. Include permanent staff only. Staff on fixed term contracts and temporary staff that have been employed by the organisation for over a year should be considered permanent. Casual staff (i.e. those not employed on a regular basis but when a particular need arises) and those employed by outside contractors (for example private companies) and short term temporary staff are not to be counted. The indicator should be calculated based on head count (a part-time employee counts the same as a full-time employee). If an employee has more than one job, then each job should be counted separately. Example (Based on an organisation measuring their performance in April 2011) Number of people who commenced their employment in the 12 month period from 1st April 2009 to 31st March 2010 = 100 Number of people who commenced their employment in the 12 month period from 1st April 2009 to 31st March 2010 who were still in post 12 months later = 95
Percentage still in post is 95 / 100 x 100 per cent = 95 per cent
22
Reference number
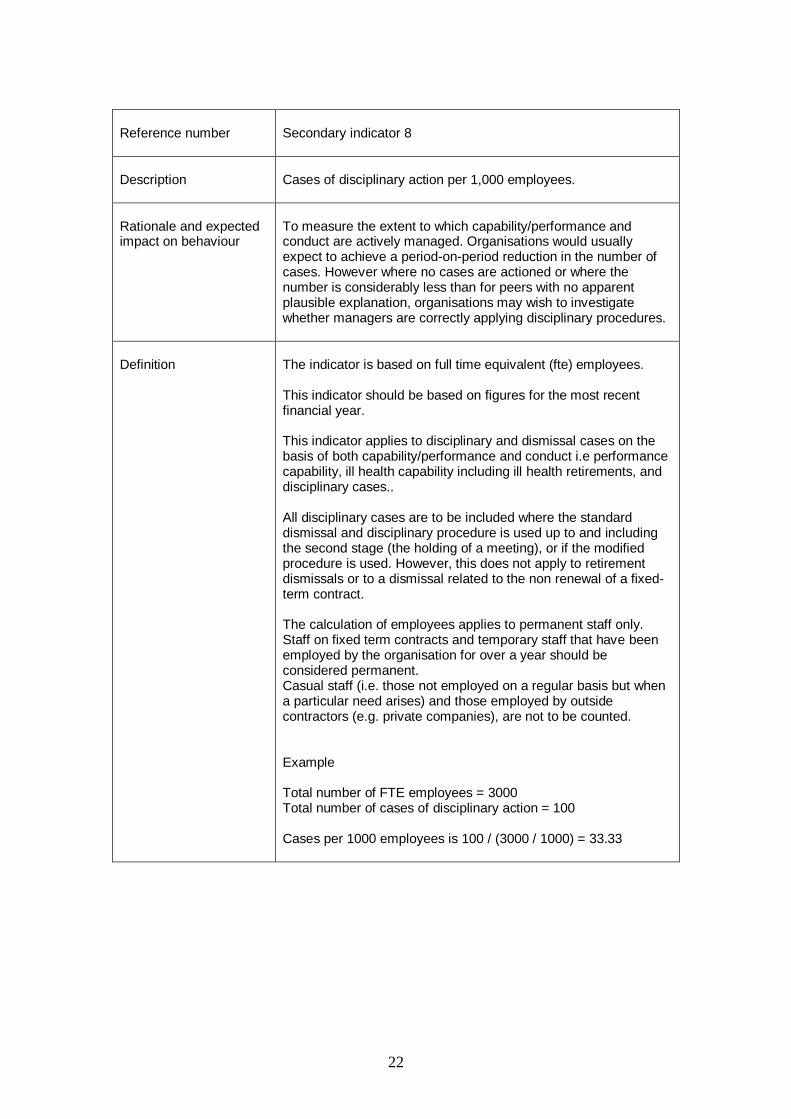
Secondary indicator 8
Description
Cases of disciplinary action per 1,000 employees.
Rationale and expected impact on behaviour
To measure the extent to which capability/performance and conduct are actively managed. Organisations would usually expect to achieve a period-on-period reduction in the number of cases. However where no cases are actioned or where the number is considerably less than for peers with no apparent plausible explanation, organisations may wish to investigate whether managers are correctly applying disciplinary procedures.
Definition
The indicator is based on full time equivalent (fte) employees. This indicator should be based on figures for the most recent financial year. This indicator applies to disciplinary and dismissal cases on the basis of both capability/performance and conduct i.e performance capability, ill health capability including ill health retirements, and disciplinary cases.. All disciplinary cases are to be included where the standard dismissal and disciplinary procedure is used up to and including the second stage (the holding of a meeting), or if the modified procedure is used. However, this does not apply to retirement dismissals or to a dismissal related to the non renewal of a fixed-term contract. The calculation of employees applies to permanent staff only. Staff on fixed term contracts and temporary staff that have been employed by the organisation for over a year should be considered permanent. Casual staff (i.e. those not employed on a regular basis but when a particular need arises) and those employed by outside contractors (e.g. private companies), are not to be counted. Example Total number of FTE employees = 3000 Total number of cases of disciplinary action = 100 Cases per 1000 employees is 100 / (3000 / 1000) = 33.33

23
Reference number
Secondary indicator 9
Description
Percentage of staff who receive (at least) an annual face to face performance appraisal.
Rationale and expected impact on behaviour
To measure the coverage of individual performance management processes across the organisation. Organisations should aim to move towards achieving 100 per cent for this indicator (particularly in respect of their permanent staff).
Definition
This indicator should be based on figures for the latest financial year (i.e. at least one face-to-face appraisal must have taken place in that 12 month period), and calculated using staff full-time equivalents (FTE) A team appraisal would count for these purposes, provided it was face to face. Apply to permanent staff only. Staff on fixed term contracts and temporary staff that have been employed by the authority for over a year should be considered permanent. Casual staff (i.e. those not employed on a regular basis but when a particular need arises) and those employed by outside contractors (e.g. private companies), are not to be counted. Example Number of staff FTEs who receive (at least) an annual face to face performance appraisal = 2950 Total number of staff FTEs = 3020
Percentage of staff receiving an annual appraisal = 2950 / 3020 x 100 per cent = 98 per cent

24
Reference number
Secondary indicator 10
Description
Percentage of leadership posts occupied by women.
Rationale and expected impact on behaviour
To monitor progress in the achievement of equality of opportunity in employment for leadership posts. Organisations should compare their achievement against this indicator with their peers and, in most cases, should seek to secure a period-on-period increase in respect of this indicator.
Definition
This indicator should be based on figures for the most recent financial year. Normally, the leadership of an organisation would be defined as the top five per cent of earners, although this will vary according to the size of the organisation. In smaller organisations, the leadership team should be self-defined but as a minimum the should include the second tier or Assistant Director level depending upon which is lower, and should include as a minimum all posts which are in the top five per cent of earners. To calculate the top five per cent of earners rank all staff by gross pay including part-timers as the appropriate fraction of an FTE. Draw a line where you reach five per cent of the FTEs counting down from the top (but if some people just below this point are on an identical salary to those just above it, include all people on that salary). The appointment of casual staff (i.e. those not employed on a regular basis but when a particular need arises) and those employed by outside contractors (e.g. private companies), are not to be counted. Example Number of leadership posts occupied by women = 10 Total number of leadership posts = 18
Percentage of leadership posts occupied by women is 10 / 18 x 100 per cent = 55.55 per cent

25
Reference number
Secondary indicator 11
Description
Percentage of employees who have reported that they have a Disability
Rationale and expected impact on behaviour
To monitor progress in the achievement of equality of opportunity in employment. Organisations should compare their achievement against this indicator with that of their peers and consider how the composition of their workforce might move towards a position that, for example, is more representative of the community they serve.
Definition
The indicator is based on head count for both the numerator and denominator. This indicator should be based on figures for the latest financial year. ‘Disabled staff’ are those that reported themselves as such against the definition provided in the Disability Discrimination Act 1995 (DDA). The DDA states that a person has a disability for the purposes of this Act if she or he has a physical or mental impairment which has a substantial and long-term adverse effect on his or her ability to carry out normal day-to-day activities. For the following reasons, a staff survey must be conducted at least every two years:
• Unlike other equality indicators, such as race, an
employee’s position in relation to disability may change whilst they are in an organisation’s employment;
• Because of the small numbers involved, a change involving one
or two people can make a significant percentage difference. This baseline data should also be regularly supplemented by monitoring information related to joiners and leavers. Whilst every encouragement should be given to employees to take part in surveys, participation must remain voluntary, with employees classifying themselves. However where a small percentage only of the workforce responds the overall percentage may be skewed and organisations should be aware of this. Employees’ should include permanent staff only. Staff on fixed term contracts or temporary staff that have been employed for over a year should be considered permanent. Casual staff (i.e. those not employed on a regular basis but when a particular need arises) and those employed by outside contractors (e.g. private companies), should not be counted. The number of employees should be the number for whom information on disability is known – i.e. exclude staff who have not declared whether or not they have a disability from both the numerator and the denominator (a part-time employee counts the
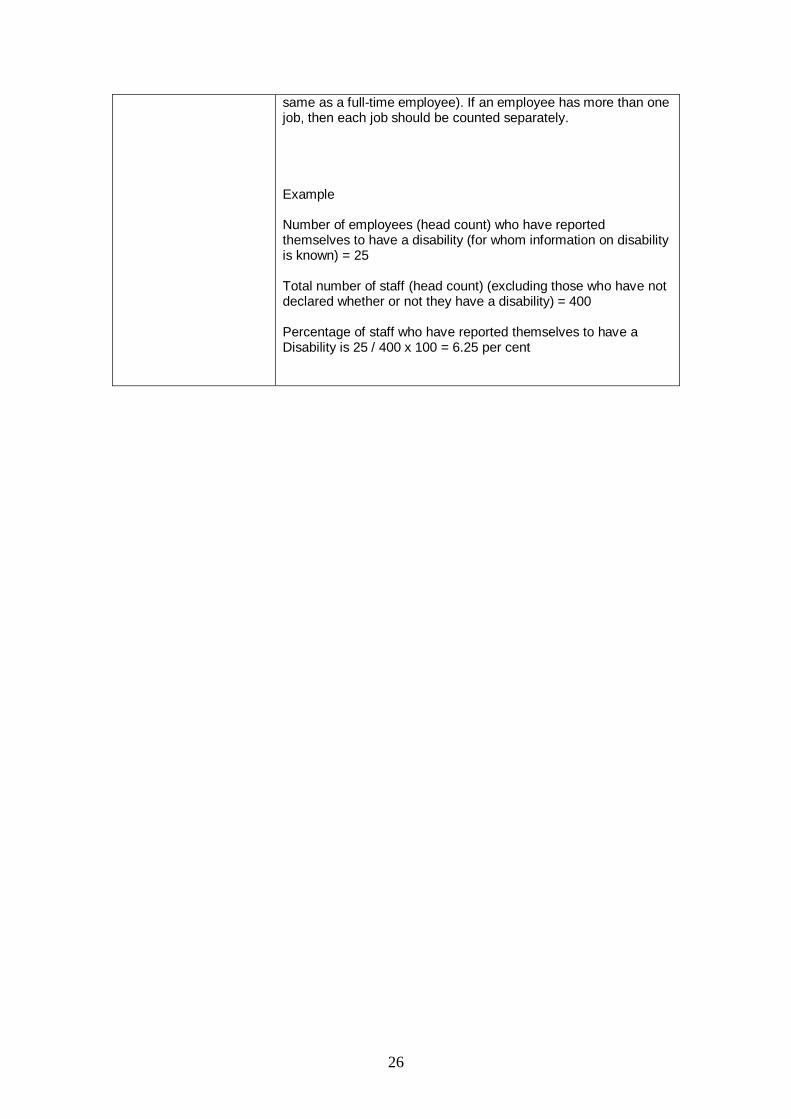
26
same as a full-time employee). If an employee has more than one job, then each job should be counted separately. Example Number of employees (head count) who have reported themselves to have a disability (for whom information on disability is known) = 25 Total number of staff (head count) (excluding those who have not declared whether or not they have a disability) = 400
Percentage of staff who have reported themselves to have a Disability is 25 / 400 x 100 = 6.25 per cent
27
Reference number
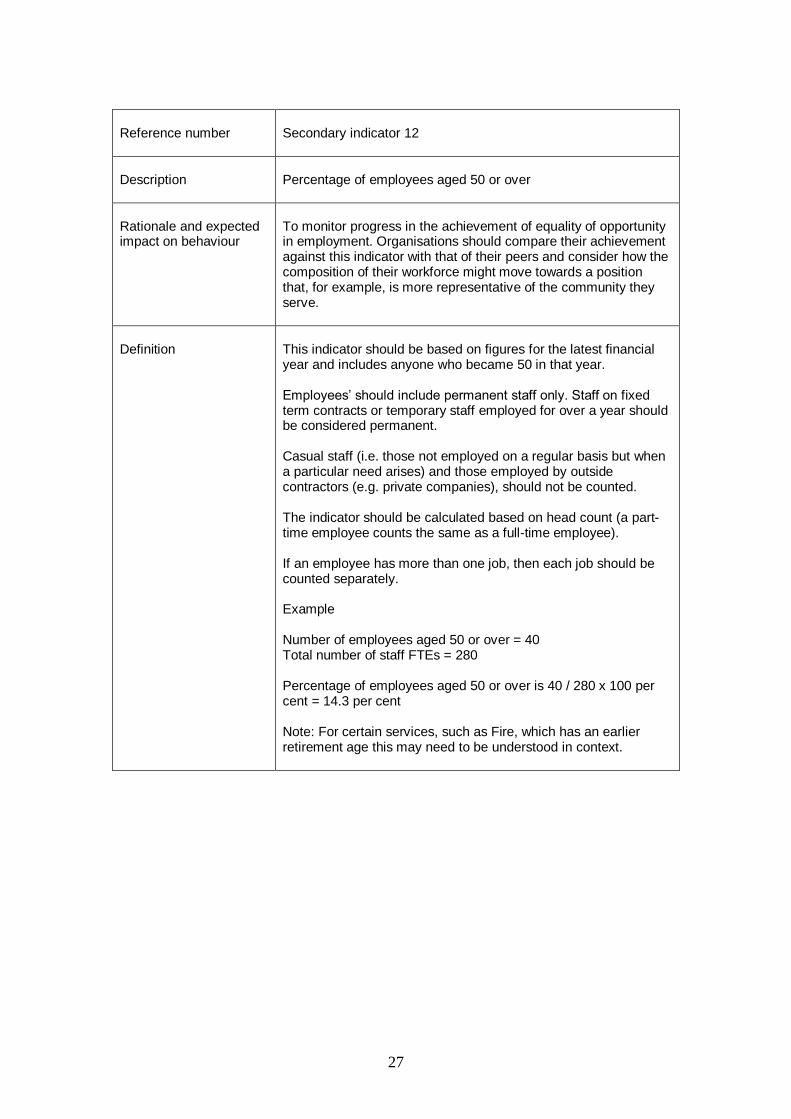
Secondary indicator 12
Description
Percentage of employees aged 50 or over
Rationale and expected impact on behaviour
To monitor progress in the achievement of equality of opportunity in employment. Organisations should compare their achievement against this indicator with that of their peers and consider how the composition of their workforce might move towards a position that, for example, is more representative of the community they serve.
Definition
This indicator should be based on figures for the latest financial year and includes anyone who became 50 in that year. Employees’ should include permanent staff only. Staff on fixed term contracts or temporary staff employed for over a year should be considered permanent. Casual staff (i.e. those not employed on a regular basis but when a particular need arises) and those employed by outside contractors (e.g. private companies), should not be counted. The indicator should be calculated based on head count (a part-time employee counts the same as a full-time employee). If an employee has more than one job, then each job should be counted separately. Example Number of employees aged 50 or over = 40 Total number of staff FTEs = 280 Percentage of employees aged 50 or over is 40 / 280 x 100 per cent = 14.3 per cent Note: For certain services, such as Fire, which has an earlier retirement age this may need to be understood in context.
28
Reference number
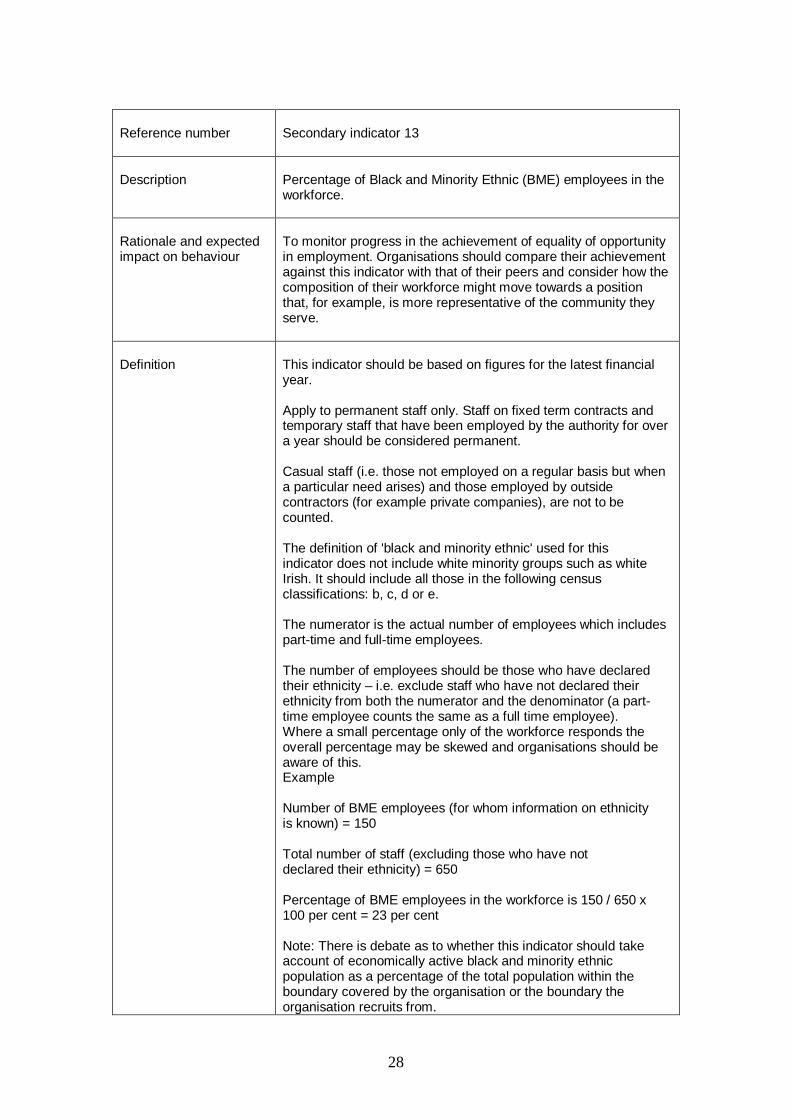
Secondary indicator 13
Description
Percentage of Black and Minority Ethnic (BME) employees in the workforce.
Rationale and expected impact on behaviour
To monitor progress in the achievement of equality of opportunity in employment. Organisations should compare their achievement against this indicator with that of their peers and consider how the composition of their workforce might move towards a position that, for example, is more representative of the community they serve.
Definition
This indicator should be based on figures for the latest financial year. Apply to permanent staff only. Staff on fixed term contracts and temporary staff that have been employed by the authority for over a year should be considered permanent. Casual staff (i.e. those not employed on a regular basis but when a particular need arises) and those employed by outside contractors (for example private companies), are not to be counted. The definition of 'black and minority ethnic' used for this indicator does not include white minority groups such as white Irish. It should include all those in the following census classifications: b, c, d or e. The numerator is the actual number of employees which includes part-time and full-time employees. The number of employees should be those who have declared their ethnicity – i.e. exclude staff who have not declared their ethnicity from both the numerator and the denominator (a part-time employee counts the same as a full time employee). Where a small percentage only of the workforce responds the overall percentage may be skewed and organisations should be aware of this. Example Number of BME employees (for whom information on ethnicity is known) = 150 Total number of staff (excluding those who have not declared their ethnicity) = 650 Percentage of BME employees in the workforce is 150 / 650 x 100 per cent = 23 per cent Note: There is debate as to whether this indicator should take account of economically active black and minority ethnic population as a percentage of the total population within the boundary covered by the organisation or the boundary the organisation recruits from.

29
It has been left solely as the numerator on the premise that organisations should be diverse per se. However this is not to say further analysis should not be carried out to place this figure in contextual reference as regards ethnic make up of the local population served by the organisation.