Human Remains from Zhirendong, South China, and Modern Human
17
Human Remains from Zhirendong, South China, and Modern Human Emergence in Eastern Asia Supporting Information Wu Liu, Chang-Zhu Jin, Ying-Qi Zhang, Yan-Jun Cai, Song Xing, Xiu-Jie Wu, Hai Cheng, R. Lawrence Edwards, Wen-Shi Pan, Da-Gong Qin, Zhi-Sheng An, Erik Trinkaus and Xin-Zhi Wu I. Zhirendong (Zhiren Cave) Figure S1. Map of eastern Asia with the locations of Zhirendong and other sites which have yielded late archaic or early modern human remains, in China unless otherwise specified. A: late archaic; M: early modern. Star: Zhirendong (Zhiren Cave); 1: Zhoukoudian-Upper Cave (M); 2: Xujiayao (M); 3: Salawusu (M); 4: Huanglong (M); 5: Ziyang (M); 6: Lijiang (M); 7: Liujiang (M); 8: Maba (A); 9: Okinawan sites of Yamashita-cho, Pinza-Abu and Minatogawa (M); 10: Salkhit, Mongolia (A); 11: Malta, Siberia (M); 12: Altai sites of Denisova and Okladnikov Caves (A); 13: Niah Cave, Sarawak (M); 14: Moh Khiew, Thailand (M); 15: Fa Hien and Batadomba lena, Sri Lanka (M)
Transcript of Human Remains from Zhirendong, South China, and Modern Human

Human Remains from Zhirendong, South China, and Modern Human Emergence in Eastern Asia
Supporting Information Wu Liu, Chang-Zhu Jin, Ying-Qi Zhang, Yan-Jun Cai, Song Xing, Xiu-Jie Wu,
Hai Cheng, R. Lawrence Edwards, Wen-Shi Pan, Da-Gong Qin, Zhi-Sheng An,
Erik Trinkaus and Xin-Zhi Wu
I. Zhirendong (Zhiren Cave)
Figure S1. Map of eastern Asia with the locations of Zhirendong and other sites which have yielded late archaic or early modern human remains, in China unless otherwise specified. A: late archaic; M: early modern. Star: Zhirendong (Zhiren Cave); 1: Zhoukoudian-Upper Cave (M); 2: Xujiayao (M); 3: Salawusu (M); 4: Huanglong (M); 5: Ziyang (M); 6: Lijiang (M); 7: Liujiang (M); 8: Maba (A); 9: Okinawan sites of Yamashita-cho, Pinza-Abu and Minatogawa (M); 10: Salkhit, Mongolia (A); 11: Malta, Siberia (M); 12: Altai sites of Denisova and Okladnikov Caves (A); 13: Niah Cave, Sarawak (M); 14: Moh Khiew, Thailand (M); 15: Fa Hien and Batadomba lena, Sri Lanka (M)

Figure S2. View of the Mulanshan (Mulan Mountain) across the modern land surface, with the location of Zhirendong (Zhiren Cave; ZRD). The Hejiang River curves around the base of the mountain below the cave.
Figure S3. Plan of Zhirendong (Zhiren Cave). The gray area indicates the excavated area. Modified from Jin et al. (1).
2

Figure S4. Post-excavation views of Zhirendong (Zhiren Cave). Left: the main entrance area to the cave; the excavated area is to the left beyond the individuals standing within the cave. Right: the main excavation trench in the lower portion of Section B of the stratigraphy, with the exploratory well evident within the trench. The stratigraphic profile (Fig. S5) is along the right side of the remaining trench (see arrow in Fig. S3).
Figure S5. Northwest-to-southeast stratigraphic profile through the excavated area of Zhirendong. The gray area (Section A) is the older hanging remnant of earlier Pleistocene deposits. Section B consists of the early Late Pleistocene fossiliferous infilling of the chamber, which yielded the human remains in the upper portion of Layer 2. Modified from Jin et al. (1).
3

II. U-Series Dating Table S1. 230Th dating results of flowstones from Section B, Layer 1 of Zhiren Cave.1 Sample
No. Field label
238U 232Th δ234U 2 δ234UInitial 3 230Th / 238U 4 230Th / 232Th 5 230Th age (yr) 230Th age (kya) 6
(ppb) (ppt) (measured) (corrected) (activity) (atomic x 10-6) (uncorrected) (corrected) S1 ML-1A 248.0 ± 3.6 85106 ± 1107 46.9 ± 5.4 50.8 ± 6.0 0.3231 ± 0.0171 15.6 ± 0.8 40177 ± 2574 28.4 ± 6.6 S2 ML-1B 133.1 ± 0.3 130130 ± 1712 71.9 ± 4.6 83.3 ± 7.3 0.5985 ± 0.0344 10.1 ± 0.6 88163 ± 7760 51.8 ± 22.7 S3 ML-1C 143.2 ± 0.3 89665 ± 1014 93.9 ± 4.2 119.4 ± 6.8 0.6875 ± 0.0249 18.1 ± 0.7 105982 ± 6426 84.9 ± 12.9
S37 ML-1C 142.9 ± 0.1 82783 ± 1657 97.0 ± 1.5 121.3 ± 5.1 0.6607 ± 0.0012 18.8 ± 0.4 98687 ± 381 79.4 ± 13.9 Sa ML-6A 223.3 ± 0.8 230091 ± 5156 52.7 ± 4.3 65.0 ± 6.6 0.6611 ± 0.0481 10.7 ± 0.9 106558 ± 13091 74.1 ± 21.6
S47 ML-6C 211.7 ± 0.2 260417 ± 5216 70.4 ± 1.5 89.4 ± 9.5 0.7608 ± 0.0019 10.2 ± 0.2 132379 ± 750 84.7 ± 36.9 S57 ML-6D 118.8 ± 0.1 17005 ± 340 78.1 ± 1.5 99.7 ± 2.1 0.6160 ± 0.0012 71.0 ± 1.4 91132 ± 357 86.6 ± 3.3 Sb ML-6B 121.6 ± 0.2 24872 ± 426 66.9 ± 2.6 89.3 ± 3.8 0.6904 ± 0.0228 55.9 ± 2.0 111791 ± 6369 106.2 ± 6.7
1 The chemical processing procedures were similar to those described in Edwards et al. (2) and accomplished in the clean lab of Minnesota Isotope
Laboratory. The measurements were run on inductively coupled plasma mass spectrometers (Thermo-Finnigan ELEMENT) using procedures described in Cheng et al. (3) and Shen et al. (4). Analytical errors are given as 2σ.
2 δ234U = ([234U/238U]activity-1)×1000. 3 δ234Uinitial corrected was calculated based on 230Th age (T), i.e., δ 234Uinitial =δ
234Umeasured × eλ234 ×T , and T is corrected age. 4 230Th/238U[ ]activity
=1− e−λ230 ×T + (δ 234Umeasured /1000) × λ230 /(λ230 − λ234 )[ ]× (1− e−(λ230 −λ234 )×T ), where T is the age (5). Decay constants are 9.1577×10⁻⁶ yr-1 for 230Th,
2.8263×10⁻⁶ yr-1 for 234U (Cheng et al., 2000), and 1.55125×10⁻¹⁰ yr-1 for 238U (6). 5 The degree of detrital 230Th contamination is indicated by the [230Th/232Th] atomic ratio instead of the activity ratio. 6 Age corrections were calculated using an average crustal 230Th/232Th atomic ratio of 4.4×10⁻⁶ ± 2.2×10⁻⁶. Those are the values for a material at secular
equilibrium, with the crustal 232Th/238U value of 3.8. The errors are arbitrarily assumed to be 50%. 7 Samples measured on a multi-collector inductively coupled plasma mass spectrometer (Thermo-Finnigan Neptune) using procedures described in Cheng et
al. (7).
4
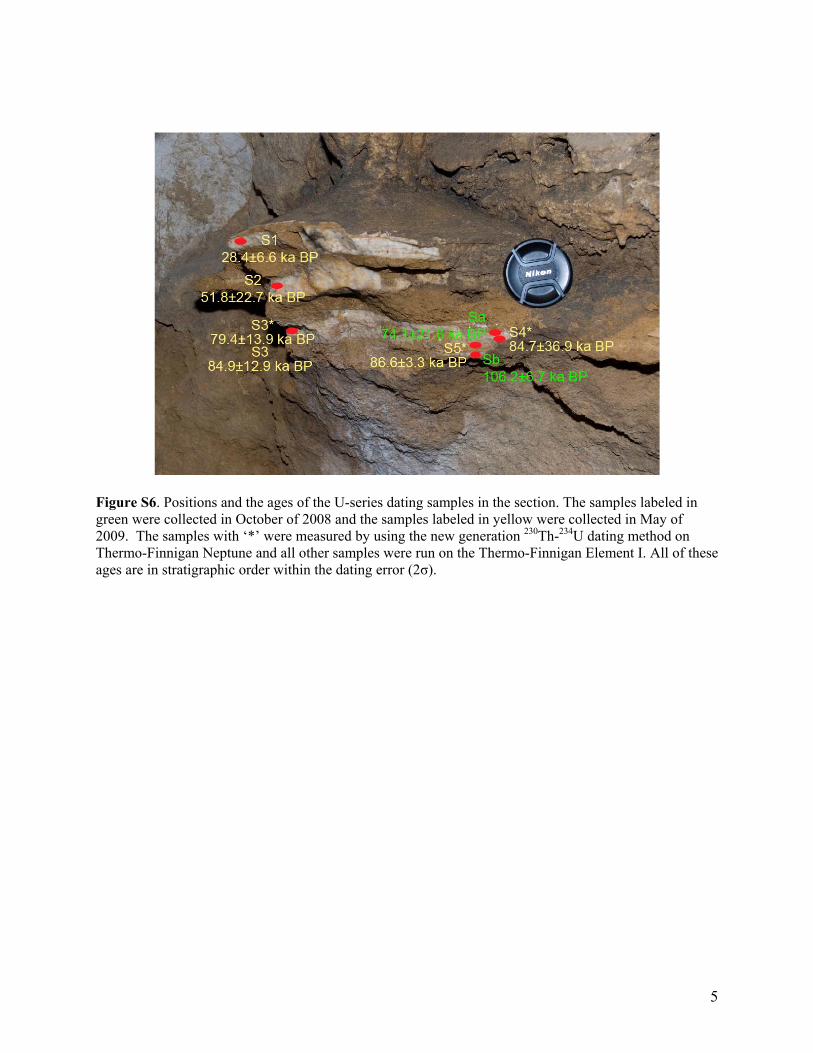
Figure S6. Positions and the ages of the U-series dating samples in the section. The samples labeled in green were collected in October of 2008 and the samples labeled in yellow were collected in May of 2009. The samples with ‘*’ were measured by using the new generation 230Th-234U dating method on Thermo-Finnigan Neptune and all other samples were run on the Thermo-Finnigan Element I. All of these ages are in stratigraphic order within the dating error (2σ).
5

III. Faunal Remains from Section B of Zhiren Cave Table S2. Identified mammals from Section B of Zhiren Cave (Zhirendong). * indicates an extinct species.
Macromammals Micromammals Homo sapiens Pongo pygmaeus Hylobates sp. Macaca sp. Trachypithecus sp. Ursus thibetanus Arctonyx collris Panthera pardus Felis sp. Paguma sp. Viverra sp. Elephas kiangnanensis* Elephas maximus Megatapirus augustus* Rhinoceros sinensis* Sus scrofa Sus cf. S. xiaozhu* Muntiacus sp. Cervus unicolor Buballus bubalus Megalovis guangxiensis*
Neotetracus sinensis Blarinella sp. Soriculus sp. Crocidura hosfildi Crocidura sp. Chimarrogale sp. Mogera insularis Rhinolophus paneni* Rhinolophus pearsoni Rhinolophus sp. Hipposideros pratti Pipistrellus sp. Sciurotamias sp. Dremomys sp. Belomys sp. Petaurista alborufus Petaurista elegans Petaurista sp. Typhlomys cinereus Atherurus sp. Hystrix subcristata Hystrix magna* Eothenomys sp. Mus pahari Apodemus cf. A. draco Apodemus cf. A. peninsulae Hapalomys delacouri Chiropodomys cf. C. gliroides Niviventer confucianus Niviventer fulvescens Leopoldamys edwardsi Bandicota cf. B. indica Rattus norvegicus Rattus rattus
6

IV. Preservation and Morphometrics of the Zhiren 1 and 2 Human Molars Zhiren 1 Mandibular Molar The specimen consists of a complete right mandibular third molar (M3) with a fragmentary, pathologically resorbed and eroded piece of M2 and M3 alveolar bone attached to the root apices. The alveolar fragment measures 27.6 mm in length and 12.3 mm maximum breadth, and it was reduced to the root apices through resorption and/or supereruption. The maximum tooth height is estimated (given the apices in the alveolar bone) at 17.2 mm at the mesiobuccal corner (root length ~12.8 mm plus 4.4 mm crown height). The specimen is inferred to be an M3 given a mesial interproximal wear facet 4.8 mm buccolingual, the absence of a facet distally, and the absence of root sockets or a developmental crypt distally. The mesial root sockets are therefore for the M2. It is unlikely to derive from Zhiren 3 given the marked alveolar resorption of the Zhiren 1 M2 and M3 alveoli and the absence of such resorption at least as far distally as the P4 on Zhiren 3. Zhiren 2 Mandibular Molar The isolated tooth is a completely preserved specimen with cracks along the buccal cervix and between the mesial and distal roots. Maximum height is 19.2 mm. However, the distal half of the buccal crown, the distal third of the lingual crown, and the entire distal crown and cervical region is absent as a result of a massive antemortem carious lesion. There is also extensive hypercementosis on the roots. The crown and roots indicate that the tooth is a mandibular right molar. There is a mesial interproximal facet, 5.5 mm buccolingual. There is no evidence of whether a distal interproximal facet was present prior to the caries; the caries would have removed a facet if it was originally present. The tooth is inferred to be an M3, since the mesial and distal roots are separate but compressed together, 2.8 mm apart at their tips and largely in contact along most of their lengths, especially buccally.
The tooth cannot be an M2 from the same mandible as Zhiren 1, since the M2 apical socket on Zhiren 1 has its tips 3.6 mm apart and a septum between the two sockets minimally 2.1 mm wide. It could nonetheless be an M2 from a different individual, possibly from Zhiren 3 given the pathological alterations of that mandible’s premolar alveoli. The tooth is retained as a separate individual, and considered most likely to be an M3. Table S3. Measurements of the Zhiren 1 and 2 mandibular molars, in millimeters. Estimated values are in parentheses.
Zhiren 1 M3 right Zhiren 2 M2-3 right Crown mesiodistal diameter (10.9) -- Crown buccolingual diameter 10.1 10.3 Cervix mesiodistal diameter 9.2 -- Cervix buccolingual diameter 8.6 8.8 Root length mesiobuccal (12.8) 14.0 Root length distobuccal 10.5 (13.3) Cervix to root bifurcation: buccal 2.6 1.8 Cervix to root bifurcation: lingual 3.9 -- Occlusal wear (following ref 8) 5a 4b
7

Figure S7. Distributions of mandibular M3 crown diameters for Zhiren 1 and 2 (ZR1 and ZR2), plus crown “areas” (length x breadth) for Zhiren 1. Comparisons of the Zhiren 2 crown breadth to those of M2s are included, given that it may represent an M2. The Upper Paleolithic modern human sample is divided into western (WUP) and eastern (EAUP) samples, given the modestly smaller M3s of the eastern sample. The summary data and samples sizes are in Table 2.
The Zhiren 1 and 2 molar crown dimensions are within the ranges of variation of all but the small eastern Asian Upper Paleolithic M2 sample. None of the comparisons provides significant differences across the comparative samples if the EUP sample is divided; Kruskal-Wallis P-values: M3 BL: 0.158; M3 “area”: 0.139; M2 BL 0.091.
8

V. Preservation and Morphometrics of the Zhiren 3 Human Mandible Zhiren 3 Anterior Mandibular Corpus The Zhiren 3 mandible retains the corpus from the middle of the right P4 alveolus to the distal portion of the left P4 alveolus. None of the teeth is retained in mandible. There is minor bone loss to the paper-thin labial alveolar margins of the anterior tooth sockets, but the interdental septa and the lingual alveolar margins are intact. In addition, both P3 sockets have become pathologically enlarged apically on their buccal sides, and there is thickening of the P3/P4 interdental septa. The anterior and posterior faces of the bone are well preserved, but there has been minor abrasion to the anteroinferior edge near the symphysis and a crack with minor surface bone loss on the right posteroinferior margin. Neither one affects morphological observations. As noted above, it is a dfferent individual from Zhiren 1, but it could derive from the same individual as Zhiren 2. Table S4. Mandibular corpus morphometrics and discrete traits, in millimeters unless otherwise indicated. Estimated values are in parentheses.
Right Left Symphyseal height (M-69) 1 29.5 Symphyseal thickness 14.5 Anterior symphyseal angle (id-pg) (M-79(1b)) 2 91° Mentum osseum rank 3 4 Mental foramen position P4 P4 Corpus heights at:
C1 26.8 27.8 C1/P3 27.2 28.0 P3/P4 (26.8) 28.8 Mental foramen (M-69(1)) (26.5) 28.2
Corpus breadths at: C1 14.8 13.6 C1/P3 14.8 14.4 P3/P4 15.2 16.0 Mental foramen (M-69(3)) 15.5 16.5
Mental foramen to alveolar border 13.5 13.2 Symphyseal cross-sectional geometry 4
Total area (mm2) 273.8 Anteroposterior 2nd moment of area (mm4) 2 3,472 Superoinferior 2nd moment of area (mm4) 2 12,366 Maximum 2nd moment of area (mm4) 12,751 Minimum 2nd moment of area (mm4) 3,087 Angle of the major axis 2 78.5°
1 M-#: measurement definition in Bräuer (9). 2 Symphyseal angles and oriented second moments of area are relative to the alveolar plane. 3 Following Dobson and Trinkaus (10). 4 Modeling the symphyseal cross-section as a solid beam, following Dobson and Trinkaus (10).
9

Table S5. Discrete observations of the Zhiren 3 mandibular corpus. Symphyseal profile in norma lateralis Nearly vertical with modest superior concavity and inferior
convexity Incurvatio mandibulae Weakly developed Tuber symphyseos Moderately projecting Central keel Swelling on the anterior symphysis Mental fossae Shallow Lateral tubercles Observable but modest. Merge with the tuber symphyseos Shelf-like anteroinferior symphysis Absent Anterior marginal tubercle Absent Superior lateral tubercle Weakly developed Incisura submentalis Absent Digastric fossae Weak Digastric fossae medial crest and spine Absent Alveolar planum Absent Genioglossal fossae Weak Superior transverse torus Absent Inferior transverse torus Moderately developed Table S6. Mentum osseum rank (MOR)1 distributions for comparative Middle and Late Pleistocene samples. Samples2 1 2 3 4 5 N % >3 % >2
Zhiren 3 X
EUP 0 0 1 33.5 13.5 48 97.9% 100%
MPMH 0 1 0 6 0 7 85.7% 85.7%
SAfrica 0 0 3 3 0 6 50.0% 100%
Late Pleist 8 21 10 0 0 39 0.0% 25.6%
Mid Pleist 7 9 1 0 0 17 0.0% 5.9%
1 Mentum osseum ranks, following Dobson and Trinkaus (10), are: 1: retreating symphysis with no evidence of the tuber symphyseos; 2: retreating symphysis with present but non-projecting tuber symphyseos; 3: vertical symphysis with present but non-projecting tuber symphyseos; 4: vertical symphysis with projecting tuber symphyseos but little or no evidence of the lateral tubercles; 5: projecting tuber symphyseos and prominent lateral tubercles. Scores of one-half are from intermediate 4/5 configurations for Zhoukoudian-Upper Cave 101, 103 and 104.
2 EUP: Earlier Upper Paleolithic modern humans; MPMH: Middle Paleolithic modern humans; SAfrica: later Pleistocene sub-Saharan African sample; Late Pleist: Late Pleistocene (mostly Neandertal) archaic humans; Mid Pleist: Middle Pleistocene archaic humans.
10

Figure S8. The distribution of relative warp (RW) scores for the first two warps for the anterior profile of Zhiren 3 (ZR3) and the comparative samples. The thin plate splines (TPS) for each direction are provided adjacent to the plot.
Sample abbreviations: MPl: Middle Pleistocene archaic humans; LPl: Late Pleistocene archaic humans; SAfr: later Pleistocene sub-Saharan Africans; MPMH: Middle Paleolithic modern humans; WUP: western Eurasian Upper Paleolithic modern humans; EAUP: east Asian Upper Paleolithic modern humans. A sample of predominantly east Asian recent humans is added to the Pleistocene sample distributions.
11

Table S7. Distributions of the mental foramen position relative to the mandibular dentition. Scores of one-half are due to asymmetry (8.6% of the pooled sample; N = 128), in all cases between adjacent locations. Samples as in Table S6. mesial ------------------------------------------- distal % mesial of
P4/M1 % mesial
of M1 P3, P3/P4 P4 P4/M1 M1 N Zhiren 3 X EUP 5 25.5 10.5 3 44 69.3% 93.2% MPMH 0 4 2 1 7 57.1% 85.7% SAfrica 0 2 1.5 0.5 4 50.0% 87.5% Late Pleist 0 4.5 15 19.5 39 11.5% 50.0% Mid Pleist 4 5 12 13 34 26.4% 61.8% Figure S9. The distribution of relative warp (RW) scores for the first two warps for the full symphyseal contour of Zhiren 3 (ZR3) and the comparative samples. The thin plate spline (TPS) for each direction is provided adjacent to the plot. Samples as in Figure S8.
12

Figure S10. Ln anteroposterior symphyseal second moment of area (Iy) versus ln superoinferior symphyseal second moment of area (Ix), modeling the symphysis as a solid beam and oriented relative to the alveolar plane. Second moments of area computed using SLICE/SLCOMM (11,12). The reduced major axis regression from which the residuals in Figure 5 are derived is: Ln-Iy = 1.304 x Ln-Ix – 4.40; N = 66; r = 0.665. Sample abbreviations as in Figure S8.
Figure S11. Lateral corpus breadth versus corpus height at the mental foramen for Zhiren 3 (ZR3) and Middle and Late Pleistocene comparative samples. The reduced major axis regression from which the residuals in Figure 5 are derived is: Breadth = 0.134 x Height + 10.9; N = 88; r = 0.222. Sample abbreviations as in Figure S8.
13

VI. Methods: Geometric Morphometric Analysis Generalized Procrustes Analysis (GPA), as one method of Superimposition, is designed to
eliminate all information unrelated to shape, such as location, orientation, size of the individual specimen through translation, scaling and rotation (12,13), GPA is therefore a tool from which to obtain raw data for the subsequent analysis of shape differences (15).
Thin Plate Spline (TPS) can be used to visualize the detailed process of how certain landmark configurations are deformed into another one through disproportional transformation of the grids (14), which requires energy and generates partial warps scores (16-18). The principal component analysis of the partial warp scores, which are also called relative warp scores, can be carried out to present the major patterns of morphological variation of sample (16-18).
Landmarks are points of biological and geometric correspondence among specimens (14). To further characterize shape, semilandmarks were proposed by Bookstein to study those shapes with there is a lack of real landmarks, such as a curvature or the outline of a structure (15,19,20). Generally, semilandmarks are accompanied by sliding techniques to minimize the effects generated by their arbitrary locations (15,20,22). The anterior (infradentale to gnathion) and full (infradentale around gnathion to linguale) contours were obtained from scaled and oriented cross-sections, from published description, polysiloxane putty molds of original fossils and casts, and laser scans of originals and casts. The last were obtained using a NextEngine Model 2020i Desktop 3D Scanner (NextEngine.com) and Rapidworks™ software. The accuracy of the data is between 0.1 and 0.4 mm.
During the shape analysis of the cross-sections of mandibular symphysis, it was necessary to maintain the anatomical orientation of the outline, since a substantial portion of the change in symphyseal morphology through Pleistocene Homo involves changes in symphyseal orientation, however measured. However, Procrustes rotation in the context of geometric morphometrics analysis was designed to eliminate the effects of orientation on shape, and sometimes unfortunately this removes information of direct relevance to the analysis. To avoid this, the individual sets of semilandmarks for the mandibular cross-sections were slightly modified..
Specifically, an isosceles triangle of 45° was added to each anterior profile of mandibular symphysis cross-section (Fig. S12), with its right angle corner coinciding with the infradentale, the height same as that of corresponding mandibular symphysis cross-section perpendicular to the alveolar plane, and the cross-section oriented relative to the alveolar plane. Then, each side of the triangle except the hemline and the anterior profile of symphysis cross-section were divided into 14 equal parts through 13 semilandmarks, the end points of triangle side and anterior curvature of symphysis cross-section being treated as landmarks.
Figure S12. Modification on the anterior profile of mandibular symphysis cross-section (red points: landmarks; blue points: semilandmarks).
14

In the shape analysis of the full symphyseal cross-section profiles of the mandibular symphysis, to avoid the intersection with the cross-section profile, the triangle of the same height as each corresponding specimen was drawn on its left (anterior) side (Fig. S13), with the degrees of three angles being 20°, 25°, and 135° respectively and its vertex at infradentale. After that, those three sides of the triangles were divided equally into 25, 17 and 13 parts respectively, according to their lengths, and the cross-section profile of the mandibular symphysis was divided into 29 equal parts. While the end points of each side of triangle and cross-section curvature were regarded as landmarks, the rest of the points were assigned to be semilandmarks.
Figure S13. Modification on the whole profile of mandibular symphysis cross-section (red points: landmarks; blue points: semilandmarks)
Theoretically, each cross-section profile of mandibular symphysis was accompanied by a triangle of the same shape and corresponding size, which was then moved and scaled with the cross-section during Generalized Procrustes analysis. In the analysis, therefore, the differences among the specimens will come from the shape variance of the cross-section profile, not the designed triangle, and at the same time rotation of the shape is eliminated.
TpsDig2 (23) was employed to collect the coordinate data of the landmarks and semilandmarks, and TpsRelw (24) was used to carry out the relative warps analysis. The relative distributions of the first to relative warp scores for each analysis are in Figures S8 and S9, accompanied by the warps of the symphyseal shape in each direction.
After the Generalized Procrustes superimposition (GPA), the mean (consensus) shape of each sample and the distribution of individual landmarks/semilandmarks around its corresponding mean point can be presented by the points and line configuration. We extracted the consensus shape and scattered landmarks and semilandmarks of each group, and compared them with the symphyseal contour of Zhiren 3. In each figure (Figs. 2 and 3), infradentale (id) on the symphyseal contour of Zhiren 3 matched that of the consensus shape of each group, and all remained oriented relative to the alveolar plane. VII. Methods: Cross-Sectional Geometry
To assess the cross-sectional geometric properties of the mandibular symphysis, each one was oriented relative to the alveolar plane and modeled as a solid beam. The contours were obtained from published scaled and oriented contours, polysiloxane putty molds of original specimens and casts, and laser scans of fossils and casts (see above). They were projected enlarged ~10x on to a Summagraphics 1812 tablet and digitized three times. The resultant cross-sectional geometric parameters, anteroposterior (Iy), superoinferior (Ix), maximum (Imax) and minimum (Imin) second moments of area, plus the orientation
15

of the major axis, were computed using SLICE/SLCOMM (11,12). The three results were then averaged for each specimen.
VIII. Comparative Materials Sites Yielding Specimens Providing Morphometric and/or Discrete Comparative Data 1. Middle Pleistocene Archaic Humans (MidPl or Mid Pleist)
Arago, Atapuerca-SH, Aubesier, Baringo-Kapthurin, Cave of Hearths, La Chaise, Chenjiawo, Ehringsdorf, Hexian, Mauer, Montmaurin, Olduvai, Pontnewydd, Rabat, Sidi-Abderraman, Tabun C, Thomas, Tighenif, Visogliano, Xichuan, Yiyuan, and Zhoukoudian-Locality I. 2. Late Pleistocene Late Archaic (LatePl or Late Pleist) Amud, Arcy-Hyène, Arcy-Renne, Banyoles, Breuil, Caminero, La Chapelle-aux-Saints, Combe Grenal, Dar-es-Soltane, Devil’s Tower, Fate, Feldhofer, Fenara, La Ferrassie, Fossellone, Gegant, Genay, Guattari, El Harhoura, Hortus, Kebara, Krapina, Lakonis, Maglie, Malarnaud, Marillac, Le Moustier, La Naulette, Palomas, Petit-Puymoyen, Le Placard, La Quina, Regourdou, Rochelot, Saint Brelade, Saint-Césaire, Scladina, Shanidar, El Sidrón, Spy, Subalyuk, Švédův-stůl, Tabun B, Témara, Valdegoba, Vaufrey, Vergisson, Vindija, Zafarraya, and Zaskalnaya. 3. Sub-Saharan Africans (SAfr or SArica) Dire Dawa, Equus, Die Kelders, Klasies River Mouth, Loiyangalani, Mumba, Omo-Kibish. 4. Middle Paleolithic Modern Humans (MPMH) Qafzeh, Skhul. 5. Earlier (pre-Last Glacial Maximum) Upper Paleolithic Modern Humans (EUP, or WUP and EAUP when divided into western Upper Paleolithic and eastern Asian Upper Paleolithic samples). Note that for Europe the sample pools together fossil remains commonly (e.g., ref 25) separated into Early Upper Paleolithic (EUP) and Mid Upper Paleolithic (MUP) samples. Arene Candide, Barma Grande, Batadomba lena, Blanchard, Brno, Castant, Caviglione, Cro-Magnon, La Crouzade, Dolní Věstonice, La Ferrassie, Fish Hoek, Grotte-des-Enfants, Huanglong, Isturitz, Labatut, Kostenki, Lagar Velho, Malta, Minatogawa, Mittlere Klause, Mladeč, Moh Khiew, Muierii, Nazlet Khater, Oase, Ohalo, Paglicci, Pataud, Pavlov, Předmostí, La Quina, Les Roches, La Rochette, Les Rois, Silická Brezová, Sunghir, Tianyuan, Vachons, Willendorf, and Zhoukoudian-Upper Cave. IX. Supporting Information References 1 Jin CZ, et al. (2009) The Homo sapiens Cave hominin site of Mulan Mountain, Jiangzhou District,
Chongzhou, Guanxi with emphasis on its age. Chinese Sci Bull 54:3848-3856. 2 Edwards RL, Chen JH, Wasserburg GJ (1987) U-238, U-234, Th-230, Th-232 systematics and the
precise measurement of time over the past 500,000 years. Earth Planet Sci Lett 81:175-192. 3 Cheng H, et al. (2000) The half-lives of uranium-234 and thorium-230. Chem Geol 169:17-33. 4 Shen CC, et al. (2002) Uranium and thorium isotopic and concentration measurements by magnetic
sector inductively coupled plasma mass spectrometry. Chem Geol 185:165-178. 5 Kaufman A, Broecker WS (1965) Comparison of 230Th and 14C ages for carbonate materials from Lakes
Lahontan and Bonneville. J Geophys Res 70:4039-4054.
16

17
6 Jaffey AHK, Flynn F, Glendenin LE, Bentley WC, Essling AM (1971) Precision measurement of half-lives and specific activities of 235U and 238U. Physics Rev C4:1889-1906.
7 Cheng, H., et al., (2009) Timing and structure of the 8.2 kyr B.P. event inferred from δ18O records of stalagmites from China, Oman, and Brazil: Geology 37:1007-1010.
8 Smith BH (1984) Patterns of molar wear in hunter-gatherers and agriculturalists. Am J Phys Anthropol 63:39-56.
9 Bräuer G (1988) Osteometrie. Anthropologie I , ed Knussman R (Fischer, Stuttgart), pp 160-232. 10 Dobson SD, Trinkaus E (2002) Cross-sectional geometry and morphology of the mandibular
symphysis in Middle and Late Pleistocene Homo. J Hum Evol 43:67-87. 11 Nagurka ML, Hayes WC (1980) An interactive graphics package for calculating cross-sectional
properties of complex shapes. J Biomech 13:59-64. 12 Eschman PN (1992) SLCOMM Version 1.6 (Eschman Archeological Services, Albuquerque). 13 Adams DC, Rohlf FJ, Slice DE (2004) Geometric morphometrics: ten years of progress following the
‘Revolution’. Italian J Zool 71:5-16. 14 Zelditch M L, et al. (2004) Geometric Morphometrics for Biologists: A Primer. (Elsevier Academic
Press, San Diego). 15 Bookstein FL (1996) Applying landmark methods to biological outline data. Image Fusion and Shape
Variability Techniques, ed Mardia KV, Gill CA, Dryden IL (Leeds University Press, Leeds), pp.129-140.
16 Bookstein FL (1991) Morphometric Tools for Landmark Data (Cambridge University Press, Cambridge UK).
17 Bookstein FL (1989) Principal warps: thin-plate splines and the decom- position of deformations. IEEE Trans Pattern Anal Mach Intell 11:567-585.
18 Rohlf FJ (1996) Morphometric spaces, shape components and the effects of linear transformations. Advances in Morphometrics, ed Marcus LF (Plenum Press, New York), pp 117-128.
19 Friess M (2003) An application of the relative warps analysis to problems in human paleontology-with note on raw quality. Image Anal Stereol 22:63-72.
20 Bookstein FL (1997) Landmark methods for forms without landmarks: morphometrics of group differences in outline shape. Med Image Anal 1: 225-243.
21 Bookstein FL, et al. (1999) Comparing frontal cranial profiles in archaic and modern Homo by morphometric analysis. Anat Rec New Anat 257:217-224.
22 Sheets HD, Keonho K, Mitchell CE (2004) A combined landmark and outline based approach to ontogenetic shape change in the Ordovician Trilobite Triarthrus becki. Applications of Morphometrics in Paleontology and Biology, ed Elewa A (Springer, New York), pp. 67-81.
23 Rohlf FJ (1998) TpsDig2. (Ecology and Evolution, SUNY Stony Brook, New York) (http://life.bio.sunysb.edu/morph).
24 Rohlf FJ (1998) TpsRelw. (Ecology and Evolution, SUNY Stony Brook, New York) (http://life.bio.sunysb.edu/morph).
25 Trinkaus E (2007) European early modern humans and the fate of the Neandertals. Proc Natl Acad Sci USA 104:7367-7372.