
Human Populations Ch 9 v =4BbkQiQyaYc v =4BbkQiQyaYc.
27
Human Populations Human Populations Ch 9 Ch 9 https://www.youtube.com/w atch?v=4BbkQiQyaYc
-
Upload
hollie-lee -
Category
Documents
-
view
246 -
download
0
Transcript of Human Populations Ch 9 v =4BbkQiQyaYc v =4BbkQiQyaYc.

Human PopulationsHuman Populations
Ch 9Ch 9
https://www.youtube.com/watch?v=4BbkQiQyaYc


Past 200 years grown exponentiallyPast 200 years grown exponentially– Expand to new areasExpand to new areas– AgricultureAgriculture– Sanitation, antibiotics, vaccines, fossil fuelsSanitation, antibiotics, vaccines, fossil fuels
1.23% growth rate (2.4 people every time your 1.23% growth rate (2.4 people every time your heart beats)heart beats)
Reached 7 billion on October 31, 2011Reached 7 billion on October 31, 2011 http://www.census.gov/main/www/popclock.html 2050 est. reach 7.2 – 10.6 billion2050 est. reach 7.2 – 10.6 billion

Developed countries (MDC)Developed countries (MDC)– Highly industrialHighly industrial– High GDP (gross domestic product) – annual market High GDP (gross domestic product) – annual market
value of all goods/services value of all goods/services – Growth 0.1% per yearGrowth 0.1% per year
Developing countries (LDC)Developing countries (LDC)– Low to mod. IndustrializationLow to mod. Industrialization– Low to mod. GDPLow to mod. GDP– Growth 1.5% per yearGrowth 1.5% per year– Most Africa, Asia, and Latin AmericaMost Africa, Asia, and Latin America

Factors Affecting Population SizeFactors Affecting Population Size
# births (fertility)# births (fertility) # deaths (mortality)# deaths (mortality) MigrationMigration Population change = (b+i) – (d+e)Population change = (b+i) – (d+e) Demographers use:Demographers use:
– Birth rate (crude birth rate) - # live births per Birth rate (crude birth rate) - # live births per 1000 people in a particular area1000 people in a particular area
– Death rate (crude death rate) - # deaths per Death rate (crude death rate) - # deaths per 1000 people in a particular area1000 people in a particular area


China China and India 37%and India 37% US 4.5%US 4.5%
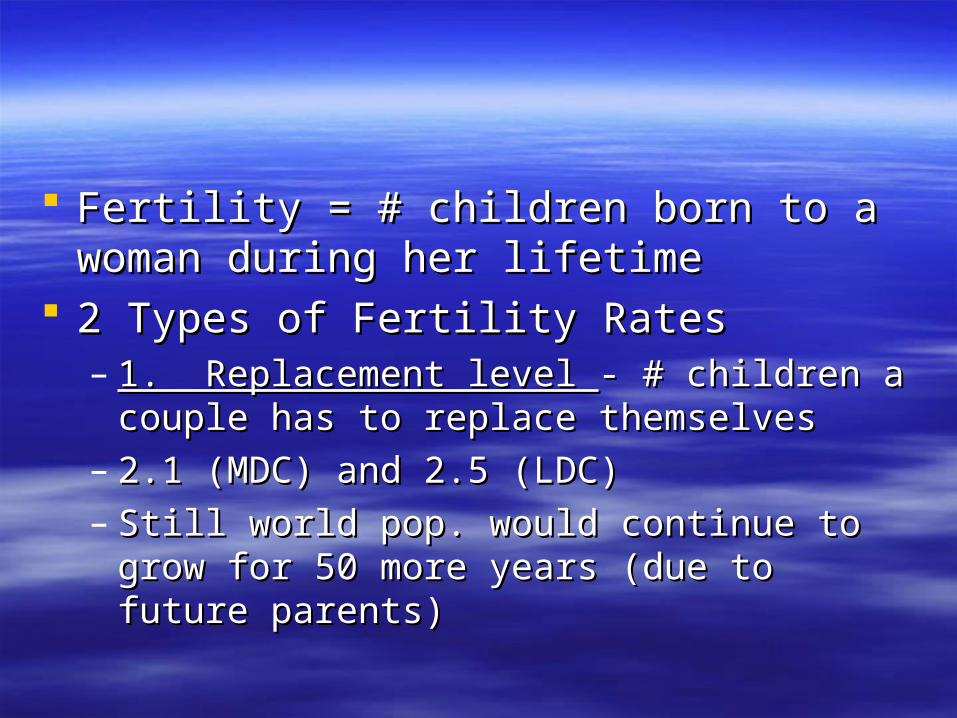
Fertility = # children born to a woman during Fertility = # children born to a woman during her lifetimeher lifetime
2 Types of Fertility Rates2 Types of Fertility Rates– 1. Replacement level 1. Replacement level - # children a couple has - # children a couple has
to replace themselves to replace themselves – 2.1 (MDC) and 2.5 (LDC)2.1 (MDC) and 2.5 (LDC)– Still world pop. would continue to grow for 50 Still world pop. would continue to grow for 50
more years (due to future parents)more years (due to future parents)

– 2. Total fertility rate (TFR) 2. Total fertility rate (TFR) – ave. # children a – ave. # children a woman typically has during her reproductive woman typically has during her reproductive yearsyears
– Global 2.7Global 2.7– MDC 1950 2.5 now 1.6MDC 1950 2.5 now 1.6– LDC 1950 6.9 now 2.9 (still above 2.1)LDC 1950 6.9 now 2.9 (still above 2.1)

US. PopulationUS. Population
1900 76 million – 2006 299 million1900 76 million – 2006 299 million 1945 – 1964 baby boom +79 million1945 – 1964 baby boom +79 million 1965 – 1977 baby bust1965 – 1977 baby bust
– Delayed marriageDelayed marriage– ContraceptionContraception– AbortionAbortion
56% growth due to births56% growth due to births 44% growth immigration44% growth immigration


Largest ecological footprintLargest ecological footprint 1905 1905
– 3 leading causes of death 3 leading causes of death PneumoniaPneumonia TBTB DiarrheaDiarrhea
– 90% US doctors no college edu.90% US doctors no college edu.– 1 in 5 adults illiterate1 in 5 adults illiterate– Daily wage 22 cents per hourDaily wage 22 cents per hour– 9000 cars on roads9000 cars on roads– 144 mi. paved roads144 mi. paved roads– 3 min. phone call from Denver to NY $113 min. phone call from Denver to NY $11– 30 people lived in Las Vegas30 people lived in Las Vegas– Most women washed their hair 1 time per weekMost women washed their hair 1 time per week

Factors Affecting Death RatesFactors Affecting Death Rates
Declining death rates Declining death rates – Increased food suppliesIncreased food supplies– Better nutritionBetter nutrition– Advances in medicineAdvances in medicine– Improved sanitationImproved sanitation– Safer water suppliesSafer water supplies
Has led to: lower premature death rates due to Has led to: lower premature death rates due to less illness and diseaseless illness and disease– Rapid growth rate due to low death rate especially in Rapid growth rate due to low death rate especially in
developing countriesdeveloping countries– https://www.youtube.com/watch?v=jbkSRLYSojo

2 indications of overall health of a 2 indications of overall health of a countrycountry
Life expectancy Life expectancy – 1955 – 2006 global (48yrs – 67yrs) 77 in MDC and 65 1955 – 2006 global (48yrs – 67yrs) 77 in MDC and 65
in LDCin LDC US 47yrs – 78yrs (82 by 2050)US 47yrs – 78yrs (82 by 2050) Poorest countries currently 49yrs or lessPoorest countries currently 49yrs or less
Infant mortality rate–children who die before age 1Infant mortality rate–children who die before age 1– 1965 – 2006 global: MDC 20 – 6.31965 – 2006 global: MDC 20 – 6.3 LDC 118 – 59LDC 118 – 59– 7.6 million die of preventable causes7.6 million die of preventable causes– US 1900 (165) – 2006 (6.7) due to inadequate health US 1900 (165) – 2006 (6.7) due to inadequate health
care for poor, drug addiction, high birth rate among care for poor, drug addiction, high birth rate among teensteens

Factors that affect birth rateFactors that affect birth rate 1) importance of children in labor force (LDC)1) importance of children in labor force (LDC) 2) cost of raising children - $250,0002) cost of raising children - $250,000 3) availability of pension systems – red. need for 3) availability of pension systems – red. need for
support by kidssupport by kids 4) urbanization – better access to family 4) urbanization – better access to family
planningplanning 5) 5) edu. and employment opportunities for edu. and employment opportunities for
womenwomen – Ex: Brazil literate women 2 childrenEx: Brazil literate women 2 children
illiterate women 6 childrenilliterate women 6 children
6) Infant mortality rate6) Infant mortality rate

7) age at marriage ( 25 years or older = 7) age at marriage ( 25 years or older = fewer kids)fewer kids)
8) availability of legal abortions8) availability of legal abortions 9) availability of reliable birth control9) availability of reliable birth control 10) religious beliefs/traditions/cultural norms10) religious beliefs/traditions/cultural norms

Age structureAge structure
= distribution of males and females in each = distribution of males and females in each age group in the worldage group in the world’’s populations population
Prereproductive – (0 – 14)Prereproductive – (0 – 14) Reproductive – (15 – 44)Reproductive – (15 – 44) Postreproductive – (45 and up)Postreproductive – (45 and up)
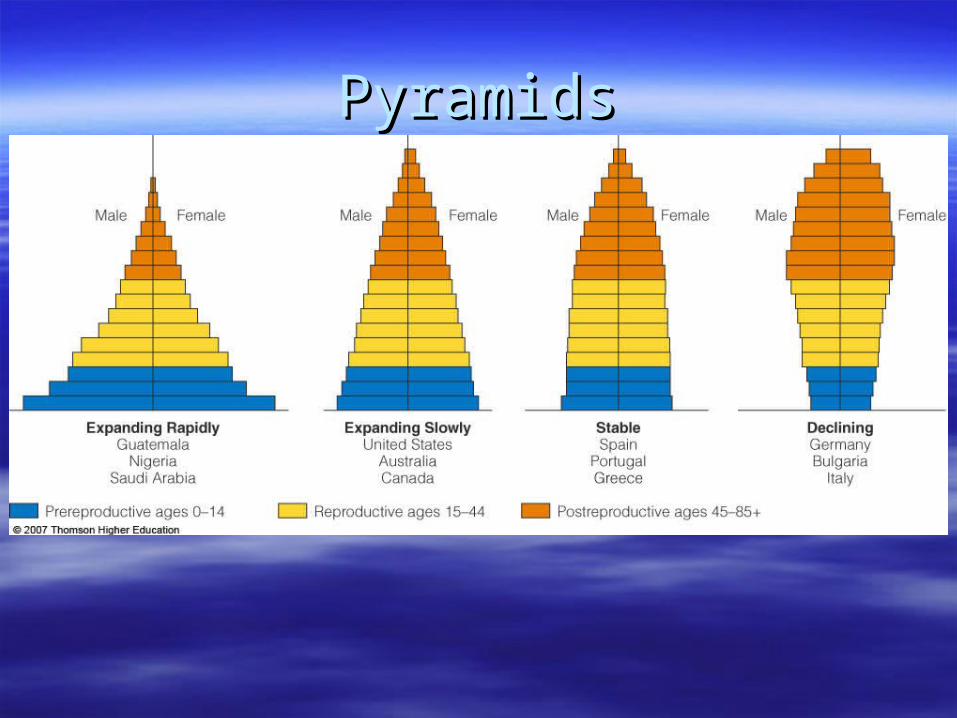
PyramidsPyramids


Demographic transitionsDemographic transitions
As countries become industrialized tend to go As countries become industrialized tend to go through 4 stages:through 4 stages:

Preindustrial – BR and DR about the same, Preindustrial – BR and DR about the same, population stablepopulation stable

Transitional –BR remains high, death rates drop as Transitional –BR remains high, death rates drop as living conditions improveliving conditions improve
Runaway population growth in this stageRunaway population growth in this stage

Industrial- BR and DR about the same, pop Industrial- BR and DR about the same, pop growth slowsgrowth slows
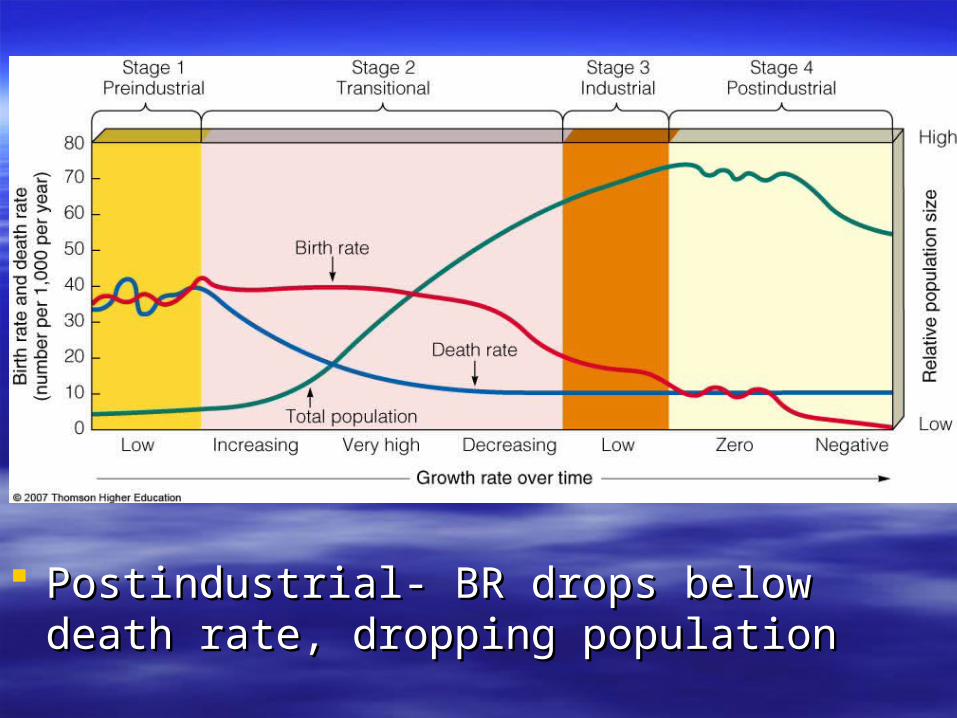
Postindustrial- BR drops below death rate, Postindustrial- BR drops below death rate, dropping populationdropping population