Human Development Report 2007/2008hdr.undp.org/sites/default/files/cornejo_pilar.pdf · Human...
38
Human Development Report 2007/2008 Fighting climate change: Human solidarity in a divided world Human Development Report Office OCCASIONAL PAPER Ecuador Case Study: Climate Change Impact on Fisheries Pilar Cornejo 2007/48
Transcript of Human Development Report 2007/2008hdr.undp.org/sites/default/files/cornejo_pilar.pdf · Human...

Human Development Report 2007/2008
Fighting climate change: Human solidarity in a divided world
Human Development Report Office OCCASIONAL PAPER
Ecuador Case Study: Climate Change Impact on Fisheries Pilar Cornejo
2007/48

1
ECUADOR CASE STUDY: CLIMATE CHANGE IMPACT ON
FISHERIES
BY
M. PILAR CORNEJO R. DE GRUNAUER
PROFESSOR AT
FACULTY OF MARINE ENGINEERING AND MARINE SCIENCE
ESCUELA SUPERIOR POLITECNICA DEL LITORAL
MAY 2007
PHYSICAL ADDRESS FIMCM-ESPOL
CAMPUS GUSTAVO GALINDO KM 30.5 VIA PERIMETRAL GUAYAQUIL – ECUADOR
MAILING ADDRESS: FIMCM-ESPOL
CAMPUS GUSTAVO GALINDO CASILLA 09-06-5863
GUAYAQUIL – ECUADOR
OFFICE TELEFAX: 593-4-2269468
HOME TEL.: 593-4-2690579

2
1. Background/ Introduction
1.1. Current Socioeconomic Setting (last 10 years)
During the last ten years (1997-2007) the socioeconomic conditions in Ecuador have
been strongly marked by several factors, mainly:
1. Political instability: none of the elected presidents have finished their periods
since 1996. There was a coup in 1997 (F. Alarcón, interim president); then
elections in 1998 (J. Mahuad elected) follow by a coup in 2000 (G. Noboa, the
vice-president took charge); elections again in 2002 (L. Gutierrez elected)
follow by a coup in 2005 (A. Palacio, the vice-president took charge), and
elections again in 2006 (R. Correa elected).
2. After the bank assets were frozen in March 1999, the dollar became the
national currency (instead of “sucre”) and the salary scale suffered in the
conversion. Unemployment went high and the exodus of more than a million
Ecuadorians to Europe (mainly Spain and Italy) and USA started. Currently,
remittance from the immigrants account for the second income of the country
after petroleum, and in 2003 there were in the amount of 1,656 millions of
dollars.
3. The extraordinary 1997-1998 ENSO event resulted in damages of 2,881.60
million dollars (CAF, 2000), mainly to highway infrastructure ($ 785.1
millions dollars) and agriculture sector ($1,186.8 millions dollars) (see table
1.1). The area of ENSO influences is found below 1000m heights, which
comprises the coastal plains.
4. The 1999-2000 La Niña event followed the ENSO extraordinary 1997-1998
ENSO, along with an epidemic (White Spot Virus Syndrome) that almost
whipped out the Ecuadorian Shrimp industry, which at that moment employed
8% of the economically active population of Ecuador.

3
Table 1.1 Ecuador total damages during the 1997-98 ENSO event in millions of
dollars. Adapted from CAF (2000).
Sector, subsector and item
Total damage
Direct Damages
Indirect Damages
Effects over the payment balance (exports/imports)
Total 2,881.60 845.50 2,036.00 658.40 Social sectors
Housing 152.60 105.70 46.90 17.10 Education 33.30 15.50 17.80 5.40
Health 18.80 4.20 14.60 6.70 Subtotal 204.70 125.40 79.30 29.20
Service sector Water and sewage 16.70 5.50 11.20 9.60
Electricity 17.10 15.10 2.00 15.40 Hydrocarbons (petroleum) 1.80 0.60 1.20 0.50
Subtotal 35.60 21.20 14.40 25.50 Transport sector (infrastructure)
Highway infrastructure 785.10 96.00 689.10 52.10 Train 0.70 2.10 (1.40) 0.40
Telecommunications 1.00 1.00 - 0.70 Urban transport 7.80 3.00 4.80 0.30
Subtotal 794.60 102.10 692.50 53.50 Productive sectors
Agriculture 1,186.80 538.70 648.10 351.10 Livestock 14.50 8.90 5.60 4.70 Fisheries 42.40 0.10 42.30 33.00 Industry 165.70 12.00 153.70 77.40
Commerce 36.30 19.10 17.10 3.80 Tourism 70.00 18.00 52.00 14.00 Subtotal 1,515.70 596.80 918.80 484.00
Prevention and emergency 331.00 331.00 66.20
1.2. State of Natural and Social domains: atmospheric. Terrestrial, oceanic, social,
economic, legal and technological
Coastal Ecuador is divided into five provinces, four of them with coastal front. From
north to south there are Esmeraldas, Manabi, Guayas and El Oro. The main
socioeconomic activities respond to the climatic conditions, with the exception of
petroleum exports through the Esmeraldas port in Esmeraldas Province.

4
The mean climate of the eastern tropical Pacific is dominated by the trade wind
circulation, which is highly sensitive to and interacts with the underlying SST
distribution. A dominant feature in the precipitation fields is the oceanic Intertropical
Convergence Zone (ITCZ), which marks the convergence line between the northern
and southern hemisphere trade winds (usually located north of the equator).
Distinctive features of the climatology of this region also include: the equatorial cold
tongue in the SST pattern and the equatorial asymmetry between the warmer, rainier
area north of the equator and the cooler, drier region to the south. Schematics of the
system are shown in figure 4.1, with the main current system depicted by the arrows.
In blue is shown the annual temperature range, which is largest along the Peru –Chile
and South Equatorial current axis. The extreme of the oceanic warming – cooling are
the months of March and September respectively (Cornejo, 2003).
Figure 1.1 Current System in the Eastern Tropical Pacific and Annual temperature range.

5
A tri-dimensional view is shown in the schematics of figure 1.2. Surface easterly
winds blow piling warm water on the western equatorial Pacific, and raising the
thermocline in the eastern equatorial Pacific, generating a strong east-west
temperature gradient. Convection develops over the warm waters near Australia and
Indonesia, and thus rainfall.
thermocline
convection zoneover Australia andIndonesia
warm water ispiled on the westernPacific
Figure 1.2 Normal ocean-atmosphere conditions in the Equatorial Pacific
The population in coastal provinces was about 5,406,045 in 2001 (2001 Population
Census), excluding Los Ríos Province, which does not have a coastal front. It
amounts for about 50% of Ecuador’s population in 2001. Schooling is calculated as
the average number of years approved by the population 10 years old and older at the
different levels of instruction1. The average for the whole country is 7.1. Table 1.2
shows the basic population structure per province during the 2001 Population Census.
It is important to mention that most of the artisanal and industrial fisheries take place
in Guayas and Manabi provinces. In Esmeraldas the population uses the services of
estuaries and mangrove area only for subsistence and for crabs and oysters catches
(National Fisheries Institute, personal communication), with some aquaculture
activity. El Oro province is mostly dedicated to banana farming and exports, as well 1 In Ecuador the elementary and high school system amount for 7 and six years respectively by 2001. Today, the system has changed, and 2 years of pre-school have been added.

6
as shrimp aquaculture, and the artisanal fisheries are mostly for household
consumption. Aquaculture activity in general is recovering from the 2000 white spot
virus syndrome.
The Ecuadorian Program on Coastal Resources Management (PMRC in Spanish)
developed a Proposal for Coastal Development and Planning that resulted in a
publication on Macrozonification of the continental coastal zone (i.e. excludes
Galapagos islands) (Ochoa, Olsen and Arriaga, 2001). This publication included
public participation of the coastal zone (5km inland) and presents scenarios for 2010
and 2030. Figure 1.3 is taken from Ochoa, Olsen and Arriaga (2001, Chapter III). It
shows the scenarios for 2010, and the small boats show the areas of artisanal fisheries;
the big ships the industrial ports and the anchors the commercial ports. Most of the
artisanal and industrial fisheries are located in Manabi and Guayas provinces.
Figure 1.3 Schematic vision of coastal development by 2010. Taken from Ochoa,
Olsen and Arriaga (2001, Chapter III).

7
Table 1.2 Population Structure in the Coastal Provinces and their main artisanal or industrial fisheries locations
Province Total
Annual growth
rate Males % Females % (Male/female)
*100 %
Prov. Total
housing Labor force
Agriculture, aquaculture, gaming and
fisheries Schooling
rate GUAYAS 3,309,034 2.5 1,648,398 49.8 1,660,636 50.2 99.26 100.0 865,562 1,220,389 200,547 7.1 BALAO 17,262 2.9 9,332 54.1 7,930 45.9 117.68 0.5 4,552 6,759 5.3 SALINAS 49,572 3.9 25,095 50.6 24,477 49.4 102.52 1.5 18,287 16,253 6.2 SANTA ELENA 111,671 2.6 57,343 51.3 54,328 48.7 105.55 3.4 30,996 35,750 5.6 PLAYAS 30,045 3.0 15,142 50.4 14,903 49.6 101.60 0.9 10,665 10,167 5.8 LA LIBERTAD 77,646 3.5 38,847. 50.0 38,799 50.0 100.12 2.3 19,711 26,104 6.4 GUAYAQUIL 2,039,789 2.4 999,191 49.0 1,040,598 51.0 96 61.6 520,789 780,268 8.0 MANABI 1,186,025 1.3 596,502 50.3 589,523 49.7 101 100.0 301,533 382,106 149,475 5.9 MANTA 192,322 3.4 94,486 49.1 97,836 50.9 96.58 16.2 47,546 66,244 7.1 PEDERNALES 46,876 3.9 24,358 52.0 22,518 48.0 108.17 4.0 11,713 14,343 4.1 PUERTO LÓPEZ 16,626 1.8 8,712 52.4 7,914 47.6 110.08 1.4 4,201 4,827 4.9 JAMA 20,230 6.4 10,312 51.0 9,918 49.0 103.97 1.7 4,129 7,006 4.4 JARAMIJÓ 11,967 3.6 6,150 51.4 5,817 48.6 105.72 1.0 2,473 3,439 4.6 SAN VICENTE 19,116 0.3 9,842 51.5 9,274 48.5 106.12 1.6 5,353 6,200 5.0 ESMERALDAS 385,223 1.7 197,150 51.2 188,073 48.8 105 100.0 100,620 129,655 48,111 5.8 ESMERALDAS 157,792 1.4 77,350 49.0 80,442 51.0 96.16 41.0 40,445 53,826 7.2 MUISNE 25,080 1.0 13,483 53.8 11,597 46.2 116.26 6.5 6,860 7,811 4.3 SAN LORENZO 28,180 2.0 14,675 52.1 13,505 47.9 108.66 7.3 7,185 9,874 4.9 ATACAMES 30,267 4.7 15,936 52.7 14,331 47.3 111.20 7.9 8,689 10,375 5.2 EL ORO 525,763 2.2 266,716 50.7 259,047 49.3 103 100.0 146,675 195,046 57,706 7.0 MACHALA 217,696 2.9 109,011 50.1 108,685 49.9 100.3 41.4 57,535 82,313 7.8

18
1.3. Evolution of the fisheries sector
During 2006 an important change in the legal framework for fisheries was approved.
Prior to 2006, the fisheries sector was included within the Ministry of Foreign Affairs,
Commerce, and Integration, formerly known as the Ministry of Commerce, Fisheries,
Integration and Competitiveness. Today, the fisheries sector is under de Ministry of
Agriculture and Fisheries (formerly known as Ministry of Agriculture) and changes in
its structure are under development and implementation. The under-secretary of
fisheries resources, which is located in Guayaquil (Guayas province), would move the
city of Manta (Manabi province), and a new under-secretary for Aquaculture would
be created and located in Guayaquil. This has posed some problems among the
private sector because Guayaquil is the main export ports for fisheries products, while
Manta concentrates mostly the tuna exports. The National Fisheries Institute is also
undergoing a re-engineering process and it is currently in charge of the test that the
European Union requires on Aquaculture products for exports.
A good overview of the fisheries sector in Ecuador is provided by FAO
(http://www.fao.org/fi/fcp/es/ECU/BODY.HTM, document in Spanish). Some of the
information provided in it, is shown here for completeness. In 1952, Ecuador along
with Peru and Chile signed the Declaración de Santiago, to extend their national
jurisdiction 200 nautical miles off their respective coasts, to preserve their marine
resources. Afterwards, the Permanent Commission of the South Pacific (CPPS in
Spanish) is created to develop research and protection of the marine resources. One
of its most important results with the aid of FAO is the creation of the National
Institute of Fisheries, with the Ecuadorian one (INP in Spanish), starting in 1960. The
mission of INP is to conduct research on the ocean to generate enough knowledge for
adequate management of the Ecuadorian fisheries. It is an advisor to the under-
secretary of fisheries, providing the basis for management and regulation of the
fisheries sector.
The most important fisheries landing ports are shown in figure 1.4
((http://www.fao.org/fi/fcp/es/ECU/BODY.HTM); and their importance is shown in
the average for the period 1990-1999 (table 1.3).

19
Figure 1.4 Main fisheries landing ports (red dots). Taken from (http://www.fao.org/fi/fcp/es/ECU/BODY.HTM)
Table 1.3 Main fisheries landing ports and average landings for the 1990-1999 period. Taken from (http://www.fao.org/fi/fcp/es/ECU/BODY.HTM)
Port Metric tones/year %
Manta (Manabí) 250,442 62
Guayaquil (Guayas) 84,827 21
Posorja (Guayas) 40,393 10
Monteverde (Guayas) 8,078 2
Chanduy (Guayas) 4,039 1
Esmeraldas (Esmeraldas) 4,039 1
Salango (Manabí) 4,039 1
Pto. López (Manabí) 1,615 0.4
Machalilla (Manabí) 1,615 0.4
Pto. Bolívar (El Oro) 4,039 1
Galápagos 813 0.2
Total 403,939 100

20
The industrial sector was initially dedicated to tuna and shrimp fisheries, and then
also moved to include small pelagic fish such as sardines, and later fish for fishmeal.
The tuna catches has been growing continuously since the seventies (Cucalon, 2005),
from about a million metric tones in 1970 through close to 4.5 million metric tones in
2003. Cucalón (2005) shows in his Atlas of Tuna Fisheries in the eastern Pacific the
effects of El Niño and La Niña events during the 1970-2003 period. By 2002, the
Tuna industrial fisheries had 106 vessels, 33 canning factories, and 19 packing
facilities. The Inter-American Tuna Commission regulates Tuna catches in the eastern
Pacific.
During April 2007, a workshop on current fisheries results was held at INP. Gonzalez
et al. (personal communication) in an analysis of the small pelagic fisheries for the
1981-2006 period show that the maximum catches were in 1985 with a total close to 2
million metric tones while the minimum registered was 175,000 metric tones during
2004. They also show that there is a tendency for alternating species catches and a
general decreased in the availability of small pelagic fish. In figure 1.5 we show the
pelagic fisheries catches for 1981-2000 (from
http://www.fao.org/fi/fcp/es/ECU/BODY.HTM) along with two well-known climatic
indices, Niño1+22 and Niño3.4 (black lines), and in table 1.4 we show its data.
PELAGIC FISHERIES
0
200,000
400,000
600,000
800,000
1,000,000
1,200,000
1,400,000
1981 1982 1983 1984 1985 1986 1987 1988 1989 1990 1991 1992 1993 1994 1995 1996 1997 1998 1999 2000
met
ric to
nnes
-2
-1
0
1
2
3
4
Sardinops sagax Scomber japonicus Opisthonema spp.Cetengraulis mysticetus Etrumeus teres Trachurus murphyiothers Ni–o 1+2 Ni–o 3.4
2 The Niño 1+2 and Niño3.4 are Sea Surface Temperature indices calculated the average temperature from 0-10°South, 90°West-80°West and 5°North-5°South, 170-120°West, respectively. The monthly departures are the anomalies from average of the period 1971-2000.

21
Figure 1.5 Total annual catches for small pelagic fishes. The black continuous
and dotted lines are the Niño 1+2 and Niño 3.4 indices with an annual filter computed from their monthly values.
The total annual catches do not exhibit a specific pattern. The peaks in the climatic
indices coincide with the ENSO events of 1982-83, 1986-1987, 1991-1992 and 1997-
1998. Also take in account the warm period after the 1991-1992 ENSO events. Since
we don’t have fleet size, and hence yield, we cannot filter out over-fishing. However,
figure 1.4 shows that the relationships between temperature anomalies and some
species like Sardinops sagax and Scomber japonicus are inverse, and that long
warming periods are associated with their decrease and disappearance.
ECUADORIAN EXPORTS
0
100,000
200,000
300,000
400,000
500,000
600,000
700,000
800,000
900,000
1,000,000
1997 1998 1999 2000 2001 2002 2003 2004 2005 2006
thou
sand
s of
dol
lars
Shrimp Tuna Fish Fish meal other marine products Figure 1.6 Main Ecuadorian Exports from fisheries and aquaculture. Source:
Ecuadorian Central Bank (www.bc.fin.ec).
Figure 1.6 shows the main Ecuadorian exports from fisheries and aquaculture. During
the last decade, Shrimp exports had a maximum during the 1997-98 ENSO event but
fold dramatically, about to 1/3 of its value, due to the white Spot Virus syndrome, and
remained there for about four years. After 2004, the shrimp sector is increasing its
yield due to control of the virus and best practice management. During the same
period tuna exports have more than doubled while other products remain about the
same level.

18
Table 1.4 Total annual catches for small pelagic fishes. The Niño 1+2 and Niño 3.4 indices were filtered with an annual filter.
Sardinops
sagax Scomber japonicus
Opisthonema spp.
Cetengraulis mysticetus
Etrumeus teres
Trachurus murphyi Others Total Niño 1+2 Niño 3.4
1981 255,102 448,088 68,390 2,832 266,177 2,526 1,043,115 -0.3734 0.29191982 314,102 589,375 219,849 2,832 25,547 6,577 1,158,282 2.3455 1.5751983 104,163 252,667 69,155 40,384 79,339 1,155 546,863 1.1786 -0.19281984 648,784 396,913 182,074 54,029 52,025 9,608 1,343,433 -1.1241 -0.8181985 1,215,587 397,863 328,074 5,788 40,739 10,536 1,998,587 -0.7749 -0.48971986 590,258 274,852 297,721 74,246 29,209 1,215 1,267,501 0.719 1.19291987 210,097 149,302 240,577 126,420 14,373 12,899 753,668 0.3355 0.65541988 382,337 255,548 206,766 84,346 9,215 11,115 949,327 -0.9719 -1.51271989 260,872 141,333 189,789 63,433 838 35,108 691,373 -0.3076 -0.14341990 16,895 786 98,632 30,996 5,471 4,144 4,114 161,038 -0.3337 0.491991 3,377 55,023 91,622 59,637 17,180 45,313 392 272,544 0.5444 0.9781992 212 25,651 31,016 99,672 9,688 15,022 45,000 226,261 0.6633 0.57741993 0 50,980 69,247 101,683 57,663 2,673 70,136 352,382 -0.3712 0.16391994 212 38,991 69,892 27,164 30,748 36,575 72,486 276,068 0.2102 0.78231995 34,609 63,577 40,910 47,660 46,253 174,393 14,532 421,934 -1.2795 -0.79881996 356,477 79,484 41,041 26,354 34,349 56,782 29,028 623,515 0.2751 0.33661997 56,096 192,181 37,723 89,723 1,095 30,302 14,389 421,509 3.1447 1.4391998 1,012 44,716 40,530 44,474 8,873 25,900 23,580 189,085 0.5935 -0.78061999 8,821 28,307 22,253 27,221 3,636 19,072 146,970 256,280 -1.3351 -1.38672000 51,440 83,923 20,037 13,333 4,415 7,122 236,900 417,170 -1.2292 -0.9702Total 4,510,453 3,569,560 2,365,298 1,022,227 736,833 417,298 748,266 13,369,935

18
2. Risk and climate impacts facing Ecuador
2.1. Risk and climate impacts
The fisheries sector faces several problems regarding climate impact that must be
taken in account:
1) Changes in air temperature and precipitation patterns.
2) Sea level rise: because of the gentle slope of the continental platform, and
immediate coastal plains a small rise in sea level would result in increase of
the surge area, coastal erosion and lost of the beach side. This in turn poses the
question of adaptation through different kind of measures.
3) Changes in water masses (temperature, salinity and oxygen properties), and
hence migration of fisheries because of changes in the habitats
2.2. The attribution problem
The main problem is that some of the impacts are exacerbated by the current
socioeconomic conditions of the Ecuadorian population which are the result of the
socio-political situation of the country in at least the last ten years plus the effects of
lack of enforcement of coastal management policies regarding land use, zonation and
sustainable use of ecological services as well as sanitation and provision of potable
water in small settlements and rural areas.
3. Fisheries sector key vulnerabilities at household, community and national
levels
The fisheries sector key vulnerabilities at the household, community and national
level, have been previously analyzed by different governmental agencies under their
own perspectives. The Ministry of Environment (Cáceres, 2001) conducted an study
on Vulnerability, Adaptation and Mitigation of Climate Change which included An
evaluation of the Vulnerability of the coastal zone of the Gulf of Guayaquil (Guayas
Province) only; Ochoa, Olsen and Arriaga (2001) prepared scenarios for 2010 and
2030 for locations within 5km from the shoreline related to coastal planning; and
IPUR-Catholic University (2001) prepared for COPEFEN (unit Coordinating
Emergency Plans to cope with ENSO) and IDB a plan of the infrastructure required to
cope with ENSO events at the coast. These three works combined help us to
understand which are the key vulnerabilities of the fisheries sector under the
assumption that climate change scenarios will be similar to those of ENSO events

19
warm an cold phases and that direct negative impacts are the three mentioned in
section 2.1.
We did not find any study that really assess vulnerability due to sea level change,
changes in temperature and precipitation patterns, and changes in water masses in
both the artisanal and sssindustrial fisheries. It is probable that impact on the
industrial fisheries would fall into new regulations of the Tuna fisheries in the Pacific
and that migration under adverse oceanic conditions would pose an increase in
mobility expenses (fuel expenses). The problem with impacts on the artisanal sector
is that National Fisheries Institute (INP, personal communication) does not have
enough funds in its budget to regularly visit all the artisanal fisheries settlement for
data collection. INP’s director proposed the artisanal fishermen, in a recent meeting,
to establish a cooperation scheme in which they report to the INP their fisheries data.
Currently, the Ecuadorian National Meteorological and Hydrological Services
(personal communication) are analyzing model results for climate change scenarios in
10, 30 and 100 years from current time.
In reality vulnerabilities to climate change at different levels are due to insufficient
implementation of coastal planning, political and economical crisis and social
conflicts. Ochoa, Olsen and Arriaga (2001) prepared a scenario for the coastal zone
for 2030 under the assumption that the same conditions (as in 1970-2000) hold
through that year. The assumptions are:
o Annual population growth for the coastal provinces is 3% and for the coastal
cities between 3-5%.
o The election system and its expenses would be the same, and hence the political
and economical crisis and social conflicts would continue.
o Because of social instability it would not be possible to implement a national
agenda for coastal management
Then the vulnerabilities (results) would be as follows:
o Estuarine productivity would be destroyed in terms of fish population, crustacean
and mollusks plus shrimp aquaculture due to water pollution and changes in fresh
water fluxes
o Pressure over less affected areas would increase as well as illegal activities,
making others such as aquaculture unsustainable
o Housing and tourism development would be chaotic and artisanal fishermen

20
would loose direct access to the beaches.
The activities proposed by the main actors in each of the provinces (Ochoa, Olsen and
Arriaga, 2001) are related to the previously mentioned vulnerabilities. A digital
version of Ochoa, Olsen and Arriaga (2001) is attached as Annex.
The vulnerability identified by IPUR (2001) relates to infrastructure (this is the scope
of CORPECUADOR): riverbank protection, flood protection, landslide protection and
it has been identified to the level of suburbs/neighborhood. A summary of the
requested investment to reduce vulnerability is shown in the following table (table
3.1), and the complete document in Spanish is in the Annex.
Table 3.1 Works demanded to cope with vulnerable areas of the coastal Provinces
Province Number of works
requested
Preventive short term
worked
Works that demand studies
Works without enough
information Number Cost ($) Number Number
Esmeraldas Manabi 227 63 2,221,747 108 56 Guayas 349 107 1,674,851 206 36 El Oro 186 76 1,643,909 91 19
The results from the analysis, led by Cáceres (2001), regarding adaptation strategies
in the lower Guayas river basin and Gulf of Guayaquil, show that vulnerabilities for
the fisheries sector are related to flooding of coastal settlements due to sea level rise,
loss of biodiversity because of lost of mangrove areas, and changes in the trophic
chain structure that would in turn affect the fisheries (small pelagic fish and the so
called white fisheries), decreasing the stocks and putting more pressure on the
remaining resources. Also, since most of the shrimp farms are located in this area,
sea level rise would have a negative impact on the infrastructure of the sector, as well
as a decreased in oceanic temperatures. Effects in other sectors have also been
identified. A digital version of Cáceres (2001) is attached.
4. ENSO: a climatic extreme event and its impact upon the fisheries sector

21
El Niño/Southern Oscillation (ENSO) was one of the best well known climatic
extremes in Ecuador. The pre-Columbian El Niño knowledge presented it as a
climatic warm event, that periodically appears during the rainy season (around the
end of December) in southern coastal Ecuador and northern coastal Peru. This
climatic event was associated with fertility, because of the increase in rainfall
associated with it (Marcos, 2004). During the twenty century, the concept of ENSO
evolved from a local process (local to Ecuador and Peru) to an equatorial Pacific
basin-wide event with worldwide teleconnections, along with positive and negative
impacts. Currently, during the twenty-first century, the ENSO events have been
limited to the central equatorial Pacific Ocean, with little signature and impact over
coastal Ecuador and Peru. This evolution of ENSO events through the centuries
implies that we have to study it in relationship to longer time scales of variability,
associated with multi-decadal to centennial variability in order to understand its
changing behavior. However, in lieu of climate change, the scenarios posed by both
the warm - El Niño-, and the cold – La Niña -, phases are still useful as climate
extremes that could occur under climate change conditions under the assumption that
the climatic extremes would become more frequent.
There are several studies looking at the impact of ENSO upon different
socioeconomic sectors, such as agriculture, fisheries, and also upon infrastructure and
health. In the case of fisheries, there should be four aspects taking into consideration
(there are not in order of importance):
i) Changes in fisheries due to migration or decay of a population because
of oceanic conditions
ii) Impact of sea level change (mainly rise) on the coastal fisherman
settlement
iii) Impact of the infrastructure use to transport the catches from the
different fisheries
iv) Impact on the health of the coastal populations
All this impacts, positive or negative would influence the fisheries sector under
climate change conditions. The following scenarios are provided as means as
understanding what could happen under extreme events.

22
General aspects
4.1. ENSO warm phase scenarios
ENSO warm phase scenarios are well known and their worldwide impact has driven
the attention of stake-holders and policy-makers, who at the end of the last century
implemented a series of programs for end-users to cope with their negative impacts
and taking advantage of the positive ones. General schematics of the ocean-
atmosphere conditions during the event are shown in figure 4.1. In contrast, with
figure 4.2, at some point in the equatorial Pacific (in space and time), the easterly
winds relaxed and the warm water that was piled on the west moves eastward. The
thermocline depth increases, and the convection move also eastward with the warm
waters underlying it. A set of Kelvin waves transport energy eastward rising sea level
on the equatorial waveguide off South America (usually between 5°N-5°S),
generating coastal-trapped waves that move poleward, rising sea level along the west
coast of the Americas (Cornejo and Enfield, 1987; Enfield et al., 1987).
0°
thermocline
convection zonemoves eastward
warm watermoves eastward
Figure 4.1 ENSO conditions in the equatorial Pacific
A well-known scenario for South America is the one depicted in figure 4.2, with the
impact in precipitation (wet or dry) and air temperature (warm or cold). Off Ecuador,
conditions are usually wet and warm, but their strength depends on the timing of the
onset of the warm event.

23
Figure 4.2 ENSO warm phase known impacts. Source:
http://www.cpc.noaa.gov/products/analysis_monitoring/impacts/warm.gif
The damage in the fisheries as an important socioeconomic sector was analyzed by
CAF (2000). In total during the 1997-1998 ENSO event, the total damage was 42.4
million dollars (table 1.1), direct damage about 0.1 million dollars, indirect damage
42.3 million dollars and the effect over the payment balance was about 33 million
dollars (decrease in exports in relationship to imports). The total is about 1.47% of
the total damages in the country (table 1.1). For comparison, damages during the

24
1982-83 ENSO event in the fisheries sub-sector were 117.2 million dollars (ECLAC,
1983), i.e. there was a reduction of almost 1/3 in losses from this event to the 1997-
1998 one (table 4.1). For 1982-83 most of the damage was due to reduction in
catches (113.2 million dollars; ECLAC, 1983). A detailed list of impacts per
hydrographic basin is presented in CAF (2000), but without their costs.
Table 4.1 Damage caused by the 1982-83 ENSO event in millions of dollars. Adapted from ECLAC (1983)
Sector, subsector and item
Total damage
Direct Damages
Indirect Damages
Effects over the payment balance (exports/imports)
Total 640.6 533.9 106.7
Social sectors
Housing 6.3 6.3 - 1.2
Education 6.6 5.8 0.8 1.1
Health 10.7 4.6 6.1 7.7
Subtotal 23.6 16.7 6.9 10 Transport
Highway infrastructure 162.0 126.4 35.6
77.3
Train 16.7 14.9 1.8 8.5 Airport
infrastructure 4.1 4.1 - 1.9
Urban transport 26.5 18.9 7.6 13.1
Subtotal 209.3 164.3 7.6 100.8 Productive sectors
Agriculture 202.7 202.1 0.6 94.3
Livestock 31.1 22.1 9.0 4.5
Fisheries 117.2 117.2 -
Industry 54.6 10.0 44.6
Subtotal 405.6 351.4 44.6 98.8 Other damages 2.1 1.5 0.6 0.6
The local impacts follow:
i) Sea level rise: during the extreme events of 1982-83 and 1997-1998 sea level
rise between 0.20-0.40 m above the average causing coastal erosion at the shoreline,
destroying structures near the beach. It also caused problems to the artisan fisherman
boats, losses in tourism at the beaches, and beaches were crowded with dead trees and
animals at their estuarine outlets. The DIVA3 software (it is an integrated assessment
3 DIVA is a new tool for integrated assessment of coastal zones that will be released in late

25
model to assess the vulnerability of the coastal zone worldwide, sea reference) was
used to forecast sea level rise under scenario A1B, high sea level rise conditions. The
results are shown in figure 4.3. The black line shows the 0.20 m level rise that
occurred during the 1982-83 ENSO event. All coastal provinces and Galápagos
Island are affected between 2030 and 2035, except Guayas that is affected between
2025 and 2030. This has to be used only as a reference since uplifting or subduction
by plate tectonics is not taken into consideration in the DIVA software.
RELATIVE SEA LEVEL CHANGE SINCE 1995
0
0.1
0.2
0.3
0.4
0.5
0.6
0.7
0.8
0.9
1
2005 2010 2015 2020 2025 2030 2035 2040 2045 2050 2055 2060 2065 2070 2075 2080 2085 2090 2095 2100
m
Esmeraldas Manabi Galapagos Guayas El Oro ENSO 82-83 Figure 4.3 Relative sea level change since 1995 (as computed with DIVA
software).
The population actually flooded is shown below (figure 4.4 and table 4.2). The
province most affected is Guayas because of higher sea level rise (figure 4.3) and
because it hosts about 25% of the country population and about 50% of the coastal
area one. However, when we look at the numbers estimated by DIVA software (table
4.2 and compared then with those of table 1.2, there are very low in comparison with
the actual population. The cost of adaptation as computed by DIVA is between 40
million dollars in 2005 to 250 million dollars by 2100. Impact/adaptation algorithms
2004. It is specifically designed to explore the vulnerability of coastal areas to sea level rise. It comprises a global database of natural system and socioeconomic factors, relevant scenarios, a set of impact-adaptation algorithms and a customized graphical-user interface. Factors that are considered include erosion, flooding salinization and wetland loss. DIVA is inspired by the paper-based Global Vulnerability Assessment (Hoozemans et al., 1993), but it represents a fundamental improvement in terms of data, factors considered (which include adaptation) and use of PC technology.

26
(Hoozemans et al., 1993) are used to compute these costs. There is not information
about what would be the adaptation measurements in the model. Also, during the
period 2000-2007, the sector most affected by climate variability in Ecuador has been
the agricultural one (changes in precipitation patterns). The impact on the fisheries
sector has not been accounted for. There is information (Townsend, personal
communication), that the industrial fleet has been changing the size of the mesh
(decreasing it), and changing fishery practices to be able to catch something.
Simultaneously, due to decrease in some of the fisheries, the Ecuadorian government
has explicitly banned some of the catches to go for fishmeal (e.g., Cetengraulis
mysticetus).
Table 4.2 Forecast of people flooded by relative change in sea level shown in figure 4.3 (as computed with DIVA software) in thousands of people.
Year Esmeraldas Manabi Galapagos Guayas El Oro 2005 0.07 0.18 0.01 3.74 0.232010 0.15 0.37 0.03 7.73 0.482015 0.24 0.57 0.04 11.96 0.742020 0.33 0.78 0.05 16.43 1.022025 0.42 1.00 0.07 21.10 1.312030 0.52 1.23 0.09 25.94 1.612035 0.62 1.47 0.10 30.93 1.922040 0.72 1.71 0.12 36.04 2.242045 0.82 1.96 0.14 41.23 2.562050 0.93 2.22 0.15 46.47 2.892055 1.04 2.47 0.17 51.74 3.212060 1.14 2.73 0.19 57.00 3.542065 1.25 2.99 0.21 62.23 3.872070 1.35 3.24 0.22 67.40 4.192075 1.46 3.49 0.24 72.50 4.502080 1.56 3.74 0.26 77.50 4.812085 1.66 3.98 0.28 82.39 5.112090 1.76 4.20 0.29 87.14 5.412095 1.85 4.42 0.31 91.71 5.692100 1.94 4.63 0.32 96.12 5.96
In Ecuador’s National Climate Change Communication, Cáceres (2001) used three
different scenarios for sea level change, precipitation and air temperature changes in
the Guayas river basin (it is part of the Guayas province and seven more provinces).
In this case, the size of the population that most evacuated by 2010 is about 327,000

27
while under danger there 200,000 more. The losses are computed as 1,045 million
dollars of losses and another 1,040 million dollars under danger. The difference
between Cáceres (2001) and the results from the DIVA software is that in the former
case, sea level change is not the only factor and it takes in account the river basin (an
area of about 630 km perimeter and an area of14.878 km2, 1/3 covered by estuaries).
Changes in temperature and precipitation would cause changes in precipitation
patterns and hence flooding. Cáceres (2001) estimated the adaptation measures that
must be taken, but they were not quantified. The main barriers for adaptation found
were the institutional constraint, governance problems, power abused and financial
constraints.
PEOPLE ACTUALLY FLOODED
0.00
20.00
40.00
60.00
80.00
100.00
120.00
2005 2010 2015 2020 2025 2030 2035 2040 2045 2050 2055 2060 2065 2070 2075 2080 2085 2090 2095 2100
cum
ulat
ive
(1,0
00)
Esmeraldas Manabi Galapagos Guayas El Oro Figure 4.4 Forecast of people flooded by relative change in sea level shown in
figure 4.3 (as computed with DIVA software).
Figure 4.5 Forecast of mangrove area lost by relative change in sea level shown in
figure 4.3

28
There are two more problems derived from sea level rise, salinization of groundwater
and mangrove lost. There is not a good account of groundwater availability.
Mangrove lost has also been forecast with DIVA Software and is shown in figure 4.5.
Losses (not shown) in monetary value amount about 5 million dollars in 2000, and go
up to over 140 million by 2100.
v) Changes in fisheries due to migration or decay of a population because
of oceanic conditions.
Cucalón (2005) has analyzed the impact of ENSO warm phase upon the tuna landings
in the eastern Pacific. He founds that catch per unit of effort decreases during ENSO
events for almost the first three quarters of the second year of El Niño, with the stocks
moving northward and eastward during 1982-83 and southward during 1997-1998.
0
2,000
4,000
6,000
8,000
10,000
12,000
14,000
16,000
18,000
1991 1992 1993 1994 1995 1996 1997 1998 1999 2000 2001 2002 2003 2004 2005 2006
met
ric
tonn
es
-1.5
-1
-0.5
0
0.5
1
1.5
2
2.5
3
�C
total landings Ni–o1+2
Figure 4.6 Tuna landings (metric tones) by artisanal fisheries (Source: INP 2007) and the Niño 1+2 SST index.
Table 4.1 Tuna landings by the Artisanal Fisheries. Source: INP 2007. year Esmeraldas Manta S.
Mateo Anconcito Sta.
Rosa Playas Engabao Pto.
Bolívar TOTAL
1991 24.4 1612.9 1135.0 691.8 507.8 9.4 0.1 79.8 4061.2 1992 56.7 2583.3 2142.0 2926.7 3546.6 0.3 0.2 322.9 11578.7 1993 32.7 1302.8 1933.9 4969.1 5636.4 8.3 2.1 903.7 14789.0 1994 604.8 4333.1 1073.4 2901.4 3431.3 8.2 2.1 747.2 13101.5 1995 439.1 11628.2 396.8 2566.9 799.9 0.0 0.0 473.5 16304.4 1996 1650.0 3416.8 207.4 1534.7 108.8 0.1 0.0 147.1 7064.9 1997 12.3 2283.7 123.9 176.4 196.8 0.0 0.0 36.5 2829.6 1998 43.6 2539.1 20.8 1138.6 258.7 1.2 3.4 214.9 4220.2

29
1999 235.3 --- --- 1340.4 37.6 1.5 1.7 0.0 1616.5 2000 230.0 47.8 --- 862.2 56.3 54.8 2.8 135.0 1388.9 2001 5.3 368.4 --- 488.9 138.4 0.0 0.2 168.5 1169.7 2002 76.2 --- 17.2 43.9 532.1 0.1 0.0 155.3 824.9 2003 48.5 1244.2 128.6 88.9 1467.4 1.6 8.3 152.2 3139.8 2004 115.1 716.3 --- 27.3 588.6 --- --- 39.7 1487.0 2005 160.7 169.9 --- 34.5 500.9 --- --- 164.6 1030.7 2006 213.0 635.0 --- 195.7 1160.8 --- --- 206.6 2411.1 The Tuna landings by artisanal fisheries do not show a clear relationship with ENSO
warm phases (figure 4.6 and table 4.1). However, for the 1991-2006 period an
increase in landings is observed during warm periods.
As mentioned before, there is not clear relationship between warm phases of ENSO
and pelagic fisheries (table 1.4 and figure 1.5). It seems that their variability is
associated most probably with longer scales of variability and over-fishing.
In general, it would be more adequate to analyze all the fisheries off the west coast of
South America, as part of the Peru-Chile upwelling ecosystem and the warm waters
from the North Equatorial Countercurrent.
vi) Impact of the infrastructure use to transport the catches from the
different fisheries
The coastal infrastructure (highways) is usually impacted by ENSO events. During
the 1997-1998 ENSO event, transport cost (UNEP/NCAR EL Niño Project report)
went up during December 1997, as result of the speculation. The transport system
assumed that damages to the coastal infrastructure would be the same as during the
1982-83 ENSO event. Real damage occurred after January 1998. A new
governmental entity was created to take care of the damages, CORPECUADOR. It is
an executive unit devoted to rebuild the zones affected by ENSO. It was created in
1998 for a period of 10 years. The area covered by CORPECUADOR is about
100,000 km2, and includes everything below 1000m heights from the west Andean
Mountains towards the coastal plains. Infrastructure and housing damages were
closed to 900 million dollars (table 1.1), with over 13,000 houses affected (table 4.2,
for all the coastal region). There are several maps that show (in Spanish) all the
highway and bridges repaired by CORPECUADOR. They are only shown (figure
4.7) for the coastal provinces of Esmeraldas, Manabi, Guayas and El Oro. It is easy

30
to compare the main landing ports listed in table 1.2 with the area covered by
CORPECUADOR.

31
Table 4.2 Summary of victims and damage attributed to the 1997-98 ENSO event. This is table 17 in the ECUADOR, UNEP/NCAR EL NIÑO PROJECT REPORT. The coastal provinces with coastal frontlines have been highlighted. The total for the coastal region includes Los Ríos Provinces.
PROVINCE DAMNIFICATED AFFECTED DEATH WOUNDED DISAPPEARED HOUSES FAMILIES PEOPLE FAMILIES PEOPLE AFFECTED DESTROYED
AZUAY 36 175 136 703 6 3 120 35 BOLIVAR 5 21 56 277 14 54 5 CAÑAR 21 210 8 147 3 1 8 21 COTOPAXI 17 91 68 286 5 1 75 17
CHIMBORAZO 75 358 241 1,167 14 7 6 221 66 EL ORO 441 2,046 1,434 5,531 7 1 2,116 440
ESMERALDAS 571 2,446 744 1,678 31 40 7 596 533 GUAYAS 2,597 11,874 5,113 24,618 43 8 10 1,885 1,415 IMBABURA 1 5 4 20 4 1 LOJA 17 90 149 745 30 12 152 17 LOS RIOS 104 496 742 3,478 17 5 1 715 99 MANABÍ 1,863 8,768 3,050 15,776 104 81 5 3,050 1,863 MORONA SANTIAGO 14 75 3 2 14 NAPO 347 2,046 1,345 6,755 3 2 862 347 PASTAZA 98 462 67 333 2 3 121 88 PICHINCHA 1
TUNGURAHUA 1 3 1
ZAMORA CHINCHIPE 121 402 117 387 10 1 4 136 121 GALÁPAGOS 2 11 4 30 4 2
COUNTRY’S TOTAL 6,317 29,504 13,292 62,006 293 162 38 10,133 5,071 COASTAL REGION TOTAL 5,578 25,641 11,087 51,111 202 134 24 8,366 4,352 COASTAL REGION AS % 88% 87% 83% 82% 69% 83% 63% 83% 86%

Figure 4.7 Infrastructure rebuild by CORPECUADOR during the 1998-2002 periods in the coastal provinces of Esmeraldas (upper left), Manabí (upper right), Guayas (lower left) and El Oro (lower right). Source: http://www.corpecuador.org/obras.htm.
vii) Impact on the health of the coastal populations
In Ecuador several diseases have been associated with ENSO periods: V. cholerae,
Campylobacter, C. botulinum, E. coli, Salmonella, Shigella, Hepatitis A, Malaria,
Dengue, Leptospirosis, Leishmaniasis, Encephalitis, among others.
Cholera appeared in the Americas in January 1991 and until 1997 there were over 1.3
million cases and more than 12 thousands dead. The maximum dispersion period

33
occurred during the 1997-98ENSO, especially at the coastal communities. Several
disease outbreaks coincide with climate variability, flooding, socio-political problems
such as migration of displaced people or refugees towards areas of major economical
development and lack of sanitation. The list includes: Malaria and Dengue (in the
eighties and nineties), Dengue 3, an increase in Hemorragic Dengue, and the
appearance of a new vector, Aedes albopictus,.
The most frequent pathologies related to some climatic events are listed below in
table 4.3. There were 4 big epidemic problems during the last ENSO (1997-98):
cholera, leptospirosis, dengue and malaria, which were enhanced by ENSO. The
number of cases is depicted in table 4.4, at the coastal provinces. In table 4.5 we
have the number of cholera cases during the 1991 and 1997-98 ENSO events for
comparison. Notice that the cholera cases during the 1991-92 ENSO were higher
than those of the 1997-98 one, so the magnitude of an event is not an indication of its
impact upon a disease.
Table 4.3 Most frequent pathologies related to climatic events (from UNEP/NCAR EL NIÑO, 2000)
AREA DISEASES/ HEALTH PROBLEMS FLOODING • Acute respiratory infections
• Acute diarrheic diseases • Vector-borne diseases: dengue, malaria, equine encephalitis,
leishmaniasis • Water-borne diseases: cholera, salmonelosis, shigellosis, viral hepatitis,
parasitism, leptospirosis • Dermis diseases: sarna, bacterial infections and mycosis • Snake bites • drowning
DROUGHT • Vector borne diseases • Dermis diseases • Dehydration • Risk due to high temperature • Sun burnt • Secondary effects: cardiovascular and respiratory ones
MUDSLIDES • Suffocation • Multiple traumatisms
COASTAL AREAS • Paralytic food poisoning from eating seafood (red tides)

34
Table 4.4 Diseases in coastal provinces attributed to the 1997-98 ENSO (number of cases registered) (from UNEP/NCAR EL NIÑO, 2000)
PROVINCE/ DISEASES CHOLERA DENGUE MALARIA LEPTOSPIROSIS4
GUAYAS 144 231 332 MANABÍ 489 1285 1002 139 ESMERALDAS 1 1285 2077 EL ORO 129 714 2867 1
One of the reasons for this dramatic decrease could be the Contingency Plan of the
Public Health Ministry for prevention of epidemiological diseases such as malaria,
cholera, dengue and leptospirosis implemented during the 1997-98 event. It is not
possible to disaggregate the data into each of the coastal settlement for two reasons:
firstable, some people go for treatment to the nearest health center which maybe in
one location; and secondly, others go to private doctors who don’t have an obligation
to report any case.
Table 4.5 Cholera cases by province
PROVINCE ENSO 1997-98 ENSO 1991-92 Guayas 457 4585 El Oro 303 4278 Esmeraldas 12 4081 Manabí 383 1432
4.2 ENSO cold phase scenarios
ENSO cold phase scenarios are commonly known as La Niña events. It was assumed
during the past century that La Niña events were the opposite of ENSO events.
However, this is not the case. Cedeño et al (2006), show that the impact upon
precipitation in coastal Ecuador, below 1000m above sea level (the height the
influence of ENSO) is not the opposite of the El Niño warm phase during La Niña.
In general, for the fisheries sector the impacts of La Niña cold events are positive.
There is not sea level rise, hence there are not problems with coastal erosion. The
main impact is on the agricultural sector because of decrease in precipitation and in
the health of the population, because La Niña is associated with droughts. Table 4.3
35
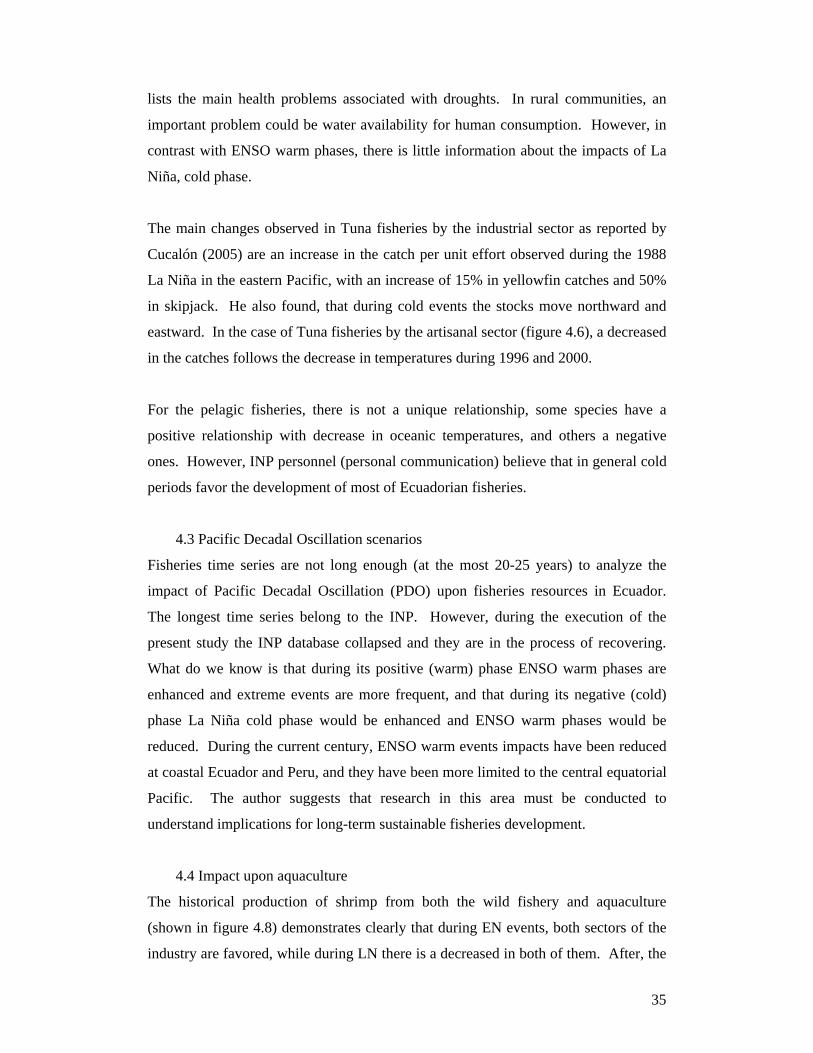
lists the main health problems associated with droughts. In rural communities, an
important problem could be water availability for human consumption. However, in
contrast with ENSO warm phases, there is little information about the impacts of La
Niña, cold phase.
The main changes observed in Tuna fisheries by the industrial sector as reported by
Cucalón (2005) are an increase in the catch per unit effort observed during the 1988
La Niña in the eastern Pacific, with an increase of 15% in yellowfin catches and 50%
in skipjack. He also found, that during cold events the stocks move northward and
eastward. In the case of Tuna fisheries by the artisanal sector (figure 4.6), a decreased
in the catches follows the decrease in temperatures during 1996 and 2000.
For the pelagic fisheries, there is not a unique relationship, some species have a
positive relationship with decrease in oceanic temperatures, and others a negative
ones. However, INP personnel (personal communication) believe that in general cold
periods favor the development of most of Ecuadorian fisheries.
4.3 Pacific Decadal Oscillation scenarios
Fisheries time series are not long enough (at the most 20-25 years) to analyze the
impact of Pacific Decadal Oscillation (PDO) upon fisheries resources in Ecuador.
The longest time series belong to the INP. However, during the execution of the
present study the INP database collapsed and they are in the process of recovering.
What do we know is that during its positive (warm) phase ENSO warm phases are
enhanced and extreme events are more frequent, and that during its negative (cold)
phase La Niña cold phase would be enhanced and ENSO warm phases would be
reduced. During the current century, ENSO warm events impacts have been reduced
at coastal Ecuador and Peru, and they have been more limited to the central equatorial
Pacific. The author suggests that research in this area must be conducted to
understand implications for long-term sustainable fisheries development.
4.4 Impact upon aquaculture
The historical production of shrimp from both the wild fishery and aquaculture
(shown in figure 4.8) demonstrates clearly that during EN events, both sectors of the
industry are favored, while during LN there is a decreased in both of them. After, the

36
2000 La Niña event, and the epidemic of the White Spot virus syndrome the shrimp
aquaculture sector almost collapse. Today, it is in the recovery process and the
shrimp culture practices have changed. Impacts of Climate change upon de
aquaculture sector would be analyzed during October 2007, in the IX Ecuadorian
Congress on Aquaculture, where the following topics would be discussed:
o Impact of changes in precipitation and temperature patterns upon culture zones
o Sea level rise impact upon infrastructure in shrimp ponds
o Problems with the tropicalization of the temperate zones and competition
o Availability of fish meal for feeds under different climate change scenarios
Figure 4.8 Ecuadorian shrimp production from wild fishery and aquaculture sectors.
Warmer water is obviously beneficial to shrimp growth, but may also be related to
improved survivals of shrimp in the wild due to a reduction in predation by fish
stocks, which tend to decline during EN events. Also, it has been observed in shrimp
ponds that mortality due to the white spot virus syndrome reduces under warmer than
normal conditions.

37
5 Potential Local adaptation responses at household, community and national
levels
The potential local adaptation responses at different levels would depend on the
sociopolitical stability and the cultural aspects of each region. In most communities
social capital (human resources and their interactions) is at a level such that
community actions could lead to better awareness and preparedness for El Niño
events and hence climate change.
In pre-Columbian Ecuador, local coastal settlements were able to cope with extreme
events. Albarradas, a U-shaped detention ponds, were build on semi-permeable soil to
turns excessive moisture during ENSO warm event years into advantage by
recharging the aquifer for dry years. Today, the albarradas are still in use in coastal
southern Ecuador. In 2005-2006, the World Bank funded a project on “Adaptation
Strategies to the Environmental and Socioeconomic Impacts of El Niño for Rural
Communities in Ecuador and Peru”. The results have not been published yet (a
internal report is available). Marcos and Cornejo (2006) conducted a series of
workshops for this project in coastal rural communities and found out that:
o Adaptation to climate extremes and hazards depends on local governance over
their own resources and that this may differ from one community to the next one.
o Some communities are better organized and hence better equipped to take actions
by themselves within their financial constraints. Any action or political decision is
discussed under an assembly meeting, where elder’s knowledge is paid
considerable heed. The main constrain of Communes is the lack of money
available for their projects.
Adaptation strategies have to be tailored to each community in the provinces,
depending on their main activities. Some of the proposed actions that resulted from
IPUR (2001) in terms of building, rebuilding and reinforcing infrastructure can also
be taking in account.
Responses from local and national government depend currently on the size of the
population affected and their ability to demand actions. If we look at table 1.1, and
compare the population size of Guayas province along with its schooling rate with

38
Esmeraldas province, it would be easier to understand why actions by local and
national government are faster in Guayas.
Since 2005, the Ministry of Environment, through the National Climate Commission
(CNC in Spanish), has been conducting workshops with the different stakeholders and
policy-makers (http://www.ambiente.gov.ec/WEB/Presentacion/FrameSet1.html) to
promote the development and adoption of adaptation strategies in different
socioeconomic sectors. During these workshops several adaptation measurements
have been proposed that could be applied to any of the coastal landing places. The
adaptation measurements proposed for the lower Guayas river basin and Gulf of
Guayaquil are:
• Coastal defenses
• Dikes on Daule and Babahoyo rivers
• Improvement of shrimp pond walls
• Mangrove forestation
• Ground level elevation through hydraulic backfill
• Drainage, irrigation and infrastructure projects
However, there is not any adaptation scheme proposed for either the industrial nor the
artisanal fisheries sectors that would help them cope with a change in the fisheries
dynamics. Some changes have already occurred, and only the industrial sector has
been able to change fisheries gear to adapt to current pelagic stock and scarcity
distribution. Once quantitative scenarios are developed, strategies for loans,
relocation and adaptation of the fisheries sector to climate change could be developed,
foster and implemented; as well as strategies for sustainable management of the
fisheries.
6 Conclusions
The main problem of evaluating the impact of climate change upon Ecuadorian
fisheries is that because of insufficient data and incomplete knowledge on the
behavior of the different fisheries, it is not possible to quantify them. This reduces
our ability to be efficient in promoting adaptation policies at the proper channels.

39
The CNC has established monitoring programs for physical variables (hydrological,
atmospheric and oceanic). PMRC has proposed and analyzed concrete scenarios for
2010 and 2030 that involved reinforcement of policies in coastal management and
planning. The CAF has identified the coastal populations, their vulnerability and
risks under ENSO conditions. However, we do not have specific scenarios for
climate change impact upon the fisheries sector and sub-sectors, neither a proposal for
adaptation measurements.
The scenarios presented here for extreme events, under the assumption that climate
change impacts would be similar, are incomplete. We need disaggregate information
for each of them, so we could determine the climate change impact at the household
level.
7 Recommendations
A program for monitoring physical variables has been set up by CNC-Ministry of
Environment. It involves the Ecuadorian National Meteorological and Hydrological
Service (INAMHI) as the task force coordinator, and other institutions such as the
Oceanographic Institute of the Navy (INOCAR).
INP has a database (under recovery) that covers more or less the period 1981 -2006.
Research on the different temporal and spatial scales of variability of the Ecuadorian
fisheries is lacking.
Several recommendations are in place:
o To determine spatial and temporal scales of variability of the fisheries per sector
(artisanal and industrial).
o To quantify the relationships between ENSO extreme events, and the PDO with
changes in the fisheries
o To include climate change impacts and adaptations within the coastal
management plans
o To evaluate the size of the labor force really involved with the fisheries sector,
and model their behavior under climate change impacts

40
Information to implement these recommendations is available but disperse. The
National Secretary of Science and Technology along with the support of the CNC
could foster the submission of research proposals that aim at implementing the
recommendations. The Ministry of Agriculture and Fisheries must play an important
role along with the Ministry of Environment in using this information for policy
implementation.
There are few legal instruments for promoting and enforcing adaptation to climate
change. These instruments are more related to clean energies, the production of
biofuels, sequestration of carbon, and sustainable use of water. In spite of the size of
the coastal line, Ecuadorian government has seldom looked at the sea. Little is known
about our marine biodiversity and hence what problems could climate change
generate in the fisheries. Current changes in the structure of the governmental
fisheries sector, its inclusion under the Ministry of Agriculture, and the revision of the
mission of the INP are opportunities to develop adequate legal instruments.
Any adaptation plan has to be thought as a business plan that is going to work under
the umbrella of sustainable development. Otherwise, the plans would lie down in a
library waiting for their implementation
Finally to implement successful adaptation responses, they have to be worked with
the stakeholders and other major players, cultural and socioeconomic aspects must be
part of the implementation and a clear State Policy on climate change must be
supported and enforced.

41
REFERENCES
2001 Ecuadorian Population Census, www.inec.gov.ec
Cáceres, 2001. Comunicación Nacional. República del Ecuador. Cambio Climático.
Comité Nacional del Clima. Ministerio del Ambiente.
CAF, 2000. Las lecciones aprendidas de El Niño, Memorias del fenómeno de El
Niño 1997-98. Retos y propuestas para la región andina. Vol IV:
Ecuador. ISBN 980-340-174-2
Cedeño J., De la Cuadra T., Abata K., Merizalde M., Cornejo-Grunauer M.P., 2006.
Diagnóstico de Probabilidades de Lluvias Asciados a Eventos del
Ciclo ENOS en la Costa de Ecuador. Climate Variability and Land
Cover Change-Hydrological Impacts (Procedings of the Fifth FRIEND
World Conference held at Havana, Cuba, November 2006. IAHS Publ.
308, 2006.
Cornejo, M.P. 2003. On The Processes That Control Sea Surface Temperature
Variability In The Eastern Tropical Pacific. Tesis Doctoral. RSMAS-
U. DE MIAMI
Cornejo-Rodriguez, M.P., and D.B. Enfield. Propagation and forcing of high-
frequency sea level variability along the west coast of South America.
Journal of Geophysical Research, 92(C13):14,323-14,334 1987
Cucalon-Zenck, E., 2005. Atlas de la Pesquería de Atún del Océano Pacífico Oriental.
CIOP-ESPOL. Guayaquil-Ecuador, 130p. ISBN 9978-44-650-8
ECLAC, 1983. Los desastres naturales de 1982 – 1983 en Bolivia, Ecuador y Perú.
N.U. Consejo Económico y Social, 1983.
Ecuadorian Central Bank (www.bc.fin.ec).
Enfield, D.B., M.P. Cornejo-Rodriguez, R.L. Smith, and P.M. Newberger. The
equatorial source of propagating variability along the Peru coast during
the 1982-1983 El Niño. Journal of Geophysical Research,
92(C13):14,335-14,346 1987
FAO, http://www.fao.org/fi/fcp/es/ECU/BODY.HTM
Hoozemans, F.M.J., M. Marchand, and H.A. Pennekamp. 1993. Sea Level Rise: A
Global Vulnerability Assessment — Vulnerability Assessments for

42
Population, Coastal Wetlands and Rice Production on a Global Scale.
Second revised edition, Delft Hydraulics and Rijkswaterstaat, Delft
and The Hague, The Netherlands, xxiii+184 pp.
INP 2007, Meeting on Fisheries Research and Monitoring. CD information
IPUR-Catholic University, 2001. Plan Participativo de obras a ejecutarse en sitios de
riesgos ante un posible Fenómeno “El Niño: 2001 -2002. For
COPEFEN and IDB.
Marcos J.G. and M.P. Cornejo ,2006. Internal Report on “Adaptation Strategies to the
Environmental and Socioeconomic Impacts of El Niño for Rural
Communities in Ecuador and Peru”. World Bank Project.
Marcos, J. G., 2004. Las Albarradas de la Costa del Ecuador: Rescate del
conocimiento ancestral del manejos sostenible de la biodiversidad,
CEAA-ESPOL, Guayaquil, Ecuador
Ochoa E. , S. Olsen and L. Arriaga, 2001 . MACROZONIFICACION DE LA ZONA
COSTERA CONTINENTAL. PMRC Publication.
UNEP/NCAR EL Niño Project Ecuador report, 2001 in “Once Burned, Twice Shy?.
Lessons learned from the 1997-98 El Niño. United Nations
University. Co-autora –Capítulo de Ecuador. Version en Cd e
impresa. UNUP-1063. ISBN 92-808-1063-4