Human demographic history impacts genetic risk prediction … · 9 2 Medical and Population...
46
1 Human demographic history impacts genetic risk prediction across diverse 1 populations 2 3 Alicia R. Martin 1,2,3 , Christopher R. Gignoux 3 , Raymond K. Walters 1,2 , Genevieve L. 4 Wojcik 3 , Benjamin M. Neale 1,2 , Simon Gravel 4 , Mark J. Daly 1,2 , Carlos D. Bustamante 3 , 5 Eimear E. Kenny 5 6 1 Analytic and Translational Genetics Unit, Massachusetts General Hospital, Boston, 7 MA 02114 8 2 Medical and Population Genetics, Broad Institute of Harvard and the Massachusetts 9 Institute of Technology, Cambridge, MA USA 10 3 Department of Genetics, Stanford University, Stanford, CA 94305, USA 11 4 Department of Human Genetics, McGill University, Montreal, Quebec, Canada 12 5 Department of Genetics and Genomic Sciences, Mt. Sinai School of Medicine, New 13 York, NY, USA 14 Corresponding author: [email protected] 15 16 Abstract (250 words) 17 18 The vast majority of genome-wide association studies are performed in Europeans, and 19 their transferability to other populations is dependent on many factors (e.g. linkage 20 disequilibrium, allele frequencies, genetic architecture). As medical genomics studies 21 become increasingly large and diverse, gaining insights into population history and 22 consequently the transferability of disease risk measurement is critical. Here, we 23 . CC-BY-NC 4.0 International license peer-reviewed) is the author/funder. It is made available under a The copyright holder for this preprint (which was not . http://dx.doi.org/10.1101/070797 doi: bioRxiv preprint first posted online Aug. 23, 2016;
Transcript of Human demographic history impacts genetic risk prediction … · 9 2 Medical and Population...
1
Human demographic history impacts genetic risk prediction across diverse 1
populations 2
3
Alicia R. Martin1,2,3, Christopher R. Gignoux3, Raymond K. Walters1,2, Genevieve L. 4
Wojcik3, Benjamin M. Neale1,2, Simon Gravel4, Mark J. Daly1,2, Carlos D. Bustamante3, 5
Eimear E. Kenny5 6
1 Analytic and Translational Genetics Unit, Massachusetts General Hospital, Boston, 7
MA 02114 8
2 Medical and Population Genetics, Broad Institute of Harvard and the Massachusetts 9
Institute of Technology, Cambridge, MA USA 10
3 Department of Genetics, Stanford University, Stanford, CA 94305, USA 11
4 Department of Human Genetics, McGill University, Montreal, Quebec, Canada 12
5 Department of Genetics and Genomic Sciences, Mt. Sinai School of Medicine, New 13
York, NY, USA 14
Corresponding author: [email protected] 15
16
Abstract (250 words) 17
18
The vast majority of genome-wide association studies are performed in Europeans, and 19
their transferability to other populations is dependent on many factors (e.g. linkage 20
disequilibrium, allele frequencies, genetic architecture). As medical genomics studies 21
become increasingly large and diverse, gaining insights into population history and 22
consequently the transferability of disease risk measurement is critical. Here, we 23
. CC-BY-NC 4.0 International licensepeer-reviewed) is the author/funder. It is made available under aThe copyright holder for this preprint (which was not. http://dx.doi.org/10.1101/070797doi: bioRxiv preprint first posted online Aug. 23, 2016;
2
disentangle recent population history in the widely-used 1000 Genomes Project 24
reference panel, with an emphasis on populations underrepresented in medical studies. 25
To examine the transferability of single-ancestry GWAS, we used published summary 26
statistics to calculate polygenic risk scores for six well-studied traits and diseases. We 27
identified directional inconsistencies in all scores; for example, height is predicted to 28
decrease with genetic distance from Europeans, despite robust anthropological 29
evidence that West Africans are as tall as Europeans on average. To gain deeper 30
quantitative insights into GWAS transferability, we developed a complex trait 31
coalescent-based simulation framework considering effects of polygenicity, causal allele 32
frequency divergence, and heritability. As expected, correlations between true and 33
inferred risk were typically highest in the population from which summary statistics were 34
derived. We demonstrated that scores inferred from European GWAS were biased by 35
genetic drift in other populations even when choosing the same causal variants, and 36
that biases in any direction were possible and unpredictable. This work cautions that 37
summarizing findings from large-scale GWAS may have limited portability to other 38
populations using standard approaches, and highlights the need for generalized risk 39
prediction methods and the inclusion of more diverse individuals in medical genomics. 40
41
Introduction 42
43
The majority of genome-wide association studies (GWAS) have been performed in 44
populations of European descent1-4. An open question in medical genomics is the 45
degree to which these results transfer to new populations. GWAS have yielded tens of 46
. CC-BY-NC 4.0 International licensepeer-reviewed) is the author/funder. It is made available under aThe copyright holder for this preprint (which was not. http://dx.doi.org/10.1101/070797doi: bioRxiv preprint first posted online Aug. 23, 2016;
3
thousands of common genetic variants significantly associated with human medical and 47
evolutionary phenotypes, most of which have replicated in other ethnic groups5-8. 48
However, GWAS are optimally powered to discover common variant associations, and 49
the European bias in GWAS results in associated SNPs with higher minor allele 50
frequencies on average compared to other populations. The predictive power of GWAS 51
findings in non-Europeans are therefore limited by population differences in allele 52
frequencies and linkage disequilibrium structure. 53
54
As GWAS sample sizes grow to hundreds of thousands of samples, they also become 55
better powered to detect rare variant associations9-11. Large-scale sequencing studies 56
have demonstrated that rare variants show stronger geographic clustering than 57
common variants12-14. Rare, disease-associated variants are therefore expected to track 58
with recent population demography and/or be population restricted13,15-17. As the next 59
era of GWAS expands to evaluate the disease-associated role of rare variants, it is not 60
only scientifically imperative to include multi-ethnic populations, it is also likely that such 61
studies will encounter increasing genetic heterogeneity in very large study populations. 62
A comprehensive understanding of the genetic diversity and demographic history of 63
multi-ethnic populations is critical for appropriate applications of GWAS, and ultimately 64
for ensuring that genetics does not contribute to or enhance health disparities4. 65
66
The most recent release of the 1000 Genomes Project (phase 3) provides one of the 67
largest global reference panels of whole genome sequencing data, enabling a broad 68
survey of human genetic variation18. The depth and breadth of diversity queried 69
. CC-BY-NC 4.0 International licensepeer-reviewed) is the author/funder. It is made available under aThe copyright holder for this preprint (which was not. http://dx.doi.org/10.1101/070797doi: bioRxiv preprint first posted online Aug. 23, 2016;
4
facilitates a deep understanding of the evolutionary forces (e.g. selection and drift) 70
shaping existing genetic variation in present-day populations that contribute to 71
adaptation and disease19-25. Studies of admixed populations have been particularly 72
fruitful in identifying genetic adaptations and risk for diseases that are stratified across 73
diverged ancestral origins26-34. Admixture patterns became especially complex during 74
the peopling of the Americas, with extensive recent admixture spanning multiple 75
continents. Processes shaping structure in these admixed populations include sex-76
biased migration and admixture, isolation-by-distance, differential drift in mainland 77
versus island populations, and variable admixture timing13,35,36. 78
79
Standard GWAS strategies approach population structure as a nuisance factor. A 80
typical step-wise procedure first detects dimensions of global population structure in 81
each individual, using principal component analysis (PCA) or other methods37-40, and 82
often excludes “outlier” individuals from the analysis and/or corrects for inflation arising 83
from population structure in the statistical model for association. Such strategies reduce 84
false positives in test statistics, but can also reduce power for association in 85
heterogeneous populations, and are less likely to work for rare variant association41-44. 86
Recent methodological advances have leveraged patterns of global and local ancestry 87
for improved association power30,45,46, fine-mapping47 and genome assembly48. At the 88
same time, population genetic studies have demonstrated the presence of fine-scale 89
sub-continental structure in the African, Native American, and European components of 90
populations from the Americas49-52. If trait-associated variants follow the same patterns 91
. CC-BY-NC 4.0 International licensepeer-reviewed) is the author/funder. It is made available under aThe copyright holder for this preprint (which was not. http://dx.doi.org/10.1101/070797doi: bioRxiv preprint first posted online Aug. 23, 2016;
5
of demography, then we expect that modeling sub-continental ancestry may enable 92
their improved detection in admixed populations. 93
94
In this study, we explore the impact of population diversity on the landscape of variation 95
underlying human traits. We infer demographic history for the global populations in the 96
1000 Genomes Project, focusing particularly on admixed populations from the 97
Americas, which are under represented in medical genetic studies4. We disentangle 98
local ancestry to infer the ancestral origins of these populations. We link this work to 99
ongoing efforts to improve study design and disease variant discovery by quantifying 100
biases in clinical databases and GWAS in diverse and admixed populations. These 101
biases have a striking impact on genetic risk prediction; for example, a previous study 102
calculated polygenic risk scores for schizophrenia in East Asians and Africans based on 103
GWAS summary statistics derived from a European cohort, and found that prediction 104
accuracy was reduced by more than 50% in non-European populations53. To 105
disentangle the role of demography on polygenic risk prediction derived from single-106
ancestry GWAS, we designed a novel coalescent-based simulation framework reflecting 107
modern human population history and show that polygenic risk scores derived from 108
European GWAS are biased when applied to diverged populations. Specifically, we 109
identify reduced variance in risk prediction with increasing divergence from Europe 110
reflecting decreased overall variance explained, and demonstrate that an enrichment of 111
low frequency risk and high frequency protective alleles contribute to an overall 112
protective shift in European inferred risk on average across traits. Our results highlight 113
. CC-BY-NC 4.0 International licensepeer-reviewed) is the author/funder. It is made available under aThe copyright holder for this preprint (which was not. http://dx.doi.org/10.1101/070797doi: bioRxiv preprint first posted online Aug. 23, 2016;
6
the need for the inclusion of more diverse populations in GWAS as well as genetic risk 114
prediction methods improving transferability across populations. 115
116
Material and Methods 117
Ancestry deconvolution 118
We used the phased haplotypes from the 1000 Genomes consortium. We phased 119
reference haplotypes from 43 Native American samples from54 inferred to have > 0.99 120
Native ancestry in ADMIXTURE using SHAPEIT2 (v2.r778)55, then merged the 121
haplotypes using scripts made publicly available. These combined phased haplotypes 122
were used as input to the PopPhased version of RFMix v1.5.456 with the following flags: 123
-w 0.2, -e 1, -n 5, --use-reference-panels-in-EM, --forward-backward. The node size of 5 124
was selected to reduce bias in random forests resulting from unbalanced reference 125
panel sizes (AFR panel N=504, EUR panel N=503, and NAT panel N=43). We used the 126
default minimum window size of 0.2 cM to enable model comparisons with previously 127
inferred models using Tracts57. We used 1 EM iteration to improve the local ancestry 128
calls without substantially increasing computational complexity. We used the reference 129
panel in the EM to take better advantage of the Native American ancestry tracts from 130
the Hispanic/Latinos in the EM given the small NAT reference panel. We set the LWK, 131
MSL, GWD, YRI, and ESN as reference African populations, the CEU, GBR, FIN, IBS, 132
and TSI as reference European populations, and the samples from Mao et al54 with 133
inferred > 0.99 Native ancestry as reference Native American populations, as 134
previously58. 135
136
. CC-BY-NC 4.0 International licensepeer-reviewed) is the author/funder. It is made available under aThe copyright holder for this preprint (which was not. http://dx.doi.org/10.1101/070797doi: bioRxiv preprint first posted online Aug. 23, 2016;
7
Ancestry-specific PCA 137
We performed ancestry-specific PCA, as described in35. The resulting matrix is not 138
necessarily orthogonalized, so we subsequently performed singular value 139
decomposition in python 2.7 using numpy. There were a small number of major outliers, 140
as seen previously35. There was one outlier (ASW individual NA20314) when analyzing 141
the African tracts, which was expected as this individual has no African ancestry. There 142
were 8 outliers (PUR HG00731, PUR HG00732, ACB HG01880, ACB HG01882, PEL 143
HG01944, ACB HG02497, ASW NA20320, ASW NA20321) when analyzing the 144
European tracts. Some of these individuals had minimal European ancestry, had South 145
or East Asian ancestry misclassified as European ancestry resulting from a limited 3-146
way ancestry reference panel, or were unexpected outliers. As described in the 147
PCAmask manual, a handful of major outliers sometimes occur. As AS-PCA is an 148
iterative procedure, we therefore removed the major outliers for each sub-continental 149
analysis and orthogonalized the matrix on this subset. 150
151
Tracts 152
The RFMix output was collapsed into haploid bed files, and “UNK” or unknown ancestry 153
was assigned where the posterior probability of a given ancestry was < 0.90. These 154
collapsed haploid tracts were used to infer admixture timings, quantities, and 155
proportions for the ACB and PEL (new to phase 3) using Tracts57. Because the ACB 156
have a very small proportion of Native American ancestry, we fit three 2-way models of 157
admixture, including one model of single- and two models of double-pulse admixture 158
events, using Tracts. In both of the double-pulse admixture models, the model includes 159
. CC-BY-NC 4.0 International licensepeer-reviewed) is the author/funder. It is made available under aThe copyright holder for this preprint (which was not. http://dx.doi.org/10.1101/070797doi: bioRxiv preprint first posted online Aug. 23, 2016;
8
an early mixture of African and European ancestry followed by another later pulse of 160
either European or African ancestry. We randomized starting parameters and fit each 161
model 100 times and compared the log-likelihoods of the model fits. The single-pulse 162
and double-pulse model with a second wave of African admixture provided the best fits 163
and reached similar log-likelihoods, with the latter showing a slight improvement in fit. 164
165
We next assessed the fit of 9 different models in Tracts for the PEL57, including several 166
two-pulse and three-pulse models. Ordering the populations as NAT, EUR, and AFR, 167
we tested the following models: ppp_ppp, ppp_pxp, ppp_xxp, ppx_xxp, ppx_xxp_ppx, 168
ppx_xxp_pxx, ppx_xxp_pxp, ppx_xxp_xpx, and ppx_xxp_xxp, where the order of each 169
letter corresponds with the order of populations given above, an underscore indicates a 170
distinct migration event with the first event corresponding with the most generations 171
before present, p corresponding with a pulse of the ordered ancestries, and x 172
corresponding with no input from the ordered ancestries. We tested all 9 models 173
preliminarily 3 times, and for all models that converged and were within the top 3 174
models, we subsequently fit each model with 100 starting parameters randomizations. 175
176
Imputation accuracy 177
Imputation accuracy was calculated using a leave-one-out internal validation approach. 178
Two array designs were compared for this analysis: Illumina OmniExpress and 179
Affymetrix Axiom World Array LAT. Sites from these array designs were subset from 180
chromosome 9 of the 1000 Genomes Project Phase 3 release for admixed populations. 181
. CC-BY-NC 4.0 International licensepeer-reviewed) is the author/funder. It is made available under aThe copyright holder for this preprint (which was not. http://dx.doi.org/10.1101/070797doi: bioRxiv preprint first posted online Aug. 23, 2016;
9
After fixing these sites, each individual was imputed using the rest of the dataset as a 182
reference panel. 183
184
Overall imputation accuracy was binned by minor allele frequency (0.5-1%, 1-2%, 2-3%, 185
3-4%, 4-5%, 5-10%, 10-20%, 20-30%, 30-40%, 40-50%) comparing the genotyped true 186
alleles to the imputed dosages. A second round of analyses stratified the imputation by 187
local ancestry diplotype, which was estimated as described earlier. Within each 188
ancestral diplotype (AFR_AFR, AFR_NAT, AFR_EUR, EUR_EUR, EUR_NAT, 189
NAT_NAT), imputation accuracy was again estimated within MAF bins. 190
191
Empirical polygenic risk score inferences 192
To compute polygenic risk scores in the 1000 Genomes samples using summary 193
statistics from previous GWAS, we first filtered to biallelic SNPs and removed 194
ambiguous AT/GC SNPs from the integrated 1000 Genome call set. To get relatively 195
independent associations taking LD into account when multiple significant p-value 196
associations are in the same region in a GWAS, we performed LD clumping in plink (--197
clump) for all variants with MAF ≥ 0.0159, which uses a greedy algorithm ordering SNPs 198
by p-value, then selectively removes SNPs within close proximity and LD in ascending 199
p-value order (i.e. starting with the most significant SNP). As a population cohort with 200
similar LD patterns to the study sets, we used European 1000 Genomes samples (CEU, 201
GBR, FIN, IBS, and TSI). To compute the polygenic risk scores, we considered all 202
SNPs with p-values ≤ 1e-2 in the GWAS study, a window size of 250 kb, and an R2 203
. CC-BY-NC 4.0 International licensepeer-reviewed) is the author/funder. It is made available under aThe copyright holder for this preprint (which was not. http://dx.doi.org/10.1101/070797doi: bioRxiv preprint first posted online Aug. 23, 2016;
10
threshold of 0.5 in Europeans to group SNPs. After obtaining the top clumped signals, 204
we computed scores using the --score flag in plink. 205
206
Polygenic risk score simulations 207
We simulated genotypes in a coalescent framework with msprime v0.4.060 for 208
chromosome 20 incorporating a recombination map of GRCh37 and an assumed 209
mutation rate of 2e-8 mutations / (base pair * generation). We used a demographic 210
model previously inferred using 1000 Genomes sequencing data13 to simulate 211
individuals that reflect European, East Asian, and African population histories. We focus 212
on these populations as the demography has previously been modeled and this avoids 213
the challenges of simulating the geographically heterogeneous52 and sex-biased 214
process of admixture in the Americas61. To imitate a GWAS with European sample bias 215
and evaluate polygenic risk scores in other populations, we simulated 200,000 216
European individuals, 200,000 East Asian, and 200,000 African individuals. Next, we 217
assigned “true” causal effect sizes to m evenly spaced alleles. Specifically, we randomly 218
assigned effect sizes as: 219
220
where the normal distribution is specified by the mean and standard deviation (as in 221
python’s numpy package). For all other non-causal sites, the effect size is zero. We 222
then define X as: 223
224
� ⇠ N(0,h2
m)
X =mX
i=1
gi�i
. CC-BY-NC 4.0 International licensepeer-reviewed) is the author/funder. It is made available under aThe copyright holder for this preprint (which was not. http://dx.doi.org/10.1101/070797doi: bioRxiv preprint first posted online Aug. 23, 2016;
11
where the gi are the genotype states (i.e. 0, 1, or 2). To handle varying allele 225
frequencies, potential weak LD between causal sites, ensure a neutral model with 226
random true polygenic risks with respect to allele frequencies, and to obtain the total 227
desired variance, we normalize X as: 228
229
We then compute the true polygenic risk score, as: 230
231
such that the total variance of the scores is h2. We also simulated environmental noise 232
and standardize to ensure equal variance between normalized genetic and 233
environmental effects before, defining the environmental effect E as: 234
235
such that the total variance of the environmental effect is 1 – h2. We then define the 236
total liability as: 237
238
We assigned 10,000 European individuals at the most extreme end of the liability 239
threshold “case” status assuming a prevalence of 5%. We randomly assigned 10,000 240
different European individuals “control” status. We ran a GWAS with these 10,000 241
European cases and 10,000 European controls, computing Fisher’s exact test for all 242
ZX =X � µX
�X
G =ph2 ⇤ ZX
✏ =N(0, 1� h2)
Z✏ =✏� µ✏
�✏
E =p
1� h2 ⇤ Z✏
L =ph2 ⇤ ZX +
p1� h2 ⇤ Z✏
=G+ E
. CC-BY-NC 4.0 International licensepeer-reviewed) is the author/funder. It is made available under aThe copyright holder for this preprint (which was not. http://dx.doi.org/10.1101/070797doi: bioRxiv preprint first posted online Aug. 23, 2016;
12
sites with MAF > 0.01. As before for empirical polygenic risk score calculations from real 243
GWAS summary statistics, we clumped these SNPs into LD blocks for all sites with p ≤ 244
1e-2, R2 ≥ 0.5 in Europeans, and within a window size of 250 kb. We used these SNPs 245
to compute inferred polygenic risk scores as before, summing the product of the log 246
odds ratio and genotype for the true polygenic risk in a cohort of 10,000 simulated 247
European, African, and East Asian individuals (all not included in the simulated GWAS). 248
We compared the true versus inferred polygenic risk scores for these individuals across 249
varying complexities (m = 200, 500, 1000) and heritabilites (h2 = 0.33, 0.50, 0.67). 250
251
Results 252
Genetic diversity within and between populations in the Americas 253
We first assessed the overall diversity at the global and sub-continental level of the 254
1000 Genomes Project (phase 3) populations18 using a likelihood model via 255
ADMIXTURE62 and PCA63 (Figure S1 and Figure S2). The six populations from the 256
Americas demonstrate considerable continental admixture, with genetic ancestry 257
primarily from Europe, Africa, and the Americas, recapitulating previously observed 258
population structure18. To quantify continental genetic diversity in these populations, we 259
repeated the analysis using YRI, CEU, and NAT samples54 as reference panels 260
(population labels and abbreviations in Table S1). We observed widely varying 261
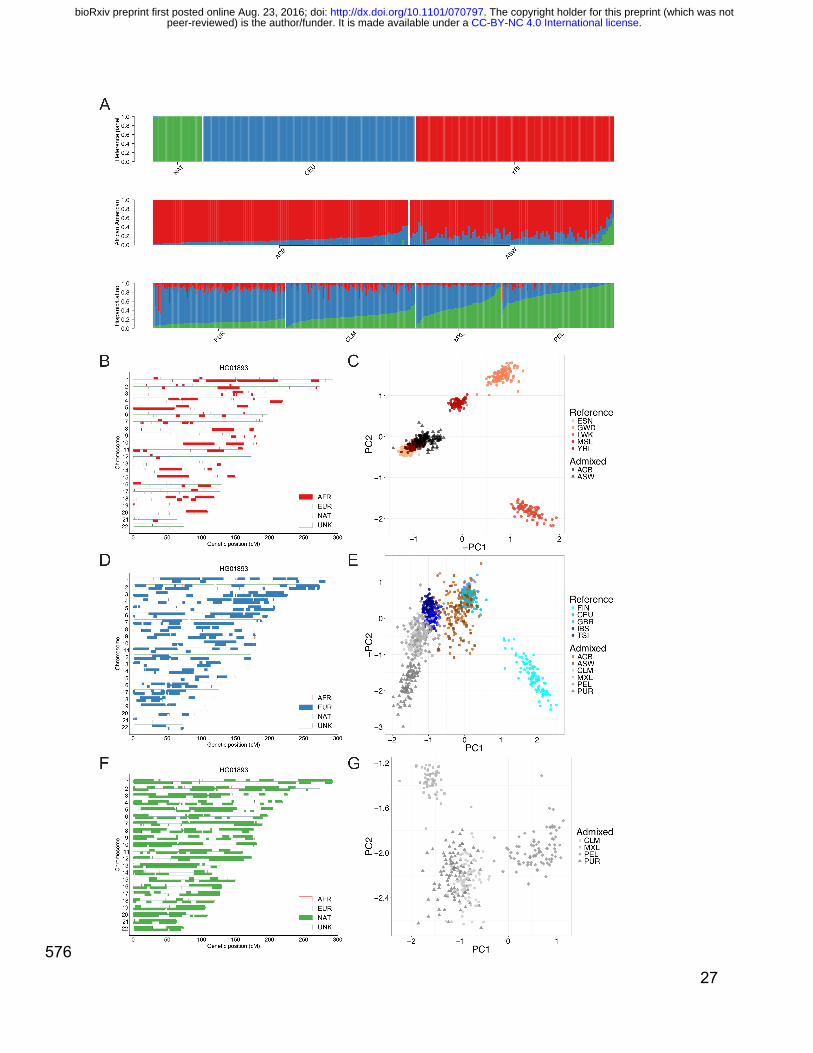
continental admixture contributions in the six populations from the Americas at K=3 262
(Figure 1A and Table S2). For example, when compared to the ASW, the ACB have a 263
higher proportion of African ancestry (μ = 0.88, 95% CI = [0.87-0.89] versus μ = 0.76, 264
95% CI = [0.73-0.78]; two-sided t-test p=3.0e-13) and a smaller proportion of EUR and 265
. CC-BY-NC 4.0 International licensepeer-reviewed) is the author/funder. It is made available under aThe copyright holder for this preprint (which was not. http://dx.doi.org/10.1101/070797doi: bioRxiv preprint first posted online Aug. 23, 2016;
13
NAT ancestry. The PEL have more NAT ancestry than all of the other AMR populations 266
(μ = 0.77, 95% CI = [0.75-0.80] versus CLM: μ = 0.26, 95% CI = [0.24, 0.27], p=2.9e-95; 267
PUR: μ = 0.13, 95% CI = [0.12, 0.13], p=4.8e-93; and MXL: μ = 0.47, 95% CI = [0.43, 268
0.50], p=1.7e-28) ascertained in 1000 Genomes. 269
270
We explored the origin of the subcontinental-level ancestry from recently admixed 271
individuals by identifying local ancestry tracts29,35,56,64 (Methods, Figure S3). As proxy 272
source populations for the recent admixture, we used EUR and AFR continental 273
samples from the 1000 Genomes Project as well as NAT samples genotyped 274
previously54. Concordance between global ancestry estimates inferred using 275
ADMIXTURE at K=5 and RFMix was typically high (Pearson’s correlation ≥ 98%, see 276
Figure S4). Using Tracts57, we modeled the length distribution of the AFR, EUR, and 277
NAT tracts to infer that admixing began ~12 and ~8 generations ago in the PEL and 278
ACB populations, respectively (Figure S5), consistent with previous estimates from 279
other populations from the Americas49,57,65. 280
281
We further investigated the subcontinental ancestry of admixed populations from the 282
Americas one ancestry at a time using a version of PCA modified to handle highly 283
masked data (ancestry-specific or AS-PCA) as implemented in PCAmask66. Example 284
ancestry tracts in a PEL individual subset to AFR, EUR, and NAT components are 285
shown in Figure 1B, D, and F, respectively. Consistent with previous observations, the 286
inferred European tracts in Hispanic/Latino populations most closely resemble southern 287
European IBS and TSI populations with some additional drift35 (Figure 1E). The 288
. CC-BY-NC 4.0 International licensepeer-reviewed) is the author/funder. It is made available under aThe copyright holder for this preprint (which was not. http://dx.doi.org/10.1101/070797doi: bioRxiv preprint first posted online Aug. 23, 2016;
14
European tracts of the PUR are more differentiated compared to the CLM, MXL, and 289
PEL populations, consistent with sex bias (Figure S6 and Table S3) and excess drift 290
from founder effects in this island population35. In contrast to the southern European 291
tracts from the Hispanic/Latino populations, the African descent populations in the 292
Americas have European admixture that more closely resembles the northwestern CEU 293
and GBR European populations. The clusters are less distinct, owing to lower overall 294
fractions of European ancestry, however the European components of the 295
Hispanic/Latino and African American populations are significantly different (Wilcoxan 296
rank sum test p=2.4e-60). 297
298
The ability to localize aggregated ancestral genomic tracts enables insights into the 299
evolutionary origins of admixed populations. To disentangle whether the considerable 300
Native American ancestry in the ASW individuals arose from recent admixture with 301
Hispanic/Latino individuals or recent admixture with indigenous Native American 302
populations, we queried the European tracts. We find that the European tracts of all 303
ASW individuals with considerable Native American ancestry are well within the ASW 304
cluster and project closer in Euclidean distance with AS-PC1 and AS-PC2 to 305
northwestern Europe than the European tracts from Hispanic/Latino samples (p=1.15e-306
3), providing support for the latter hypothesis and providing regional nuance to previous 307
findings49. 308
309
We also investigated the African origin of the admixed AFR/AMR populations (ACB and 310
ASW), as well as the Native American origin of the Hispanic/Latino populations (CLM, 311
. CC-BY-NC 4.0 International licensepeer-reviewed) is the author/funder. It is made available under aThe copyright holder for this preprint (which was not. http://dx.doi.org/10.1101/070797doi: bioRxiv preprint first posted online Aug. 23, 2016;
15
MXL, PEL, and PUR). The African tracts of ancestry from the AFR/AMR populations 312
project closer to the YRI and ESN of Nigeria than the GWD, MSL, and LWK populations 313
(Figure 1C). This is consistent with slave records and previous genome-wide analyses 314
of African Americans indicating that most sharing occurred in West and West-Central 315
Africa67-69. There are subtle differences between the African origins of the ACB and 316
ASW populations (e.g. difference in distance from YRI on AS-PC1 and AS-PC2 p=6.4e-317
6), likely due either to mild island founder effects in the ACB samples or differences in 318
African source populations for enslaved Africans who remained in Barbados versus 319
those who were brought to the US. The Native tracts of ancestry from the AMR 320
populations first separate the southernmost PEL populations from the CLM, MXL, and 321
PUR on AS-PC1, then separate the northernmost MXL from the CLM and PUR on AS-322
PC2, consistent with a north-south cline of divergence among indigenous Native 323
American ancestry (Figure 1G). 35,70 324
325
Impact of continental and sub-continental diversity on disease variant mapping 326
To investigate the role of ancestry in phenotype interpretation from genetic data, we 327
assessed diversity across populations and local ancestries for recently admixed 328
populations across the whole genome and sites from two reference databases: the 329
GWAS catalog and ClinVar pathogenic and likely pathogenic sites. We recapitulate 330
results showing that there is less variation across the genome (both genome-wide and 331
on the Affymetrix 6.0 GWAS array sites used in local ancestry calling) in out-of-Africa 332
versus African populations, but that GWAS variants are more polymorphic in European 333
and Hispanic/Latino populations (Figure S7A-B, Figure S8A-B). We use a normalized 334
. CC-BY-NC 4.0 International licensepeer-reviewed) is the author/funder. It is made available under aThe copyright holder for this preprint (which was not. http://dx.doi.org/10.1101/070797doi: bioRxiv preprint first posted online Aug. 23, 2016;
16
measure of the minor allele frequency, an indicator of the amount of diversity captured 335
in a population, to obtain a background coverage of each population, as done previously 336
(e.g. Figure S4 from phase 3 of the 1000 Genomes Project18). We show that the 337
Affymetrix 6.0 array has a slight European bias (Figure S5A and Figure S6A). We 338
compared the site frequency spectrum of variants across the genome versus at GWAS 339
catalog sites, and identify elevated allele frequencies at GWAS catalog loci, particularly 340
in populations with more European ancestry (e.g. the EUR, AMR, and SAS super 341
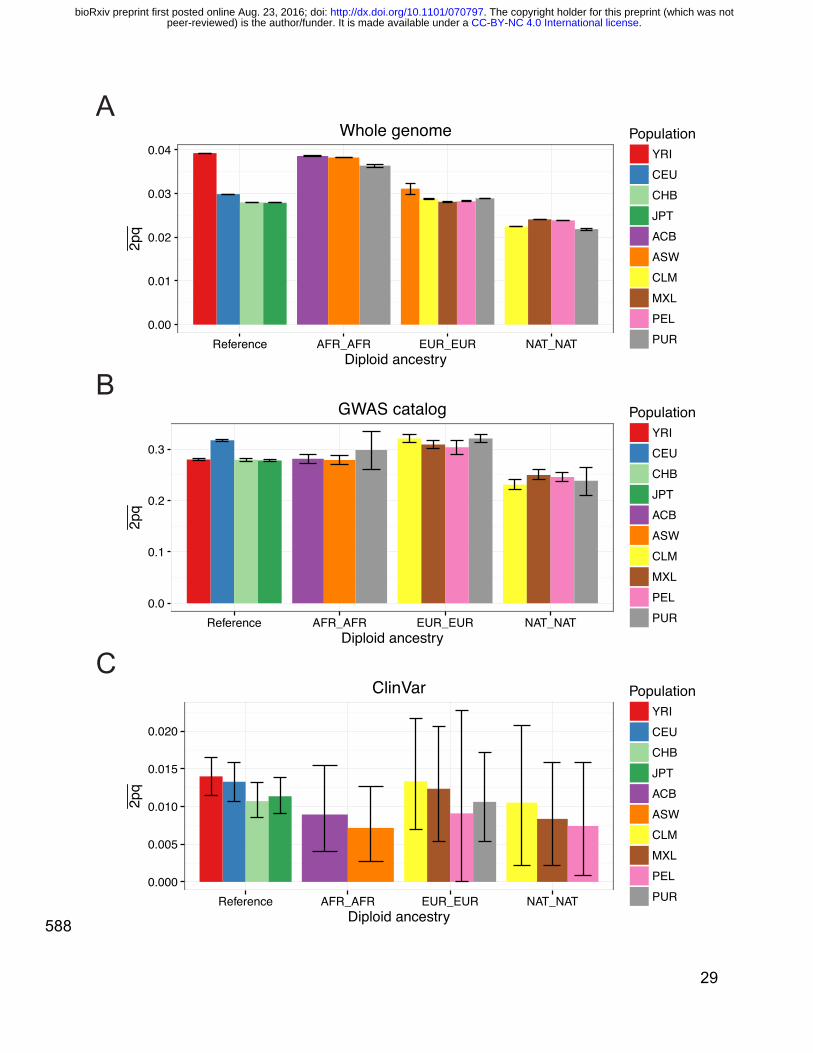
populations, Figure S5C-D). We further compared heterozygosity (estimated here as 342
2pq) and the site frequency spectrum in recently admixed populations across diploid 343
and haploid local ancestry tracts, respectively. Sites in the GWAS catalog and ClinVar 344
are more and less common than genome-wide variants, respectively (Figure 2). 345
Whereas heterozygosity across the whole genome is highest in African ancestry tracts, 346
it is consistently the greatest in European ancestry tracts across these databases 347
(Figure 2 and Figure S8C-D), reflecting a strong bias towards European study 348
participants1-4,18,71. These results highlight imbalances in genome interpretability across 349
local ancestry tracts in recently admixed populations and the utility of analyzing these 350
variants jointly with these ancestry tracts over genome-wide ancestry estimates alone. 351
352
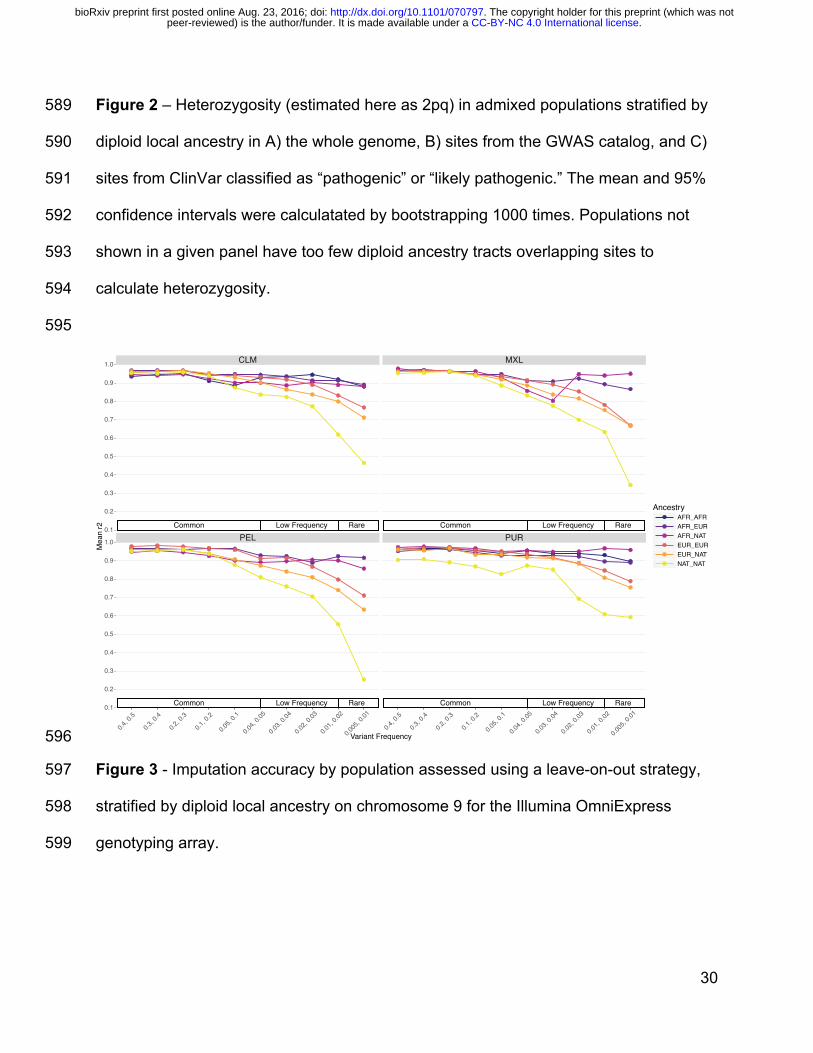
We also assessed imputation accuracy across the 3-way admixed populations from the 353
Americas (CLM, MXL, PEL, PUR) for two arrays: the Illumina OmniExpress and the 354
Affymetrix Axiom World Array LAT. Imputation accuracy was estimated as the 355
correlation (r2) between the original genotypes and the imputed dosages. For both array 356
designs, imputation accuracy across all minor allele frequency (MAF) bins was highest 357
. CC-BY-NC 4.0 International licensepeer-reviewed) is the author/funder. It is made available under aThe copyright holder for this preprint (which was not. http://dx.doi.org/10.1101/070797doi: bioRxiv preprint first posted online Aug. 23, 2016;
17
for populations with the largest proportion of European ancestry (PUR) and lowest for 358
populations with the largest proportion of Native American ancestry (PEL, Figure S9A-359
B). We also stratified imputation accuracy by local ancestry tract diplotype within the 360
Americas. Consistently, tracts with at least one Native American ancestry tract had 361
lower imputation accuracy when compared to tracts with only European and/or African 362
ancestry (Figure 3 and Figure S10). 363
364
Transferability of GWAS findings across populations 365
To quantify the transferability of European-biased genetic studies to other populations, 366
we next used published GWAS summary statistics to infer polygenic risk scores72 367
across populations for well-studied traits, including height9, waist-hip ratio73, 368
schizophrenia10, type II diabetes74,75, and asthma76 (Figure 4A-D, Figure S11, 369
Methods). Most of these summary statistics are derived from studies with primarily 370
European cohorts, although GWAS of type II diabetes have been performed in both 371
European-specific cohorts as well as across multi-ethnic cohorts. We identify clear 372
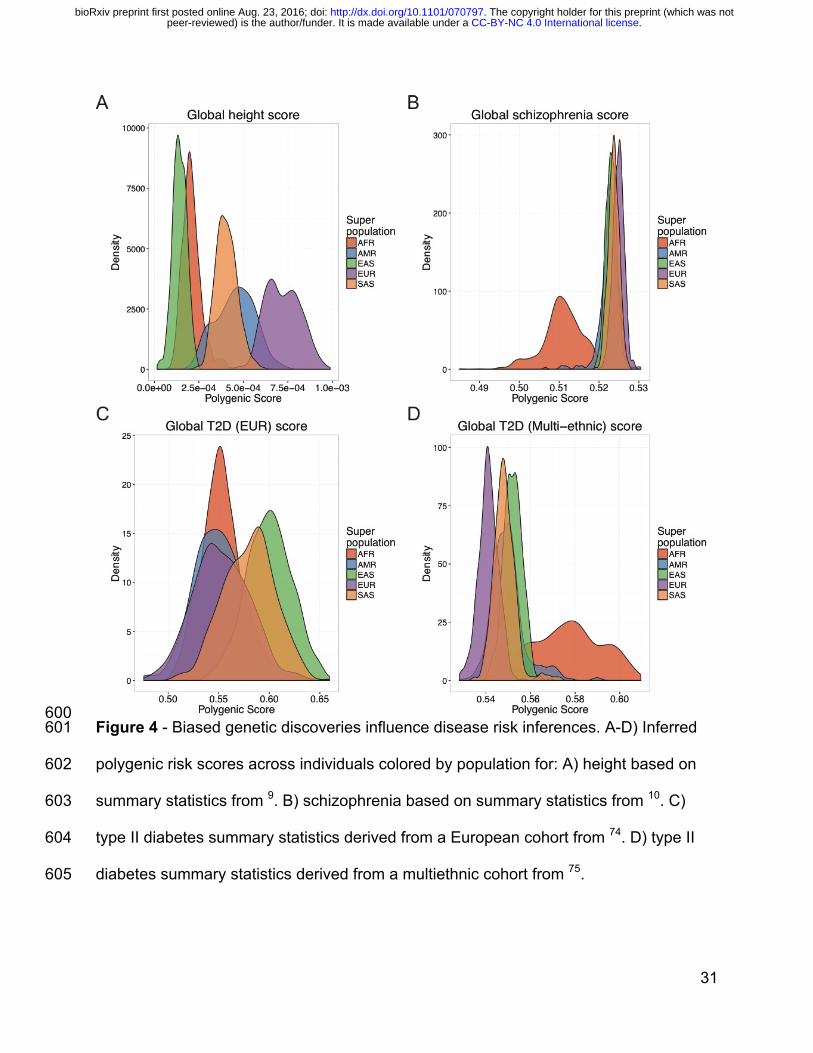
directional inconsistencies in these score inferences. For example, although the height 373
summary statistics show the expected cline of southern/northern cline of increasing 374
European height (FIN, CEU, and GBR populations have significantly higher polygenic 375
risk scores than IBS and TSI, p=1.5e-75, Figure S9A), polygenic scores for height 376
across super populations show biased predictions. For example, the African populations 377
sampled are genetically predicted to be considerably shorter than all Europeans and 378
minimally taller than East Asians (Figure 4A), which contradicts empirical observations 379
(with the exception of some indigenous pygmy/pygmoid populations)77,78. Additionally, 380
. CC-BY-NC 4.0 International licensepeer-reviewed) is the author/funder. It is made available under aThe copyright holder for this preprint (which was not. http://dx.doi.org/10.1101/070797doi: bioRxiv preprint first posted online Aug. 23, 2016;
18
polygenic risk scores for schizophrenia, while at a similar prevalence across populations 381
where it has been well-studied79 and sharing significant genetic risk across 382
populations80, shows considerably decreased scores in Africans compared to all other 383
populations (Figure 4B). Lastly, the relative order of polygenic risk scores computed for 384
type II diabetes across populations differs depending on whether the summary statistics 385
are derived from a European-specific (Figure 4C) or multi-ethnic (Figure 4D) cohort. 386
387
Ancestry-specific biases in polygenic risk score estimates 388
We performed coalescent simulations to determine how GWAS signals discovered in 389
one ancestral case/control cohort (i.e. ‘single-ancestry’ GWAS) are expected to impact 390
polygenic risk score estimates in other populations under neutrality using summary 391
statistics (for details, see Methods). Briefly, we simulated variants according to a 392
previously published demographic model inferred from Africans, East Asians, and 393
Europeans13. We specified “causal” alleles and effect sizes randomly, such that each 394
causal variant has evolved neutrally and has a mean effect of zero with the standard 395
deviation equal to the global heritability divided by number of causal variants. We then 396
computed the true polygenic risk for each individual as the product of the estimated 397
effect sizes and genotypes, then standardized the scores across all individuals. We 398
calculated the total liability as the sum of the genetic and random environmental 399
contributions, then identified 10,000 European cases with the most extreme liabilities 400
and 10,000 other European controls. We then computed Fisher’s exact tests with this 401
European case-control cohort, then quantified inferred polygenic risk scores as the sum 402
. CC-BY-NC 4.0 International licensepeer-reviewed) is the author/funder. It is made available under aThe copyright holder for this preprint (which was not. http://dx.doi.org/10.1101/070797doi: bioRxiv preprint first posted online Aug. 23, 2016;
19
of the product of genotypes and log odds ratios for 10,000 samples per population not 403
included in the GWAS. 404
405
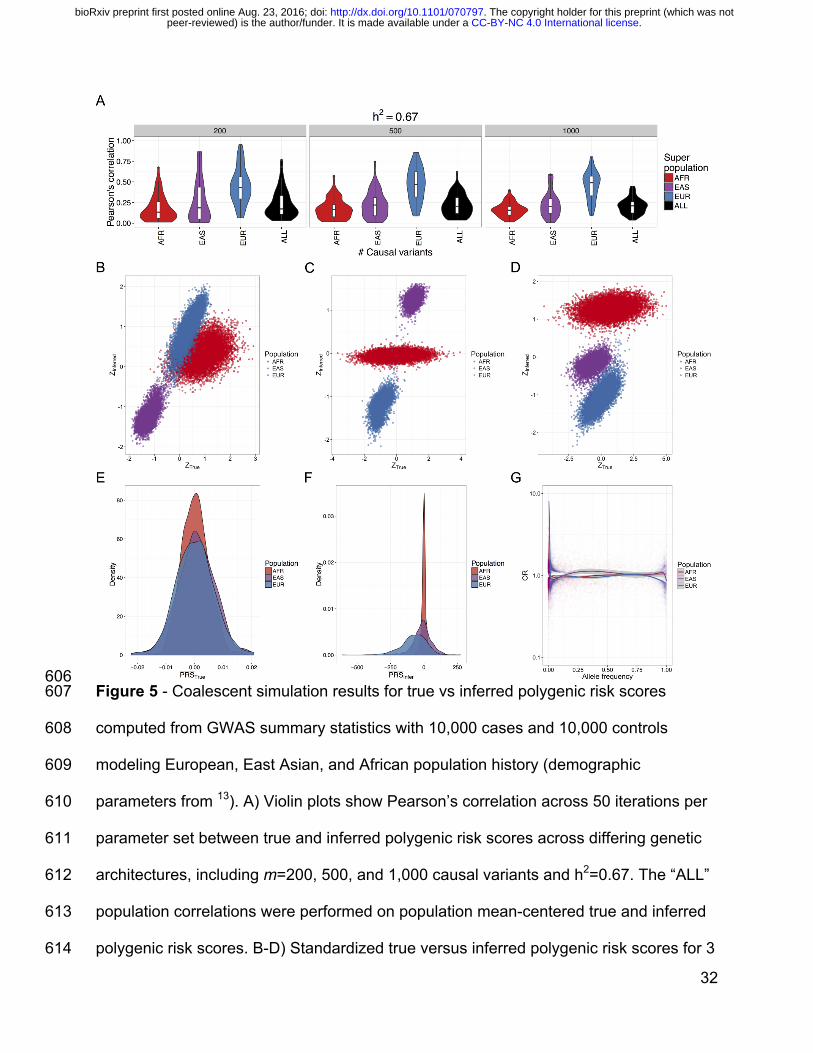
In our simulations and consistent with realistic coalescent models, most variants are 406
rare and population-specific; “causal” variants are sampled from the global site 407
frequency spectrum, resulting in subtle differences in true polygenic risk across 408
populations (Figure S12, Figure 5B-D). We mirrored standard practices for performing 409
a GWAS and computing polygenic risk scores (see above and Methods). We find that 410
the correlation between true and inferred polygenic risk is generally low (Figure 5A, 411
Figure S13), consistent with limited variance explained by polygenic risk scores from 412
GWAS of these cohort sizes for height (e.g. ~10% of variance explained for a cohort of 413
size 183,72781) and schizophrenia (e.g. ~7% variance explained for a cohort of size 414
36,989 cases and 113,075 controls10). Low correlations in our simulations are most 415
likely because common tag variants are a poor proxy for rare causal variants. As 416
expected, correlations between true and inferred risk within populations are typically 417
highest in the European population (i.e. the population in which variants were 418
discovered, Figure 5A and Figure S13). Across all populations, the mean Spearman 419
correlations between true and inferred polygenic risk increase with increasing heritability 420
while the standard deviation of these correlations significantly decreases (p=0.05); 421
however, there is considerable within-population heterogeneity resulting in high 422
variation in scores across all populations. We find that in these neutral simulations, a 423
polygenic risk score bias in essentially any direction is possible even when choosing the 424
exact same causal variants, heritability, and varying only fixed effect size (i.e. inferred 425
. CC-BY-NC 4.0 International licensepeer-reviewed) is the author/funder. It is made available under aThe copyright holder for this preprint (which was not. http://dx.doi.org/10.1101/070797doi: bioRxiv preprint first posted online Aug. 23, 2016;
20
polygenic risk in Europeans can be higher, lower, or intermediate compared to true risk 426
relative to East Asians or Africans, Figure S12, Figure 5B-D). 427
428
While causal variants in our simulations are drawn from the global site frequency 429
spectrum and are therefore mostly rare, inferred scores are derived specifically from 430
common variants that are typically much more common in the study population than 431
elsewhere (here Europeans with case/control MAF ≥ 0.01). Consequently, the 432
distribution of mean true polygenic risk across simulation runs for each population are 433
not significantly different (Figure 5E); however, inferred risk is considerably less than 434
zero in Europeans (p=1.9e-54, 95% CI=[-84.3, -67.4]), slightly less than zero in East 435
Asians (p=5.9e-5, 95% CI=[-19.1, -6.6]) and not significantly different from zero in 436
Africans, with variance in risk scores decreasing with this trend (Figure 5F). The scale 437
is orders of magnitude different between the true and inferred unstandardized scores, 438
cautioning that while they are informative on a relative scale (Figure 5A and Figure 439
S11), their absolute scale should not be overinterpreted. The inferred risk difference 440
between populations is driven by the increased power to detect minor risk alleles rather 441
than protective alleles in the study population82, given the differential selection of cases 442
and controls in the liability threshold model. We demonstrate this empirically in these 443
neutral simulations within the European population (Figure 5G), indicating that this 444
phenomenon occurs even in the absence of population structure and when case and 445
control cohort sizes are equal. 446
447
Discussion 448
. CC-BY-NC 4.0 International licensepeer-reviewed) is the author/funder. It is made available under aThe copyright holder for this preprint (which was not. http://dx.doi.org/10.1101/070797doi: bioRxiv preprint first posted online Aug. 23, 2016;
21
To date, GWAS have been performed opportunistically in primarily single-ancestry 449
European cohorts, and an open question remains about their biomedical relevance for 450
disease associations in other ancestries. As studies gain power by increasing sample 451
sizes, effect size estimates become more precise and novel associations at lower 452
frequencies are feasible. However, rare variants are largely population-private, and their 453
effects are unlikely to transfer to new populations. Because linkage disequilibrium and 454
allele frequencies vary across ancestries, effect size estimates from diverse cohorts are 455
typically more precise than from single-ancestry cohorts (and often tempered)5, and the 456
resolution of causal variant fine-mapping is considerably improved75. Across a range of 457
genetic architectures, diverse cohorts provide the opportunity to reduce false positives. 458
At the Mendelian end of the spectrum, for example, disentangling risk variants with 459
incomplete penetrance from benign false positives and localizing functional effects in 460
genes is much more feasible with large diverse population cohorts than possible with 461
single-ancestry analyses83,84. Multiple false positive reports of pathogenic variants 462
causing hypertrophic cardiomyopathy, a disease with relatively simple genomic 463
architecture, have been returned to patients of African descent or unspecified ancestry 464
that would have been prevented if even a small number of African American samples 465
were included in control cohorts85. At the highly complex end of the polygenicity 466
spectrum, we and others have shown that the utility of polygenic risk inferences and the 467
heritable phenotypic variance explained in diverse populations is improved with more 468
diverse cohorts80,86. 469
470
. CC-BY-NC 4.0 International licensepeer-reviewed) is the author/funder. It is made available under aThe copyright holder for this preprint (which was not. http://dx.doi.org/10.1101/070797doi: bioRxiv preprint first posted online Aug. 23, 2016;
22
Standard single-ancestry GWAS typically apply linear mixed model approaches and/or 471
incorporate principal components as covariates to control for confounding from 472
population structure with primarily European-descent cohorts1-3. A key concern when 473
including multiple diverse populations in a GWAS is that there is increasing likelihood of 474
identifying false positive variants associated with disease that are driven by allele 475
frequency differences across ancestries. However, previous studies have analyzed 476
association data for diverse ancestries and replicated findings across ethnicities, 477
assuaging these concerns7,75,87. In this study, we show that this ancestry stratification is 478
not continuous along the genome: long tracts of ancestrally diverse populations present 479
in admixed samples from the Americas are easily and accurately detected. Querying 480
population substructure within these tracts recapitulates expected trends, e.g. European 481
ancestry in African Americans primarily descends from northern Europeans in contrast 482
to European ancestry from Hispanic/Latinos, which primarily descends from southern 483
Europeans, as seen previously49. Additionally, population substructure follows a north-484
south cline in the Native component of Hispanic/Latinos, and the African component of 485
admixed African descent populations in the Americas most closely resembles reference 486
populations from Nigeria (albeit given the limited set of African populations from The 487
1000 Genomes Project). Admixture mapping has been successful at large sample sizes 488
for identifying ancestry-specific genetic risk factors for disease88. Given the level of 489
accuracy and subcontinental-resolution attained with local ancestry tracts in admixed 490
populations, we emphasize the utility of a unified framework to jointly analyze genetic 491
associations with local ancestry simultaneously45. 492
493
. CC-BY-NC 4.0 International licensepeer-reviewed) is the author/funder. It is made available under aThe copyright holder for this preprint (which was not. http://dx.doi.org/10.1101/070797doi: bioRxiv preprint first posted online Aug. 23, 2016;
23
The transferability of GWAS is aided by the inclusion of diverse populations89. We have 494
shown that European discovery biases in GWAS are recapitulated in local ancestry 495
tracts in admixed samples. We have quantified GWAS study biases in ancestral 496
populations and shown that GWAS variants are at lower frequency specifically within 497
African and Native tracts and higher frequency in European tracts in admixed American 498
populations. Imputation accuracy is also stratified across diverged ancestries, including 499
across local ancestries in admixed populations. With decreased imputation accuracy 500
especially on Native American tracts, there is decreased power for potential ancestry-501
specific associations. This differentially limits conclusions for GWAS in an admixed 502
population in a two-pronged manner: the ability to capture variation and the power to 503
estimate associations. 504
505
As GWAS scale to sample sizes on the order of hundreds of thousands to millions, 506
genetic risk prediction accuracy at the individual level improves90. However, we show 507
that the utility of polygenic risk scores computed using GWAS summary statistics are 508
dependent on genetic similarity to the discovery cohort. BLUP risk prediction methods 509
have been proposed to improve risk scores, but they require access to raw genetic data 510
typically from very large datasets, are also dependent on LD structure in the study 511
population, and only offer modest improvements in prediction accuracy91. Furthermore, 512
polygenic risk scores contain a mix of true positives (which have the bias described 513
above) and false positives in the training GWAS. False positives, being chance 514
statistical fluctuations, do not have the same allele frequency bias and therefore 515
unfortunately play an outsized role in applying a PRS in a new population. 516
. CC-BY-NC 4.0 International licensepeer-reviewed) is the author/funder. It is made available under aThe copyright holder for this preprint (which was not. http://dx.doi.org/10.1101/070797doi: bioRxiv preprint first posted online Aug. 23, 2016;
24
517
We have demonstrated that polygenic risk computed from summary statistics in a 518
single-ancestry cohort can be biased in essentially any direction across diverse 519
populations simply as a result of genetic drift, limiting their interpretability; directional 520
selection is expected to bias polygenic risk inferences even more. Because biases arise 521
from genetic drift alone, we recommend: 1) avoiding interpretations from polygenic risk 522
score differences extrapolated across populations, as these are likely confounded by 523
latent population structure that is not properly corrected for with current methods, 2) 524
mean-centering polygenic risk scores for each population, and 3) computing polygenic 525
risk scores in populations with similar demographic histories as the study sample to 526
ensure maximal predictive power. Further, additional methods that account for local 527
ancestry in genetic risk prediction to incorporate different ancestral linkage 528
disequilibrium and allele frequencies are needed. This study demonstrates the utility of 529
disentangling ancestry tracts in recently admixed populations for inferring recent 530
demographic history and identifying ancestry-stratified analytical biases; we also 531
motivate the need to include more ancestrally diverse cohorts in GWAS to ensure that 532
health disparities arising from genetic risk prediction do not become pervasive in 533
individuals of admixed and non-European descent. 534
535
Competing interests 536
CDB is an SAB member of Liberty Biosecurity, Personalis, Inc., 23andMe Roots into the 537
Future, Ancestry.com, IdentifyGenomics, LLC, Etalon, Inc., and is a founder of CDB 538
. CC-BY-NC 4.0 International licensepeer-reviewed) is the author/funder. It is made available under aThe copyright holder for this preprint (which was not. http://dx.doi.org/10.1101/070797doi: bioRxiv preprint first posted online Aug. 23, 2016;
25
Consulting, LTD. CRG owns stock in 23andMe, Inc. All other authors declare that they 539
have no competing interests. 540
541
Author contributions 542
ARM, CRG, RKW, CDB, MJD, EEK conceived of and designed the experiments. ARM 543
and GLW performed the data analysis. SG, CDB, and MJD contributed analysis 544
tools/materials. ARM wrote the manuscript with comments from CRG, RKW, GLW, 545
MJD, SG, and EEK. All authors read and approved the final manuscript. 546
547
Acknowledgments 548
We thank Suyash Shringarpure, Brian Maples, Andres Moreno-Estrada, Danny Park, 549
Noah Zaitlen, Alexander Gusev, and Alkes Price for helpful discussions/feedback. We 550
thank Verneri Antilla for providing GWAS summary statistics. We thank Jerome Kelleher 551
for several conversations about msprime, providing example scripts, and implementing 552
new simulation capabilities. This work was supported by funds from several grants; the 553
National Human Genome Research Institute under award numbers U01HG009080 554
(EEK, CDB, CRG), U01HG007419 (CDB, CRG, GLW), U01HG007417 (EEK), 555
U01HG005208 (MJD), T32HG000044 (CRG) and R01GM083606 (CDB), and the 556
National Institute of General Medical Sciences under award number T32GM007790 557
(ARM) at the National Institute of Health; the Directorate of Mathematical and Physical 558
Sciences award 1201234 (SG, CDB) at the National Science Foundation; the Canadian 559
Institutes of Health Research through the Canada Research Chair program and 560
operating grant MOP-136855 (SG), and a Sloan Research Fellowship (SG). 561
. CC-BY-NC 4.0 International licensepeer-reviewed) is the author/funder. It is made available under aThe copyright holder for this preprint (which was not. http://dx.doi.org/10.1101/070797doi: bioRxiv preprint first posted online Aug. 23, 2016;
26
562
Web Resources 563
Phased 1000 Genomes haplotypes: ftp://ftp-564
trace.ncbi.nih.gov/1000genomes/ftp/release/20130502/supporting/shapeit2_scaffolds/w565
gs_gt_scaffolds/ 566
Local ancestry calls: https://personal.broadinstitute.org/armartin/tgp_admixture/ 567
Scripts for processing data and running simulations: 568
https://github.com/armartin/ancestry_pipeline/ 569
PCAmask software: https://sites.google.com/site/pcamask/dowload 570
Tracts software: https://github.com/sgravel/tracts 571
Msprime software: https://github.com/jeromekelleher/msprime 572
573
Figure captions 574
575
. CC-BY-NC 4.0 International licensepeer-reviewed) is the author/funder. It is made available under aThe copyright holder for this preprint (which was not. http://dx.doi.org/10.1101/070797doi: bioRxiv preprint first posted online Aug. 23, 2016;
27 576
. CC-BY-NC 4.0 International licensepeer-reviewed) is the author/funder. It is made available under aThe copyright holder for this preprint (which was not. http://dx.doi.org/10.1101/070797doi: bioRxiv preprint first posted online Aug. 23, 2016;
28
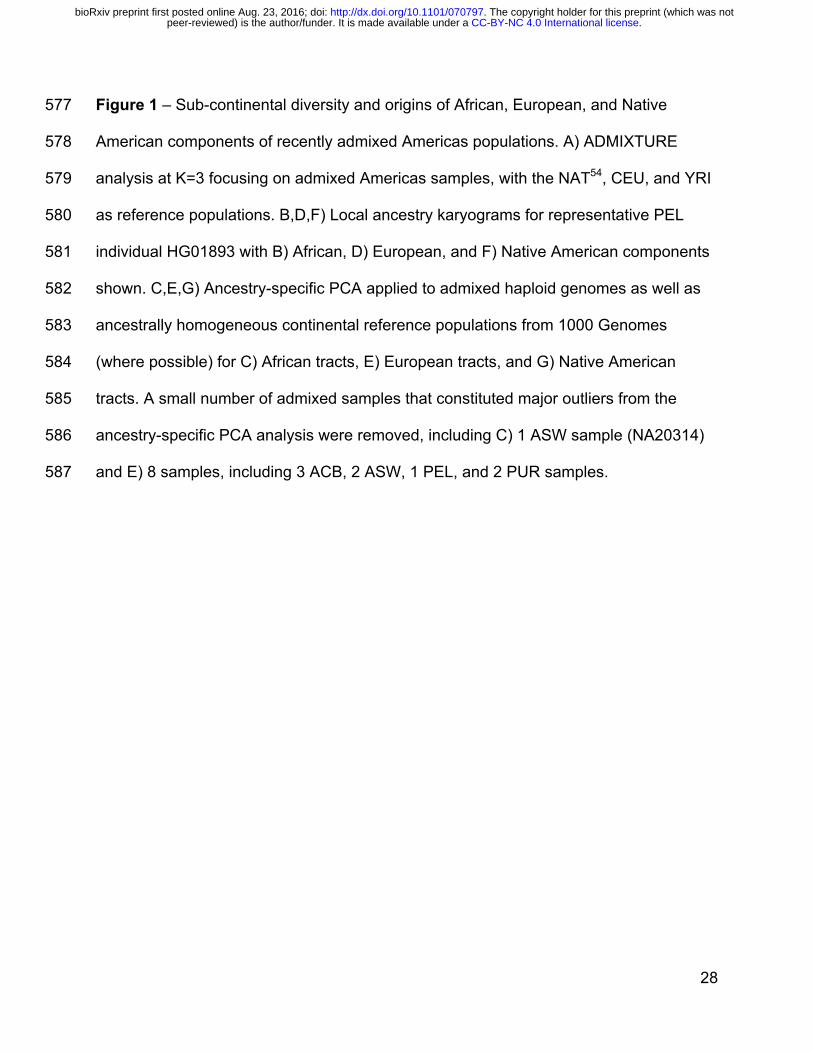
Figure 1 – Sub-continental diversity and origins of African, European, and Native 577
American components of recently admixed Americas populations. A) ADMIXTURE 578
analysis at K=3 focusing on admixed Americas samples, with the NAT54, CEU, and YRI 579
as reference populations. B,D,F) Local ancestry karyograms for representative PEL 580
individual HG01893 with B) African, D) European, and F) Native American components 581
shown. C,E,G) Ancestry-specific PCA applied to admixed haploid genomes as well as 582
ancestrally homogeneous continental reference populations from 1000 Genomes 583
(where possible) for C) African tracts, E) European tracts, and G) Native American 584
tracts. A small number of admixed samples that constituted major outliers from the 585
ancestry-specific PCA analysis were removed, including C) 1 ASW sample (NA20314) 586
and E) 8 samples, including 3 ACB, 2 ASW, 1 PEL, and 2 PUR samples. 587
. CC-BY-NC 4.0 International licensepeer-reviewed) is the author/funder. It is made available under aThe copyright holder for this preprint (which was not. http://dx.doi.org/10.1101/070797doi: bioRxiv preprint first posted online Aug. 23, 2016;
29
588
0.0
0.1
0.2
0.3
Reference AFR_AFR EUR_EUR NAT_NATDiploid ancestry
2pq
PopulationYRICEUCHBJPTACBASWCLMMXLPELPUR
GWAS catalog
0.000
0.005
0.010
0.015
0.020
Reference AFR_AFR EUR_EUR NAT_NATDiploid ancestry
2pq
PopulationYRICEUCHBJPTACBASWCLMMXLPELPUR
ClinVar
0.00
0.01
0.02
0.03
0.04
Reference AFR_AFR EUR_EUR NAT_NATDiploid ancestry
2pq
PopulationYRICEUCHBJPTACBASWCLMMXLPELPUR
Whole genomeA
B
C
. CC-BY-NC 4.0 International licensepeer-reviewed) is the author/funder. It is made available under aThe copyright holder for this preprint (which was not. http://dx.doi.org/10.1101/070797doi: bioRxiv preprint first posted online Aug. 23, 2016;
30
Figure 2 – Heterozygosity (estimated here as 2pq) in admixed populations stratified by 589
diploid local ancestry in A) the whole genome, B) sites from the GWAS catalog, and C) 590
sites from ClinVar classified as “pathogenic” or “likely pathogenic.” The mean and 95% 591
confidence intervals were calculatated by bootstrapping 1000 times. Populations not 592
shown in a given panel have too few diploid ancestry tracts overlapping sites to 593
calculate heterozygosity. 594
595
596
Figure 3 - Imputation accuracy by population assessed using a leave-on-out strategy, 597
stratified by diploid local ancestry on chromosome 9 for the Illumina OmniExpress 598
genotyping array. 599
CLM MXL
PEL PUR
AncestryAFR_AFRAFR_EURAFR_NATEUR_EUREUR_NATNAT_NAT
Common Low Frequency Rare Common Low Frequency Rare
Common Low Frequency Rare Common Low Frequency Rare
0.1
0.2
0.3
0.4
0.5
0.6
0.7
0.8
0.9
1.0
0.1
0.2
0.3
0.4
0.5
0.6
0.7
0.8
0.9
1.0
0.4, 0
.5
0.3, 0
.4
0.2, 0
.3
0.1, 0
.2
0.05,
0.1
0.04,
0.05
0.03,
0.04
0.02,
0.03
0.01,
0.02
0.005
, 0.01
0.4, 0
.5
0.3, 0
.4
0.2, 0
.3
0.1, 0
.2
0.05,
0.1
0.04,
0.05
0.03,
0.04
0.02,
0.03
0.01,
0.02
0.005
, 0.01
Variant Frequency
Mea
n r2
. CC-BY-NC 4.0 International licensepeer-reviewed) is the author/funder. It is made available under aThe copyright holder for this preprint (which was not. http://dx.doi.org/10.1101/070797doi: bioRxiv preprint first posted online Aug. 23, 2016;
31
600 Figure 4 - Biased genetic discoveries influence disease risk inferences. A-D) Inferred 601
polygenic risk scores across individuals colored by population for: A) height based on 602
summary statistics from 9. B) schizophrenia based on summary statistics from 10. C) 603
type II diabetes summary statistics derived from a European cohort from 74. D) type II 604
diabetes summary statistics derived from a multiethnic cohort from 75. 605
. CC-BY-NC 4.0 International licensepeer-reviewed) is the author/funder. It is made available under aThe copyright holder for this preprint (which was not. http://dx.doi.org/10.1101/070797doi: bioRxiv preprint first posted online Aug. 23, 2016;
32
606 Figure 5 - Coalescent simulation results for true vs inferred polygenic risk scores 607
computed from GWAS summary statistics with 10,000 cases and 10,000 controls 608
modeling European, East Asian, and African population history (demographic 609
parameters from 13). A) Violin plots show Pearson’s correlation across 50 iterations per 610
parameter set between true and inferred polygenic risk scores across differing genetic 611
architectures, including m=200, 500, and 1,000 causal variants and h2=0.67. The “ALL” 612
population correlations were performed on population mean-centered true and inferred 613
polygenic risk scores. B-D) Standardized true versus inferred polygenic risk scores for 3 614
. CC-BY-NC 4.0 International licensepeer-reviewed) is the author/funder. It is made available under aThe copyright holder for this preprint (which was not. http://dx.doi.org/10.1101/070797doi: bioRxiv preprint first posted online Aug. 23, 2016;
33
different coalescent simulations showing 10,000 randomly drawn samples from each 615
population not included as cases or controls. E-F) The distribution for each population 616
across 500 simulations with m=1000 causal variants and h2=0.67 of: E) unstandardized 617
mean true polygenic risk and F) unstandardized mean inferred polygenic risk. G) Allele 618
frequency versus inferred odds ratio for sites included in inferred polygenic risk scores 619
for each population across 500 simulations, as in E-F). 620
621
. CC-BY-NC 4.0 International licensepeer-reviewed) is the author/funder. It is made available under aThe copyright holder for this preprint (which was not. http://dx.doi.org/10.1101/070797doi: bioRxiv preprint first posted online Aug. 23, 2016;
34
References 622
1. Need AC, Goldstein DB (2009) Next generation disparities in human genomics: 623
concerns and remedies. Trends in genetics : TIG 25:489-494 624
2. Bustamante CD, Francisco M, Burchard EG (2011) Genomics for the world. Nature 625
475:163-165 626
3. Petrovski S, Goldstein DB (2016) Unequal representation of genetic variation across 627
ancestry groups creates healthcare inequality in the application of precision medicine. 628
Genome Biology 17:157 629
4. Popejoy AB, Fullerton SM (2016) Genomics is failing on diversity. Nature 538:161 630
5. Carlson CS, Matise TC, North KE, Haiman CA, Fesinmeyer MD, Buyske S, 631
Schumacher FR, Peters U, Franceschini N, Ritchie MD, et al (2013) Generalization and 632
dilution of association results from European GWAS in populations of non-European 633
ancestry: the PAGE study. PLoS Biol 11:e1001661 634
6. Torgerson DG, Ampleford EJ, Chiu GY, Gauderman WJ, Gignoux CR, Graves PE, 635
Himes BE, Levin AM, Mathias RA, Hancock DB, et al (2011) Meta-analysis of genome-636
wide association studies of asthma in ethnically diverse North American populations. 637
Nature genetics 43:887-892 638
7. Waters KM, Stram DO, Hassanein MT, Le Marchand L, Wilkens LR, Maskarinec G, 639
Monroe KR, Kolonel LN, Altshuler D, Henderson BE, et al (2010) Consistent association 640
of type 2 diabetes risk variants found in europeans in diverse racial and ethnic groups. 641
PLoS Genet 6 642
8. Hindorff LA, Sethupathy P, Junkins HA, Ramos EM, Mehta JP, Collins FS, Manolio 643
TA (2009) Potential etiologic and functional implications of genome-wide association 644
. CC-BY-NC 4.0 International licensepeer-reviewed) is the author/funder. It is made available under aThe copyright holder for this preprint (which was not. http://dx.doi.org/10.1101/070797doi: bioRxiv preprint first posted online Aug. 23, 2016;
35
loci for human diseases and traits. Proceedings of the National Academy of Sciences 645
106:9362-9367 646
9. Wood AR, Esko T, Yang J, Vedantam S, Pers TH, Gustafsson S, Chu AY, Estrada K, 647
Luan J, Kutalik Z, et al (2014) Defining the role of common variation in the genomic and 648
biological architecture of adult human height. Nature genetics 46:1173-1186 649
10. Schizophrenia Working Group of the Psychiatric Genomics Consortium (2014) 650
Biological insights from 108 schizophrenia-associated genetic loci. Nature 511:421-427 651
11. Muñoz M, Pong-Wong R, Canela-Xandri O, Rawlik K, Haley CS, Tenesa A (2016) 652
Evaluating the contribution of genetics and familial shared environment to common 653
disease using the UK Biobank. Nat Genet 654
12. Mathieson I, McVean G (2012) Differential confounding of rare and common 655
variants in spatially structured populations. Nature Genetics 44:243-246 656
13. Gravel S, Henn BM, Gutenkunst RN, Indap AR, Marth GT, Clark AG, Yu F, Gibbs 657
RA, Bustamante CD (2011) Demographic history and rare allele sharing among human 658
populations. Proceedings of the National Academy of Sciences of the United States of 659
America 108:11983-11988 660
14. Walter K, Min JL, Huang J, Crooks L, Memari Y, McCarthy S, Perry JRB, Xu C, 661
Futema M, Lawson D, et al (2015) The UK10K project identifies rare variants in health 662
and disease. Nature 663
15. Novembre J, Johnson T, Bryc K, Kutalik Z, Boyko AR, Auton A, Indap A, King KS, 664
Bergmann S, Nelson MR, et al (2008) Genes mirror geography within Europe. Nature 665
456:98-101 666
. CC-BY-NC 4.0 International licensepeer-reviewed) is the author/funder. It is made available under aThe copyright holder for this preprint (which was not. http://dx.doi.org/10.1101/070797doi: bioRxiv preprint first posted online Aug. 23, 2016;
36
16. Do R, Kathiresan S, Abecasis GR (2012) Exome sequencing and complex disease: 667
Practical aspects of rare variant association studies. Human Molecular Genetics 21:1-9 668
17. Lek M, Karczewski KJ, Minikel EV, Samocha KE, Banks E, Fennell T, O’Donnell-669
Luria AH, Ware JS, Hill AJ, Cummings BB, et al (2016) Analysis of protein-coding 670
genetic variation in 60,706 humans. Nature 536:285-291 671
18. Auton A, Abecasis GR, Altshuler DM, Durbin RM, Abecasis GR, Bentley DR, 672
Chakravarti A, Clark AG, Donnelly P, Eichler EE, et al (2015) A global reference for 673
human genetic variation. Nature 526:68-74 674
19. Tennessen JA, Bigham AW, O'Connor TD, Fu W, Kenny EE, Gravel S, McGee S, 675
Do R, Liu X, Jun G, et al (2012) Evolution and functional impact of rare coding variation 676
from deep sequencing of human exomes. Science (New York, N.Y.) 337:64-69 677
20. Grossman SR, Shlyakhter I, Karlsson EK, Byrne EH, Morales S, Frieden G, 678
Hostetter E, Angelino E, Garber M, Zuk O, et al (2010) A composite of multiple signals 679
distinguishes causal variants in regions of positive selection. Science (New York, N.Y.) 680
327:883-886 681
21. MacArthur DG, Balasubramanian S, Frankish A, Huang N, Morris J, Walter K, 682
Jostins L, Habegger L, Pickrell JK, Montgomery SB, et al (2012) A systematic survey of 683
loss-of-function variants in human protein-coding genes. Science (New York, N.Y.) 684
335:823-828 685
22. Henn BM, Botigué LR, Peischl S, Dupanloup I, Lipatov M, Maples BK, Martin AR, 686
Musharoff S, Cann H, Snyder MP, et al (2016) Distance from sub-Saharan Africa 687
predicts mutational load in diverse human genomes. Proceedings of the National 688
Academy of Sciences of the United States of America 113:E440-E449 689
. CC-BY-NC 4.0 International licensepeer-reviewed) is the author/funder. It is made available under aThe copyright holder for this preprint (which was not. http://dx.doi.org/10.1101/070797doi: bioRxiv preprint first posted online Aug. 23, 2016;
37
23. Lohmueller KE, Indap AR, Schmidt S, Boyko AR, Hernandez RD, Hubisz MJ, 690
Sninsky JJ, White TJ, Sunyaev SR, Nielsen R, et al (2008) Proportionally more 691
deleterious genetic variation in European than in African populations. Nature 451:994-692
997 693
24. Fu W, Gittelman RM, Bamshad MJ, Akey JM (2014) Characteristics of Neutral and 694
Deleterious Protein-Coding Variation among Individuals and Populations. The American 695
Journal of Human Genetics 95:421-436 696
25. Simons YB, Turchin MC, Pritchard JK, Sella G (2014) The deleterious mutation load 697
is insensitive to recent population history. Nature genetics 46:220-224 698
26. Stokowski RP, Pant PVK, Dadd T, Fereday A, Hinds DA, Jarman C, Filsell W, 699
Ginger RS, Green MR, van der Ouderaa FJ, et al (2007) A genomewide association 700
study of skin pigmentation in a South Asian population. American journal of human 701
genetics 81:1119-1132 702
27. Marcheco-Teruel B, Parra EJ, Fuentes-Smith E, Salas A, Buttenschøn HN, 703
Demontis D, Torres-Español M, Marín-Padrón LC, Gómez-Cabezas EJ, Alvarez-704
Iglesias V, et al (2014) Cuba: exploring the history of admixture and the genetic basis of 705
pigmentation using autosomal and uniparental markers. PLoS genetics 10:e1004488 706
28. Adhikari K, Fontanil T, Cal S, Mendoza-Revilla J, Fuentes-Guajardo M, Chacón-707
Duque J, Al-Saadi F, Johansson JA, Quinto-Sanchez M, Acuña-Alonzo V, et al (2016) A 708
genome-wide association scan in admixed Latin Americans identifies loci influencing 709
facial and scalp hair features. Nature Communications 7:10815 710
. CC-BY-NC 4.0 International licensepeer-reviewed) is the author/funder. It is made available under aThe copyright holder for this preprint (which was not. http://dx.doi.org/10.1101/070797doi: bioRxiv preprint first posted online Aug. 23, 2016;
38
29. Price AL, Tandon A, Patterson N, Barnes KC, Rafaels N, Ruczinski I, Beaty TH, 711
Mathias R, Reich D, Myers S (2009) Sensitive detection of chromosomal segments of 712
distinct ancestry in admixed populations. PLoS genetics 5:e1000519 713
30. Pasaniuc B, Zaitlen N, Lettre G, Chen GK, Tandon A, Kao WHL, Ruczinski I, 714
Fornage M, Siscovick DS, Zhu X, et al (2011) Enhanced statistical tests for GWAS in 715
admixed populations: Assessment using african americans from CARe and a breast 716
cancer consortium. PLoS Genetics 7 717
31. Fejerman L, Chen GK, Eng C, Huntsman S, Hu D, Williams A, Pasaniuc B, John 718
EM, Via M, Gignoux C, et al (2012) Admixture mapping identifies a locus on 6q25 719
associated with breast cancer risk in US Latinas. Human molecular genetics 21:1907-720
1917 721
32. Fejerman L, Ahmadiyeh N, Hu D, Huntsman S, Beckman KB, Caswell JL, Tsung K, 722
John EM, Torres-Mejia G, Carvajal-Carmona L, et al (2014) Genome-wide association 723
study of breast cancer in Latinas identifies novel protective variants on 6q25. Nat 724
Commun 5:5260 725
33. Freedman ML, Haiman CA, Patterson N, McDonald GJ, Tandon A, Waliszewska A, 726
Penney K, Steen RG, Ardlie K, John EM, et al (2006) Admixture mapping identifies 727
8q24 as a prostate cancer risk locus in African-American men. Proceedings of the 728
National Academy of Sciences of the United States of America 103:14068-14073 729
34. Bhatia G, Patterson N, Pasaniuc B, Zaitlen N, Genovese G, Pollack S, Mallick S, 730
Myers S, Tandon A, Spencer C, et al (2011) Genome-wide comparison of African-731
ancestry populations from CARe and other cohorts reveals signals of natural selection. 732
American journal of human genetics 89:368-381 733
. CC-BY-NC 4.0 International licensepeer-reviewed) is the author/funder. It is made available under aThe copyright holder for this preprint (which was not. http://dx.doi.org/10.1101/070797doi: bioRxiv preprint first posted online Aug. 23, 2016;
39
35. Moreno-Estrada A, Gravel S, Zakharia F, McCauley JL, Byrnes JK, Gignoux CR, 734
Ortiz-Tello PA, Martínez RJ, Hedges DJ, Morris RW, et al (2013) Reconstructing the 735
Population Genetic History of the Caribbean. PLoS Genetics 9:e1003925 736
36. Bryc K, Velez C, Karafet T, Moreno-Estrada A, Reynolds A, Auton A, Hammer M, 737
Bustamante CD, Ostrer H (2010) Colloquium paper: genome-wide patterns of 738
population structure and admixture among Hispanic/Latino populations. Proceedings of 739
the National Academy of Sciences of the United States of America 107 Suppl :8954-740
8961 741
37. Pritchard JK, Stephens M, Donnelly P (2000) Inference of population structure using 742
multilocus genotype data. Genetics 155:945-959 743
38. Tang H, Peng J, Wang P, Risch NJ (2005) Estimation of individual admixture: 744
Analytical and study design considerations. Genetic Epidemiology 28:289-301 745
39. Alexander DH, Novembre J, Lange K (2009) Fast model-based estimation of 746
ancestry in unrelated individuals. Genome research 19:1655-1664 747
40. Price AL, Zaitlen NA, Reich D, Patterson N (2010) New approaches to population 748
stratification in genome-wide association studies. Nature reviews. Genetics 11:459-463 749
41. Mathieson I, Mcvean G (2014) Demography and the Age of Rare Variants. 10 750
42. O'Connor TD, Fu W, Mychaleckyj JC, Logsdon B, Auer P, Carlson CS, Leal SM, 751
Smith JD, Rieder MJ, Bamshad MJ, et al (2015) Rare variation facilitates inferences of 752
fine-scale population structure in humans. Mol Biol Evol 32:653-660 753
43. Babron MC, de Tayrac M, Rutledge DN, Zeggini E, Génin E (2012) Rare and low 754
frequency variant stratification in the UK population: description and impact on 755
association tests. PLoS One 7:e46519 756
. CC-BY-NC 4.0 International licensepeer-reviewed) is the author/funder. It is made available under aThe copyright holder for this preprint (which was not. http://dx.doi.org/10.1101/070797doi: bioRxiv preprint first posted online Aug. 23, 2016;
40
44. Bhatia G, Gusev A, Loh P-R, Finucane HK, Vilhjalmsson BJ, Ripke S, Purcell S, 757
Stahl E, Daly M, de Candia TR (2016) Subtle stratification confounds estimates of 758
heritability from rare variants. bioRxiv:048181 759
45. Szulc P, Bogdan M, Frommlet F, Tang H (2016) Joint Genotype-and Ancestry-760
based Genome-wide Association Studies in Admixed Populations. bioRxiv:062554 761
46. Conomos M, Reiner A, Weir B, Thornton T (2016) Model-free Estimation of Recent 762
Genetic Relatedness. The American Journal of Human Genetics 98:127-148 763
47. Zaitlen N, Paşaniuc B, Gur T, Ziv E, Halperin E (2010) Leveraging genetic variability 764
across populations for the identification of causal variants. Am J Hum Genet 86:23-33 765
48. Genovese G, Handsaker RE, Li H, Kenny EE, McCarroll SA (2013) Mapping the 766
human reference genome's missing sequence by three-way admixture in Latino 767
genomes. Am J Hum Genet 93:411-421 768
49. Baharian S, Barakatt M, Gignoux CR, Shringarpure S, Errington J, Blot WJ, 769
Bustamante CD, Kenny EE, Williams SM, Aldrich MC, et al (2016) The Great Migration 770
and African-American Genomic Diversity. PLoS genetics 12:e1006059 771
50. Reich D, Patterson N, Campbell D, Tandon A, Mazieres S, Ray N, Parra MV, Rojas 772
W, Duque C, Mesa N, et al (2012) Reconstructing Native American population history. 773
Nature 488:370-374 774
51. Ruiz-Linares A, Adhikari K, Acuña-Alonzo V, Quinto-Sanchez M, Jaramillo C, Arias 775
W, Fuentes M, Pizarro M, Everardo P, de Avila F, et al (2014) Admixture in Latin 776
America: geographic structure, phenotypic diversity and self-perception of ancestry 777
based on 7,342 individuals. PLoS Genet 10:e1004572 778
. CC-BY-NC 4.0 International licensepeer-reviewed) is the author/funder. It is made available under aThe copyright holder for this preprint (which was not. http://dx.doi.org/10.1101/070797doi: bioRxiv preprint first posted online Aug. 23, 2016;
41
52. Moreno-Estrada A, Gignoux CR, Fernández-López JC, Zakharia F, Sikora M, 779
Contreras AV, Acuña-Alonzo V, Sandoval K, Eng C, Romero-Hidalgo S, et al (2014) 780
The genetics of Mexico recapitulates Native American substructure and affects 781
biomedical traits. Science (New York, N.Y.) 344:1280-1285 782
53. Vilhjálmsson BJ, Yang J, Finucane HK, Gusev A, Lindström S, Ripke S, Genovese 783
G, Loh PR, Bhatia G, Do R, et al (2015) Modeling Linkage Disequilibrium Increases 784
Accuracy of Polygenic Risk Scores. Am J Hum Genet 97:576-592 785
54. Mao X, Bigham AW, Mei R, Gutierrez G, Weiss KM, Brutsaert TD, Leon-Velarde F, 786
Moore LG, Vargas E, McKeigue PM, et al (2007) A genomewide admixture mapping 787
panel for Hispanic/Latino populations. American journal of human genetics 80:1171-788
1178 789
55. O'Connell J, Gurdasani D, Delaneau O, Pirastu N, Ulivi S, Cocca M, Traglia M, 790
Huang J, Huffman JE, Rudan I, McQuillan R, et al (2014) A General Approach for 791
Haplotype Phasing across the Full Spectrum of Relatedness. PLoS Genetics 792
10:e1004234 793
56. Maples BK, Gravel S, Kenny EE, Bustamante CD (2013) RFMix: A Discriminative 794
Modeling Approach for Rapid and Robust Local-Ancestry Inference. American journal of 795
human genetics 93:278-288 796
57. Gravel S (2012) Population genetics models of local ancestry. Genetics 191:607-797
619 798
58. 1000 Genomes Project Consortium (2012) An integrated map of genetic variation 799
from 1,092 human genomes. Nature 135:0-9 800
. CC-BY-NC 4.0 International licensepeer-reviewed) is the author/funder. It is made available under aThe copyright holder for this preprint (which was not. http://dx.doi.org/10.1101/070797doi: bioRxiv preprint first posted online Aug. 23, 2016;
42
59. Purcell S, Neale B, Toddbrown K, Thomas L, Ferreira M, Bender D, Maller J, Sklar 801
P, Debakker P, Daly M (2007) PLINK: A Tool Set for Whole-Genome Association and 802
Population-Based Linkage Analyses. The American Journal of Human Genetics 81:559-803
575 804
60. Kelleher J, Etheridge AM, McVean G (2016) Efficient coalescent simulation and 805
genealogical analysis for large sample sizes. PLoS Comput Biol 12:e1004842 806
61. Mathias RA, Taub MA, Gignoux CR, Fu W, Musharoff S, O'Connor TD, Vergara C, 807
Torgerson DG, Pino-Yanes M, Shringarpure SS, et al (2016) A continuum of admixture 808
in the Western Hemisphere revealed by the African Diaspora genome. Nature 809
Communications 7:12522 810
62. Shringarpure SS, Bustamante CD, Lange KL, Alexander DH (2016) Efficient 811
analysis of large datasets and sex bias with ADMIXTURE. bioarXiv 1:1-10 812
63. Price AL, Patterson NJ, Plenge RM, Weinblatt ME, Shadick NA, Reich D (2006) 813
Principal components analysis corrects for stratification in genome-wide association 814
studies. Nature genetics 38:904-909 815
64. Baran Y, Pasaniuc B, Sankararaman S, Torgerson DG, Gignoux C, Eng C, 816
Rodriguez-Cintron W, Chapela R, Ford JG, Avila PC, et al (2012) Fast and accurate 817
inference of local ancestry in Latino populations. Bioinformatics 28:1359-1367 818
65. Moreno-Estrada A, Gravel S, Zakharia F, McCauley JL, Byrnes JK, Gignoux CR, 819
Ortiz-Tello PA, Martínez RJ, Hedges DJ, Morris RW, et al (2013) Reconstructing the 820
Population Genetic History of the Caribbean. PLoS Genetics 9:e1003925 821
. CC-BY-NC 4.0 International licensepeer-reviewed) is the author/funder. It is made available under aThe copyright holder for this preprint (which was not. http://dx.doi.org/10.1101/070797doi: bioRxiv preprint first posted online Aug. 23, 2016;
43
66. Moreno-Estrada A, Gravel S, Zakharia F, McCauley JL, Byrnes JK, Gignoux CR, 822
Ortiz-Tello PA, Martínez RJ, Hedges DJ, Morris RW, et al (2013) Reconstructing the 823
Population Genetic History of the Caribbean. PLoS Genetics 9:e1003925 824
67. Tishkoff SA, Reed FA, Friedlaender FR, Ehret C, Ranciaro A, Froment A, Hirbo JB, 825
Awomoyi AA, Bodo J, Doumbo O, et al (2009) The genetic structure and history of 826
Africans and African Americans. Science (New York, N.Y.) 324:1035-1044 827
68. Zakharia F, Basu A, Absher D, Assimes TL, Go AS, Hlatky MA, Iribarren C, Knowles 828
JW, Li J, Narasimhan B, et al (2009) Characterizing the admixed African ancestry of 829
African Americans. Genome biology 10:R141 830
69. Schroeder H, Ávila-Arcos MC, Malaspinas A, Poznik GD, Sandoval-Velasco M, 831
Carpenter ML, Moreno-Mayar JV, Sikora M, Johnson PLF, Allentoft ME, et al (2015) 832
Genome-wide ancestry of 17th-century enslaved Africans from the Caribbean. 833
Proceedings of the National Academy of Sciences 112:201421784 834
70. Gravel S, Zakharia F, Moreno-Estrada A, Byrnes JK, Muzzio M, Rodriguez-Flores 835
JL, Kenny EE, Gignoux CR, Maples BK, Guiblet W, et al (2013) Reconstructing Native 836
American migrations from whole-genome and whole-exome data. PLoS genetics 837
9:e1004023 838
71. Kessler MD, Yerges-Armstrong L, Taub MA, Shetty AC, Maloney K, Jeng LJB, 839
Ruczinski I, Levin AM, Williams LK, Beaty TH, et al (2016) Challenges and disparities in 840
the application of personalized genomic medicine to populations with African ancestry. 841
Nature Communications 7:12521 842
. CC-BY-NC 4.0 International licensepeer-reviewed) is the author/funder. It is made available under aThe copyright holder for this preprint (which was not. http://dx.doi.org/10.1101/070797doi: bioRxiv preprint first posted online Aug. 23, 2016;
44
72. Purcell SM, Wray NR, Stone JL, Visscher PM, O'Donovan MC, Sullivan PF, Sklar P, 843
Purcell SM, Stone JL, Sullivan PF, et al (2009) Common polygenic variation contributes 844
to risk of schizophrenia and bipolar disorder. Nature 845
73. Shungin D, Winkler TW, Croteau-Chonka DC, Ferreira T, Locke AE, Mägi R, 846
Strawbridge RJ, Pers TH, Fischer K, Justice AE, et al (2015) New genetic loci link 847
adipose and insulin biology to body fat distribution. Nature 518:187-196 848
74. Gaulton KJ, Ferreira T, Lee Y, Raimondo A, Mägi R, Reschen ME, Mahajan A, 849
Locke A, Rayner NW, Robertson N, et al (2015) Genetic fine mapping and genomic 850
annotation defines causal mechanisms at type 2 diabetes susceptibility loci. Nat Genet 851
47:1415-1425 852
75. Mahajan A, Go MJ, Zhang W, Below JE, Gaulton KJ, Ferreira T, Horikoshi M, 853
Johnson AD, Ng MC, Prokopenko I, et al (2014) Genome-wide trans-ancestry meta-854
analysis provides insight into the genetic architecture of type 2 diabetes susceptibility. 855
Nat Genet 46:234-244 856
76. Moffatt MF, Gut IG, Demenais F, Strachan DP, Bouzigon E, Heath S, Von Mutius E, 857
Farrall M, Lathrop M, Cookson WO (2010) A large-scale, consortium-based 858
genomewide association study of asthma. New England Journal of Medicine 363:1211-859
1221 860
77. N'Diaye A, Chen GK, Palmer CD, Ge B, Tayo B, Mathias RA, Ding J, Nalls MA, 861
Adeyemo A, Adoue V, et al (2011) Identification, replication, and fine-mapping of Loci 862
associated with adult height in individuals of african ancestry. PLoS Genet 7:e1002298 863
78. Gustafsson A, Lindenfors P (2004) Human size evolution: no evolutionary allometric 864
relationship between male and female stature. J Hum Evol 47:253-266 865
. CC-BY-NC 4.0 International licensepeer-reviewed) is the author/funder. It is made available under aThe copyright holder for this preprint (which was not. http://dx.doi.org/10.1101/070797doi: bioRxiv preprint first posted online Aug. 23, 2016;
45
79. Whiteford HA, Degenhardt L, Rehm J, Baxter AJ, Ferrari AJ, Erskine HE, Charlson 866
FJ, Norman RE, Flaxman AD, Johns N, et al (2013) Global burden of disease 867
attributable to mental and substance use disorders: findings from the Global Burden of 868
Disease Study 2010. The Lancet 382:1575-1586 869
80. De Candia TR, Lee SH, Yang J, Browning BL, Gejman PV, Levinson DF, Mowry BJ, 870
Hewitt JK, Goddard ME, O'Donovan MC, et al (2013) Additive genetic variation in 871
schizophrenia risk is shared by populations of African and European descent. American 872
Journal of Human Genetics 93:463-470 873
81. Lango Allen H, Estrada K, Lettre G, Berndt SI, Weedon MN, Rivadeneira F, Willer 874
CJ, Jackson AU, Vedantam S, Raychaudhuri S, et al (2010) Hundreds of variants 875
clustered in genomic loci and biological pathways affect human height. Nature 467:832-876
838 877
82. Chan Y, Lim E, Sandholm N, Wang S, McKnight A, Ripke S, Daly M, Neale B, 878
Salem R, Hirschhorn J (2014) An Excess of Risk-Increasing Low-Frequency Variants 879
Can Be a Signal of Polygenic Inheritance in Complex Diseases. The American Journal 880
of Human Genetics 94:437-452 881
83. Minikel EV, Vallabh SM, Lek M, Estrada K, Samocha KE, Sathirapongsasuti JF, 882
McLean CY, Tung JY, Yu LPC, Gambetti P, et al (2016) Quantifying prion disease 883
penetrance using large population control cohorts. Science Translational Medicine 884
8:322ra9-322ra9 885
84. Walsh R, Thomson K, Ware JS, Funke BH, Woodley J, McGuire KJ, Mazzarotto F, 886
Blair E, Seller A, Taylor JC (2016) Reassessment of Mendelian gene pathogenicity 887
using 7,855 cardiomyopathy cases and 60,706 reference samples. bioRxiv:041111 888
. CC-BY-NC 4.0 International licensepeer-reviewed) is the author/funder. It is made available under aThe copyright holder for this preprint (which was not. http://dx.doi.org/10.1101/070797doi: bioRxiv preprint first posted online Aug. 23, 2016;
46
85. Manrai AK, Funke BH, Rehm HL, Olesen MS, Maron BA, Szolovits P, Margulies 889
DM, Loscalzo J, Kohane IS (2016) Genetic Misdiagnoses and the Potential for Health 890
Disparities. New England Journal of Medicine 375:655-665 891
86. Li YR, Keating BJ (2014) Trans-ethnic genome-wide association studies: 892
advantages and challenges of mapping in diverse populations. Genome Med 6:91 893
87. Dumitrescu L, Carty CL, Taylor K, Schumacher FR, Hindorff LA, Ambite JL, 894
Anderson G, Best LG, Brown-Gentry K, Bůžková P, et al (2011) Genetic Determinants 895
of Lipid Traits in Diverse Populations from the Population Architecture using Genomics 896
and Epidemiology (PAGE) Study. PLoS Genetics 7:e1002138 897
88. Freedman ML, Haiman CA, Patterson N, McDonald GJ, Tandon A, Waliszewska A, 898
Penney K, Steen RG, Ardlie K, John EM (2006) Admixture mapping identifies 8q24 as a 899
prostate cancer risk locus in African-American men. Proceedings of the National 900
Academy of Sciences 103:14068-14073 901
89. Rosenberg NA, Huang L, Jewett EM, Szpiech ZA, Jankovic I, Boehnke M (2010) 902
Genome-wide association studies in diverse populations. Nature reviews. Genetics 903
11:356-366 904
90. Dudbridge F (2013) Power and predictive accuracy of polygenic risk scores. PLoS 905
Genet 9:e1003348 906
91. Wray NR, Yang J, Hayes BJ, Price AL, Goddard ME, Visscher PM (2013) Pitfalls of 907
predicting complex traits from SNPs. Nature Reviews Genetics 14:507-515 908
909
910
. CC-BY-NC 4.0 International licensepeer-reviewed) is the author/funder. It is made available under aThe copyright holder for this preprint (which was not. http://dx.doi.org/10.1101/070797doi: bioRxiv preprint first posted online Aug. 23, 2016;