Human-centered Automation Azbil Corporation RIC: 6845.T ...2016/11/09 · Presentation Materials...
30
Human-centered Automation Azbil Corporation RIC: 6845.T, Sedol: 6985543 Presentation Materials For the First Half Ended September 30, 2016 (Based on Japanese GAAP) 1. Financial Results for the First Half Ended September 30, 2016 2. Financial Plan for the Year Ending March 31, 2017 3. Return to Shareholders 4. Toward Future Business Development <Contents> IR, Group Management Headquarters Email: [email protected] URL: http://www.azbil.com/ir/
Transcript of Human-centered Automation Azbil Corporation RIC: 6845.T ...2016/11/09 · Presentation Materials...
Human-centered Automation
Azbil Corporation RIC: 6845.T, Sedol: 6985543
Presentation MaterialsFor the First Half Ended September 30, 2016 (Based on Japanese GAAP)
1. Financial Results for the First Half Ended September 30, 2016
2. Financial Plan for the Year Ending March 31, 20173. Return to Shareholders4. Toward Future Business Development
<Contents>
IR, Group Management Headquarters Email: [email protected]: http://www.azbil.com/ir/
2
Notes:
1. Financial data and financial statements have been prepared based on Japanese GAAP and the amounts have been rounded down.
2. Segment names are abbreviated as follows:B A : Building AutomationA A : Advanced AutomationL A : Life Automation
3. Sales for the azbil Group tend to be concentrated in the second half accounting period, while fixed costs are generated constantly. This means that profits in the first half accounting period are typically lower than the second half.
4. The financial plan is based on management’s assumptions, intent and expectations in light of the information currently available to it, and therefore this plan is not a guarantee of future performance. Due to various factors, actual results may differ from those discussed in this material.

3
1. Financial Results for the First Half Ended September 30, 2016
4
1. Financial Results for the First Half Ended September 30, 2016
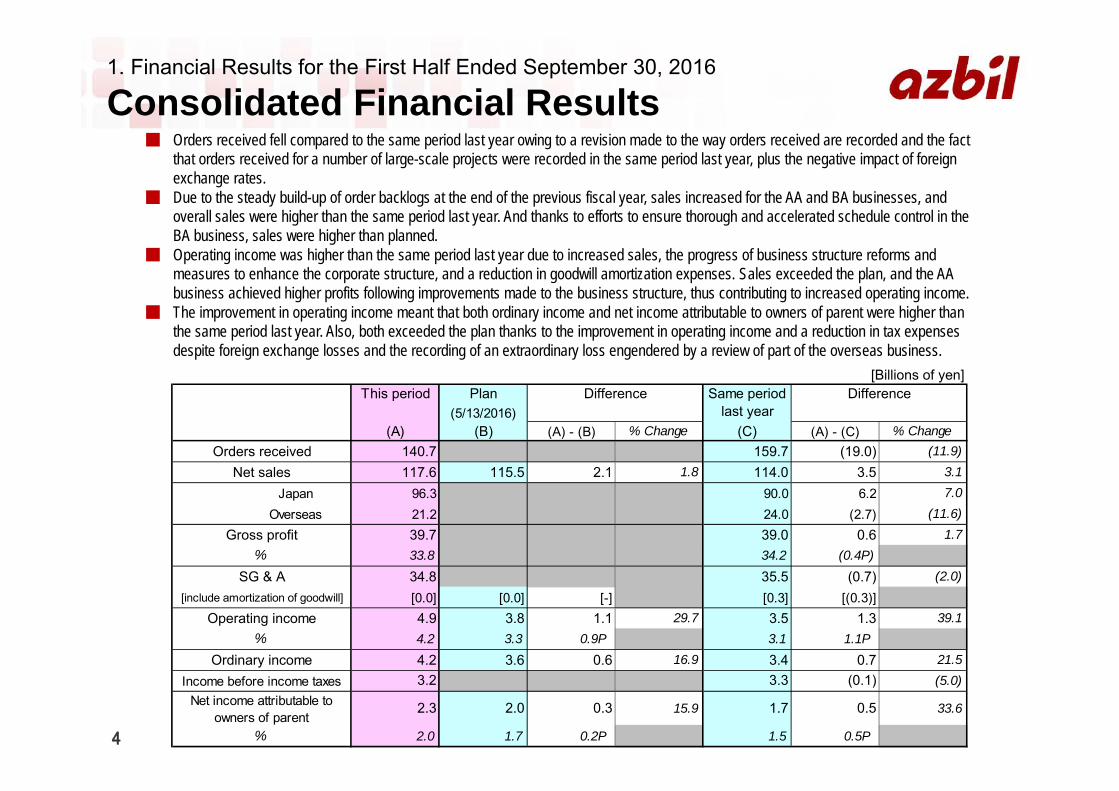
Consolidated Financial Results■ Orders received fell compared to the same period last year owing to a revision made to the way orders received are recorded and the fact
that orders received for a number of large-scale projects were recorded in the same period last year, plus the negative impact of foreign exchange rates.
■ Due to the steady build-up of order backlogs at the end of the previous fiscal year, sales increased for the AA and BA businesses, and overall sales were higher than the same period last year. And thanks to efforts to ensure thorough and accelerated schedule control in the BA business, sales were higher than planned.
■ Operating income was higher than the same period last year due to increased sales, the progress of business structure reforms and measures to enhance the corporate structure, and a reduction in goodwill amortization expenses. Sales exceeded the plan, and the AA business achieved higher profits following improvements made to the business structure, thus contributing to increased operating income.
■ The improvement in operating income meant that both ordinary income and net income attributable to owners of parent were higher than the same period last year. Also, both exceeded the plan thanks to the improvement in operating income and a reduction in tax expenses despite foreign exchange losses and the recording of an extraordinary loss engendered by a review of part of the overseas business.
[Billions of yen]This period Plan Difference
(5/13/2016)(A) (B) (A) - (B) % Change (C) (A) - (C) % Change
Orders received 140.7 159.7 (19.0) (11.9)Net sales 117.6 115.5 2.1 1.8 114.0 3.5 3.1
Japan 96.3 90.0 6.2 7.0Overseas 21.2 24.0 (2.7) (11.6)
Gross profit 39.7 39.0 0.6 1.7% 33.8 34.2 (0.4P)
SG & A 34.8 35.5 (0.7) (2.0)[include amortization of goodwill] [0.0] [0.0] [-] [0.3] [(0.3)]
Operating income 4.9 3.8 1.1 29.7 3.5 1.3 39.1% 4.2 3.3 0.9P 3.1 1.1P
Ordinary income 4.2 3.6 0.6 16.9 3.4 0.7 21.5
Net income attributable toowners of parent
2.3 2.0 0.3 15.9 1.7 0.5 33.6
% 2.0 1.7 0.2P 1.5 0.5P
(5.0)3.2
Same periodlast year
Difference
Income before income taxes 3.3 (0.1)

5
1. Financial Results for the First Half Ended September 30, 2016
Segment Information - ■ BA Business■ Owing to a revision made to the way orders received are recorded*1 and the fact that orders received for a number of large-scale projects
were recorded in the same period last year, plus decrease in overseas subsidiaries*2 due to the negative impact of foreign exchange rates etc., overall orders received fell. However, the domestic business environment remained robust.
■ Sales increased compared with the same period last year thanks to growth in the markets for existing buildings and service. In all fields, domestic sales exceeded the plan.
■ Segment profit benefited from increased sales, but because of temporary expenses such as allowance for doubtful accounts etc. and also increased R&D expenses, it was on a par with the same period last year. For these same reasons, profit was generally in line with the plan.
*1 In the fiscal year ended March 31, 2016 , a revision was made to the way domestic orders received for multi-year contracts are recorded. This revision led to a transient jump in the value of orders received for multi-year contracts recorded in the fiscal year ended March 31, 2016. (Owing to the existence of previous multi-year contracts in the fiscal year ended March 31, 2015 and earlier, this revision resulted in the recording of a lump sum of approx. 4 billion yen in the fiscal year ended March 31, 2016.)
*2 Changes in the BA business environment in China have led to a review of our business in that country and, consequently, loss on liquidation of subsidiaries and associates was recorded. However, thanks to a reduction in tax expenses, the impact on net income attributable to owners of parent was limited.
[Billions of yen]This period Plan Difference
(5/13/2016)(A) (B) (A) - (B) % Change (C) (A) - (C) % Change
Orders received 75.1 85.5 (10.4) (12.2)Sales 49.4 47.0 2.4 5.2 48.1 1.2 2.6Segment profit 1.6 1.7 (0.0) (1.3) 1.7 (0.0) (2.0)
% 3.4 3.6 (0.2P) 3.6 (0.2P)
- - - - -
Difference Same periodlast year
(Reference) Amortization of goodwill

6
1. Financial Results for the First Half Ended September 30, 2016
Segment Information - ■ AA Business■ Orders received were down on the same period last year due to the impact of foreign exchange rates and the fact that there had been
orders received for large-scale projects in the same period last year. Domestically, however, orders received grew in the semiconductor manufacturing equipment and energy-related markets.
■ Due to the build-up of order backlogs at the end of the previous fiscal year, domestic market sales grew. Sales thus increased compared to the same period last year.
■ The appreciation of the yen had a negative impact on profits, but, thanks to domestic sales growth and initiatives aimed at improving the profit structure, segment profit increased compared to the same period last year. These initiatives aimed at improving the profit structure also meant that segment profit exceeded the plan.
[Billions of yen]This period Plan Difference
(5/13/2016)(A) (B) (A) - (B) % Change (C) (A) - (C) % Change
Orders received 45.7 50.1 (4.4) (8.8)Sales 46.0 46.0 0.0 0.1 43.6 2.4 5.5Segment profit 2.5 1.4 1.1 85.4 1.5 1.0 68.4
% 5.6 3.0 2.6P 3.5 2.1P
0.0 0.0 - 0.1 (0.0)
Difference Same periodlast year
(Reference) Amortization of goodwill
7
1. Financial Results for the First Half Ended September 30, 2016
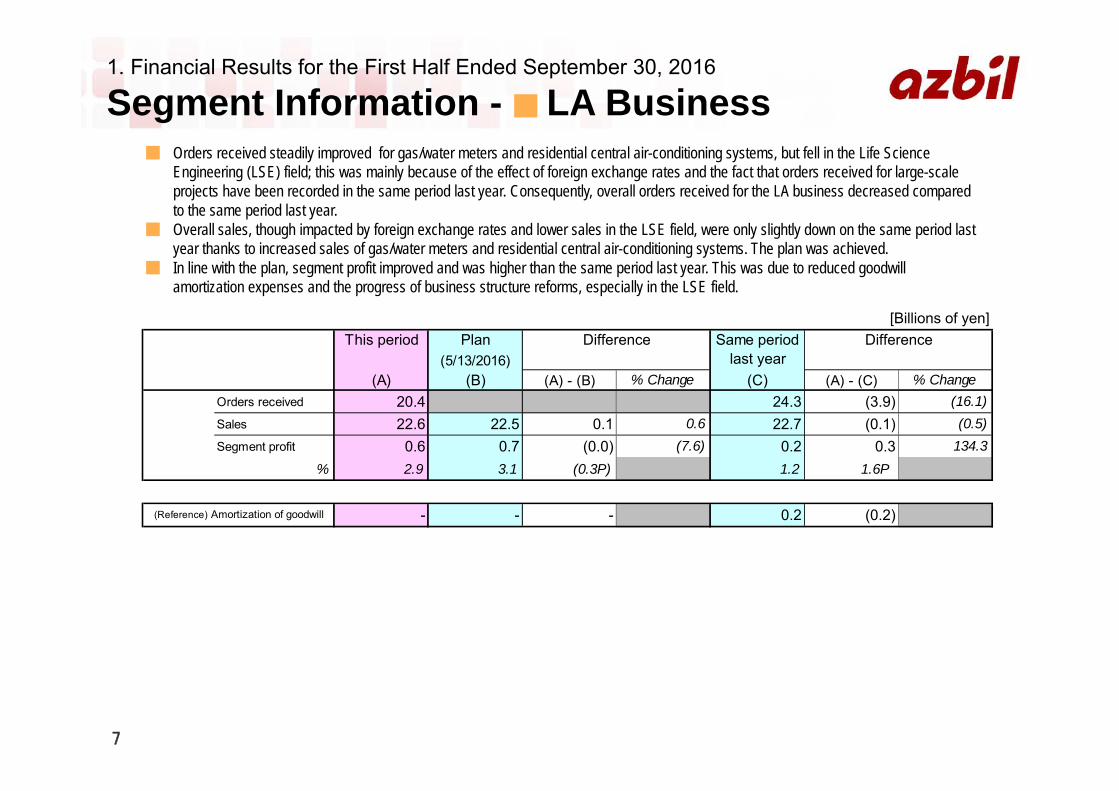
Segment Information - ■ LA Business■ Orders received steadily improved for gas/water meters and residential central air-conditioning systems, but fell in the Life Science
Engineering (LSE) field; this was mainly because of the effect of foreign exchange rates and the fact that orders received for large-scale projects have been recorded in the same period last year. Consequently, overall orders received for the LA business decreased compared to the same period last year.
■ Overall sales, though impacted by foreign exchange rates and lower sales in the LSE field, were only slightly down on the same period last year thanks to increased sales of gas/water meters and residential central air-conditioning systems. The plan was achieved.
■ In line with the plan, segment profit improved and was higher than the same period last year. This was due to reduced goodwill amortization expenses and the progress of business structure reforms, especially in the LSE field.
[Billions of yen]This period Plan Difference
(5/13/2016)(A) (B) (A) - (B) % Change (C) (A) - (C) % Change
Orders received 20.4 24.3 (3.9) (16.1)Sales 22.6 22.5 0.1 0.6 22.7 (0.1) (0.5)Segment profit 0.6 0.7 (0.0) (7.6) 0.2 0.3 134.3
% 2.9 3.1 (0.3P) 1.2 1.6P
- - - 0.2 (0.2)(Reference) Amortization of goodwill
Difference Same periodlast year
8
[Billions of yen]
1. Financial Results for the First Half Ended September 30, 2016
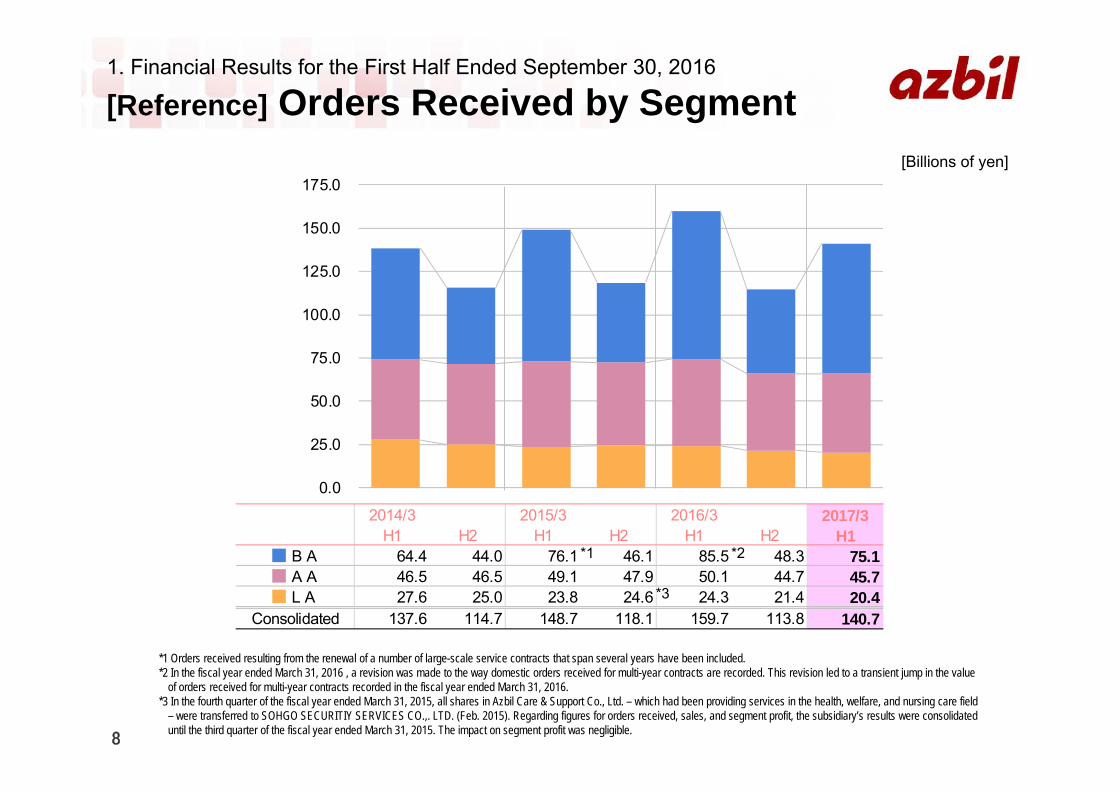
[Reference] Orders Received by Segment
2014/3 2015/3 2016/3 2017/3H1 H2 H1 H2 H1 H2 H1
■ B A 64.4 44.0 76.1 46.1 85.5 48.3 75.1 ■ A A 46.5 46.5 49.1 47.9 50.1 44.7 45.7 ■ L A 27.6 25.0 23.8 24.6 24.3 21.4 20.4
Consolidated 137.6 114.7 148.7 118.1 159.7 113.8 140.7
0.0
25.0
50.0
75.0
100.0
125.0
150.0
175.0
*1 Orders received resulting from the renewal of a number of large-scale service contracts that span several years have been included.*2 In the fiscal year ended March 31, 2016 , a revision was made to the way domestic orders received for multi-year contracts are recorded. This revision led to a transient jump in the value
of orders received for multi-year contracts recorded in the fiscal year ended March 31, 2016.*3 In the fourth quarter of the fiscal year ended March 31, 2015, all shares in Azbil Care & Support Co., Ltd. – which had been providing services in the health, welfare, and nursing care field
– were transferred to SOHGO SECURITIY SERVICES CO.,. LTD. (Feb. 2015). Regarding figures for orders received, sales, and segment profit, the subsidiary’s results were consolidated until the third quarter of the fiscal year ended March 31, 2015. The impact on segment profit was negligible.
*3
*1 *2
9
1. Financial Results for the First Half Ended September 30, 2016
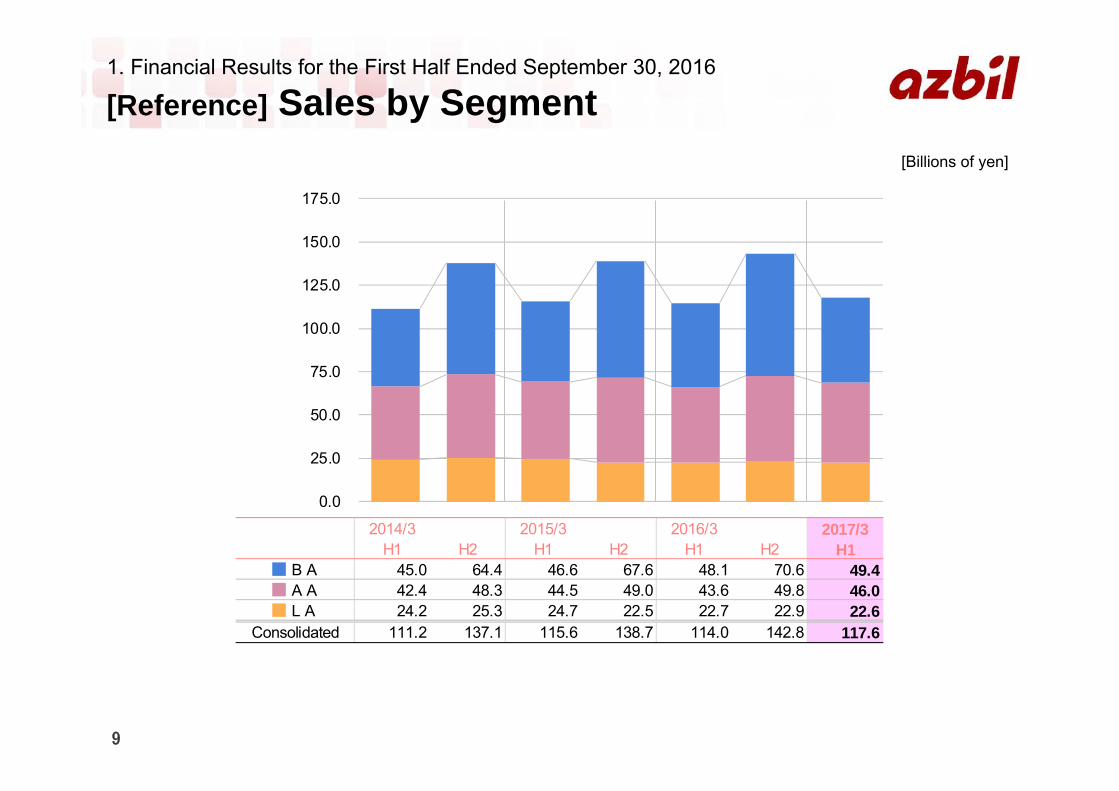
[Reference] Sales by Segment[Billions of yen]
2014/3 2015/3 2016/3 2017/3H1 H2 H1 H2 H1 H2 H1
■ B A 45.0 64.4 46.6 67.6 48.1 70.6 49.4 ■ A A 42.4 48.3 44.5 49.0 43.6 49.8 46.0 ■ L A 24.2 25.3 24.7 22.5 22.7 22.9 22.6
Consolidated 111.2 137.1 115.6 138.7 114.0 142.8 117.6
0.0
25.0
50.0
75.0
100.0
125.0
150.0
175.0

10
1. Financial Results for the First Half Ended September 30, 2016
[Reference] Segment Profit (Operating Income)[Billions of yen]
2014/3 2015/3 2016/3 2017/3H1 H2 H1 H2 H1 H2 H1
■ B A 1.5 9.0 2.4 9.8 1.7 10.3 1.6 ■ A A 1.2 2.7 2.0 3.0 1.5 3.4 2.5 ■ L A (0.3) (0.3) (0.8) (1.0) 0.2 (0.1) 0.6
Consolidated 2.4 11.4 3.5 11.7 3.5 13.5 4.9
(2.5)
0.0
2.5
5.0
7.5
10.0
12.5
15.0
11
1. Financial Results for the First Half Ended September 30, 2016
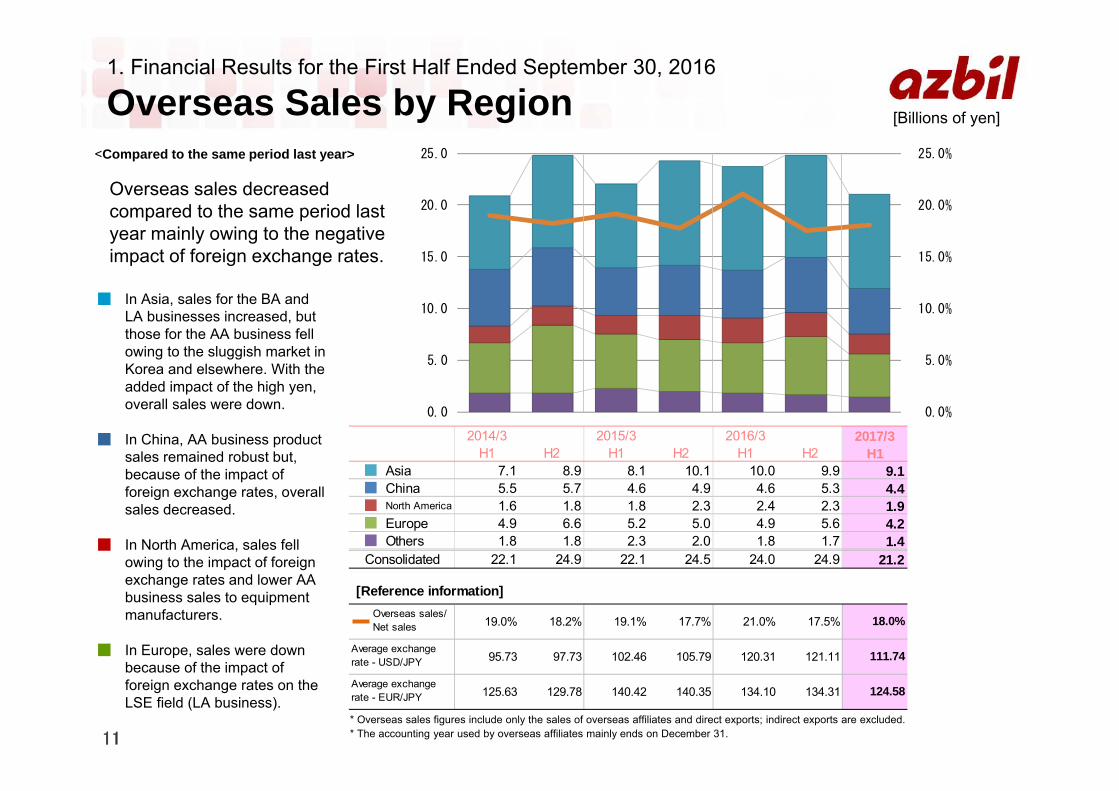
Overseas Sales by Region
* Overseas sales figures include only the sales of overseas affiliates and direct exports; indirect exports are excluded.* The accounting year used by overseas affiliates mainly ends on December 31.
[Billions of yen]
Overseas sales decreased compared to the same period last year mainly owing to the negative impact of foreign exchange rates.
■ In Asia, sales for the BA and LA businesses increased, but those for the AA business fell owing to the sluggish market in Korea and elsewhere. With the added impact of the high yen, overall sales were down.
■ In China, AA business product sales remained robust but, because of the impact of foreign exchange rates, overall sales decreased.
■ In North America, sales fell owing to the impact of foreign exchange rates and lower AA business sales to equipment manufacturers.
■ In Europe, sales were down because of the impact of foreign exchange rates on the LSE field (LA business).
<Compared to the same period last year>
2014/3 2015/3 2016/3 2017/3H1 H2 H1 H2 H1 H2 H1
■ Asia 7.1 8.9 8.1 10.1 10.0 9.9 9.1 ■ China 5.5 5.7 4.6 4.9 4.6 5.3 4.4 ■ North America 1.6 1.8 1.8 2.3 2.4 2.3 1.9 ■ Europe 4.9 6.6 5.2 5.0 4.9 5.6 4.2 ■ Others 1.8 1.8 2.3 2.0 1.8 1.7 1.4
Consolidated 22.1 24.9 22.1 24.5 24.0 24.9 21.2
[Reference information]
134.31 124.58Average exchangerate - EUR/JPY 125.63 129.78 140.42 140.35 134.10
17.5% 18.0%
Average exchangerate - USD/JPY 95.73 97.73 102.46 105.79 120.31 121.11 111.74
Overseas sales/ Net sales 19.0% 18.2% 19.1% 17.7% 21.0%
0.0%
5.0%
10.0%
15.0%
20.0%
25.0%
0.0
5.0
10.0
15.0
20.0
25.0
12
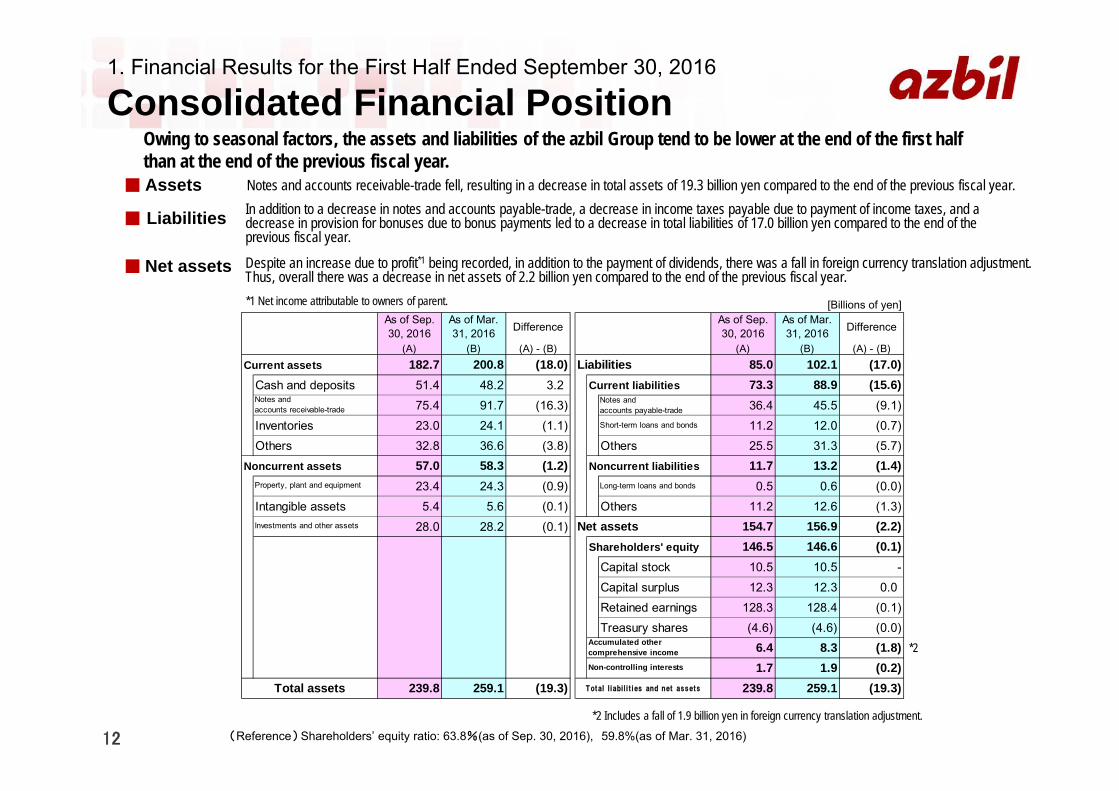
Owing to seasonal factors, the assets and liabilities of the azbil Group tend to be lower at the end of the first half than at the end of the previous fiscal year.
1. Financial Results for the First Half Ended September 30, 2016
Consolidated Financial Position
(Reference) Shareholders’ equity ratio: 63.8%(as of Sep. 30, 2016), 59.8%(as of Mar. 31, 2016)
■ Assets
■ Liabilities
■ Net assets
Notes and accounts receivable-trade fell, resulting in a decrease in total assets of 19.3 billion yen compared to the end of the previous fiscal year.In addition to a decrease in notes and accounts payable-trade, a decrease in income taxes payable due to payment of income taxes, and a decrease in provision for bonuses due to bonus payments led to a decrease in total liabilities of 17.0 billion yen compared to the end of the previous fiscal year.
Despite an increase due to profit*1 being recorded, in addition to the payment of dividends, there was a fall in foreign currency translation adjustment. Thus, overall there was a decrease in net assets of 2.2 billion yen compared to the end of the previous fiscal year.*1 Net income attributable to owners of parent.
*2 Includes a fall of 1.9 billion yen in foreign currency translation adjustment.
*2
[Billions of yen]As of Sep.30, 2016
As of Mar.31, 2016 Difference
As of Sep.30, 2016
As of Mar.31, 2016 Difference
(A) (B) (A) - (B) (A) (B) (A) - (B)Current assets 182.7 200.8 (18.0) Liabilities 85.0 102.1 (17.0)
Cash and deposits 51.4 48.2 3.2 Current liabilities 73.3 88.9 (15.6)75.4 91.7 (16.3) Notes and
accounts payable-trade 36.4 45.5 (9.1)Inventories 23.0 24.1 (1.1) Short-term loans and bonds 11.2 12.0 (0.7)Others 32.8 36.6 (3.8) Others 25.5 31.3 (5.7)
Noncurrent assets 57.0 58.3 (1.2) Noncurrent liabilities 11.7 13.2 (1.4)23.4 24.3 (0.9) Long-term loans and bonds 0.5 0.6 (0.0)
Intangible assets 5.4 5.6 (0.1) Others 11.2 12.6 (1.3)28.0 28.2 (0.1) Net assets 154.7 156.9 (2.2)
Shareholders' equity 146.5 146.6 (0.1)Capital stock 10.5 10.5 -Capital surplus 12.3 12.3 0.0Retained earnings 128.3 128.4 (0.1)Treasury shares (4.6) (4.6) (0.0)
6.4 8.3 (1.8)1.7 1.9 (0.2)
239.8 259.1 (19.3) 239.8 259.1 (19.3)
Notes andaccounts receivable-trade
Property, plant and equipment
Investments and other assets
Accumulated othercomprehensive income
Non-controlling interests
Total assets Total l iabi l i t ies and net assets
13
1. Financial Results for the First Half Ended September 30, 2016
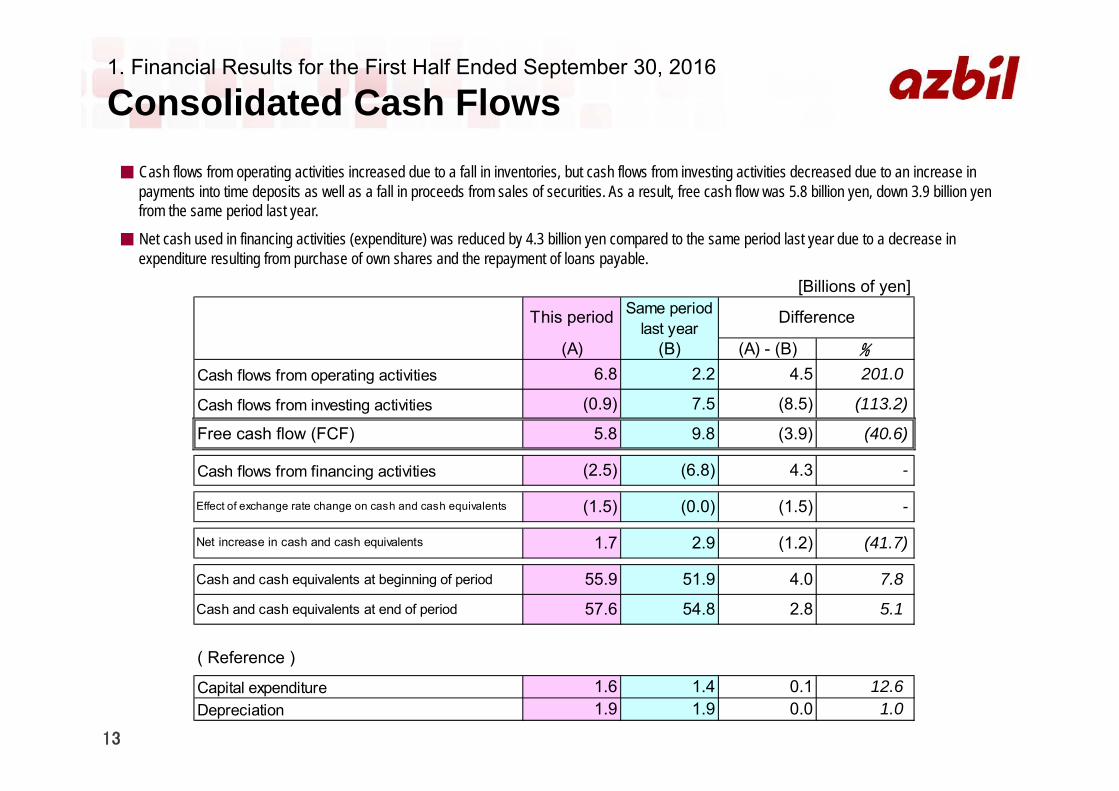
Consolidated Cash Flows■ Cash flows from operating activities increased due to a fall in inventories, but cash flows from investing activities decreased due to an increase in
payments into time deposits as well as a fall in proceeds from sales of securities. As a result, free cash flow was 5.8 billion yen, down 3.9 billion yen from the same period last year.
■ Net cash used in financing activities (expenditure) was reduced by 4.3 billion yen compared to the same period last year due to a decrease in expenditure resulting from purchase of own shares and the repayment of loans payable.
[Billions of yen]
This period Same periodlast year
Difference
(A) (B) (A) - (B) %
Cash flows from operating activities 6.8 2.2 4.5 201.0
Cash flows from investing activities (0.9) 7.5 (8.5) (113.2)
Free cash flow (FCF) 5.8 9.8 (3.9) (40.6)
Cash flows from financing activities (2.5) (6.8) 4.3 -
Effect of exchange rate change on cash and cash equivalents (1.5) (0.0) (1.5) -
Net increase in cash and cash equivalents 1.7 2.9 (1.2) (41.7)
Cash and cash equivalents at beginning of period 55.9 51.9 4.0 7.8
Cash and cash equivalents at end of period 57.6 54.8 2.8 5.1
( Reference )
Capital expenditure 1.6 1.4 0.1 12.6Depreciation 1.9 1.9 0.0 1.0

14
2. Financial Plan for the YearEnding March 31, 2017
15
2. Financial Plan for the Year Ending March 31, 2017
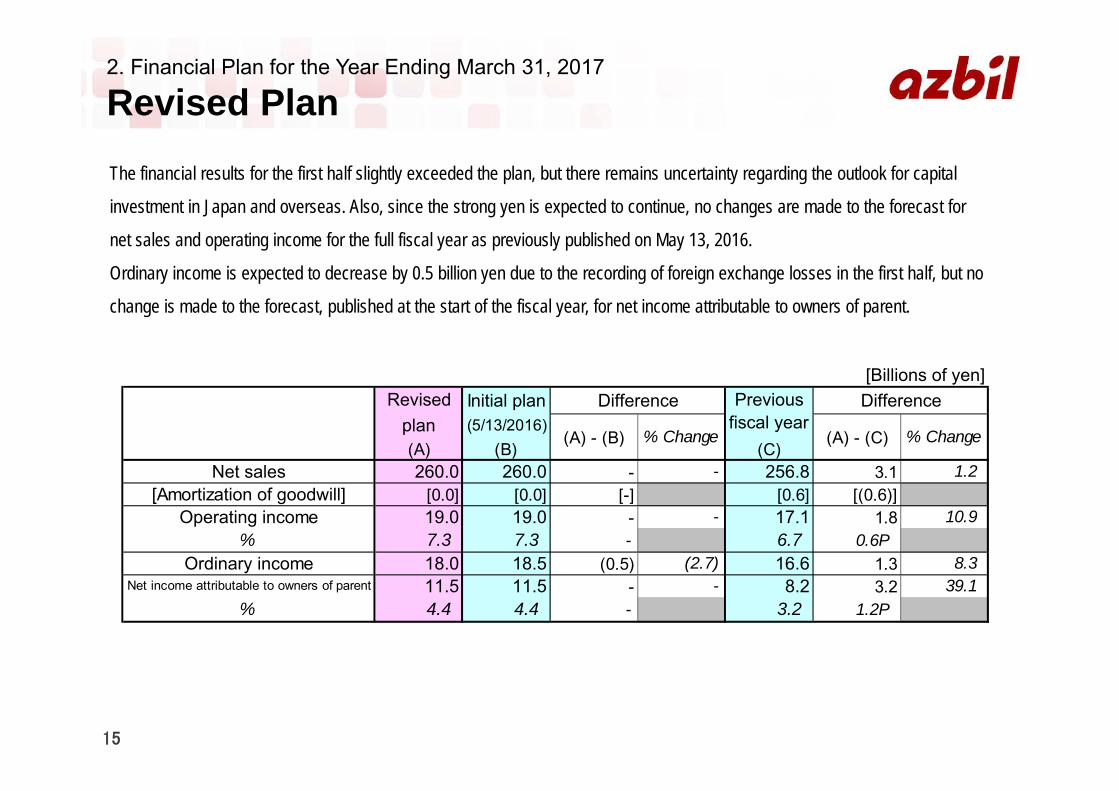
Revised PlanThe financial results for the first half slightly exceeded the plan, but there remains uncertainty regarding the outlook for capital
investment in Japan and overseas. Also, since the strong yen is expected to continue, no changes are made to the forecast for
net sales and operating income for the full fiscal year as previously published on May 13, 2016.
Ordinary income is expected to decrease by 0.5 billion yen due to the recording of foreign exchange losses in the first half, but no
change is made to the forecast, published at the start of the fiscal year, for net income attributable to owners of parent.
[Billions of yen]Initial plan Difference Difference
plan (5/13/2016)(A) (B) (C)
Net sales 260.0 260.0 - - 256.8 3.1 1.2[Amortization of goodwill] [0.0] [0.0] [-] [0.6] [(0.6)]
Operating income 19.0 19.0 - - 17.1 1.8 10.9% 7.3 7.3 - 6.7 0.6P
Ordinary income 18.0 18.5 (0.5) (2.7) 16.6 1.3 8.3Net income attributable to owners of parent 11.5 11.5 - - 8.2 3.2 39.1
% 4.4 4.4 - 3.2 1.2P
Revised Previousfiscal year
(A) - (B) % Change (A) - (C) % Change
16
2. Financial Plan for the Year Ending March 31, 2017
Revised Plan by Segment [1]
[Billions of yen]Initial plan Difference Difference
plan (5/13/2016)
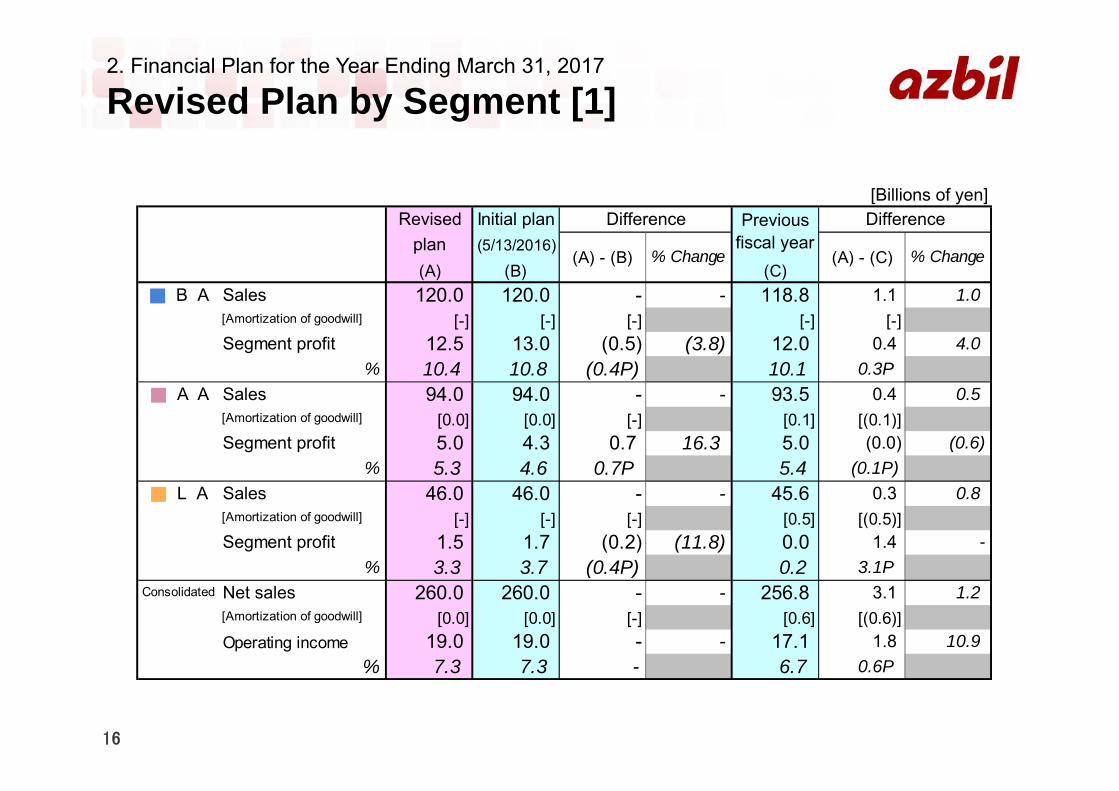
(A) (B) (C)■ B A Sales 120.0 120.0 - - 118.8 1.1 1.0
[Amortization of goodwill] [-] [-] [-] [-] [-]Segment profit 12.5 13.0 (0.5) (3.8) 12.0 0.4 4.0
% 10.4 10.8 (0.4P) 10.1 0.3P■ A A Sales 94.0 94.0 - - 93.5 0.4 0.5
[Amortization of goodwill] [0.0] [0.0] [-] [0.1] [(0.1)]Segment profit 5.0 4.3 0.7 16.3 5.0 (0.0) (0.6)
% 5.3 4.6 0.7P 5.4 (0.1P)■ L A Sales 46.0 46.0 - - 45.6 0.3 0.8
[Amortization of goodwill] [-] [-] [-] [0.5] [(0.5)]Segment profit 1.5 1.7 (0.2) (11.8) 0.0 1.4 -
% 3.3 3.7 (0.4P) 0.2 3.1PConsolidated Net sales 260.0 260.0 - - 256.8 3.1 1.2
[Amortization of goodwill] [0.0] [0.0] [-] [0.6] [(0.6)]Operating income 19.0 19.0 - - 17.1 1.8 10.9
% 7.3 7.3 - 6.7 0.6P
Revised Previousfiscal year
(A) - (B) % Change (A) - (C) % Change
17
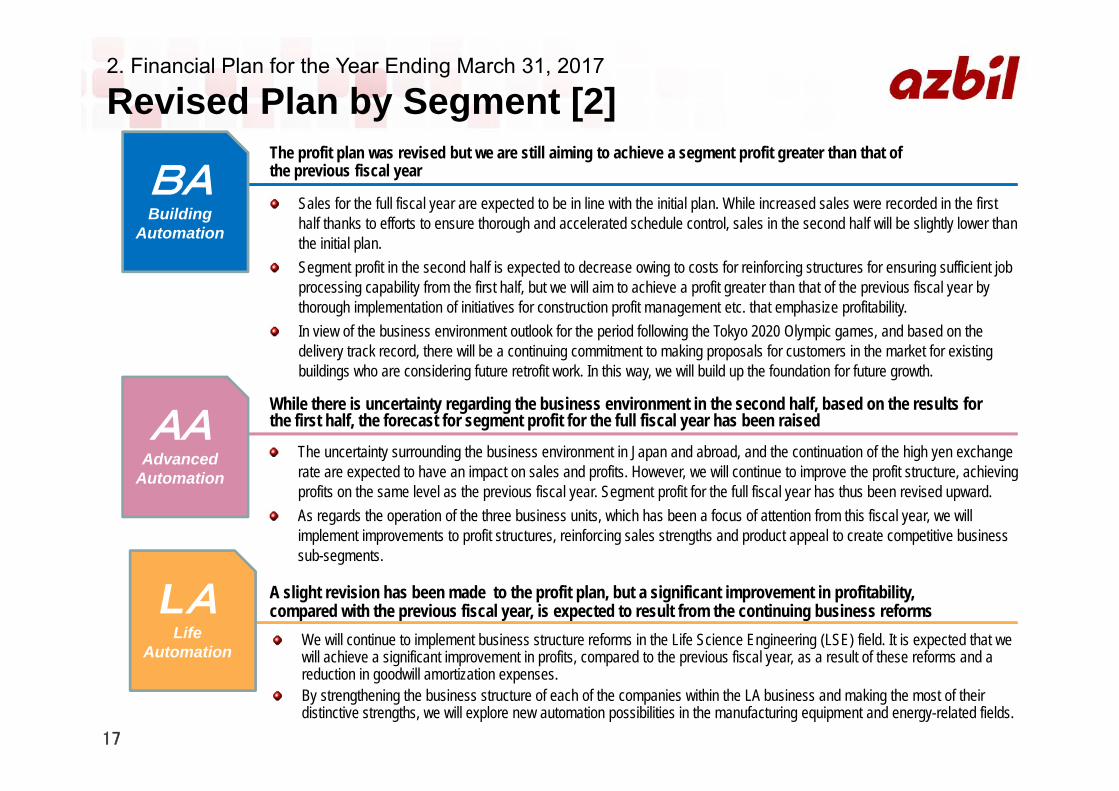
The profit plan was revised but we are still aiming to achieve a segment profit greater than that of the previous fiscal year
Sales for the full fiscal year are expected to be in line with the initial plan. While increased sales were recorded in the first half thanks to efforts to ensure thorough and accelerated schedule control, sales in the second half will be slightly lower thanthe initial plan.Segment profit in the second half is expected to decrease owing to costs for reinforcing structures for ensuring sufficient job processing capability from the first half, but we will aim to achieve a profit greater than that of the previous fiscal year by thorough implementation of initiatives for construction profit management etc. that emphasize profitability.In view of the business environment outlook for the period following the Tokyo 2020 Olympic games, and based on the delivery track record, there will be a continuing commitment to making proposals for customers in the market for existing buildings who are considering future retrofit work. In this way, we will build up the foundation for future growth.
While there is uncertainty regarding the business environment in the second half, based on the results for the first half, the forecast for segment profit for the full fiscal year has been raised
A slight revision has been made to the profit plan, but a significant improvement in profitability, compared with the previous fiscal year, is expected to result from the continuing business reforms
The uncertainty surrounding the business environment in Japan and abroad, and the continuation of the high yen exchange rate are expected to have an impact on sales and profits. However, we will continue to improve the profit structure, achieving profits on the same level as the previous fiscal year. Segment profit for the full fiscal year has thus been revised upward.As regards the operation of the three business units, which has been a focus of attention from this fiscal year, we will implement improvements to profit structures, reinforcing sales strengths and product appeal to create competitive business sub-segments.
We will continue to implement business structure reforms in the Life Science Engineering (LSE) field. It is expected that we will achieve a significant improvement in profits, compared to the previous fiscal year, as a result of these reforms and a reduction in goodwill amortization expenses.By strengthening the business structure of each of the companies within the LA business and making the most of their distinctive strengths, we will explore new automation possibilities in the manufacturing equipment and energy-related fields.
2. Financial Plan for the Year Ending March 31, 2017
Revised Plan by Segment [2]
BABuilding
Automation
AAAdvanced
Automation
LALife
Automation
18
2. Financial Plan for the Year Ending March 31, 2017
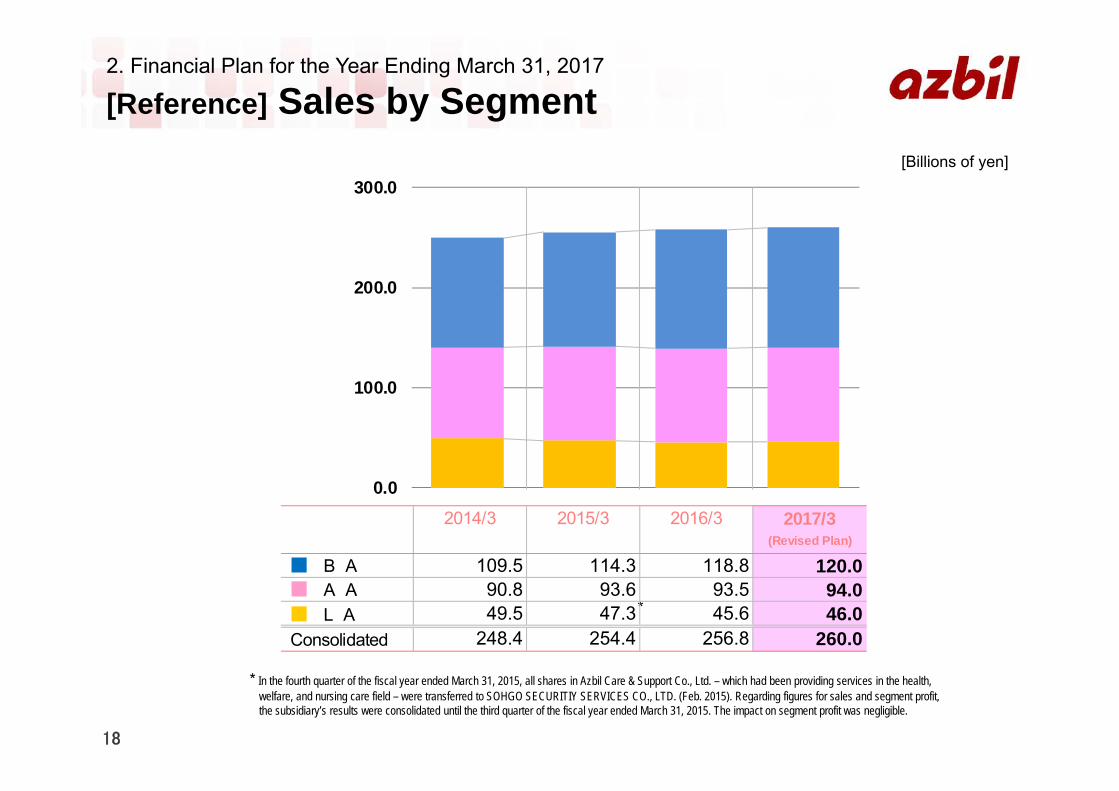
[Reference] Sales by Segment[Billions of yen]
*
* In the fourth quarter of the fiscal year ended March 31, 2015, all shares in Azbil Care & Support Co., Ltd. – which had been providing services in the health, welfare, and nursing care field – were transferred to SOHGO SECURITIY SERVICES CO., LTD. (Feb. 2015). Regarding figures for sales and segment profit, the subsidiary’s results were consolidated until the third quarter of the fiscal year ended March 31, 2015. The impact on segment profit was negligible.
2014/3 2015/3 2016/3 2017/3(Revised Plan)
■ B A 109.5 114.3 118.8 120.0 ■ A A 90.8 93.6 93.5 94.0 ■ L A 49.5 47.3 45.6 46.0 Consolidated 248.4 254.4 256.8 260.0
0.0
100.0
200.0
300.0

19
[Billions of yen]
2. Financial Plan for the Year Ending March 31, 2017
[Reference] Segment Profit (Operating Income)
2014/3 2015/3 2016/3 2017/3(Revised Plan)
■ B A 10.5 12.2 12.0 12.5 ■ A A 3.9 5.0 5.0 5.0 ■ L A (0.6) (1.9) 0.0 1.5 Consolidated 13.9 15.3 17.1 19.0
(5.0)
0.0
5.0
10.0
15.0
20.0
25.0

20
3. Return to Shareholders

21
3. Return to Shareholders
Dividend Plan
We place great importance on the distribution of profits to shareholders, and would like to maintain stable dividends while striving to increase its dividends payout, taking into account comprehensively its consolidated performance, levels of ROE (Return On Equity), DOE (Dividend On Equity), as well as retained earnings for strengthening the corporate structure and developing future business.
Annual dividend: 74 yen per share(Ordinary dividend raised by 2 yen, additional commemorative dividend of 5 yen)
Dividend plan for the fiscal year ending March 2017→No change from the initial plan
[Basic policy]
For FY2016 our intention is to increase the distribution of profits to our shareholders by raising the dividend level; we therefore plan to raise the ordinary dividend by 2 yen per share. Also, to mark the 110th anniversary of our founding and the 10th anniversary of our new name, “azbil”, we plan to issue a commemorative dividend of 5 yen per share.
(Reference) Dividend yield: 2.4% (as of September 30, 2016)
Dividends for the year ending March 2017 (interim/year-end) are planned as follows.
Interim Year-end Interim Year-end Dividend per share [ Yen ] 33.5 33.5 37.0 37.0(Plan)
Payout ratio
Dividend on equity (DOE)
59.4% 47.1%
3.1% 3.4%
FY2015 FY2016

22
4. Toward Future Business Development
23
4. Toward Future Business DevelopmentProgress of the Medium-term Plan (FY2013-FY2016) [1]
Z
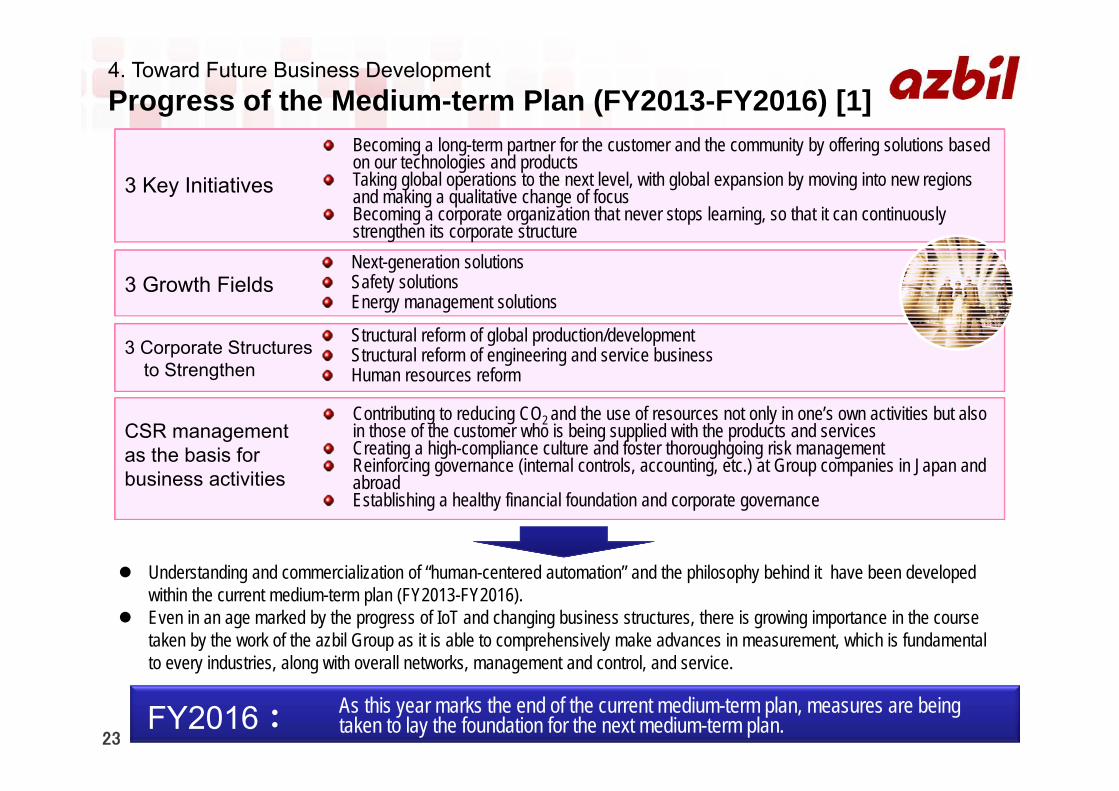
Becoming a long-term partner for the customer and the community by offering solutions based on our technologies and productsTaking global operations to the next level, with global expansion by moving into new regions and making a qualitative change of focusBecoming a corporate organization that never stops learning, so that it can continuously strengthen its corporate structure
3 Key Initiatives
3 Growth FieldsNext-generation solutionsSafety solutionsEnergy management solutions
Structural reform of global production/developmentStructural reform of engineering and service businessHuman resources reform
3 Corporate Structures to Strengthen
Understanding and commercialization of “human-centered automation” and the philosophy behind it have been developed within the current medium-term plan (FY2013-FY2016).
Even in an age marked by the progress of IoT and changing business structures, there is growing importance in the course taken by the work of the azbil Group as it is able to comprehensively make advances in measurement, which is fundamental to every industries, along with overall networks, management and control, and service.
As this year marks the end of the current medium-term plan, measures are being taken to lay the foundation for the next medium-term plan.FY2016:
Contributing to reducing CO2 and the use of resources not only in one’s own activities but also in those of the customer who is being supplied with the products and servicesCreating a high-compliance culture and foster thoroughgoing risk managementReinforcing governance (internal controls, accounting, etc.) at Group companies in Japan and abroadEstablishing a healthy financial foundation and corporate governance
CSR management as the basis for business activities
24
4. Toward Future Business DevelopmentProgress of the Medium-term Plan (FY2013-FY2016) [2]
Bus
ines
s se
gmen
tG
roup
-wid
efu
nctio
nsG
roup
man
agem
ent
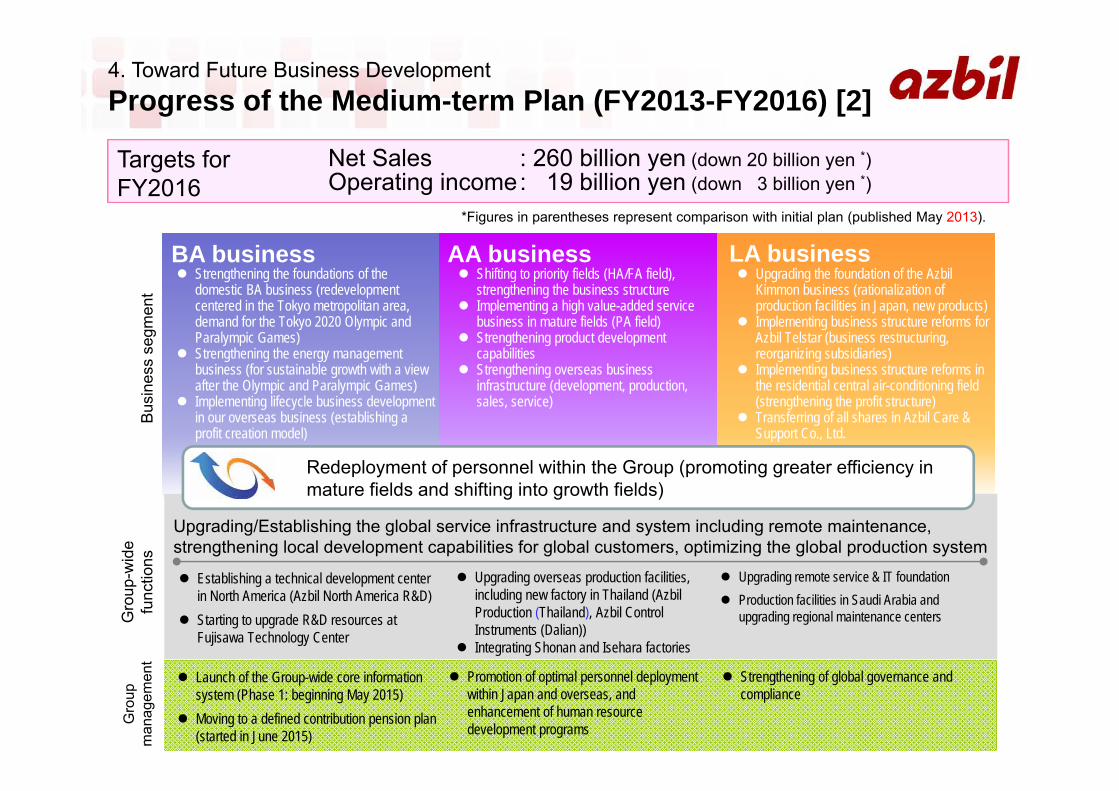
AA business Strengthening the foundations of the
domestic BA business (redevelopment centered in the Tokyo metropolitan area, demand for the Tokyo 2020 Olympic and Paralympic Games)
Strengthening the energy management business (for sustainable growth with a view after the Olympic and Paralympic Games)
Implementing lifecycle business development in our overseas business (establishing a profit creation model)
Establishing a technical development center in North America (Azbil North America R&D)
Starting to upgrade R&D resources at Fujisawa Technology Center
Upgrading/Establishing the global service infrastructure and system including remote maintenance, strengthening local development capabilities for global customers, optimizing the global production system
Redeployment of personnel within the Group (promoting greater efficiency in mature fields and shifting into growth fields)
Upgrading overseas production facilities, including new factory in Thailand (AzbilProduction (Thailand), Azbil Control Instruments (Dalian))
Integrating Shonan and Isehara factories
Upgrading remote service & IT foundation Production facilities in Saudi Arabia and
upgrading regional maintenance centers
Launch of the Group-wide core information system (Phase 1: beginning May 2015)
Moving to a defined contribution pension plan (started in June 2015)
Promotion of optimal personnel deployment within Japan and overseas, and enhancement of human resource development programs
Strengthening of global governance and compliance
Shifting to priority fields (HA/FA field), strengthening the business structure
Implementing a high value-added service business in mature fields (PA field)
Strengthening product development capabilities
Strengthening overseas business infrastructure (development, production, sales, service)
Upgrading the foundation of the AzbilKimmon business (rationalization of production facilities in Japan, new products)
Implementing business structure reforms for Azbil Telstar (business restructuring, reorganizing subsidiaries)
Implementing business structure reforms in the residential central air-conditioning field (strengthening the profit structure)
Transferring of all shares in Azbil Care & Support Co., Ltd.
BA business LA business
Net Sales : 260 billion yen (down 20 billion yen *)Operating income: 19 billion yen (down 3 billion yen *)
Targets for FY2016
*Figures in parentheses represent comparison with initial plan (published May 2013).
25
4. Toward Future Business Development
Achievements and Strategies for Each Segment
BABuilding
Automation
AAAdvanced
Automation
LALife
Automation
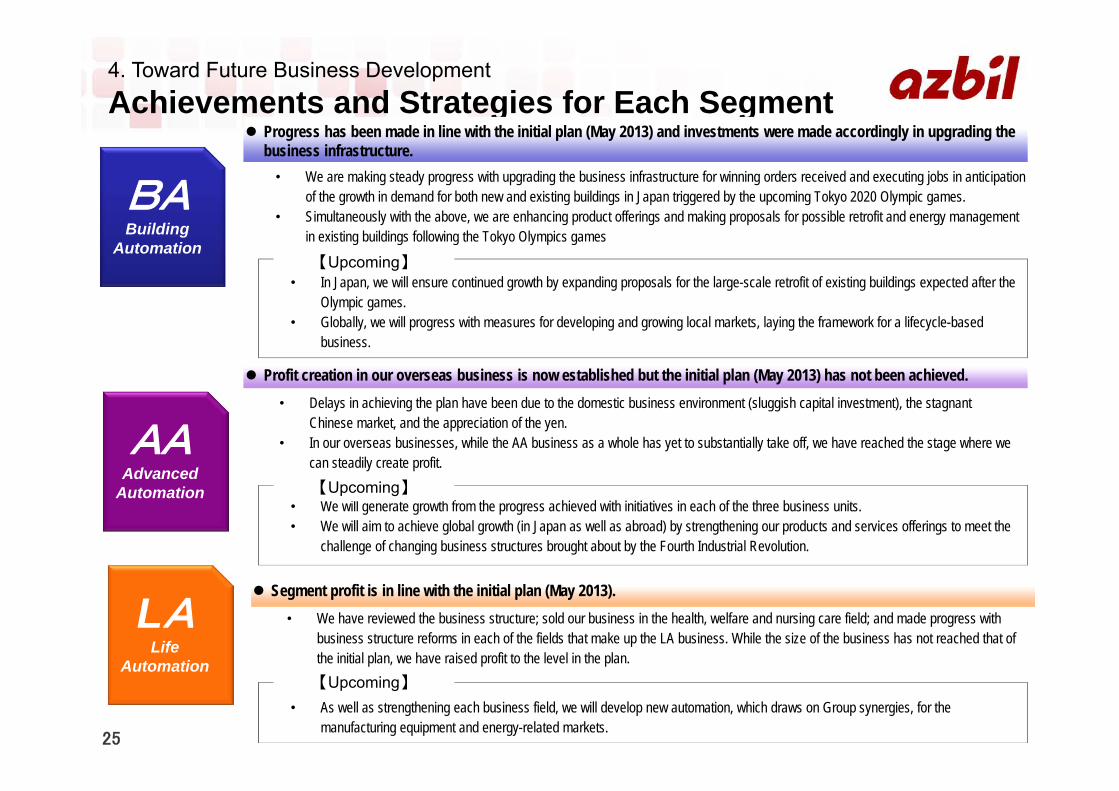
Progress has been made in line with the initial plan (May 2013) and investments were made accordingly in upgrading the business infrastructure.
【Upcoming】
Profit creation in our overseas business is now established but the initial plan (May 2013) has not been achieved.
• We are making steady progress with upgrading the business infrastructure for winning orders received and executing jobs in anticipation of the growth in demand for both new and existing buildings in Japan triggered by the upcoming Tokyo 2020 Olympic games.
• Simultaneously with the above, we are enhancing product offerings and making proposals for possible retrofit and energy management in existing buildings following the Tokyo Olympics games
• Delays in achieving the plan have been due to the domestic business environment (sluggish capital investment), the stagnant Chinese market, and the appreciation of the yen.
• In our overseas businesses, while the AA business as a whole has yet to substantially take off, we have reached the stage where we can steadily create profit.
Segment profit is in line with the initial plan (May 2013).• We have reviewed the business structure; sold our business in the health, welfare and nursing care field; and made progress with
business structure reforms in each of the fields that make up the LA business. While the size of the business has not reached that of the initial plan, we have raised profit to the level in the plan.
• We will generate growth from the progress achieved with initiatives in each of the three business units.• We will aim to achieve global growth (in Japan as well as abroad) by strengthening our products and services offerings to meet the
challenge of changing business structures brought about by the Fourth Industrial Revolution.
• As well as strengthening each business field, we will develop new automation, which draws on Group synergies, for the manufacturing equipment and energy-related markets.
【Upcoming】
【Upcoming】
• In Japan, we will ensure continued growth by expanding proposals for the large-scale retrofit of existing buildings expected after the Olympic games.
• Globally, we will progress with measures for developing and growing local markets, laying the framework for a lifecycle-based business.
26
4. Toward Future Business DevelopmentAchievements and Strategies for Strengthening the Corporate Structure
Long-term partner for the customer
and the community
(utilizing our core of technology and
products)
Global development
(regional expansion and
qualitative change of focus)
A corporate organization that
never stops learning
(continual strengthening of
the corporate structure)
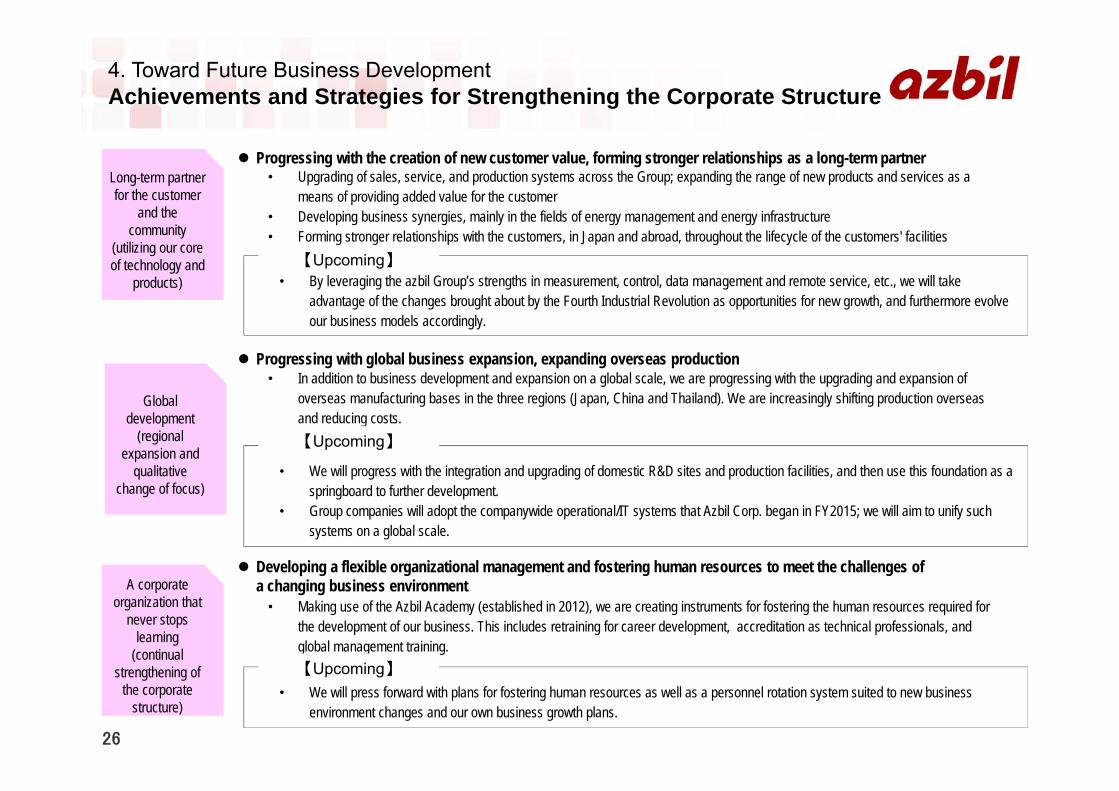
Progressing with the creation of new customer value, forming stronger relationships as a long-term partner
• By leveraging the azbil Group’s strengths in measurement, control, data management and remote service, etc., we will take advantage of the changes brought about by the Fourth Industrial Revolution as opportunities for new growth, and furthermore evolve our business models accordingly.
• Upgrading of sales, service, and production systems across the Group; expanding the range of new products and services as a means of providing added value for the customer
• Developing business synergies, mainly in the fields of energy management and energy infrastructure• Forming stronger relationships with the customers, in Japan and abroad, throughout the lifecycle of the customers' facilities
Progressing with global business expansion, expanding overseas production
• We will progress with the integration and upgrading of domestic R&D sites and production facilities, and then use this foundation as a springboard to further development.
• Group companies will adopt the companywide operational/IT systems that Azbil Corp. began in FY2015; we will aim to unify such systems on a global scale.
• In addition to business development and expansion on a global scale, we are progressing with the upgrading and expansion of overseas manufacturing bases in the three regions (Japan, China and Thailand). We are increasingly shifting production overseas and reducing costs.
Developing a flexible organizational management and fostering human resources to meet the challenges of a changing business environment
• We will press forward with plans for fostering human resources as well as a personnel rotation system suited to new business environment changes and our own business growth plans.
• Making use of the Azbil Academy (established in 2012), we are creating instruments for fostering the human resources required for the development of our business. This includes retraining for career development, accreditation as technical professionals, and global management training.
【Upcoming】
【Upcoming】
【Upcoming】
27
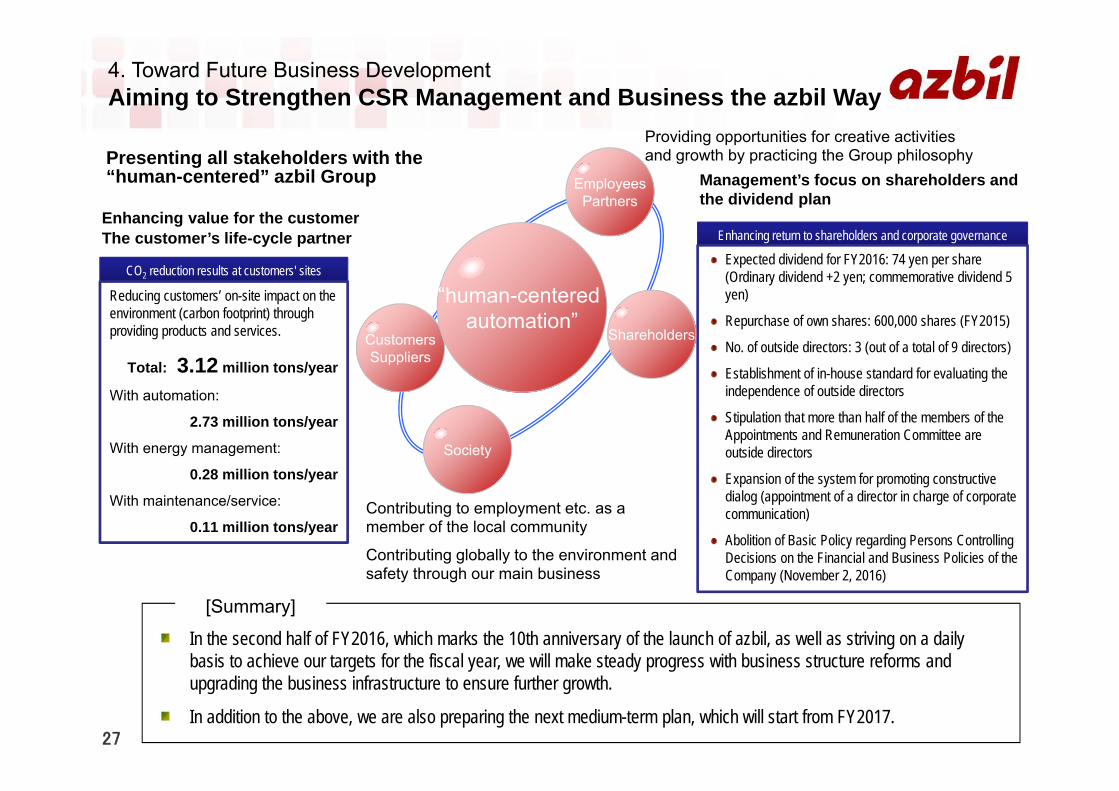
4. Toward Future Business DevelopmentAiming to Strengthen CSR Management and Business the azbil Way
Management’s focus on shareholders and the dividend plan
In the second half of FY2016, which marks the 10th anniversary of the launch of azbil, as well as striving on a daily basis to achieve our targets for the fiscal year, we will make steady progress with business structure reforms and upgrading the business infrastructure to ensure further growth.
In addition to the above, we are also preparing the next medium-term plan, which will start from FY2017.
Enhancing return to shareholders and corporate governance
[Summary]
CO2 reduction results at customers' sites Expected dividend for FY2016: 74 yen per share(Ordinary dividend +2 yen; commemorative dividend 5 yen)
Repurchase of own shares: 600,000 shares (FY2015)
No. of outside directors: 3 (out of a total of 9 directors)
Establishment of in-house standard for evaluating the independence of outside directors
Stipulation that more than half of the members of the Appointments and Remuneration Committee are outside directors
Expansion of the system for promoting constructive dialog (appointment of a director in charge of corporate communication)
Abolition of Basic Policy regarding Persons Controlling Decisions on the Financial and Business Policies of the Company (November 2, 2016)
Reducing customers’ on-site impact on the environment (carbon footprint) through providing products and services.
Total: 3.12 million tons/year
With automation:
2.73 million tons/year
With energy management:
0.28 million tons/year
With maintenance/service:
0.11 million tons/year
EmployeesPartners
Society
CustomersSuppliers
“human-centered automation”
Shareholders
Providing opportunities for creative activities and growth by practicing the Group philosophy
Enhancing value for the customerThe customer’s life-cycle partner
Presenting all stakeholders with the “human-centered” azbil Group
Contributing to employment etc. as a member of the local community
Contributing globally to the environment and safety through our main business

28
Relevant Information
29
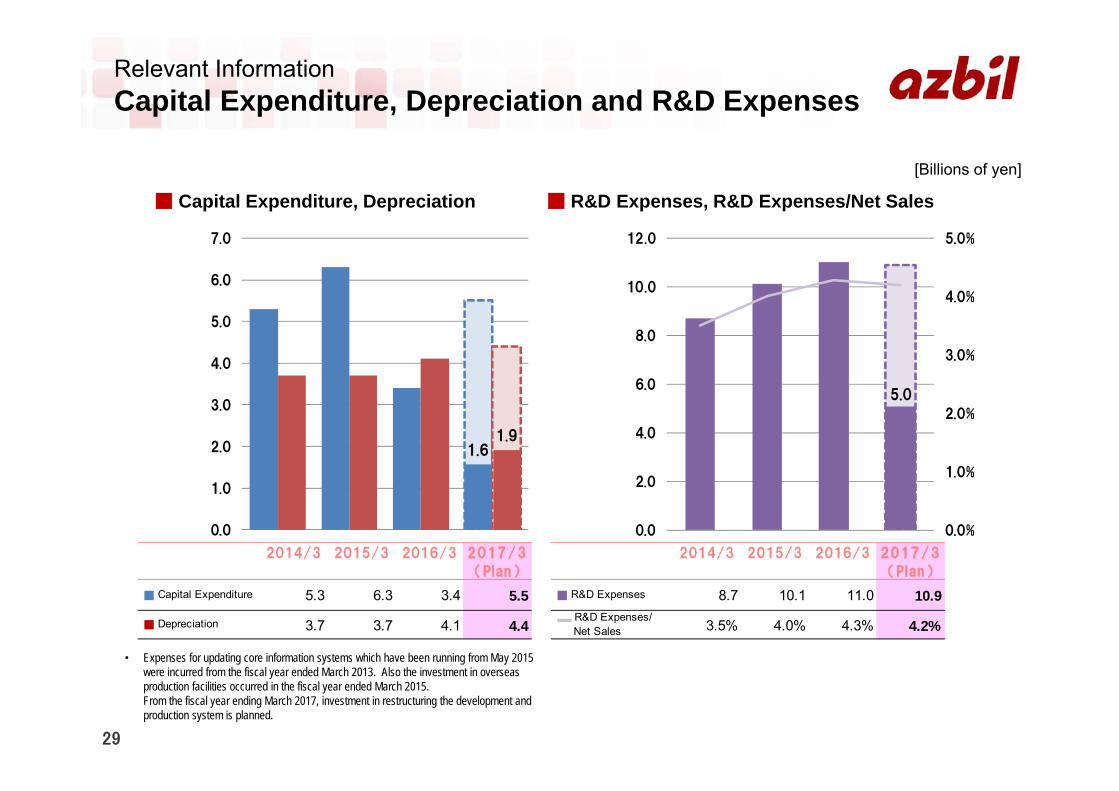
Relevant InformationCapital Expenditure, Depreciation and R&D Expenses
■ Capital Expenditure, Depreciation ■ R&D Expenses, R&D Expenses/Net Sales
[Billions of yen]
• Expenses for updating core information systems which have been running from May 2015 were incurred from the fiscal year ended March 2013. Also the investment in overseas production facilities occurred in the fiscal year ended March 2015.From the fiscal year ending March 2017, investment in restructuring the development and production system is planned.
2014/3 2015/3 2016/3 2017/3 2014/3 2015/3 2016/3 2017/3
(Plan) (Plan)
■ Capital Expenditure 5.3 6.3 3.4 5.5 ■ R&D Expenses 8.7 10.1 11.0 10.9
■ Depreciation 3.7 3.7 4.1 4.4 R&D Expenses/ Net Sales 3.5% 4.0% 4.3% 4.2%
0.0
1.0
2.0
3.0
4.0
5.0
6.0
7.0
0.0%
1.0%
2.0%
3.0%
4.0%
5.0%
0.0
2.0
4.0
6.0
8.0
10.0
12.0
1.61.9
5.0
30
azbil Group PhilosophyTo realize safety, comfort, and fulfillment in people’s lives and contribute to global environmental preservation through “human-centered automation”
Yamatake for 100 years, azbil for 10 years. Together 110 years.
Through all of this time the azbil Group has put human happiness first
with “human-centered automation.” We are determined to work closely
with our customers in the future as well, using our measurement and
control technologies as the basis for ever greater value creation.
Azbil Corporation celebrates its 110th anniversary in 2016.