A First-Light AO system for LBT AGW Unit : a conceptual design

Human Caused Global Warming

Human Caused Global Warming
The Biggest Deception in History


Facts no longer matter. We simply decide how we want to see the world and then go out and find experts and evidence to back our beliefs.
True Enough: Learning to Live in a Post-Fact Society - Farhad Manjoo

Composite satellite coverage showing snow cover on February 4, 2011

Climate Change

Climate Change• They were talking about
global warming, then it was climate change. Now it is climate disruption. Why?

Global Temperature and CO2 record 1995 - 2009Source; Science and Public Policy Centre

Global Temperature and CO2 record 1995 - 2009Source; Science and Public Policy Centre
Kevin Trenberth; IPCC member, leaked email Wed, 14 Oct 2009, “The fact is that we can’t account for the lack of warming at the moment and it is a travesty that we can’t.”


IPCC “Projections” Compared to actual trend

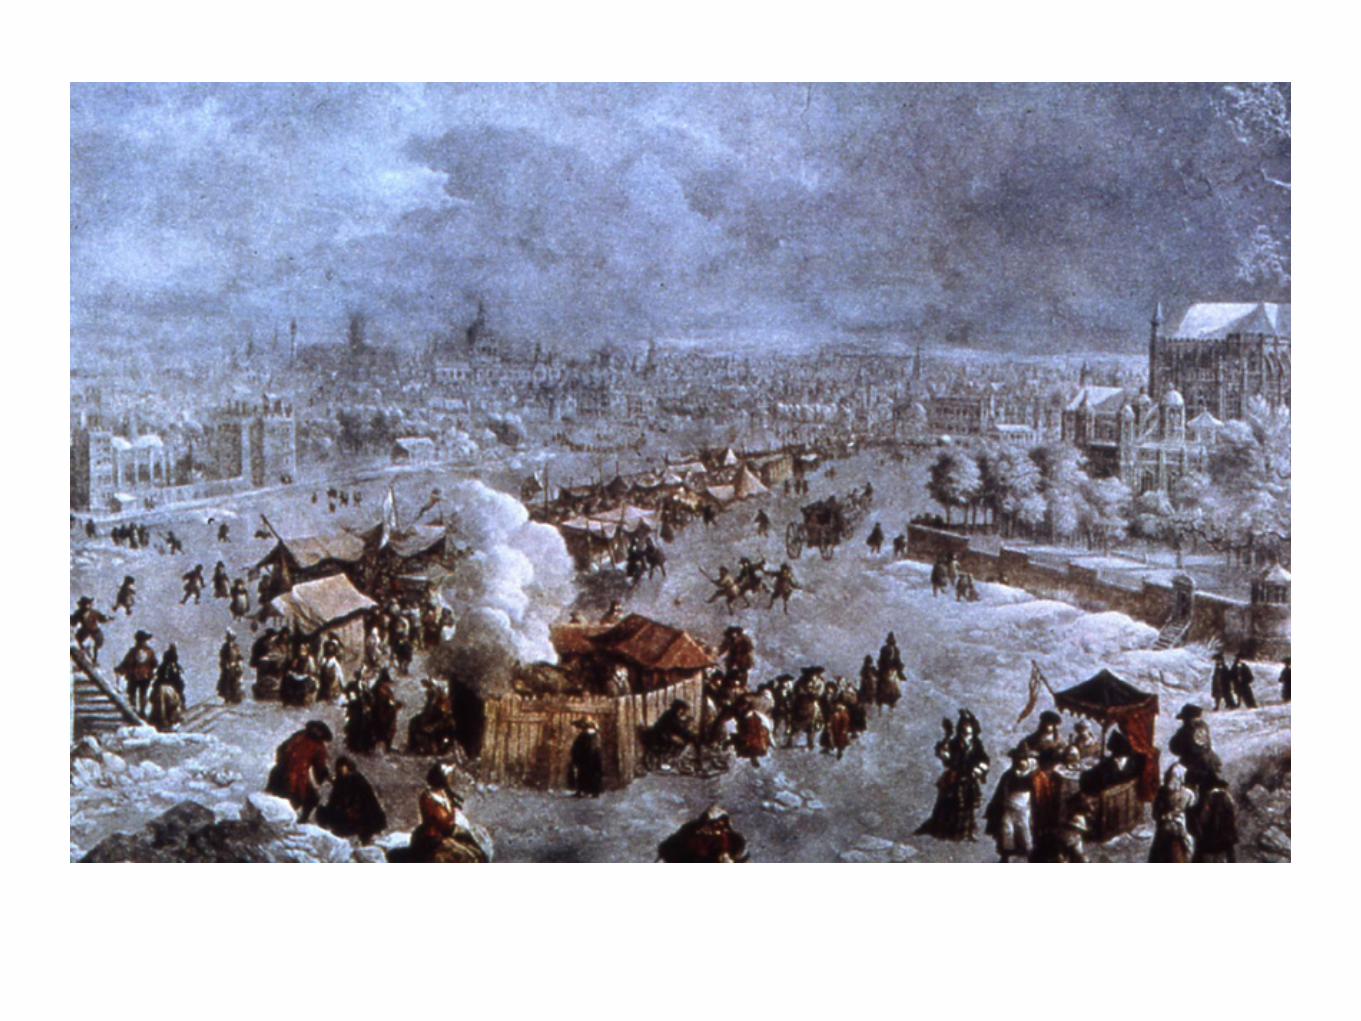
L’Anse Aux Meadows


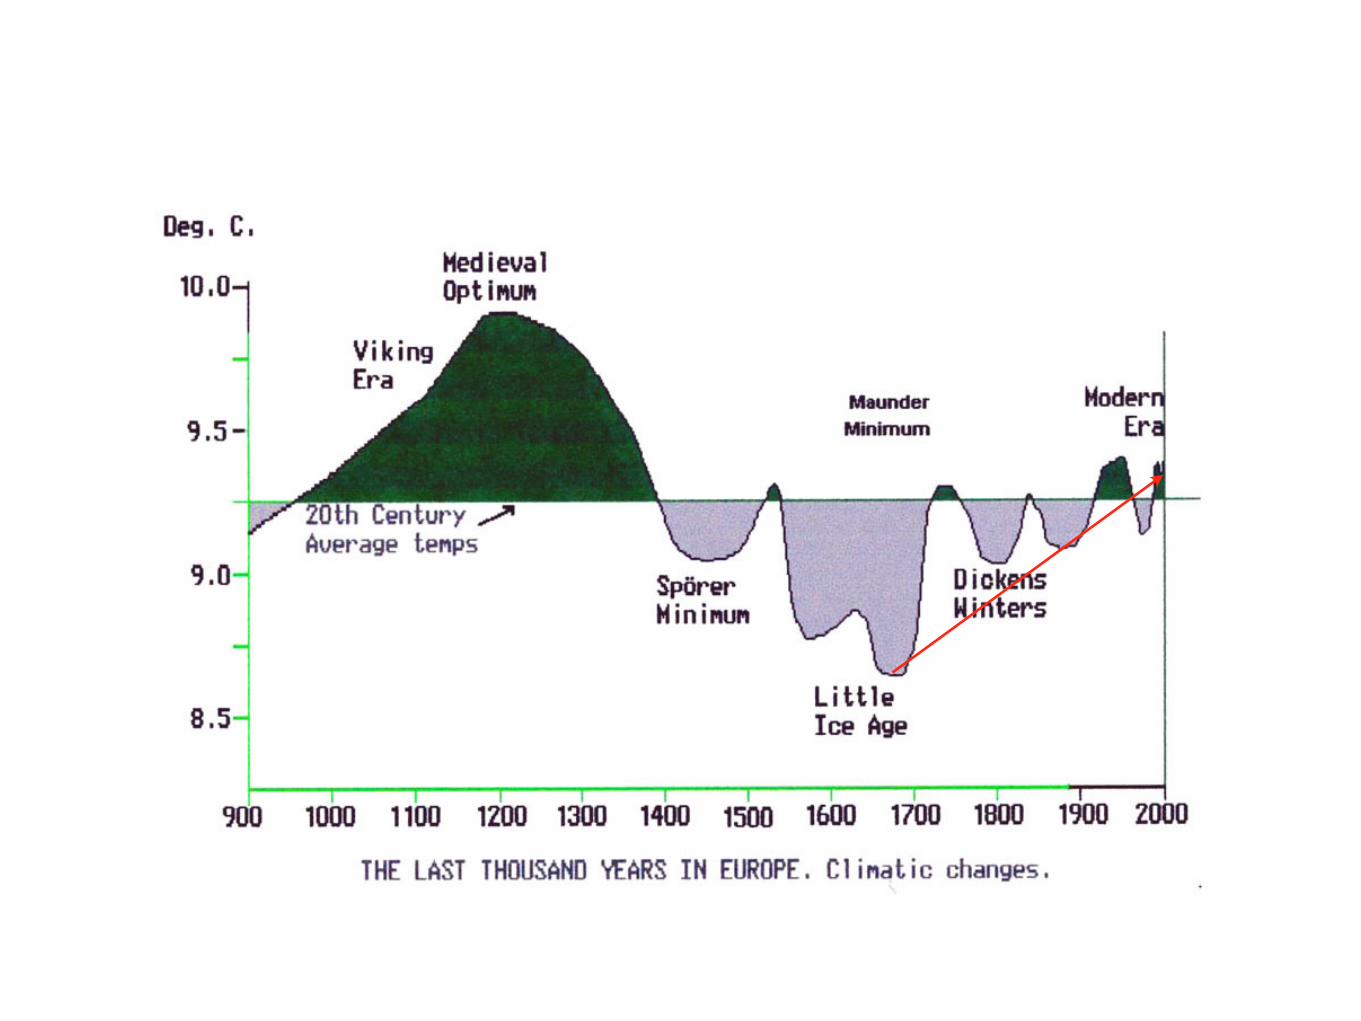

“What to do about the MWP”• D. Deming, Science 1995
“With the publication of the article in Science [in 1995], I gained significant
credibility in the community of scientists working on climate change.
They thought I was one of them, someone who would pervert science in
the service of social and political causes. So one of them let his guard
down. A major person working in the area of climate change and global
warming sent me an astonishing email that said “
Source: Presentation by S McIntyre At Conference Stockholm Sweden, September 9 2006
We have to get rid of the Medieval Warm Period.”


Scientific Method

Scientific Method
Propose an hypothesis based on set of assumptions; then test the assumptions

Scientific Method
Propose an hypothesis based on set of assumptions; then test the assumptions
Anthropogenic Global Warming (AGW) Hypothesis; Assumptions

Scientific Method
Propose an hypothesis based on set of assumptions; then test the assumptions
Anthropogenic Global Warming (AGW) Hypothesis; Assumptions
1. CO2 is a greenhouse gas delays heat escape to space

Scientific Method
Propose an hypothesis based on set of assumptions; then test the assumptions
Anthropogenic Global Warming (AGW) Hypothesis; Assumptions
1. CO2 is a greenhouse gas delays heat escape to space
2. CO2 will increase because of human activity

Scientific Method
Propose an hypothesis based on set of assumptions; then test the assumptions
Anthropogenic Global Warming (AGW) Hypothesis; Assumptions
1. CO2 is a greenhouse gas delays heat escape to space
2. CO2 will increase because of human activity
3. CO2 causes temperature increase

Richard Lindzen noted that with the anthropogenic global warming (AGW) hypothesis the consensus was
reached before the research had even begun.
Richard Lindzen noted that with the anthropogenic global warming (AGW) hypothesis the consensus was
reached before the research had even begun.
Karl Popper: “One can sum up all this by saying that the criterion of the scientific status of a theory is its falsifiability, or refutability, or
testability.”
Richard Lindzen noted that with the anthropogenic global warming (AGW) hypothesis the consensus was
reached before the research had even begun.
Scientists who tried to perform their skeptical role were attacked as skeptics. The Scientific Method was
thwarted.
Karl Popper: “One can sum up all this by saying that the criterion of the scientific status of a theory is its falsifiability, or refutability, or
testability.”
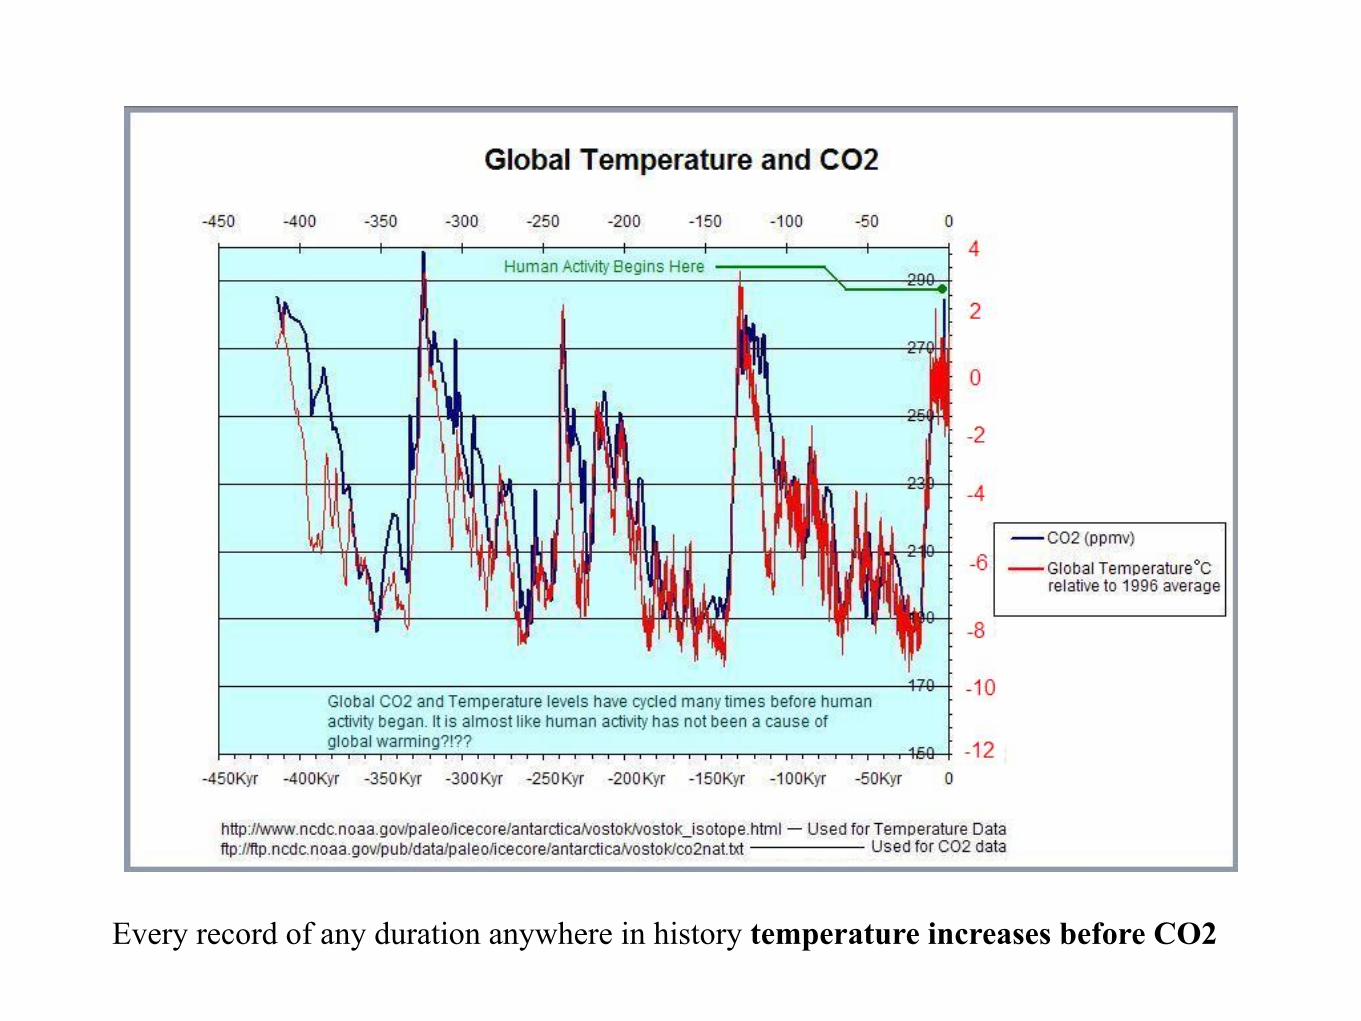
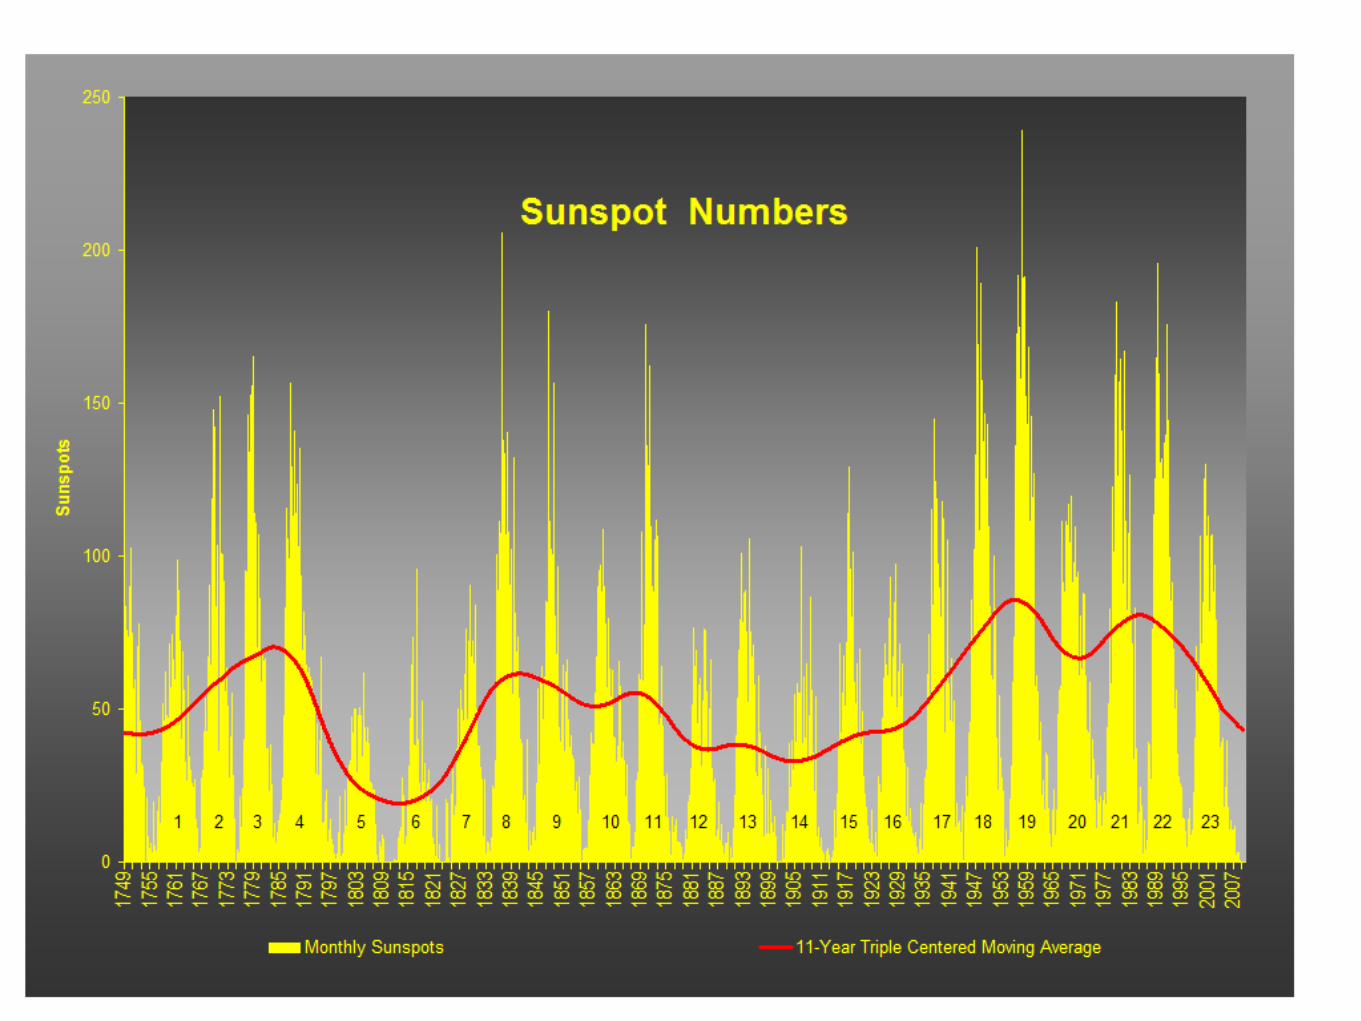
Every record of any duration anywhere in history temperature increases before CO2

Simple Systems Diagram of Climate ComplexitySource: After Briggs Smithson and Ball, 2001

Motive?
• Isn’t the only hope for the planet that the industrialized nations collapse? Isn’t it our responsibility to bring that
about?
• Maurice Strong; Head of the 1992 Earth Summit in Rio and Executive Officer for Reform in the Office of the Secretary General of the UN.
• Quote from Junkscience.com

Note that the United Nations Framework Convention on Climate Change (UNFCCC), in its Article 1, defines climate change as: ‘a change of climate which is attributed directly or indirectly to human activity that alters the composition of the global atmosphere and which is in addition to natural climate variability observed over comparable time periods’. The UNFCCC thus makes a distinction between climate change attributable to human activities altering the atmospheric composition, and climate variability attributable to natural causes.Source: http://www.ipcc.ch/pdf/assessment-report/ar4/syr/ar4_syr_appendix.pdf

Note that the United Nations Framework Convention on Climate Change (UNFCCC), in its Article 1, defines climate change as: ‘a change of climate which is attributed directly or indirectly to human activity that alters the composition of the global atmosphere and which is in addition to natural climate variability observed over comparable time periods’. The UNFCCC thus makes a distinction between climate change attributable to human activities altering the atmospheric composition, and climate variability attributable to natural causes.Source: http://www.ipcc.ch/pdf/assessment-report/ar4/syr/ar4_syr_appendix.pdf
But if you don’t know how much it varies naturally you cannot determine the human effect.

Source; IPCC 2001 Working Group I Report: The Physical Science
IPCC: Climate Forcings; 2001

Source; IPCC 2001 Working Group I Report: The Physical Science
IPCC: Climate Forcings; 2001

Source; IPCC 2001 Working Group I Report: The Physical Science
IPCC: Climate Forcings; 2001
Level of Scientific Understanding

Source; IPCC 2001 Working Group I Report: The Physical Science
IPCC: Climate Forcings; 2001
Level of Scientific Understanding

Source; IPCC 2001 Working Group I Report: The Physical Science
IPCC: Climate Forcings; 2001
1.5 Watts per square meter
Level of Scientific Understanding

Global Albedo change1984 – 2004. Error bars due to seasonal variability of 15-20%.
The red line is the IPCC estimated GHG forcing for 100 years. Source: http://www.skepticalscience.com/earth-albedo-effect.htm

Source: Dr. F.Singer, Science and Environmental Policy Project
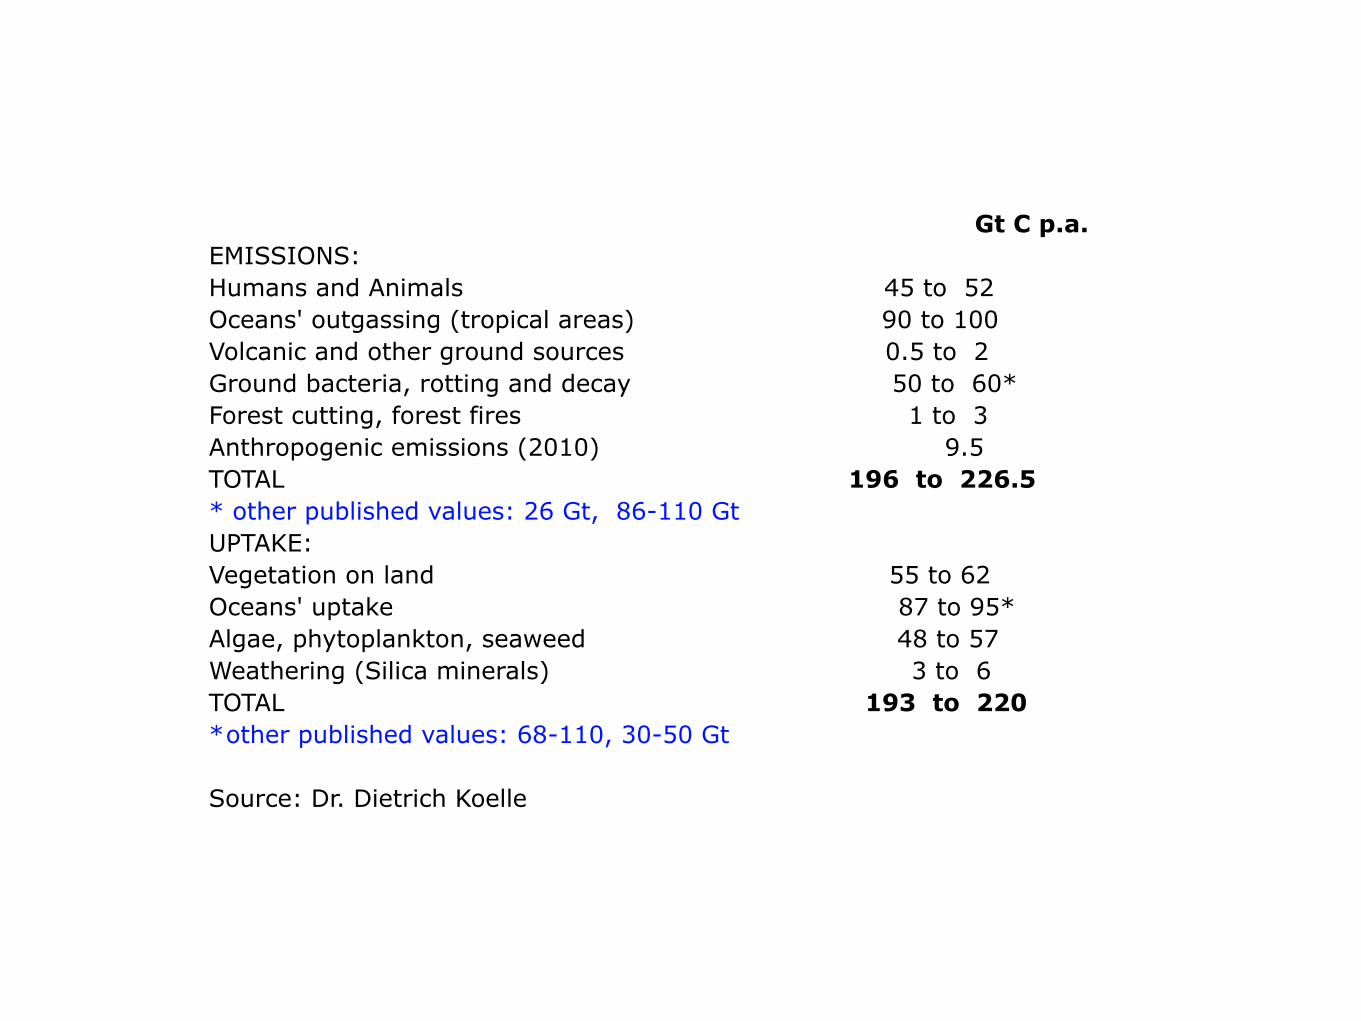
Gt C p.a.EMISSIONS:Humans and Animals 45 to 52Oceans' outgassing (tropical areas) 90 to 100Volcanic and other ground sources 0.5 to 2Ground bacteria, rotting and decay 50 to 60*Forest cutting, forest fires 1 to 3Anthropogenic emissions (2010) 9.5TOTAL 196 to 226.5* other published values: 26 Gt, 86-110 GtUPTAKE:Vegetation on land 55 to 62Oceans' uptake 87 to 95* Algae, phytoplankton, seaweed 48 to 57Weathering (Silica minerals) 3 to 6TOTAL 193 to 220*other published values: 68-110, 30-50 Gt
Source: Dr. Dietrich Koelle

Source: Temperature after C. R. Scotese; CO2 after R.A. Bernier, 2001
385 ppm

Source; Smithson, Griggs and Ball; Fundamentals of Physical Geography

As Tim Palmer leading climate modeler at the European Centre for Medium Range Weather Forecasts said; “I don’t want to
undermine the IPCC, but the forecasts, especially for regional climate change, are immensely uncertain.” Yet the regional
models are far more accurate than the IPCC General Circulation Models (GCM).
Source: http://www.globalresearch.ca/index.php?context=va&aid=16330

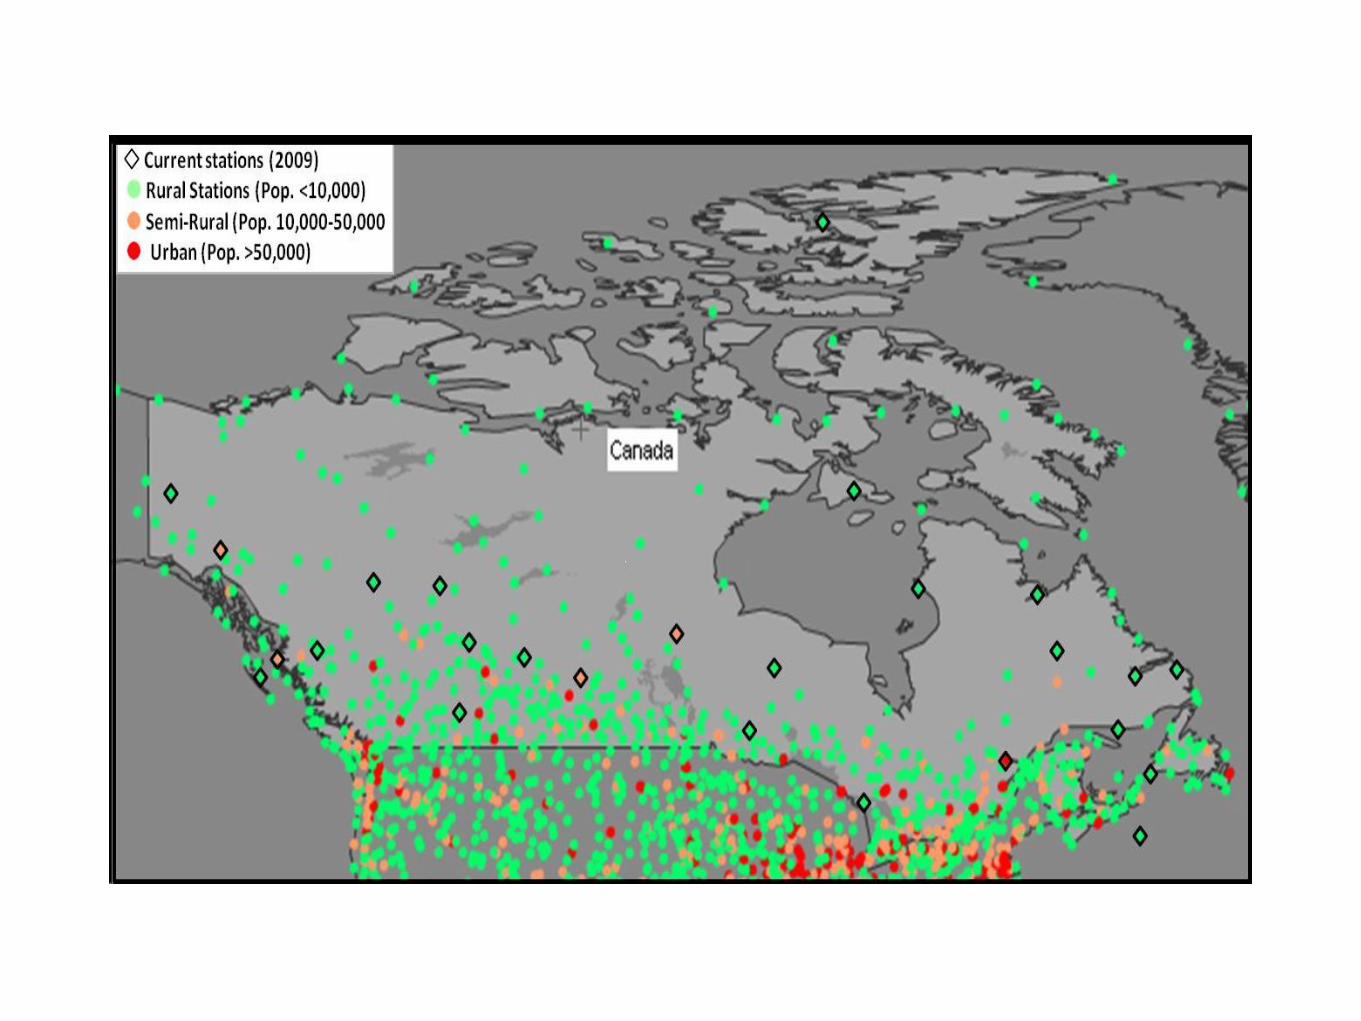
Number of Weather Stations NASA GISS

Number of Weather Stations NASA GISS
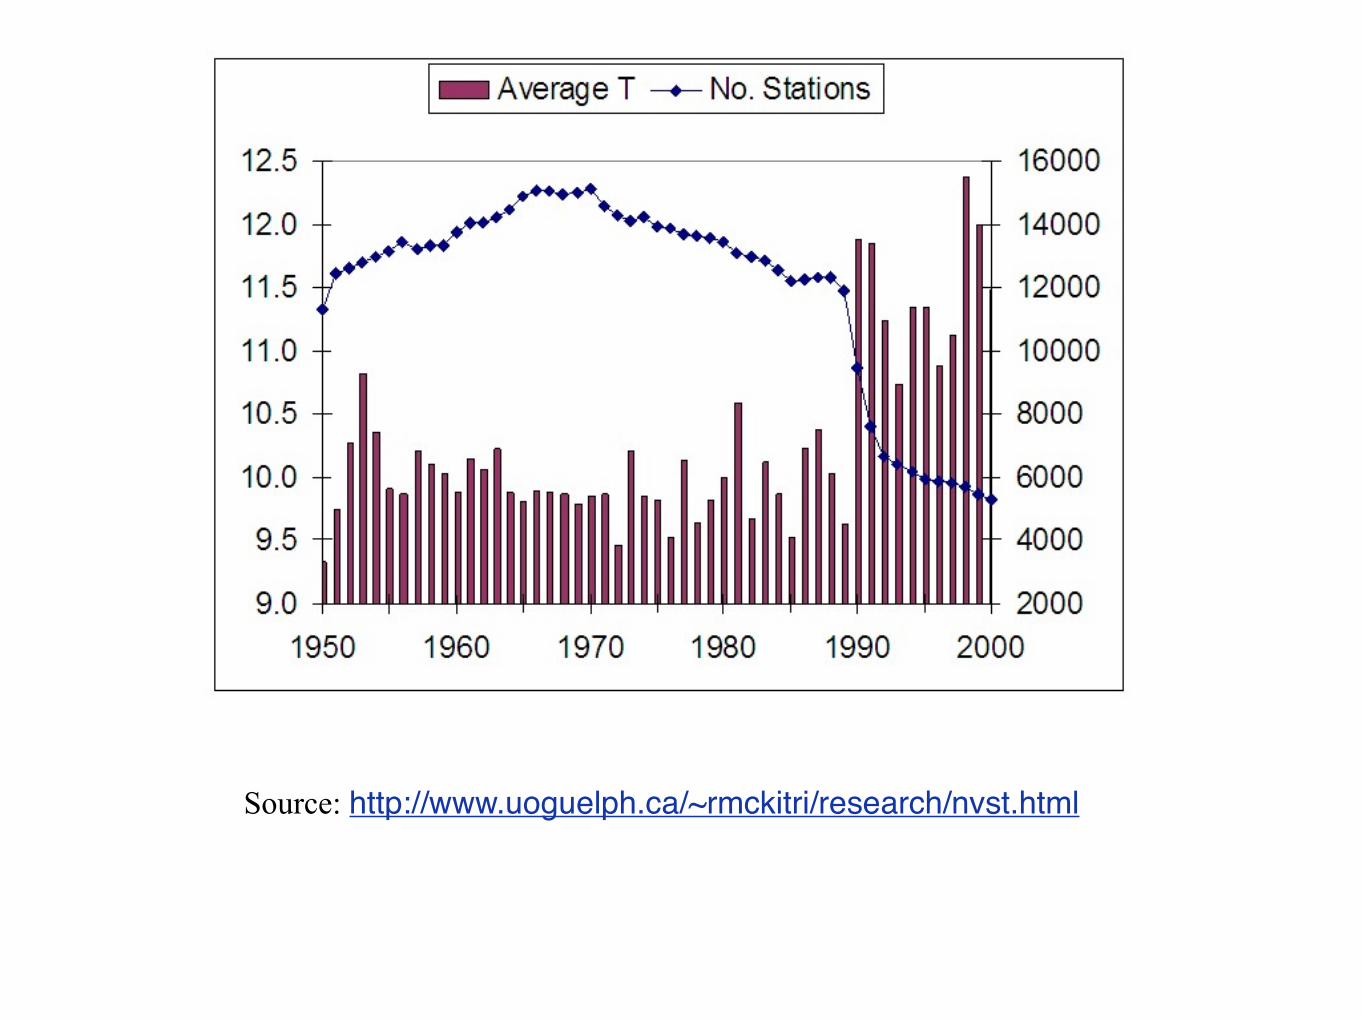
Source: http://www.uoguelph.ca/~rmckitri/research/nvst.html

Data Manipulation

Data Manipulation

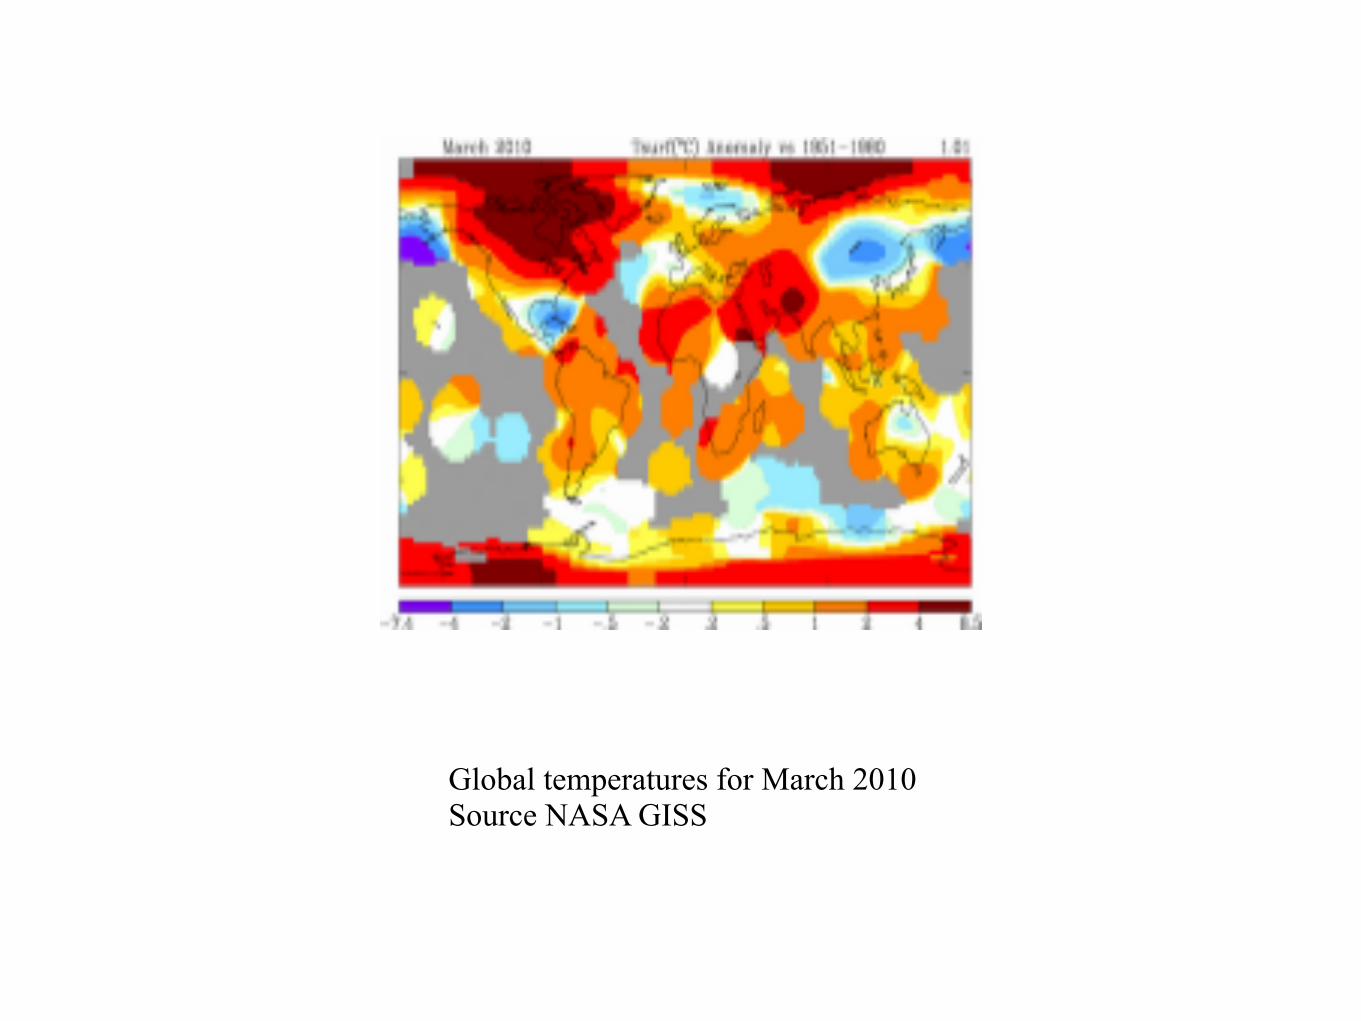
Global temperatures for March 2010Source NASA GISS


Milankovitch Effect
Orbital Eccentricity Obliquity of the Ecliptic
Precession of the Equinox
Axial Wobble
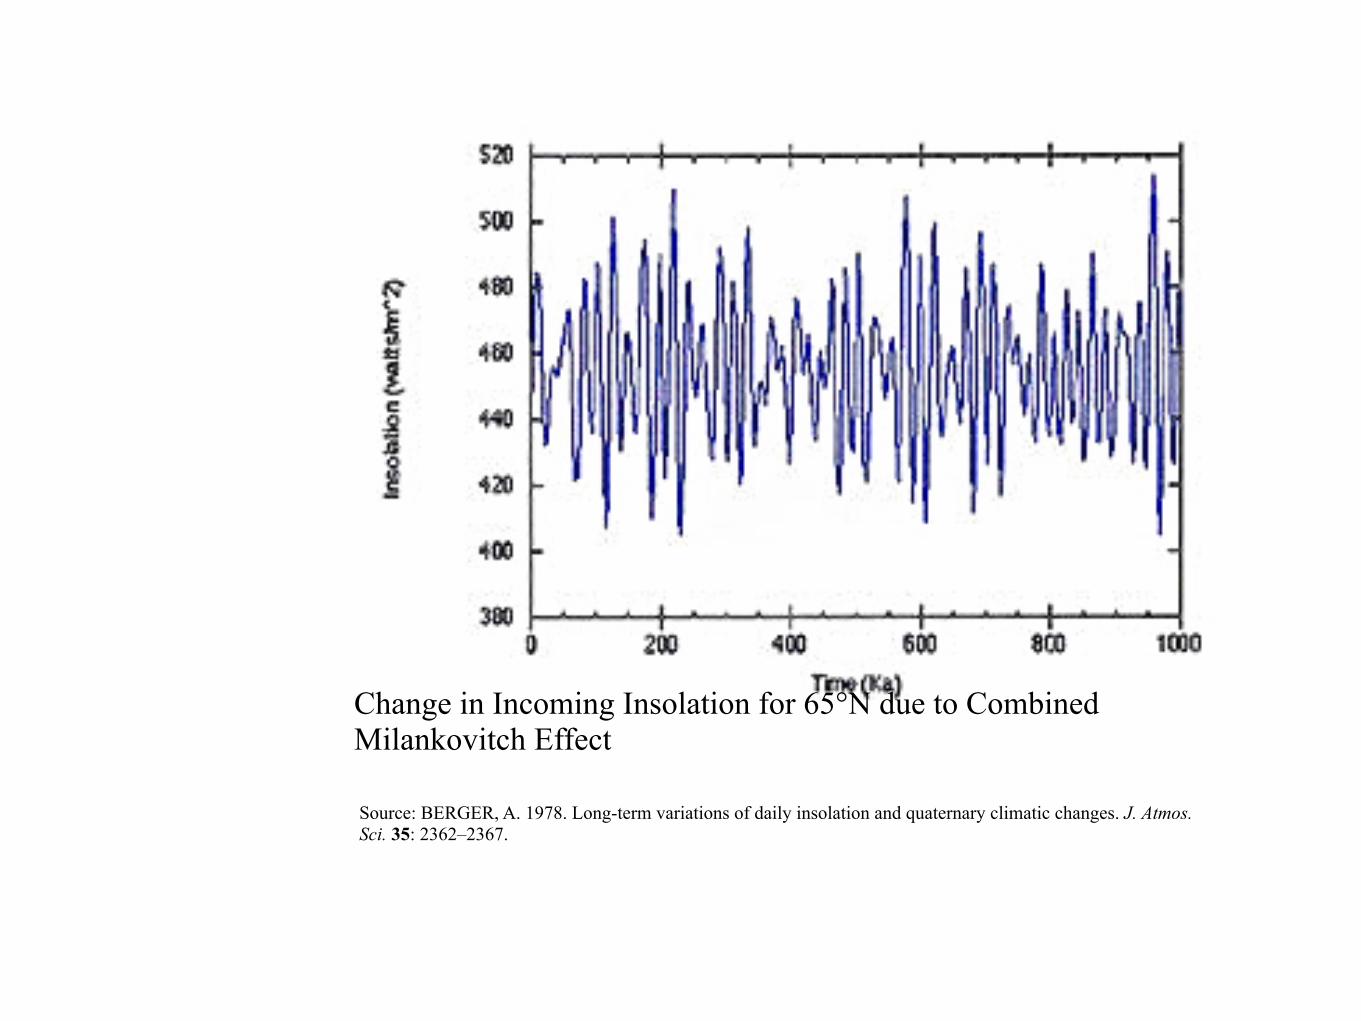
Change in Incoming Insolation for 65°N due to Combined Milankovitch Effect
Source: BERGER, A. 1978. Long-term variations of daily insolation and quaternary climatic changes. J. Atmos. Sci. 35: 2362–2367.
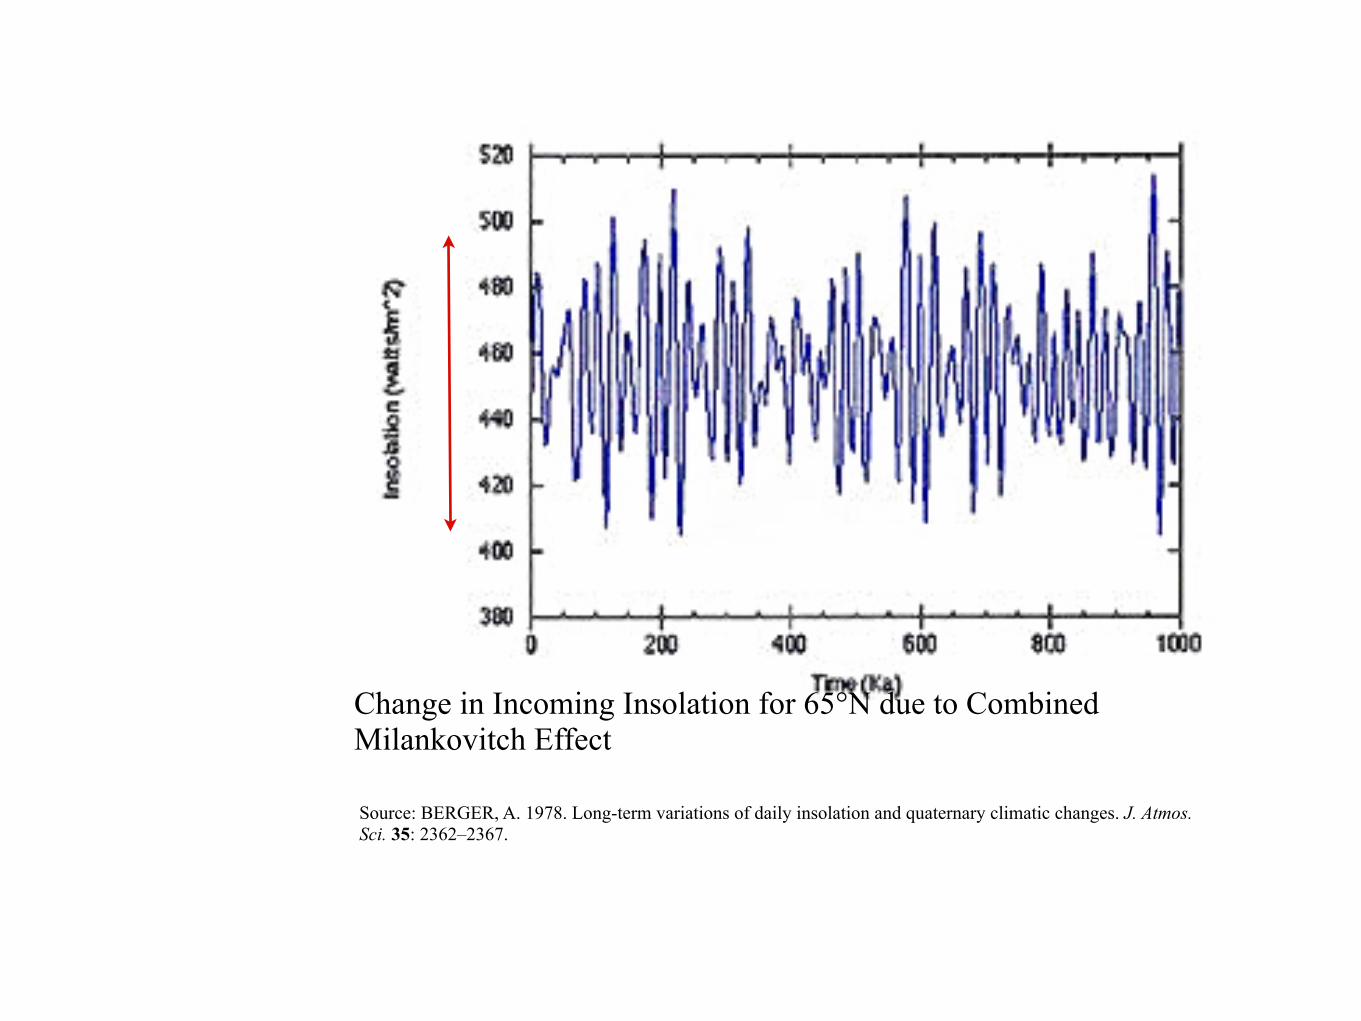
Change in Incoming Insolation for 65°N due to Combined Milankovitch Effect
Source: BERGER, A. 1978. Long-term variations of daily insolation and quaternary climatic changes. J. Atmos. Sci. 35: 2362–2367.

Change in Incoming Insolation for 65°N due to Combined Milankovitch Effect
Source: BERGER, A. 1978. Long-term variations of daily insolation and quaternary climatic changes. J. Atmos. Sci. 35: 2362–2367.
Range 100 watts per square meter

Svensmark’s Cosmic Theory
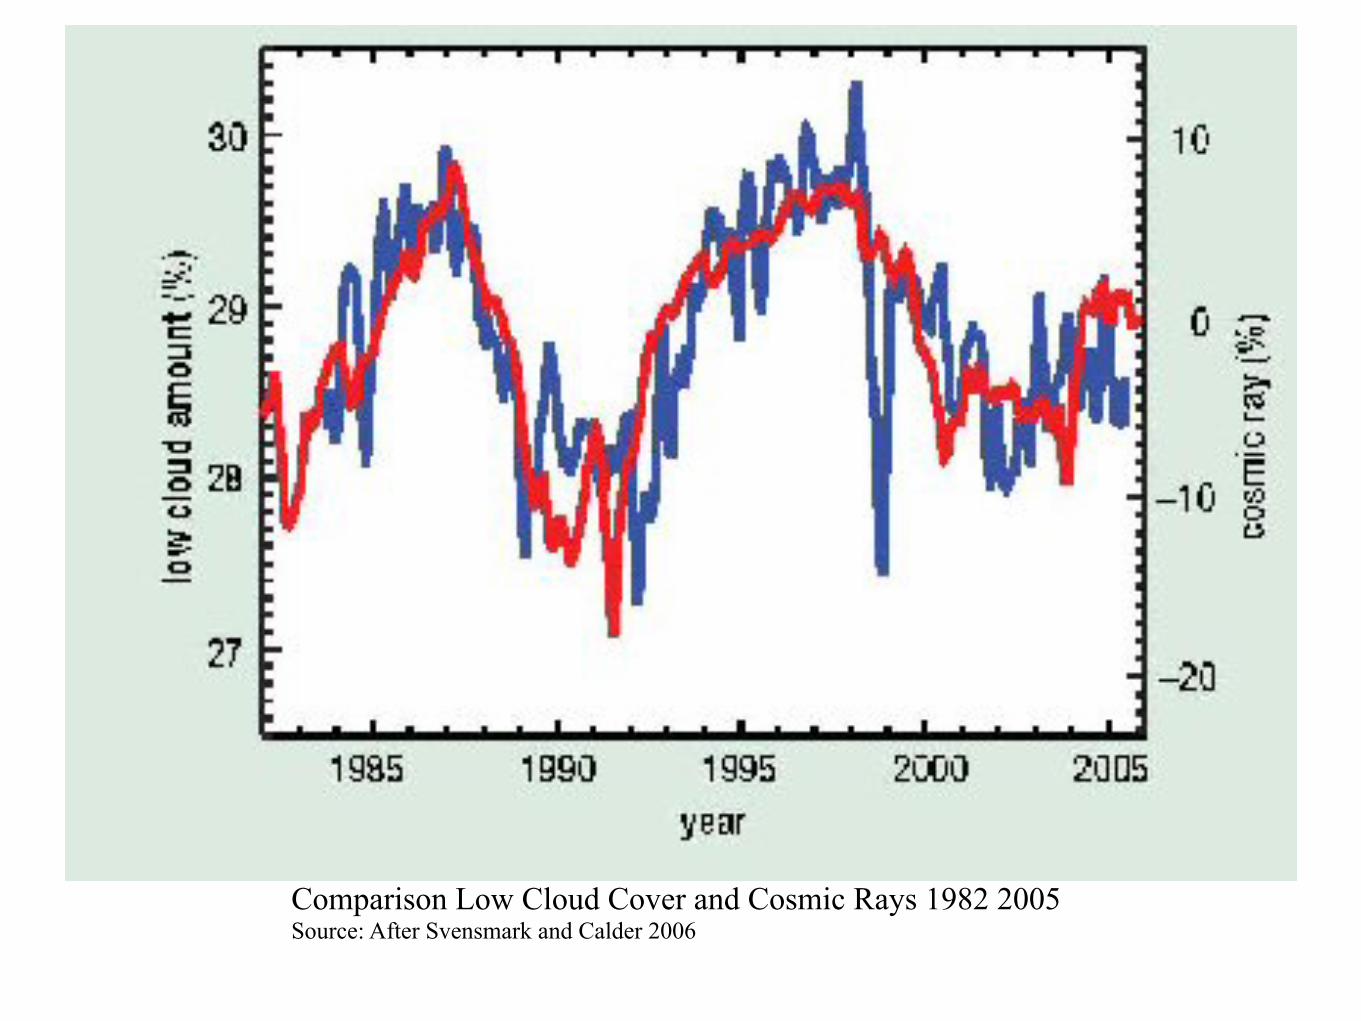
Comparison Low Cloud Cover and Cosmic Rays 1982 2005Source: After Svensmark and Calder 2006


![Sjzl20091240-ZXMBW AGW (V3[1].08.10) Software Installation Guide](https://static.fdocuments.us/doc/165x107/577cd5711a28ab9e789acc63/sjzl20091240-zxmbw-agw-v310810-software-installation-guide.jpg)

