Human Capital Policies in Education: Further Research on Teachers and Principals
21
Human Capital Policies in Education: Further Research on Teachers and Principals 5 rd Annual CALDER Conference January 27 th , 2012
-
Upload
chava-mendoza -
Category
Documents
-
view
25 -
download
1
description
Human Capital Policies in Education: Further Research on Teachers and Principals 5 rd Annual CALDER Conference January 27 th , 2012. Certification Requirements and Teacher Quality: A Comparison of Alternative Routes to Teaching. Tim R. Sass Department of Economics Georgia State University. - PowerPoint PPT Presentation
Transcript of Human Capital Policies in Education: Further Research on Teachers and Principals

Human Capital Policies in Education: Further Research on Teachers and Principals
5rd Annual CALDER ConferenceJanuary 27th, 2012

Certification Requirements and Teacher Quality: A
Comparison of Alternative Routes to Teaching
Tim R. Sass
Department of Economics
Georgia State University

Pathways to Teaching Traditional Pathway
Complete a university-based teacher preparation program
Pass a set of certification exams Alternative Pathways
Earn bachelors degree Limited or no prior education coursework required
May be required to complete some alternative training, often web based
Pass certification exams May have to take some education courses after begin
teaching

Economics of Professional Licensure
Public Interest View Consumers ill-informed Regulation imposes minimum quality standard which indirectly
provides informationAvoids “lemons problem” where only low quality is provided
Capture View Professionals lobby for strong licensure standards to limit entry Minimum educational requirement may actually keep out most
talented potential entrants by differentially raising cost to those with highest opportunity cost

Prior Research on Alternative Certification
Quasi-Experimental Evidence Boyd, et al. (2006); Kane, Rockoff and Staiger (2006)
Analyze “Teacher for America” (TFA) and NYC Teaching Fellows programs
Both require teachers work toward education degree after initial employment
Fellows initially equally effective in math and less effective than traditional-route teachers in ELA, but close gap over time
TFA teachers more effective in math initially, particularly at the middle school level
Xu, Hannaway and Taylor (2011) analyze effectiveness of TFA teachers in North Carolina high schools TFA teachers more effective on average over all subjects,
biggest difference in science and math

Prior Research on Alternative Certification Experimental Evidence
Glazerman, Mayer and Decker (2006) Compare TFA and traditionally prepared teachers teaching in
same school and grade with random assignment of students Find TFA teachers outperform traditionally prepared teachers
in math, but no significant difference in reading Constantine, at al. (2009)
Analyze effectiveness of teachers from less selective alternative certification programs using same paired design as Glazerman, Mayer and Decker
Found no difference in effectiveness between alternatively certified and traditionally prepared teachers
Alternatively certified teachers had significant coursework in education

Pathways to Teaching in Florida Florida Teacher Preparation Program Graduate District Alternative Certification Program
No special recruitment procedures No formal education coursework required Must complete competency-based alternative certification program and
pass certification exams Course Analysis
Requires handful of core education courses May be an education minor or not part of any formal program
Out-of-state Teacher Preparation Program Graduate Certified in Another State ABCTE Passport Educator Preparation Institutes
Two-semester program at community colleges College Teaching Experience

Pathways of First-Year Teachers by Certification Type, 2000/01-2006/07

Select Characteristics of Teachers by Specific Pathway(Teachers with Any Certification)
Traditional Teacher Prep. in
FL(n=17392)
Course Analysis
(n=30052)
Certified in Another
State(n=12827)
Teacher Prep.
Outside FL
(n=6016)
District Alternative
Cert.(n=1473)
Educator Prep
Institute(n=206)
ABCTE(n=96)
College Teaching
Experience(n=55)
% from Most Competitive Colleges
13.9 19.2* 7.8* 7.5* 22.9* 22.3* 22.5 35.8*
% from Least Competitive Colleges
19.6 16.0* 21.3* 23.3* 13.5* 14.4* 18.0 9.4*
% Pass GK Math 1st Try 66.3 64.5* 55.9* 76.4* 77.2* 97.7 61.5
% Pass GK Reading 1st Try 80.3 81.8* 71.8* 91.0* 92.6* 100.0 69.2
% Pass GK English 1st Try 81.6 82.0 74.0* 92.1* 95.7* 100.0 61.5
% Pass GK Essay 1st Try 91.1 88.0* 72.7* 92.6 93.1 97.6 100.0*
% Non-White 31.6 31.6 16.7* 26.9* 26.3* 18.9* 18.8* 32.7
% Male 13.4 23.0* 18.8* 22.6* 31.4* 27.2* 35.4* 47.3*
Average SAT Score 937 955* 1029* 1029* 1096*
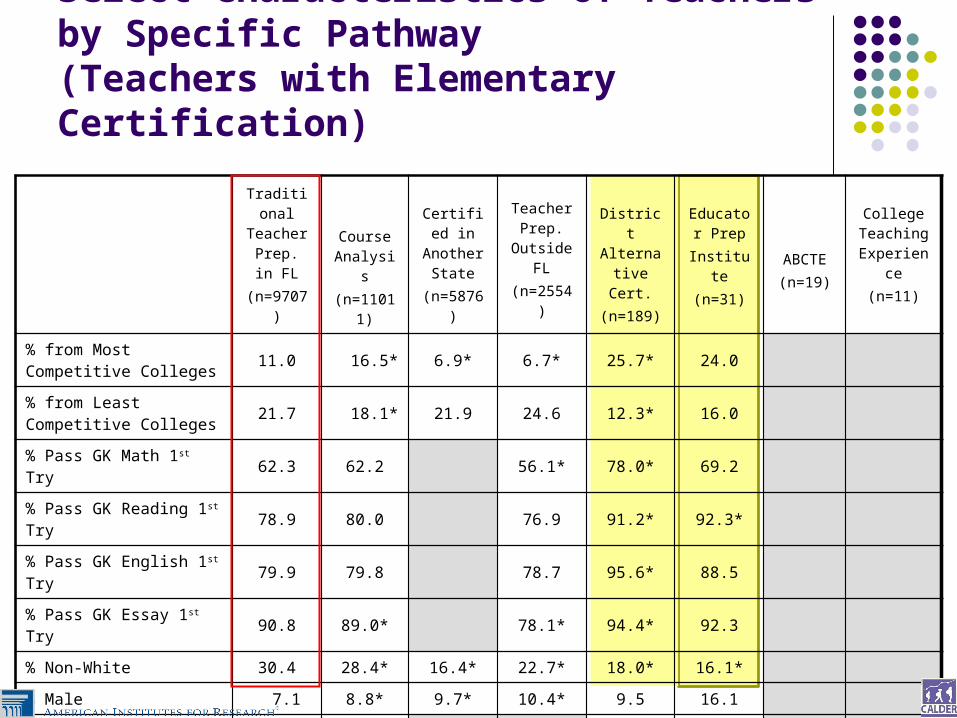
Select Characteristics of Teachers by Specific Pathway(Teachers with Elementary Certification)
Traditional Teacher Prep. in
FL(n=9707)
Course Analysis
(n=11011)
Certified in Another
State(n=5876)
Teacher Prep.
Outside FL
(n=2554)
District Alternative
Cert.(n=189)
Educator Prep
Institute(n=31)
ABCTE(n=19)
College Teaching
Experience(n=11)
% from Most Competitive Colleges
11.0 16.5* 6.9* 6.7* 25.7* 24.0
% from Least Competitive Colleges
21.7 18.1* 21.9 24.6 12.3* 16.0
% Pass GK Math 1st Try 62.3 62.2 56.1* 78.0* 69.2
% Pass GK Reading 1st Try 78.9 80.0 76.9 91.2* 92.3*
% Pass GK English 1st Try 79.9 79.8 78.7 95.6* 88.5
% Pass GK Essay 1st Try 90.8 89.0* 78.1* 94.4* 92.3
% Non-White 30.4 28.4* 16.4* 22.7* 18.0* 16.1*
% Male 7.1 8.8* 9.7* 10.4* 9.5 16.1
Average SAT Score 928 941* 966 979

Major of First Bachelor’s Degree by Pathway and Certification Area
First Modal Major of Bachelor’s Degree
Path of EntryAll Cert. Elementary Ed.
Middle School Math High School Math Biology
Traditional Teacher Prep. in FL
Elem. Ed. Elem. Ed. Elem. Ed. Math Ed Science Ed
Course AnalysisElem. Ed. Elem. Ed. Elem. Ed. Math Ed Biology
Certified in Another State
Elem. Ed. Elem. Ed. Elem. Ed. Math Ed Science Ed
Teacher Prep. Outside FL
Elem. Ed. Elem. Ed. Journalism Elem. Ed.
District Alternative Cert.
English Lang. & Lit.
Business Admin Criminal Justice Mathematics Biology
Educator Preparation Institute
Communications Business Admin Business Admin Health Professions Food Sciences & Technology
ABCTEEnglish Lang. &
Lit.Political Science Finance Biology
College Teaching Experience
Elem. Ed. Elem. Ed. Business Admin Business Admin Food Sciences & Technology

Coursework Credit Hours(All Certifications)
All Education Courses
Ed. Field Courses
Math Ed.
Science Ed.
Language Arts Ed.
Non-Ed. Math
Non-Ed. Science
Non-Ed. English Lit.
0 10 20 30 40 50 60 70
ABCTE Educator Prep. InstituteDistrict Alt. Cert. Florida Teacher Prep

Value-Added Analysis of Pathway Effects: Data Achievement Tests
“Sunshine State Standards” Test (SSS) Stanford Achievement Test (NRT) Reading and Math for each test
Test Scaling Each test score normed by grade and year
Coverage 2000/01 – 2006/07 Grades 3-10
Classes 10-50 students
Students Only students taking a single math or reading/language arts course Special education students omitted

Value-Added Analysis of Pathway Effects: Model
itmki
ktijmtititit AA
Zβ
TβPβXβ
5
432110
where A=student achievement
X = time varying student/family inputs
P = classroom peer characteristics
T = time varying teacher characteristics
g = student “fixed effect”
Z = time invariant teacher characteristics
f = school “fixed effect”
indices: individuals (i), classrooms (j), teachers (k), schools (m)
and time (t).

Impact of Teacher Pathways on Student Achievement in Math and Reading, 2000/01-2006/070-2 Years Experience, Grades 4-10
Math Reading
Alternative Certification
0.0072 (0.0037)
-0.0013 (0.0040)
0.0023 (0.0051)
0.0026 (0.0031)
-0.0026 (0.0037)
-0.0098 (0.0050)
-0.0013 (0.0014)
-0.0041(0.0010)
Educator Prep. Inst.
- 0.0342 (0.0089)
-0.0268 (0.0117)
-0.0437 (0.0031)
-0.0431 (0.0012)
-0.0026 (0.0059)
-0.0237 (0.0039)
-0.0248 (0.0028)
-0.0421(0.0009)
ABCTE0.1041
(0.0089)0.0634
(0.0058)0.1146
(0.0050)0.0869
(0.0026) 0.0087
(0.0019) -0.0103 (0.0136)
0.0110 (0.0022)
0.0003(0.0012)
Exam SSS NRT SSS NRT SSS NRT SSS NRT
Persistence Partial Partial Partial Partial Partial Partial Partial Partial
Student FE No No No No No No No No
School FE Yes Yes No No Yes Yes No No
Clustered standard errors (in parenthesis) : = signif. at 10 pct. = signif. at 5 pct. = signif. at 1 pct.
.

Impact of Teacher Pathways on Student Achievement in Math and Reading, 2000/01-2006/070-2 Years of Experience, Grades 4-10
Math Reading
Alternative Certification
0.0017 (0.0028)
0.0014 (0.0033)
- 0.0002 (0.0067)
-0.0050 (0.0069)
-0.0042 (0.0111)
-0.0074 (0.0123)
0.0042 (0.0060)
-0.0022(0.0121)
Educator Prep. Inst.
-0.0071 (0.0218)
-0.0199 (0.0453)
-0.0215 (0.0250)
-0.0305 (0.0359)
0.0441 (0.0334)
0.0197 (0.0413)
0.0182 (0.0167)
-0.0021(0.0426)
ABCTE0.1179
(0.0394)0.0236
(0.0391)0.1141
(0.0289)0.0539
(0.0289)-0.0174(0.0205)
-0.0261(0.0449)
-0.0097(0.0106)
-0.0087(0.0209)
Exam SSS NRT SSS NRT SSS NRT SSS NRT
Persistence Partial Partial Partial Partial Partial Partial Partial Partial
Student FE Yes Yes Yes Yes Yes Yes Yes Yes
School FE Yes Yes No No Yes Yes No No
Clustered standard errors (in parenthesis) : = signif. at 10 pct. = signif. at 5 pct. = signif. at 1 pct.
.
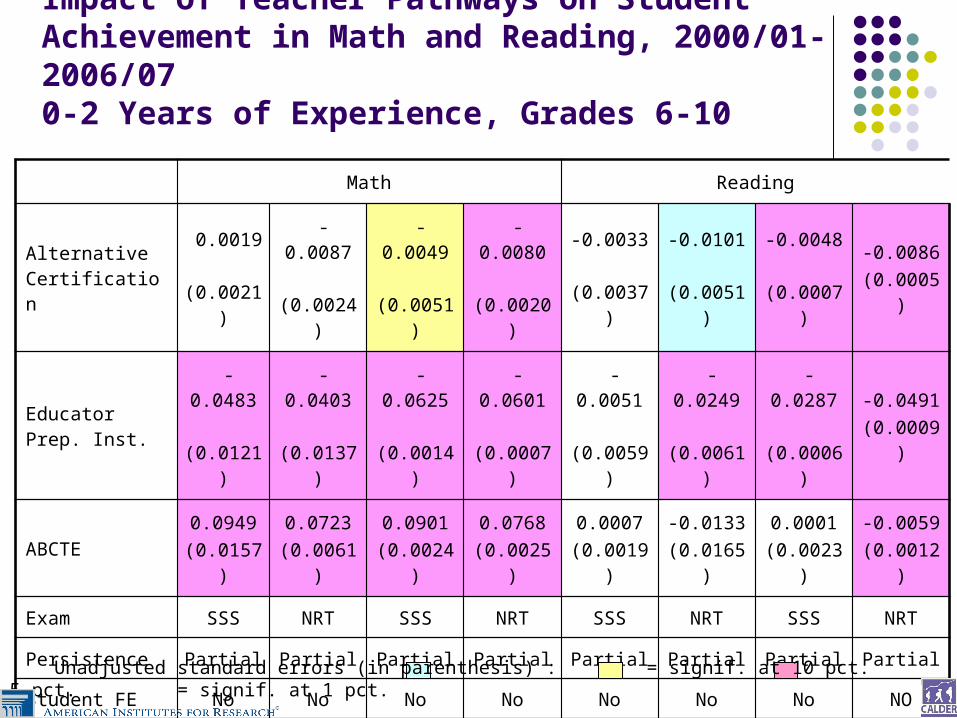
Impact of Teacher Pathways on Student Achievement in Math and Reading, 2000/01-2006/070-2 Years of Experience, Grades 6-10
Math Reading
Alternative Certification
0.0019 (0.0021)
-0.0087 (0.0024)
-0.0049 (0.0051)
-0.0080 (0.0020)
-0.0033 (0.0037)
-0.0101 (0.0051)
-0.0048 (0.0007)
-0.0086(0.0005)
Educator Prep. Inst.
-0.0483 (0.0121)
-0.0403 (0.0137)
-0.0625 (0.0014)
-0.0601 (0.0007)
-0.0051 (0.0059)
-0.0249 (0.0061)
-0.0287 (0.0006)
-0.0491(0.0009)
ABCTE0.0949
(0.0157)0.0723
(0.0061)0.0901
(0.0024)0.0768
(0.0025)0.0007
(0.0019)-0.0133(0.0165)
0.0001(0.0023)
-0.0059(0.0012)
Exam SSS NRT SSS NRT SSS NRT SSS NRT
Persistence Partial Partial Partial Partial Partial Partial Partial Partial
Student FE No No No No No No No NO
School FE Yes Yes No No Yes Yes No No
Unadjusted standard errors (in parenthesis) : = signif. at 10 pct. = signif. at 5 pct. = signif. at 1 pct.

Summary of Findings
Characteristics of Alternatively Certified Teachers in Florida (Compared to Traditionally Prepared Teachers) Come from more competitive universities Have higher certification test pass rates Have higher SAT scores Are less likely to be minorities Are more likely to be male

Summary of Findings
Majors Modal major of alternatively certified teachers is English Alternatively certified high school math and science teachers tend to
have major in content area (rather than math ed. or science ed.) Coursework
Traditionally prepared teachers average over 60 credits in education courses, alternatively certified teachers average less than four credits in education
Traditionally prepared teachers take about the same number of math courses, but fewer science courses than alternatively certified teachers Traditionally prepared teachers partly compensate by taking more
science education courses

Summary of Findings
Relative Effectiveness in Promoting Student Achievement In most cases ABCTE teachers have higher value-added than
traditionally prepared teachers Differences are sometimes large (~10% of a standard deviation)
In most cases no difference between traditionally prepared and district alternatively certified teachers
EPI teacher tend to perform worse than traditionally prepared teachers Only first cohort of EPI teachers in sample

Policy Implications
Must be Careful Not to Lump all Alternative Certification Programs Together When Making Policy Judgments
Lowering entry cost, but still requiring substantial non-transferrable coursework may be counter-productive Possible adverse selection
Very-Low-Cost Entryway Into Teaching Appears to be Beneficial, Particularly for Middle and High School Better content preparation appears to trump pedagogical
knowledge


