Human Capital Metrics Trends Report 2009 · 2.1 Organizations’ use of HR metrics The landscape...
22
Human Capital Metrics Trends November-2009 Published by BC HRMA . . . . . . . . . . . . . . . . . . . . . . . . . . . . . . . . . . . . . . . . . . . . . . . . . . . . . . . . . . . . . . . . . . . . . . . . . . . . . . . . . . . . . . . . . . . . . . . . . . . . . . . . . . . . . . . . . . . .
Transcript of Human Capital Metrics Trends Report 2009 · 2.1 Organizations’ use of HR metrics The landscape...

© BC HRMA 2009 Page 1 of 22
Human Capital Metrics Trends
November-2009
Published by BC HRMA
. . . . . . . . . . . . . . . . . . . . . . . . . . . . . . . . . . . . . . . . . . . . . . . . . . . . . . . . . . . . . . . . . . . . . . . . . . . . . . . . . . . . . . . . . . . . . . . . . . . . . . . . . . . . . . . . . . . . . . .

© BC HRMA 2009 Page 2 of 22
Table of Contents
EXECUTIVE SUMMARY ........................................................................................................... 3
1. INTRODUCTION ................................................................................................................. 5
2. SURVEY RESULTS ............................................................................................................... 6
2.1 ORGANIZATIONS’ USE OF HR METRICS ..................................................................................................... 6
2.2 THE BENEFITS OF HR METRICS .................................................................................................................. 6
2.3 WHO RECEIVES METRIC RESULTS ............................................................................................................... 7
2.4 HOW INFORMATION IS DISTRIBUTED ......................................................................................................... 8
2.5 CHALLENGES TO DEVELOPING METRICS ..................................................................................................... 9
2.6 DEDICATING RESOURCES TO HR METRICS ............................................................................................... 10
2.7 THE STATUS OF HR METRICS BENCHMARKING ........................................................................................ 10
2.8 HR METRIC BENCHMARK SERVICE PROVIDERS ......................................................................................... 11
2.9 THE CHALLENGES OF BENCHMARKING ..................................................................................................... 11
2.10 BENCHMARKING COMPARATORS .......................................................................................................... 12
2.11 EMPLOYEE SURVEY USAGE .................................................................................................................... 12
2.12 METRICS MOST COMMONLY USED BY ORGANIZATIONS ........................................................................ 14
3. A CALL TO ACTION TO HR PROFESSIONALS ....................................................................... 16
4. REPORT SUMMARY .......................................................................................................... 17
APPENDIX - SURVEY DEMOGRAPHIC DATA .......................................................................... 18

© BC HRMA 2009 Page 3 of 22
Executive Summary
In the second annual BC HRMA Human Capital Metrics Trends survey, it’s clear that B.C. organizations have made some progress to start measuring their HR functions. In the past year, as a result of the changing economic landscape, HR metrics have gained more attention. Organizations are learning to do more with less, have smaller budgets to work with, and in some cases have cut staffing to reign in expenses. Accountability and transparency have increased in importance. Business leaders want to ensure that HR is doing the right thing and doing it well and HR metrics is helping them work through those details.
HR metrics was first introduced 30 years ago; however, it’s clear that in the last year B.C. organizations have started to make the transition from theory to practice. Several HR professionals have expressed an interest to learn more and do more in the year to come. For those organizations progressing on their measurement journey, they have managed to remove previous roadblocks such as obtaining standardized HR metrics formulas and data definitions. However, few have progressed to the point of aligning their metrics to strategy and benchmarking externally. In a similar vein as other HR programs, resources and budget appear to be limiting the ability to do more with metrics.
Other trends in 2009 include:
• Organizations are using metrics to demonstrate the value of HR programs and to target and improve specific outcomes of HR activities.
• Few organizations are using metrics to maintain/increase HR resourcing; specifically, the HR budget and HR FTE. HR wants to appear valuable and ensure it’s doing the right things but are not building a case to get the resources that are needed.
• Metrics are becoming more standardized – in 2008, 53.8% of respondents said that they didn’t benchmark because they didn’t believe they would be comparing apples-to-apples. In 2009 there was a 35% decrease in the number of people who were concerned about comparing apples-to-apples.
• When communicating HR metric results, organizations are still not reporting the figures to their HR staff and instead focus their communications to the executive team, HR management and the organization’s business leaders.
• With respect to employee surveys, there has been a jump in the number of organizations doing onboarding surveys from 16.6% to 30%. The majority of organizations are doing exit interviews or surveys, far more than employee engagement or satisfaction surveys. From 2008 to 2009, there was a decrease in the number of organizations doing employee engagement surveys. Finally, HR still refuses to measure their clients’ satisfaction level with their work.
• There is a strong desire to start tracking high impact metrics such as: Human Capital Return on Investment, Succession Planning Rate, Cost of Voluntary Turnover and Profit per FTE
• On the flipside, there is a strong showing in those who have no desire in tracking those same high impact metrics, in particular: Human Capital Return on Investment and Profit per FTE.
• For all the discussion on the value of a diverse workforce, similar to last year’s results, hardly any organizations are planning to include diversity metrics such as Diversity Hire Ratio of Percentage of Female Employees.

© BC HRMA 2009 Page 4 of 22
In BC HRMA’s 2009 HR Trends Report, HR professionals indicated their biggest challenges in 2009 were: • organizational growth or contraction (23.5%) • reduced operating budget (30.3%)
This survey’s responses reflected these challenges:
• When asked why they are not benchmarking, the number of organizations that responded
that they “don’t have the budget” increased from 2008 to 2009. The second most popular responses included lacking resources (time, budget, people). Others indicated that they are just getting started tracking data or that HR measurement is not a priority.
• It appears that when people want to start measuring, they discover the next big roadblock to good measurement is the HRIS. Specifically, HR is finding that their HRIS doesn’t track or report the data well, the system doesn’t contain quality data and there is a lack of technical capabilities to support the measurement function.

© BC HRMA 2009 Page 5 of 22
1. Introduction
In March 2008, BC HRMA conducted its first annual survey of HR trends in B.C. The 2009 survey was distributed to members in September 2009. In the 2008 report, 35% of respondents indicated that HR metrics was a new area of focus. However, in 2009 24.2% indicated that metrics was a new area of focus. Triangulated with the data from this survey, it appears that more HR functions are starting to measure and those that were new to measuring last year are now progressing towards having strategically-aligned measures.
Similar to last year’s study, the survey aimed to discover:
• Who is measuring? • Are we starting to measure and if so, how mature is our HR metrics function? • What are we measuring? • What are the biggest challenges to measurement? • Are we benchmarking the effectiveness and efficiency of HR? • How are we communicating our results?
The data was gathered through an online survey distributed to BC HRMA members and its associates. The survey received 175 responses, representing 3.7% of BC HRMA’s membership. The survey has a margin of error +/- 8% at a 95% confidence level. The survey includes organizations whose operations range across British Columbia, with the majority doing business in the Lower Mainland.
In reporting the results of this survey, we walk through the responses for each question providing the details, context and insight which emerged from the survey data and commentary provided by the members.
© BC HRMA 2009 Page 6 of 22
2. Survey Results
The themes which emerged from the survey are described below. Each theme will be addressed in more detail in the following pages of the report.
2.1 Organizations’ use of HR metrics
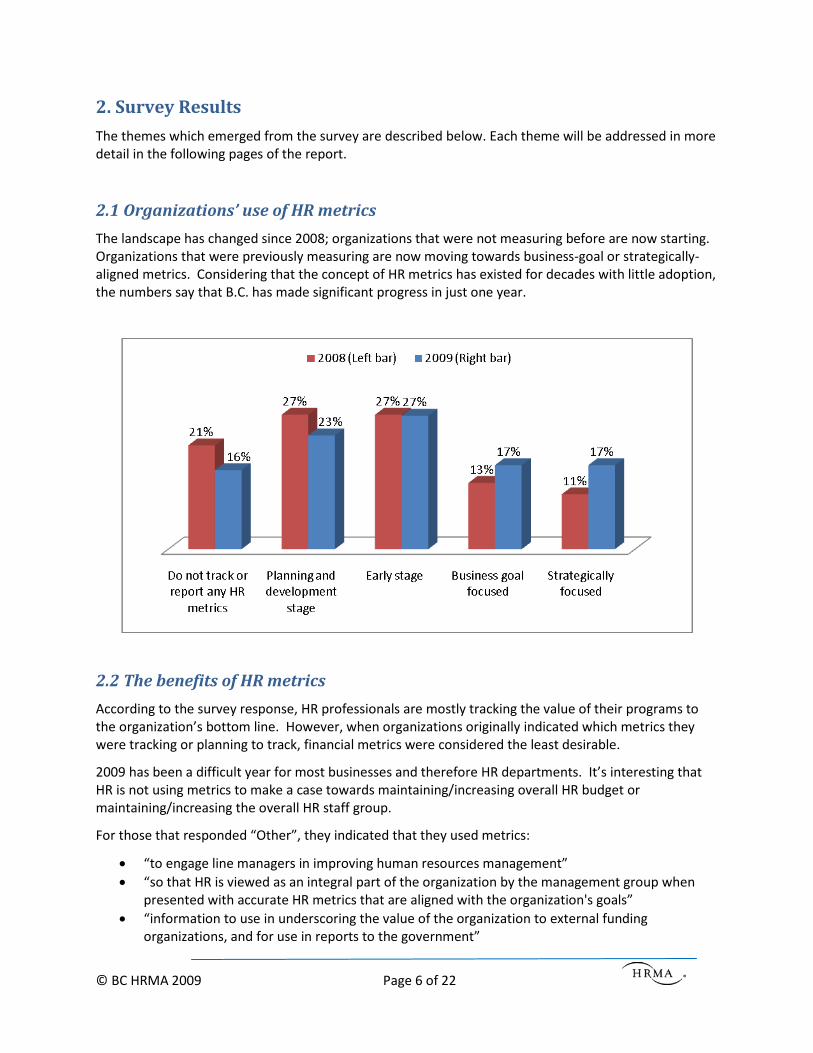
The landscape has changed since 2008; organizations that were not measuring before are now starting. Organizations that were previously measuring are now moving towards business-goal or strategically-aligned metrics. Considering that the concept of HR metrics has existed for decades with little adoption, the numbers say that B.C. has made significant progress in just one year.
2.2 The benefits of HR metrics
According to the survey response, HR professionals are mostly tracking the value of their programs to the organization’s bottom line. However, when organizations originally indicated which metrics they were tracking or planning to track, financial metrics were considered the least desirable.
2009 has been a difficult year for most businesses and therefore HR departments. It’s interesting that HR is not using metrics to make a case towards maintaining/increasing overall HR budget or maintaining/increasing the overall HR staff group.
For those that responded “Other”, they indicated that they used metrics:
• “to engage line managers in improving human resources management” • “so that HR is viewed as an integral part of the organization by the management group when
presented with accurate HR metrics that are aligned with the organization's goals” • “information to use in underscoring the value of the organization to external funding
organizations, and for use in reports to the government”

© BC HRMA 2009 Page 7 of 22
2.3 Who receives metric results
The results for this question are more or less the same as last year. The executive team is still the number one recipient of HR metric results and only one third forward the results to the entire HR team. If more organizations are measuring and others are maturing their reporting function, it’s curious that metric results or HR performance aren’t communicated to the entire HR team to understand their results, make suggestions for improvement or use the results in their work with their client group. Since HR staff do not generally receive metric results, it also indicates that HR metrics are not used as part of the function’s goal setting process.
Answer
%
Able to track and demonstrate value of HR programs to organization overall
78%
Able to target and improve specific outcomes of HR activities
78%
Able to drive improvement in overall HR effectiveness
75%
Able to identify key areas for investment or change
65%
Able to drive improvement in overall HR efficiency
65%
Able to identify areas not previously considered important
50%
Able to maintain / increase overall HR budget
32%
Able to maintain or increase overall HR staff group
22%
Other
6%

© BC HRMA 2009 Page 8 of 22
2.4 How information is distributed
Ideally, all staff including operational managers should have the ability to pull HR data for their areas of control, on demand. However, few organizations have or can afford a business intelligence tool. As such, email is by far the most popular option to mass distribute information.

© BC HRMA 2009 Page 9 of 22
2.5 Challenges to developing metrics
There are no startling changes since last year, only slight shifts. Interestingly, there has been a slight decrease in the number of people who stated that they lack consistent metric definitions, standards and formulas, and 28% claimed that they didn’t have access to HR metrics formulas. These responses are confusing given that based on responses to the previous question “Why are you currently not benchmarking?”, respondents appeared to be more aware that BC HRMA released standard definitions.
In the “other” category, respondents stated that their biggest challenges in developing and reporting metrics were the fact that they are a “small organization”, have “limited IT capabilities”, and have no access to company finances or HR data.

© BC HRMA 2009 Page 10 of 22
2.6 Dedicating resources to HR metrics
In 2008, 24% of respondents claimed that they had a dedicated resource for metrics and analytics. It’s unclear if the trend is moving towards less resources for the function or if this is a result of the smaller survey sample size.
2.7 The status of HR metrics benchmarking
Since 2008, only a few organizations that wanted to benchmark have begun the process. Otherwise, the results are identical from last year.
Answer
%
Yes
25%
No, but I would like to start benchmarking
68%
No, I don't see the value in benchmarking
8%

© BC HRMA 2009 Page 11 of 22
2.8 HR metric benchmark service providers
Very few people submitted information regarding the service they use to benchmark their HR metrics. However, of the responses submitted, organizations benchmark with major HR consulting firms or freely share information with others in the same sector or industry.
Interestingly, in 2008, several survey respondents provided names of compensation consulting firms, indicating that the question was not understood or that the concept of HR metrics benchmarking was not mainstream. This year however, relatively few respondents indicated that they benchmarked with a salary benchmarking firm. This is a positive indicator that HR metrics and HR metrics benchmarking is a better understood concept.
The service providers mentioned were:
• Hay Group • Mercer • Watson Wyatt • BC HRMA • Industry roundtable
• External consultant • In house
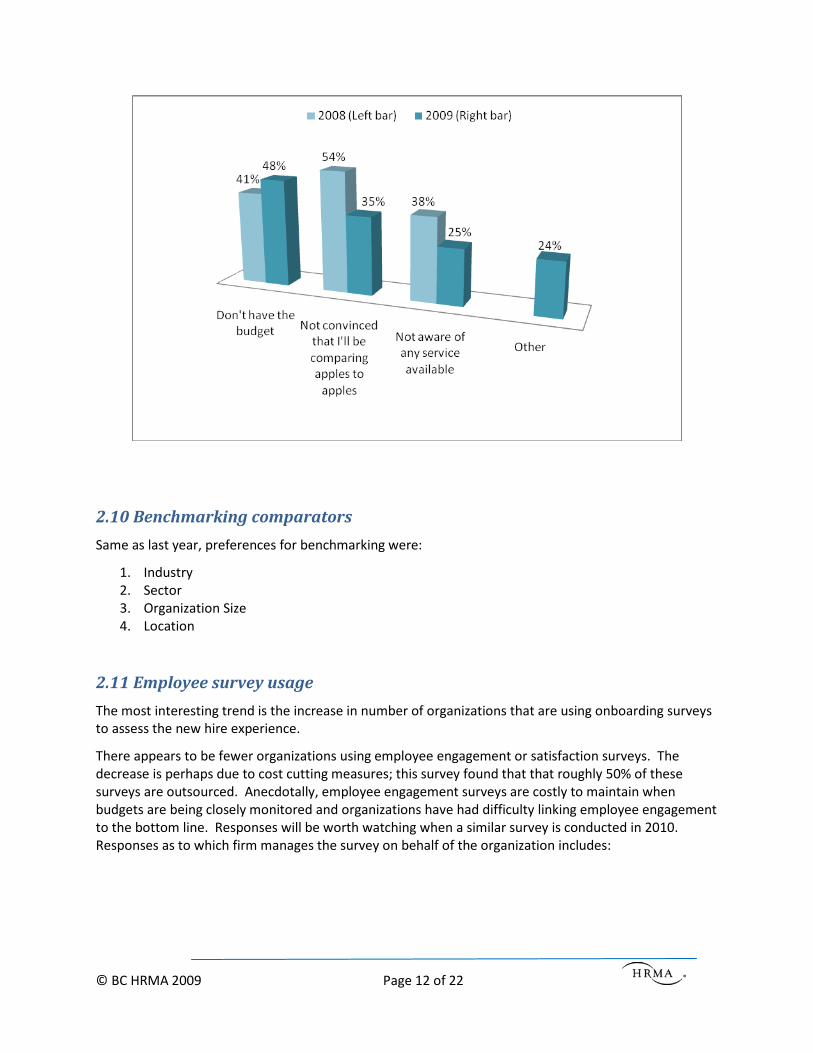
2.9 The challenges of benchmarking
There has been a significant shift in the responses to this question since last year. First, organizations are becoming more aware of the HR metrics benchmarking services that exist. Second, BC HRMA launched the HR Metrics Standards & Glossary on its website in May 2009 which likely contributed to the 35% drop in the number of people who don’t believe they can compare apples-to-apples when benchmarking.
Similar to the pattern of other survey responses, budget remains an issue and even more so than last year.
New to 2009 was the addition of the “other” category. Of those that chose this option, they indicated that they lacked resources which included both time and people. Others noted that benchmarking is not a priority or that they are in the early stages of tracking data.
© BC HRMA 2009 Page 12 of 22
2.10 Benchmarking comparators
Same as last year, preferences for benchmarking were:
1. Industry 2. Sector 3. Organization Size 4. Location
2.11 Employee survey usage
The most interesting trend is the increase in number of organizations that are using onboarding surveys to assess the new hire experience.
There appears to be fewer organizations using employee engagement or satisfaction surveys. The decrease is perhaps due to cost cutting measures; this survey found that that roughly 50% of these surveys are outsourced. Anecdotally, employee engagement surveys are costly to maintain when budgets are being closely monitored and organizations have had difficulty linking employee engagement to the bottom line. Responses will be worth watching when a similar survey is conducted in 2010. Responses as to which firm manages the survey on behalf of the organization includes:

© BC HRMA 2009 Page 13 of 22
• Mercer • SuccessFactors • Caliber • BC Stats • Mindfield • TCS Performance Strategics • Towers-Perrin • Gallup • Human Synergistics • Queen’s Business School with Hewitt • Hewitt • Ipsos Reid • McIntyre Business Consulting • Geode Consulting Group • Hay Group • Kwela Leadership & Talent Management • Statistics Canada
HR is missing a valuable opportunity by choosing not to introduce an HR service satisfaction survey as a part of their quality check with their clients.

© BC HRMA 2009 Page 14 of 22
2.12 Metrics most commonly used by organizations
Organizations are still tracking the basics; items that are the easiest to track and yet are the most popularly requested and commonly understood measures. Cost and retention metrics still reign supreme.
Tracking Labour Cost per FTE seems to be on everyone’s mind considering the labour cost reduction strategies used by several organizations, including layoffs, furloughs, unpaid leaves and elimination of merit increases.
Similar to the previous year, few have interest in collecting diversity data or information on internal career development (Career Path Ratio, Promotion Rate, Learning & Development Revenue Percentage). On the other hand, organizations are equally divided on whether they want to track productivity metrics or not; Human Capital Return on Investment is high on the list of desires but Revenue per FTE, Profit per FTE, and Human Capital Return on Investment are low on the desirability list.
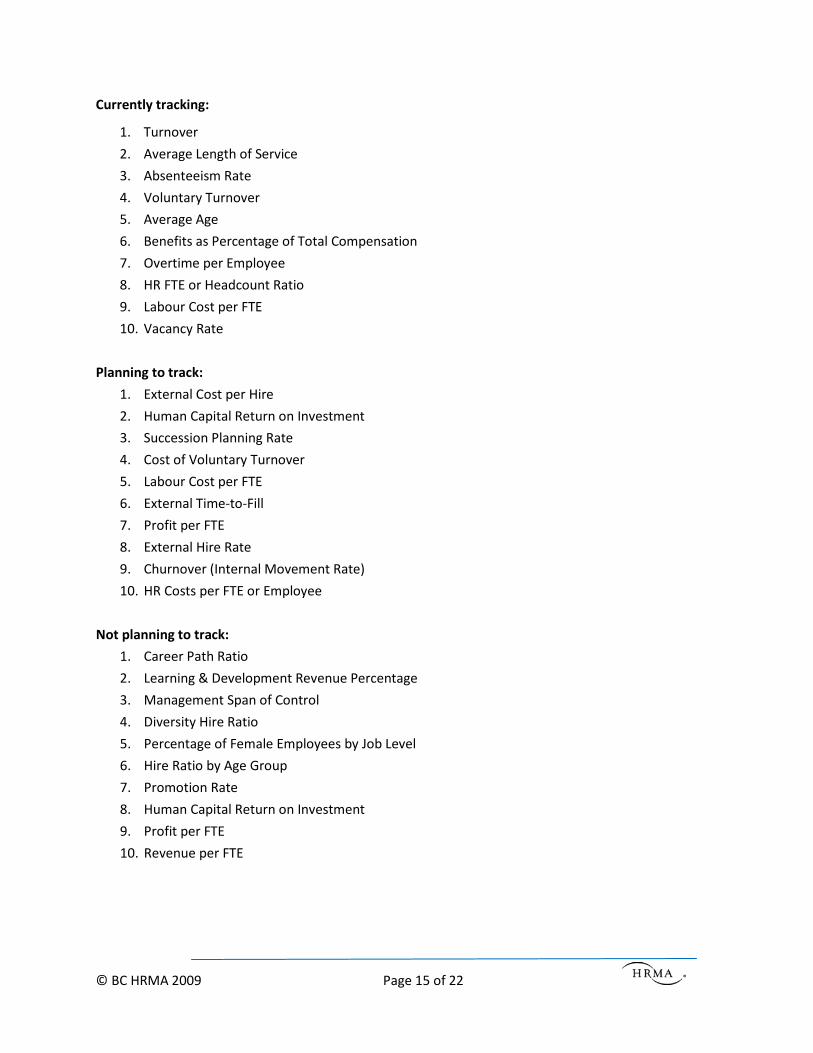
Below is a summary of the top ten in each category:
© BC HRMA 2009 Page 15 of 22
Currently tracking:
1. Turnover
2. Average Length of Service
3. Absenteeism Rate
4. Voluntary Turnover
5. Average Age
6. Benefits as Percentage of Total Compensation
7. Overtime per Employee
8. HR FTE or Headcount Ratio
9. Labour Cost per FTE
10. Vacancy Rate
Planning to track:
1. External Cost per Hire
2. Human Capital Return on Investment
3. Succession Planning Rate
4. Cost of Voluntary Turnover
5. Labour Cost per FTE
6. External Time-to-Fill
7. Profit per FTE
8. External Hire Rate
9. Churnover (Internal Movement Rate)
10. HR Costs per FTE or Employee
Not planning to track:
1. Career Path Ratio
2. Learning & Development Revenue Percentage
3. Management Span of Control
4. Diversity Hire Ratio
5. Percentage of Female Employees by Job Level
6. Hire Ratio by Age Group
7. Promotion Rate
8. Human Capital Return on Investment
9. Profit per FTE
10. Revenue per FTE

© BC HRMA 2009 Page 16 of 22
When asked to evaluate which type of metrics were most valuable, retention and recruitment metrics were the most popular, receiving the first or second vote half of the time. Despite the fact that B.C. was in a recession during the survey, these two items still receive a significant amount of attention. It appears that the HR profession is very interested in hiring and keeping people in the organization but are not as interested in monitoring their productivity, increasing productivity or managing efficiency in its own department.
From most to least popular categories of metrics:
1. Retention 2. Recruitment 3. Compensation & Benefits 4. Productivity 5. Learning & Development 6. Workforce Demographics 7. HR Efficiency
3. A Call to Action to HR Professionals
Many organizations now have constricted budgets and limited resources as a result of the economic climate. Many have laid off staff or have introduced unpaid leaves, shortened work weeks or eliminated pay increases to retain staff. However, according to BC HRMA’s 2009 HR Trends Report, several organizations still believe that retention, filling vacancies, skill shortage and leadership capacity/capability will be a challenge going forward. Based on this feedback from HR practitioners across B.C., there are several recommendations for improving the usefulness of HR metrics.
Tight budgets and limited revenue growth are likely to be a mainstay of our organizations well into the future. HR needs to start measuring now with what resources are available and focus on a few key metrics that can offer the most impact to the organization. HR cannot expect to obtain additional budget and resources until it proves to the executive team that they are choosing to make measurement a priority themselves. Once there is proof that HR is building its knowledge base, is capable, and is applying metrics to its operations, they can build the business case for resources with ease.
In instances where an organization has reduced its workforce, HR should focus on measuring productivity, profitability, and compensation to ensure that staffing levels are optimized while maximizing the return on investment. Metrics that should be considered are:
• Human Capital Return on Investment • Profit per FTE; Revenue per FTE • Absenteeism Rate • Labour Cost Revenue Percent
HR should also choose both efficiency and effectiveness measures to focus on activities that offer the greatest impact on the organization. Every organizational function can do things cheaply but it doesn’t necessarily mean that the right things are being done or being done well.

© BC HRMA 2009 Page 17 of 22
The use of employee surveys (onboarding, exit or engagement surveys) are popular but HR is being challenged to:
• ensure the results of the survey are being analyzed and the results used for action. • compliment this qualitative data with quantitative metrics; surveys should complement current
metrics and should assist diagnosing issues but should not ultimately be a goal in themselves • treat employee surveys confidentially but no longer ensure anonymity. Knowing employee
demographic data behind the survey responses should help further narrow down issues and target the action plan. For example, organizations should differentiate responses between various departments, locations, age group, job levels and length of service.
HR is being presented with a valuable opportunity to maximize its few resources. Respondents said that relatively few HR staff are receiving the HR metric results. HR professionals may become more effective at their jobs, understand the business better and choose to focus their activities on the right things when they start to receive this feedback. Knowledge is power and HR staff should be trusted to receive HR data on a regular basis so they can focus their limited time on activities that matter and perhaps offer valuable ideas back to the business to improve productivity and profitability.
Finally, HR professionals need access to basic resources to get started measuring and to feel confident when benchmarking that the results are comparable amongst organizations. HR metrics and data needs to be standardized to get credibility in the business world. Practitioners are encouraged to seek out the multitude of resources available online, including resources offered by BC HRMA.
4. Report Summary
HR knows that people matter and make a difference to the organization. HR metrics is a way to prove to the rest of the organization that human capital makes the difference between profitability and bust. What has the greatest return on investment: investing in physical capital which depreciates or investing in a program to recruit and retain the right people, and make them as productive as possible? HR metrics can provide those answers and assist HR to build a business case.
Organizations have come some way in measuring the HR function in the past year. At the first glance, the volume of HR departments that are not measuring or benchmarking may appear disappointing. However, considering that HR metrics have been on the agenda for thirty years, this appears to be the first time that organizations are taking action and making progress. 2010 will be an exciting year as we watch organizations that are just getting started become more goal-oriented and strategic.
While some HR practitioners are still seeking budget and resources, others are moving forward regardless, knowing that they need to make HR metrics a priority to be considered a valuable player in the organization. It is these professionals that are taking advantage of data standards now available, they are benchmarking to gain context on their figures within their industry or sector, choosing to make HR metrics a priority knowing that the long-term impact of doing so is valuable.

© BC HRMA 2009 Page 18 of 22
Appendix - Survey Demographic Data
Chart A1
The chart below shows the percentage of respondents by organizational sector.

© BC HRMA 2009 Page 19 of 22
Chart A2
The chart below shows the percentage of respondents by organizational size – based on headcount.

© BC HRMA 2009 Page 20 of 22
Chart A3
Which option best describes your organization's industry?

© BC HRMA 2009 Page 21 of 22
Chart A4
In which regions of B.C. does your organization have operations?

© BC HRMA 2009 Page 22 of 22
Chart A4
The chart below shows the percentage of respondents by their role within their organization.
About this Report
This report was authored Helen Luketic, Manager of HR Metrics & Research at BC HRMA. The support and advice of Ian Cook, Director of Research & Learning at BC HRMA was invaluable in developing themes and interpreting the data.
All copyright for this material belongs to BC HRMA and no material from this report may be reproduced without acknowledging BC HRMA as the source.
Any questions or feedback regarding this report can be sent to [email protected].
This complimentary report is valued at $55.