Hull Public Health Profiles 2015: University...
16
Hull Public Health Profiles 2015: University Ward Public Health Sciences, Hull City Council (www.hullpublichealth.org ), August 2015
Transcript of Hull Public Health Profiles 2015: University...
Hull Public Health
Profiles 2015:
University Ward
Public Health Sciences, Hull City Council
(www.hullpublichealth.org), August 2015

About this profile
This public health profile presents the most up to date information on a range of topics, to help us understand who lives in each area of Hull, and what their needs might be. We have also included comparisons with the Hull average, the Yorkshire and Humber average and the England average where data were available The sources of the information, as well some explanatory notes, are provided in the Data Sources section towards the end of the report. We hope you find this profile useful. If you have questions or feedback, please use the contact details at the end of this profile. Please do explore the rest of the www.hullpublichealth.org website, which has a wealth of information on health, lifestyles and attitudes to these, of Hull residents. The website includes the following:
Hull’s Joint Strategic Needs Assessment and supporting information (see the last page of this report for further information).
Director of Public Health Annual Reports for Hull.
In-depth survey reports from both adult surveys conducted across Hull (Health and Lifestyle surveys in 2003, 2007 and 2011-12, Social Capital surveys in 2004 and 2009, Prevalence surveys in 2009 and 2014) and from surveys of the health and lifestyle of young people, conducted in secondary schools across Hull.
41 In-depth Public Health Profiles for Hull exploring individual disease areas, population groups and lifestyle behaviours and many more (available to download from www.hullpublichealth.org/jsnatoolkit.html).
Also available are ward profiles (2009, 2011, 2013 and 2015) and GP practice profiles (2011)
Equity Audits which examine how fairly services or other resources are distributed in
relation to health 'needs' of different groups and areas, and assesses the
success of programmes which aim to improve any inequities that are found.
Public Health Outcomes Framework, which are a range of indicators used to assess whether public health is improving or not. A series of analyses using both the national datasets as well as locally derived data are provided to examine Hull in some detail for each of these indicators. Each of these reports may be downloaded from, www.hullpublichealth.org/phof.html.
Short Summary Public Health Profiles For Hull
Hull atlas, which enable differences between wards in Hull to be examined visually on a map (www.hullpublichealth.org/hullatlas.html). Further information is given towards the end of this report.

Population structure (2013)1
Age (yrs) Males Females Total Under 10 650 564 1,214
10-19 693 685 1,378
20-29 1,392 1,380 2,772
30-39 541 570 1,111
40-49 524 550 1,074
50-59 493 490 983
60-69 379 396 775
70-79 258 326 584
80+ 121 217 338
Total 5,051 5,178 10,229
Ethnicity (from 2011 census)2
Household composition (2011 census)3
Household tenure (from 2011 census)4
Under 5
5 to 9
10 to 14
15 to 19
20 to 24
25 to 29
30 to 34
35 to 39
40 to 44
45 to 49
50 to 54
55 to 59
60 to 64
65 to 69
70 to 74
75 to 79
80 to 84
85 and over
Under 5
5 to 9
10 to 14
15 to 19
20 to 24
25 to 29
30 to 34
35 to 39
40 to 44
45 to 49
50 to 54
55 to 59
60 to 64
65 to 69
70 to 74
75 to 79
80 to 84
85 and over
Under 5
5 to 9
10 to 14
15 to 19
20 to 24
25 to 29
30 to 34
35 to 39
40 to 44
45 to 49
50 to 54
55 to 59
60 to 64
65 to 69
70 to 74
75 to 79
80 to 84
85 and over
Males Females
1,000 800 600 400 200 0 200 400 600 800 1,000
University
Hull
2013 mid-year population estimates from the Office for National Statistics
77.9%
22.1%
White British BME community
6.7%
2.1%
7.5%
3.6%
2.3%
0%
2%
4%
6%
8%
10%
White Other Mixed/ Multiple Heritage
Asian/ Asian British
Black/ Black British
Other Ethnic group
University Hull
12%
21%
13%16%
4%
10%
4%6%
15%
0%
10%
20%
30%
One person: 65+
One person: <65
Couple: no children
Couple: dependent
children
Couple: non-dependent
children
Lone parent: dependent
children
Lone parent: non-dependent
children
All aged 65+ All other housholds
University Hull
17.7%
23.5%
0.1%
23.2%
10.1%
24.2%
1.2%
0%
10%
20%
30%
40%
Owned outright
Owned with mortgage
Shared ownership
Rented from council
Other social rented
Private rented
Living rent-free
University Hull

National quintiles of IMD 2010 5
Fuel Poverty 20126
A household is said to be fuel poor if it needs to spend more than 10% of its income on fuel
in order to maintain an adequate standard of warmth.
Child Poverty 20127
The proportion of dependent children under 20 years living in families in receipt of CTC whose reported income is
less than 60 per cent of the median income or are in receipt of IS or (Income-
Based) JSA.
0%
20%
40%
60%
80%
100%
University Hull England
Most 2 3 4 Least
15.7%
11.1% 10.8% 10.4%
0%
5%
10%
15%
20%
University Hull Yorkshire and the Humber
England
33.4%30.4%
20.0%18.6%
0%
10%
20%
30%
40%
University Hull Yorkshire and the Humber
England
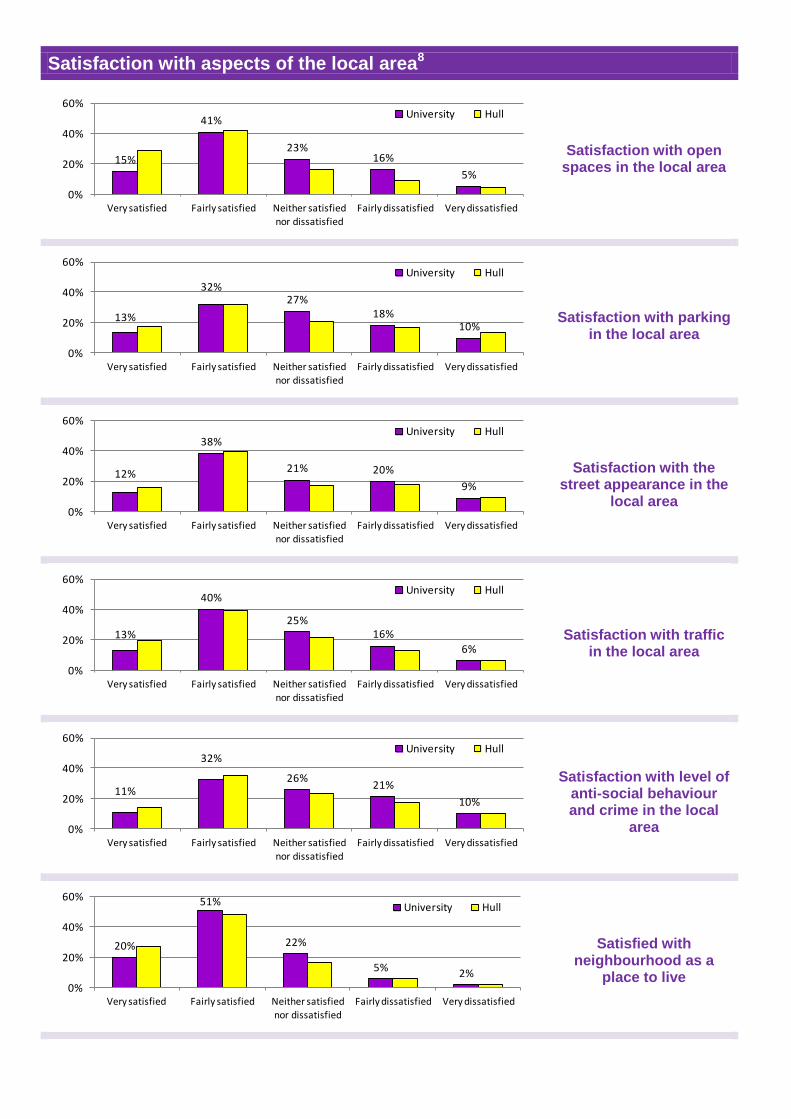
Satisfaction with aspects of the local area8
Satisfaction with open spaces in the local area
Satisfaction with parking in the local area
Satisfaction with the street appearance in the
local area
Satisfaction with traffic in the local area
Satisfaction with level of anti-social behaviour and crime in the local
area
Satisfied with neighbourhood as a
place to live
15%
41%
23%16%
5%
0%
20%
40%
60%
Very satisfied Fairly satisfied Neither satisfied
nor dissatisfied
Fairly dissatisfied Very dissatisfied
University Hull
13%
32%27%
18%10%
0%
20%
40%
60%
Very satisfied Fairly satisfied Neither satisfied
nor dissatisfied
Fairly dissatisfied Very dissatisfied
University Hull
12%
38%
21% 20%
9%
0%
20%
40%
60%
Very satisfied Fairly satisfied Neither satisfied
nor dissatisfied
Fairly dissatisfied Very dissatisfied
University Hull
13%
40%
25%16%
6%
0%
20%
40%
60%
Very satisfied Fairly satisfied Neither satisfied
nor dissatisfied
Fairly dissatisfied Very dissatisfied
University Hull
11%
32%
26%21%
10%
0%
20%
40%
60%
Very satisfied Fairly satisfied Neither satisfied
nor dissatisfied
Fairly dissatisfied Very dissatisfied
University Hull
20%
51%
22%
5% 2%0%
20%
40%
60%
Very satisfied Fairly satisfied Neither satisfied
nor dissatisfied
Fairly dissatisfied Very dissatisfied
University Hull

Neighbours look out for one another9
Trust in neighbours10
Feelings of safety when . . . .11
. . . . walking alone in area during the daytime
. . . . walking alone in area after dark
. . . . alone in own home at night
52%
23% 25%
0%
20%
40%
60%
80%
Yes No Don't know
Is this a neigbourhood where neighbours look out for each other?
University Hull
27%24%
34%
7% 9%
0%
20%
40%
60%
Most Many A few None Don't know
How many people in your neighbourhood do you trust?
University Hull
52%
39%
8%2%
0%
20%
40%
60%
Very safe Fairly safe A bit unsafe Very unsafe
University Hull
13%
43%
32%
12%
0%
20%
40%
60%
Very safe Fairly safe A bit unsafe Very unsafe
University Hull
49%
41%
8%2%
0%
20%
40%
60%
Very safe Fairly safe A bit unsafe Very unsafe
University Hull

Unemployment12
Job Seekers Allowance claimants April 2015 (%)
Job Seekers Allowance claimants, by age of claimant, April 2015 (percentage of all JSA claimants)
Job Seekers Allowance claimants, by length of claim, April 2015 (percentage of all JSA claimants)
5.0%
2.7%
3.8%
0%
1%
2%
3%
4%
5%
6%
7%
Males Females All
JSA
cla
iman
ts A
pri
l 2
01
5 (%
)
University Hull Yorkshire and the Humber England
0%
20%
40%
60%
80%
100%
University Hull Yorkshire and the Humber
England
Pe
rce
nta
ge o
f al
l JS
A c
laim
ants
50+
25-49
18-24
0%
20%
40%
60%
80%
100%
University Hull Yorkshire and the Humber
England
Pe
rce
nta
ge o
f al
l JS
A c
laim
ants
Up to 6months
6 months up to 12 months
12 months or more
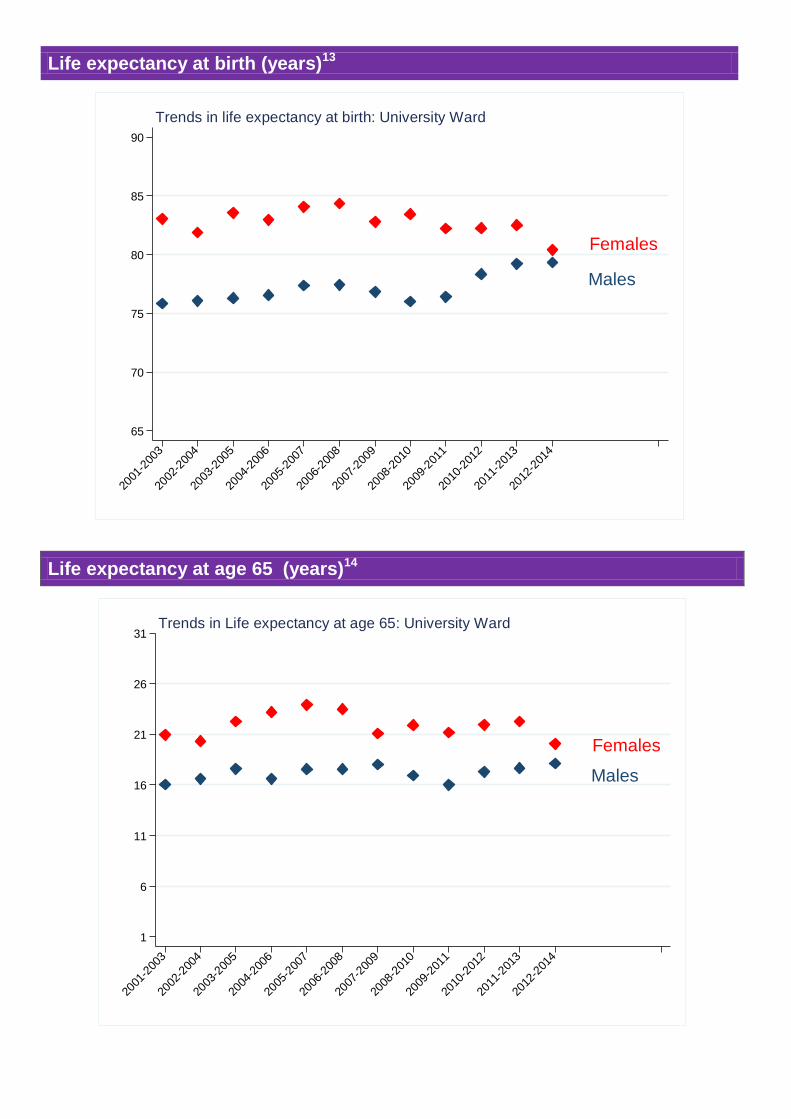
Life expectancy at birth (years)13
Life expectancy at age 65 (years)14
Males
Females
65
70
75
80
85
90
Life
expe
cta
ncy a
t b
irth
(ye
ars
)
2001
-200
3
2002
-200
4
2003
-200
5
2004
-200
6
2005
-200
7
2006
-200
8
2007
-200
9
2008
-201
0
2009
-201
1
2010
-201
2
2011
-201
3
2012
-201
4
Trends in life expectancy at birth: University Ward
Males
Females
1
6
11
16
21
26
31
Life
expe
cta
ncy a
t a
ge 6
5 (
ye
ars
)
2001
-200
3
2002
-200
4
2003
-200
5
2004
-200
6
2005
-200
7
2006
-200
8
2007
-200
9
2008
-201
0
2009
-201
1
2010
-201
2
2011
-201
3
2012
-201
4
Trends in Life expectancy at age 65: University Ward

Under 75 Standardised Mortality Ratios 2012-201415
Most common causes of death 2012-201416
Common causes of hospital admissions 2010-201217
.
7 deaths
9 deaths
7 deaths
10 deaths
.
25 deaths
47 deaths
.
6 deaths
10 deaths
5 deaths
8 deaths
15 deaths
42 deaths
England=100***
Stroke: women
Coronary heart disease: women
All circulatory disease: women
All respiratory disease: women
Lung cancer: women
Breast cancer: women
All cancers: women
All deaths: women
Stroke: men
Coronary heart disease: men
All circulatory disease: men
All respiratory disease: men
Lung cancer: men
All cancers: men
All deaths: men
0 50 100 150 200 250 300 350 400 450 500
Hull Wadr (with 95% confidence interval**)
*Standardised Mortality Ratios, not produced if fewer than 5 deaths during 2012-2014. **Upper confidence limit truncated at 500.***England 2011-2013.
Under 75 SMRs* 2012-2014: University Ward
13%
23%
13%
6% 6%
16%
22%
0%
10%
20%
30%
40%
Lung cancer Other cancers Coronary heart disease
Stroke Other circulatory disease
Respiratory diseases
Other causes of death
Pe
rce
nta
ge o
f d
eat
hs University (226 deaths) Hull England
0
1,000
2,000
3,000
4,000
Cancer Coronary Heart Disease
Stroke Other circulatory diseases
COPD Other respiratory diseases
digestive diseases
Stan
dard
ise
d ad
mis
sion
rat
e
pe
r 1
00
,00
0 r
esi
de
nts University Hull
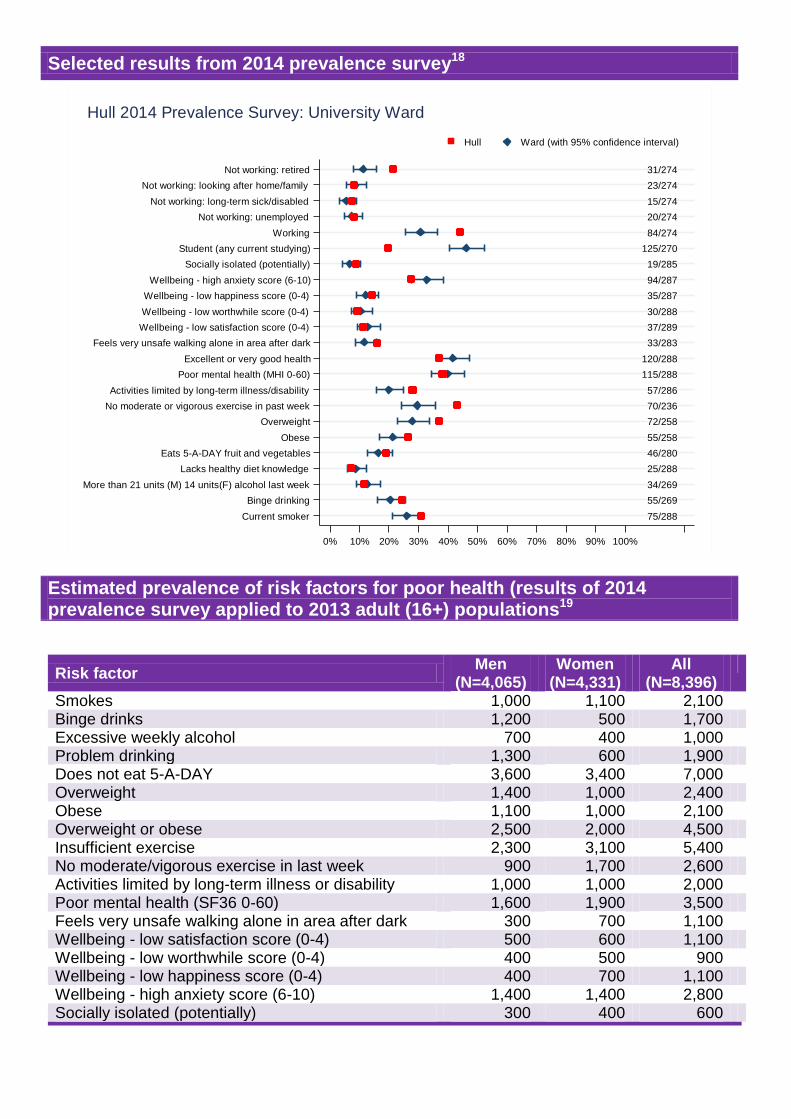
Selected results from 2014 prevalence survey18
Estimated prevalence of risk factors for poor health (results of 2014 prevalence survey applied to 2013 adult (16+) populations19
Risk factor Men
(N=4,065) Women
(N=4,331) All
(N=8,396)
Smokes 1,000 1,100 2,100 Binge drinks 1,200 500 1,700 Excessive weekly alcohol 700 400 1,000 Problem drinking 1,300 600 1,900 Does not eat 5-A-DAY 3,600 3,400 7,000 Overweight 1,400 1,000 2,400 Obese 1,100 1,000 2,100 Overweight or obese 2,500 2,000 4,500 Insufficient exercise 2,300 3,100 5,400 No moderate/vigorous exercise in last week 900 1,700 2,600 Activities limited by long-term illness or disability 1,000 1,000 2,000 Poor mental health (SF36 0-60) 1,600 1,900 3,500 Feels very unsafe walking alone in area after dark 300 700 1,100 Wellbeing - low satisfaction score (0-4) 500 600 1,100 Wellbeing - low worthwhile score (0-4) 400 500 900 Wellbeing - low happiness score (0-4) 400 700 1,100 Wellbeing - high anxiety score (6-10) 1,400 1,400 2,800 Socially isolated (potentially) 300 400 600
75/288
55/269
34/269
25/288
46/280
55/258
72/258
70/236
57/286
115/288
120/288
33/283
37/289
30/288
35/287
94/287
19/285
125/270
84/274
20/274
15/274
23/274
31/274
Current smoker
Binge drinking
More than 21 units (M) 14 units(F) alcohol last week
Lacks healthy diet knowledge
Eats 5-A-DAY fruit and vegetables
Obese
Overweight
No moderate or vigorous exercise in past week
Activities limited by long-term illness/disability
Poor mental health (MHI 0-60)
Excellent or very good health
Feels very unsafe walking alone in area after dark
Wellbeing - low satisfaction score (0-4)
Wellbeing - low worthwhile score (0-4)
Wellbeing - low happiness score (0-4)
Wellbeing - high anxiety score (6-10)
Socially isolated (potentially)
Student (any current studying)
Working
Not working: unemployed
Not working: long-term sick/disabled
Not working: looking after home/family
Not working: retired
0% 10% 20% 30% 40% 50% 60% 70% 80% 90% 100%
Hull Ward (with 95% confidence interval)
Hull 2014 Prevalence Survey: University Ward

Multiple risk factors (smoking, drinking excessive amounts of alcohol or binge drinking, obesity, insufficient exercise) from 2014 prevalence survey20
Number of adults with risk factors
Percentage of adults with risk factors
0
500
1,000
1,500
2,000
2,500
3,000
16-24 25-44 45-64 65-74 75+
Esti
mat
ed
nu
mb
er
of
pe
op
le a
ged
16
+ y
ear
s w
ith
th
e r
isk
fact
ors
Age (years)
Smoking Smoking, drinking
Smoking, drinking, exercise Smoking, alcohol, exercise, obesity
Smoking, alcohol, obesity Smoking, exercise
Smoking, exercise, obesity Smoking, obesity
Alcohol Exercise
Obesity Alcohol, exercise
Alcohol, obesity Exercise, obesity
Alcohol, exercise, obesity None of these
0%
10%
20%
30%
40%
50%
60%
70%
80%
90%
100%
16-24 25-44 45-64 65-74 75+
Esti
mat
ed
pro
po
rtio
n o
f ad
ult
s w
ith
th
e r
isk
fact
or
Age (years)
Smoking
Smoking, drinking
Smoking, drinking, exercise
Smoking, alcohol, exercise, obesity
Smoking, alcohol, obesity
Smoking, exercise
Smoking, exercise, obesity
Smoking, obesity
Alcohol
Exercise
Obesity
Alcohol, exercise
Alcohol, obesity
Exercise, obesity
Alcohol, exercise, obesity
None of these
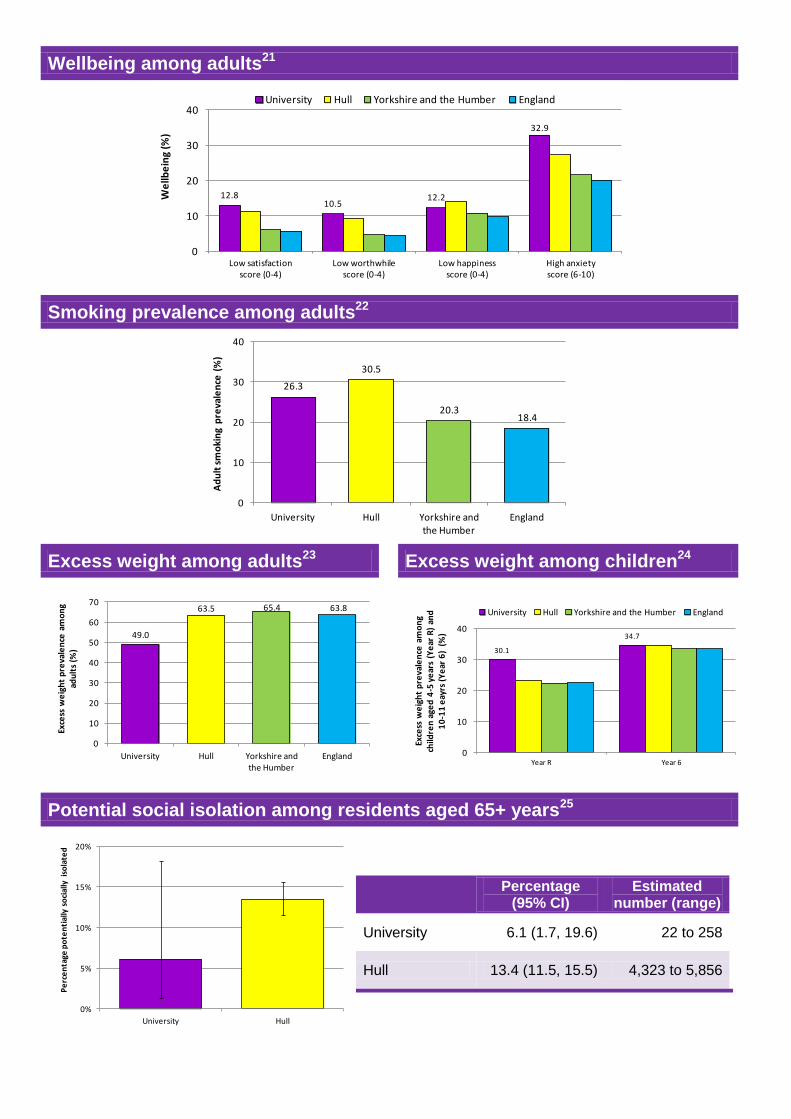
Wellbeing among adults21
Smoking prevalence among adults22
Excess weight among adults23 Excess weight among children24
Potential social isolation among residents aged 65+ years25
Percentage
(95% CI) Estimated
number (range)
University 6.1 (1.7, 19.6) 22 to 258
Hull 13.4 (11.5, 15.5) 4,323 to 5,856
12.810.5
12.2
32.9
0
10
20
30
40
Low satisfaction score (0-4)
Low worthwhile score (0-4)
Low happiness score (0-4)
High anxiety score (6-10)
We
llbe
ing
(%)
University Hull Yorkshire and the Humber England
26.3
30.5
20.318.4
0
10
20
30
40
University Hull Yorkshire and the Humber
England
Ad
ult
sm
oki
ng
pre
vale
nce
(%
)
49.0
63.5 65.4 63.8
0
10
20
30
40
50
60
70
University Hull Yorkshire and the Humber
England
Exce
ss w
eig
ht
pre
vale
nce
am
on
g ad
ult
s (%
) 30.1
34.7
0
10
20
30
40
Year R Year 6
Exce
ss w
eig
ht
pre
vale
nce
am
on
g ch
ildre
n a
ged
4-5
ye
ars
(Ye
ar R
) an
d
10
-11
eay
rs (
Ye
ar 6
) (
%)
University Hull Yorkshire and the Humber England
0%
5%
10%
15%
20%
University Hull
Pe
rce
nta
ge p
ote
nti
ally
so
cial
ly i
sola
ted

Births26
5
Population projections to 203527
Percentage of population registered to each GP practice, 201528
40.3
67.561.9 62.4
0
20
40
60
80
University Hull Yorkshire and the Humber
England
Bir
th r
ate
pe
r 1
,00
0w
om
en
age
d 1
5-4
4 y
ear
s
Birth rate in 2013
0 50 100 150
2013
2012
2011
2010
2009
2008
2007
2006
2005
2004
2003
2002
2001
Number of births
0
500
1,000
1,500
2,000
2,500
3,000
3,500
4,000
4,500
<20 years 20-39 years 40-64 years 65+ years
2013 population
2020 projected population
2025 projected population
2030 projected population
2035 projected population
25%
16%
11%8%
8%
5%
5%
4%
4%
3% 12%
Dr Rawcliffe & Partners
Dr Nayar & Partner
Faith House Surgery
Dr Awan & Partners
Dr Lorenz & Partners
Clifton House Medical Centre
The Bridge Group Practice
Dr Westrop & Partners
Dr Cook
Haxby Group Hull
Other
N=10,727

Data sources
1 Population data from Office for National Statistics (ONS) mid-year population estimates for 2013
(www.ons,gov.uk). 2,3,4 Data from the 2011 census (http://www.ons.gov.uk/ons/guide-method/census/2011/index.html). 5 IMD 2010 is produced by the Department for Communities and Local Government
(https://www.gov.uk/government/statistics/english-indices-of-deprivation-2010). IMD 2015 is in production but is not due to be released until September 2015. The map also uses boundary files supplied by ONS.
6 Fuel poverty data is produced by the Department for Energy and Climate Change (https://www.gov.uk/government/publications/2012-sub-regional-fuel-poverty-data-low-income-high-costs-indicator). The latest data release is for 2012. This is also indicator 1.17 in the Public Health outcomes Framework (www.phoutcomes.info).
7 Child Poverty data is produced by HM Revenue and Customs (https://www.gov.uk/government/statistics/personal-tax-credits-children-in-low-income-families-local-measure-2012-snapshot-as-at-31-august-2012). Data is for 2012, and was last updated in December 2014. This is also indicator 1.01i in the Public Health outcomes Framework (www.phoutcomes.info).
8,9,10 Data are taken from Hull’s 2011-12 Adult Health and Lifestyle Survey of more than 13,500 adults in Hull aged 16 years and over (http://www.hullpublichealth.org/adults.html#ad2011).
11 Feelings of safety figures are derived from Hull’s 2014 Adult Prevalence Survey of more than 5,000 adults in Hull aged 16 years and over (full survey results will be published at http://www.hullpublichealth.org/adults.html once finalised). Respondents were asked about feelings of safety when walking alone in their local area during the daytime and after dark, as well as when alone at home at night. Response choices were ‘Very safe’, ‘Fairly safe’, ‘A bit unsafe’, ‘Very unsafe’ and ‘Never goes out’ /’Never alone at home at night’. If the respondent chose the last answer they were further asked how they would feel if they did go out alone / were at home alone at night, with just four response choices ‘Very safe’, ‘Fairly safe’, ‘A bit unsafe’ and ‘Very unsafe’. Data from these supplementary questions was then combined with the initial questions.
12 Unemployment data is taken from NOMIS (http://www.nomisweb.co.uk/reports/lmp/ward2011/contents.aspx) which is a services provided by ONS for detailed up-to dater labour market statistics. Data are for April 2015.
13,14 Life expectancy was produced using mortality data from the Public Health Mortality File (PHMF), supplied by ONS, and mid-year population estimates, rebased after the 2011 census, also supplied by ONS. Life expectancy at birth and at age 65 is also indicator 0.1ii in the Public Health outcomes Framework (www.phoutcomes.info).
15 Under 75 SMRs indicate whether local premature mortality rates are higher or lower than would be expected if national (England) rates applied to the local population. Death data are from the PHMF, supplied by ONS, and the population data are from ONS mid-year estimates, rebased after the 2011 census. National mortality rates were extracted from data available from the Health and Social Care Information Centre (https://indicators.ic.nhs.uk/webview/).
16 Death data are taken from the PHMF. 17 Hospital admission data is taken from Hospital Episode Statistics (HES). Rates were produced using HES
data and population data (taken from GP registered populations, supplied through the Primary Care Information System).
18,19,20 Data from the 2014 Prevalence Survey of Adults in Hull aged 16 years and over was conducted among more than 5,000 Hull residents. Full survey results will be published at http://www.hullpublichealth.org/adults.html once finalised. Population data were the 2013 mid-year estimated population produced by ONS. Estimated numbers are rounded to the nearest 100.
21,22,23 Local data is taken from Hull’s 2014 Prevalence Survey of Adults aged 16 years of more than 5,000 Hull residents. Full survey results will be published at http://www.hullpublichealth.org/adults.html once finalised. Regional and national data are taken from the Public Health Outcomes Framework (www.phoutcomes.info) of which these are indicators 2.12 (excess weight), 2.14 (smoking prevalence) and 2.23 (wellbeing).
24 Local data is taken from Hull’s extract of the National Child Measurement Programmes. Regional and national data, also derived from the National Child Measurement Programme, are taken from the Public Health Outcomes Framework (www.phoutcomes.info) of which this is indicator 2.06.
25 The definition of potentially socially isolated is an adult is the only adult living in the household, and does not speak to at least ne of family, friends or neighbours each day. Data are from Hull’s 2014 Prevalence Survey of Adults aged 16 years of more than 5,000 Hull residents. Full survey results will be published at http://www.hullpublichealth.org/adults.html once finalised. Population data are from the 2013 ONS mid-year population estimates.
26 The number of births is from the Public Health Births File (PHBF). The birth rate per 1,000 is produced using the PHBF and populations from the ONS mid-year population estimates for 2013. Regional and national birth rates were extracted from data available from the Health and Social Care Information Centre (https://indicators.ic.nhs.uk/webview/).
27 Population projections were produced by applying the ONS projected population changes by single year of age to the 2013 ONS mid-year estimated populations, thence aggregating the results by broad age band.
28 Figure is produced from the April 2015 GP populations by lower layer super output area published by the Health and Social Care Information Centre (www.hscic.gov.uk). The number of residents quoted in the figure is higher than in the population table, as it comes from the GP registration file which historically tends to be higher than the mid-year population estimates presented in the population table

Hull Atlas There are seven sets of data currently presented in the JSNA Interactive Atlas at ward level:
i. Life expectancy and Standardised Mortality Ratios ii. Information from the 2011 census iii. Indicators from the Public Health Outcomes Framework iv. Health status and behavioural risk factors form surveys conducted in Hull v. Social Capital measures from surveys conducted in Hull vi. Hospita admissions vii. Deprivation and crime
The first indicator is automatically presented for each page. To change the indicator, click on “Data” (above the map) and select from the list. You can click on Hull, an Area or deprivation in the “Comparison Table” box to show the comparison information on the charts for the chosen area. Example: Male Life Expectancy at Birth, by Ward This page displays a “Time Series Chart” box which gives the trends over time (1999-2001 to 2010-2012 at the time of publication). The 95% confidence interval for the selected year is given in the bar chart. If the number of deaths is less than 3 for a ward, it is not included for data confidentiality reasons. For men and women separately, life expectancy at birth and SMRs for those aged under 75 years for all causes, respiratory disease, circulatory disease, chronic obstructive pulmonary disease (COPD), coronary heart disease (CHD), stroke, all cancers and lung cancer can be selected.

Hull's Joint Strategic Needs Assessment (JSNA) What is a JSNA? The JSNA assess the current and future health, care and well-being needs of the people of Hull.
• Joint - The JSNA is carried out jointly by NHS Hull and Hull City Council. It is the joint
responsibility of the Director of Public Health, Director of Children’s Services and the Director of Adult Social Services.
• Strategic - Intended to give the information that allows decision makers to make sound strategic decisions.
• Needs Assessment - Gives a scientifically robust understanding of the health and wellbeing needs of a local population for more focused commissioning and service delivery.
What will you do with the JSNA? The JSNA will be used to inform the way in which services are organised and delivered in Hull to meet the needs of the local population. Available for strategic planning, but also micro-implementation. What is different about the Hull JSNA?
The JSNA is regularly updated and is a living and interactive web based resource for all the people of Hull, the Voluntary Sector, the Council, all the NHS Organisations and Trusts, the Police and Fire Service.
The JSNA draws on information gained through local surveys, allowing for ‘real’ trends to be analysed based on Hull’s epidemiological profile as opposed to synthetic or modelled data from national sources.
For further information, please contact: Public Health Sciences, Hull Public Health, Hull City Council, Brunswick House, Strand Close, Beverley Road, Hull HU2 9DB
www.hullpublichealth.org