Hugs, Heaven and Mental Health: Belonging, Social Support and Life Satisfaction
23
Hugs, Heaven and Mental Health: Belonging, Social Support and Life Satisfaction Jack Jedwab Association for Canadian Studies Presented at Conference on Multiple Diversities at the Hospital for Sick Kids, Toronto, Ontario
-
Upload
amelia-potter -
Category
Documents
-
view
16 -
download
0
description
Hugs, Heaven and Mental Health: Belonging, Social Support and Life Satisfaction. Jack Jedwab Association for Canadian Studies Presented at Conference on Multiple Diversities at the Hospital for Sick Kids, Toronto, Ontario December 2009. Questions. What dose of diversity is healthy? - PowerPoint PPT Presentation
Transcript of Hugs, Heaven and Mental Health: Belonging, Social Support and Life Satisfaction

Hugs, Heaven and Mental Health: Belonging, Social Support and Life
Satisfaction
Jack Jedwab
Association for Canadian Studies
Presented at Conference on Multiple Diversities at the Hospital
for Sick Kids, Toronto, Ontario
December 2009

Questions
What dose of diversity is healthy? What form should it take?Is knowing who we are culturally important to
our state of mind and degree of life satisfaction?Or is leaving cultural baggage behind better for
our state of mind and life satisfaction?In other words how important is community
belonging How do we distinguish structural from cultural
factors in determining certain mental health outcomes?
Challenges
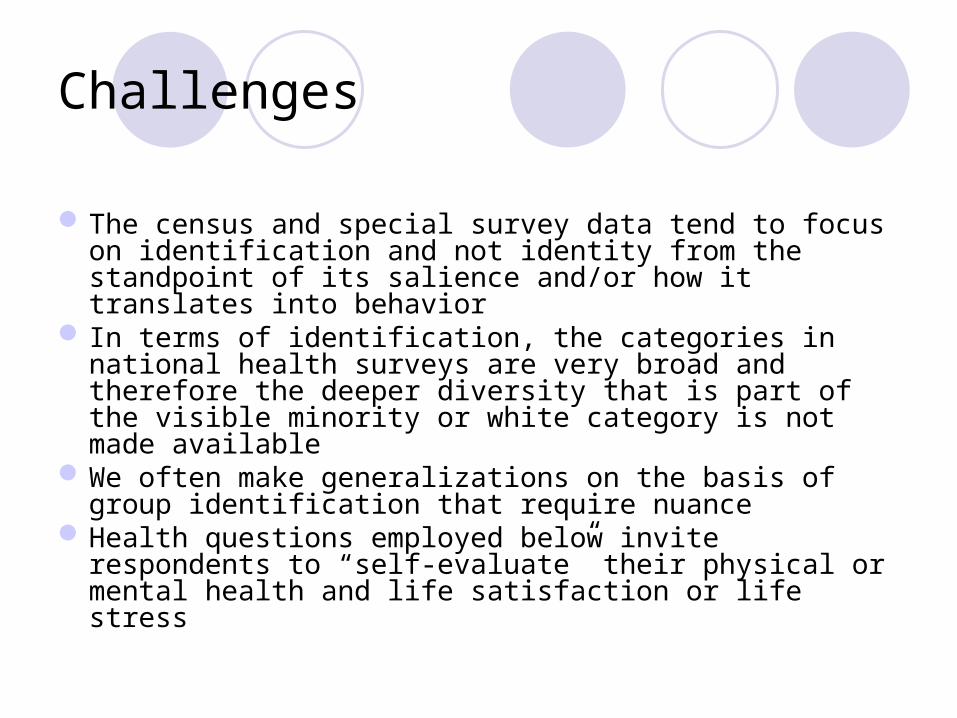
The census and special survey data tend to focus on identification and not identity from the standpoint of its salience and/or how it translates into behavior
In terms of identification, the categories in national health surveys are very broad and therefore the deeper diversity that is part of the visible minority or white category is not made available
We often make generalizations on the basis of group identification that require nuance
Health questions employed below invite respondents to “self-evaluate” their physical or mental health and life satisfaction or life stress
Some Indicators
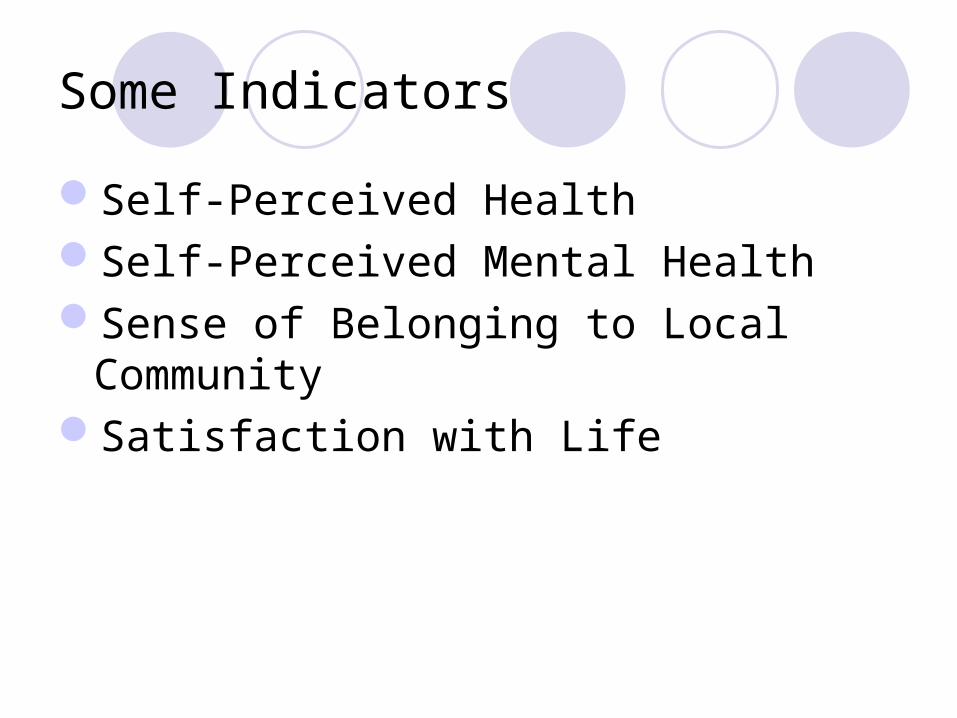
Self-Perceived Health Self-Perceived Mental Health Sense of Belonging to Local CommunitySatisfaction with Life

Some Identity Indicators
Age Immigrant Status Visible Minority Length of Time in CanadaBelonging to Ethnic Group Belonging to Family

Some Sources employed here
Statistics Canada, Census of Canada 2006
Statistics Canada, Canadian Community Health Survey 2007
Statistics Canada. Ethnic Diversity Survey, 2002
Leger Marketing Survey, 2009

Heaven and Hugs
The CCHS reveals that while frequency of attendance at religious services has no discernable affect on the state of mental health, the level of social support does as evidences by the degree of affection one obtains and the positive self-evaluation of mental health

CCHS 2007
spiritual values provide strength for everyday difficulties
self-perceived mental health
a lot some a little not at all Total
excellent 33,3% 34,0% 32,4% 31,3% 33,4%
very good 36,6% 36,6% 37,4% 37,5% 36,7%
good 23,9% 23,5% 25,0% 27,3% 24,0%
fair 5,5% 5,0% 4,4% 2,8% 5,0%
poor ,8% ,9% ,8% 1,1% ,9%
Total 100,0% 100,0% 100,0% 100,0% 100,0%
Spiritual guidance appears to do little for mental health

self-perceived mental health-excellent CCHS 2007
none of the time little/time
some of the time
most of the time
all of the time Total
has someone who loves and makes feel wanted
27,5% 24,8% 24,7% 31,1% 44,0% 39,1%
has someone who understands problems
25,4% 23,2% 25,6% 32,8% 45,3% 39,1%
has someone to turn to for suggestions for personal problems
27,2% 25,9% 26,9% 32,2% 44,8% 39,1%
Has someone who gives hugs
24,8% 23,8% 27,0% 32,3% 44,1% 39,1%
Has someone to confide in
28,7% 26,0% 24,5% 31,0% 44,2% 39,0%
More hugs fosters better self-perceived mental health

Community Belonging Mental Health and Life Satisfaction

White sense of belonging to local community
Excellent self-perceived mental
healthCCHS 2007 very strong somewhat strong
somewhat weak very weak Total
12-14 49,6% 37,0% 30,8% 32,9% 40,1%
15-17 54,0% 42,5% 34,6% 34,3% 42,0%
18-19 47,7% 41,2% 35,6% 33,3% 39,9%
20-24 50,8% 44,8% 36,1% 37,5% 41,9%
25-29 52,8% 44,5% 35,1% 34,6% 41,6%
30-34 50,7% 41,8% 34,1% 30,6% 39,7%
Those with Stronger Community Belonging
more likely to report excellent mental health

very satisfied with life in General 12-14
Born in… Canada Outside Canada Total
Very Strong sense of belonging to local community
White 65,1% 70,4% 65,3%
Visible Minority 53,2% 75,9% 57,3%
somewhat strong sense of belonging to Community
White 47,1% 47,5% 47,1%
Visible Minority 42,8% 44,9% 43,3%
Somewhat weak sense of belonging to community
White 33,4% 40,0% 33,6%
Visible Minority 22,5% 22,6% 22,6%
12-14 strong sense of belonging to local community
more likely to be very satisfied with life

very satisfied with life in General 15-17
Born in… Canada Outside Canada Total
Very Strong sense of belonging to local community
White 62,3% 41,2% 61,7%
Visible Minority 47,5% 56,4% 49,4%
somewhat strong sense of belonging to Community
White 44,7% 45,0% 44,7%
Visible Minority 33,8% 32,7% 33,5%
Somewhat weak sense of belonging to community
White 33,6% 16,2% 32,9%
Visible Minority 32,5% 30,2% 31,8%
Same for 15-17

Very Strong Sense of Belonging to the Community
Self Perceived Mental Health
Less than 20K $20,000-$39,999
40,000-59,999
60, 000-79, 999
80K and more
excellent 39,7% 44,2% 48,7% 53,6% 56,8%
very good 34,6% 35,8% 36,2% 32,4% 32,2%
good 20,9% 16,9% 13,1% 12,6% 9,5%
fair 3,7% 2,7% 1,7% 1,2% 1,1%
poor 1,0% ,5% ,3% ,2% ,4%
Total 100,0% 100,0% 100,0%
100,0%
Strong sense of belonging and Higher Income
contributes to better mental health

self-perceived mental health excellent CCHS 2007 a lot some a little
not at all Total
spiritual values helping to find meaning to life
32,4% 35,4% 30,7% 28,3% 33,3%
spiritual values provide strength for everyday difficulties
33,3% 34,0% 32,4% 31,3% 33,4%
spiritual values help in understanding difficulties of life
34,9% 32,2% 31,8% 34,3% 33,4%
Spiritual guidance appears to do little for mental health

Mental Health and Life Satisfaction

CCHS 2007
satisfaction with life in general
Selfperceived
mental health
very satisfie
d satisfiedneither
nor dissatisfied
very dissatis. Total
excellent 57,4% 25,4% 11,4% 10,4% 9,7% 36,5%
very good 32,7% 40,6% 25,9% 15,0% 14,4% 36,0%
good 9,0% 29,4% 41,7% 33,5% 22,7% 22,2%
fair ,7% 4,2% 17,5% 28,5% 23,3% 4,3%
poor ,1% ,5% 3,5% 12,7% 30,0% 1,0%
Total 100,0% 100,0% 100,0% 100,0% 100,0% 100,0%
Life Satisfaction Correlation with Mental Health

CCHS 2007
self-perceived mental health
satisfaction with life in general
excellent
very good good fair poor Total
very satisfied
60,6% 35,1% 15,7% 6,5% 4,7% 38,5%
satisfied 36,9% 59,8% 70,0% 51,4% 26,2% 53,0%
neither nor 1,6% 3,8% 9,8% 21,2% 18,2% 5,2%
dissatisfied ,8% 1,1% 4,0% 17,7% 33,6% 2,7%
very dissatis.
,2% ,2% ,6% 3,2% 17,3% ,6%
Total 100,0% 100,0% 100,0% 100,0% 100,0% 100,0%
Mental Health Correlation with Life Satisfaction

self-perceived mental health
Excellent and Very Good
Canada Other Total
12-14 78.2 83.7 78.5
15-17 76.6 75.5 76.5
18-19 75.0 75.5 75.1
20-24 76.7 75.6 76.6
25-29 76.4 77.2 76.5
30-34 76.4 76.2 76.4
Immigrant Status no discernable difference in assess mental health
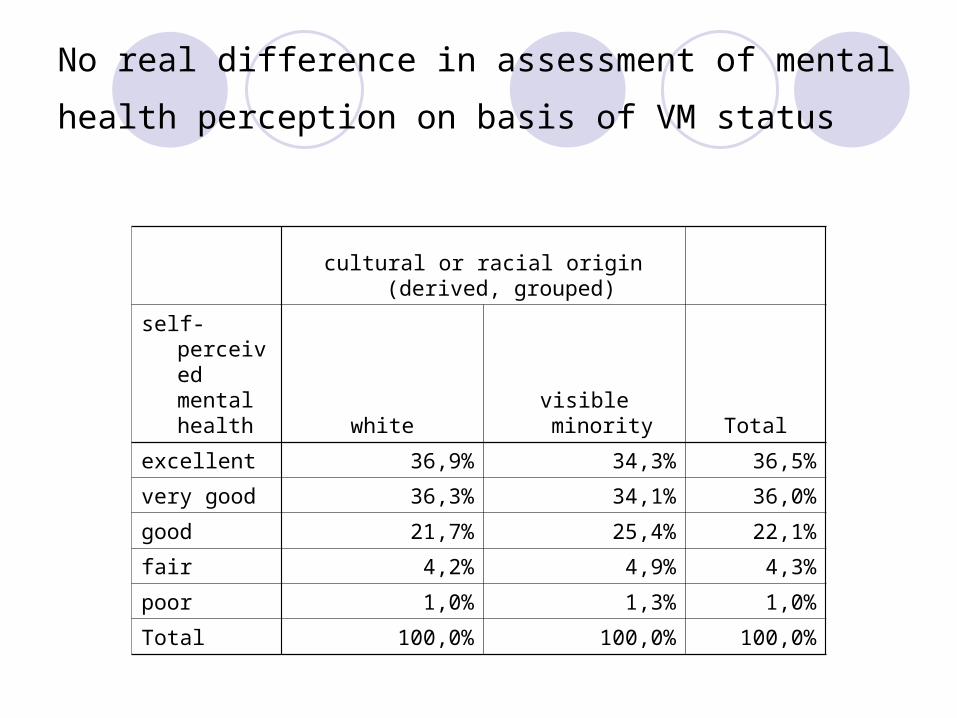
cultural or racial origin (derived, grouped)
self-perceived mental health white visible minority Total
excellent 36,9% 34,3% 36,5%
very good 36,3% 34,1% 36,0%
good 21,7% 25,4% 22,1%
fair 4,2% 4,9% 4,3%
poor 1,0% 1,3% 1,0%
Total 100,0% 100,0% 100,0%
No real difference in assessment of mental health
perception on basis of VM status

Self-Perceived Mental Health 12-14 white visible minority Total
excellent 39,9% 37,2% 39,3%
very good 39,6% 38,0% 39,3%
good 18,5% 21,7% 19,2%
fair 1,9% 3,0% 2,1%
poor ,1% ,1%
Total 100,0% 100,0% 100,0%
No real difference on the basis of VM Status in assessment of mental health age 12-14

12-14(CCHS 2007)
cultural or racial origin (derived, grouped)
Life Satisfaction in general
white visible minority
Total
very satisfied 50,7% 44,3% 49,2%
Satisfied 45,7% 50,5% 46,8%
neither nor 3,2% 4,5% 3,5%
Dissatisfied ,4% ,7% ,5%
very dissatisfied ,1% ,0%
No real difference in rates of life satisfaction age 12-14
on basis of VM status

very satisfied(CCHS 2007)
cultural or racial origin (derived, grouped)
Life Satisfaction in general
white visible minority
Total
12-14 50,7% 44,3% 49,2%
15-17 43,7% 35,4% 42,0%
18-19 39,6% 31,1% 38,0%
20-24 37,8% 28,4% 35,9%
25-29 40,6% 32,3% 39,0%
30-34 42,9% 31,7% 40,9%
As they get older gap in life satisfaction widens somewhat between
white and VM identifiers