HUD PD&R Regional Reports - huduser.gov · Professional and business services 995.6 1,014.7 19.1...
7
HUD PD&R Regional Reports Region 1: New England Providence, Rhode Island Quick Facts About Region 1 Sales market conditions— First quarter 2018: mixed (balanced to tight). Fourth quarter 2017: mixed (balanced to tight). First quarter 2017: mixed (balanced to tight). Apartment market conditions— First quarter 2018: mixed (balanced to tight). Fourth quarter 2017: mixed (balanced to tight). First quarter 2017: mixed (balanced to tight). By EMAD Region 3 staff | 1st quarter 2018 Overview Economic and housing market conditions were positive in the New England region during the first quarter of 2018. Nonfarm payrolls increased, continuing a trend that began more than 7 years ago in the third quarter of 2010. Because of economic growth, sales housing markets and apartment markets were balanced to tight throughout most of the region. Inventories of homes for sale de- clined in most states, the number of homes sold rose modestly, and prices increased 5 percent or more in most major markets. Single-family homebuilding activity decreased in most New England states during the first quarter of 2018 relative to a year ago. The average apartment rent rose, and vacancy rates declined in most markets. Multifamily permitting increased in the region overall during the first quarter of 2018, continuing the trend of a high level of permitting since 2015. U.S. Department of Housing and Urban Development | Office of Policy Development and Research continued on page 2
Transcript of HUD PD&R Regional Reports - huduser.gov · Professional and business services 995.6 1,014.7 19.1...

HUD PD&R Regional Reports Region 1: New England
Providence, Rhode IslandQuick Facts About Region 1
Sales market conditions—First quarter 2018: mixed (balanced to tight).Fourth quarter 2017: mixed (balanced to tight).First quarter 2017: mixed (balanced to tight).
Apartment market conditions—First quarter 2018: mixed (balanced to tight).Fourth quarter 2017: mixed (balanced to tight).First quarter 2017: mixed (balanced to tight).
By EMAD Region 3 staff | 1st quarter 2018
OverviewEconomic and housing market conditions were positive in the New England region during the first quarter of 2018. Nonfarm payrolls increased, continuing a trend that began more than 7 years ago in the third quarter of 2010. Because of economic growth, sales housing markets and apartment markets were balanced to tight throughout most of the region. Inventories of homes for sale declined in most states, the number of homes sold rose modestly, and prices increased 5 percent or more in most major markets. Singlefamily homebuilding activity decreased in most New England states during the first quarter of 2018 relative to a year ago. The average apartment rent rose, and vacancy rates declined in most markets. Multifamily permitting increased in the region overall during the first quarter of 2018, continuing the trend of a high level of permitting since 2015.
U.S. Department of Housing and Urban Development | Office of Policy Development and Research
continued on page 2
Region 1: New EnglandHUD PD&R Regional Reports2
U.S. Department of Housing and Urban Development | Office of Policy Development and Research
1st quarter 2018
During the first quarter of 2018—
• Nonfarm payrolls expanded and the unemployment rate decreased in every state in the region, the result of growth in both serviceproviding and goodsproducing sectors.
• Singlefamily home sales markets were tightest in Massachusetts, New Hampshire, and Rhode Island and were balanced throughout the remainder of the region.
• Increases in average apartment rents ranged from 1 percent in the Manchester metropolitan area to 5 percent in the Portland and Providence metropolitan areas. Vacancy rates declined in most markets, but in the Boston and Hartford metropolitan areas, apartment completions allowed markets to ease slightly.
Economic ConditionsThe economy of the New England region expanded during the first quarter of 2018, continuing a trend that began in mid2010. During the first quarter of 2018, nonfarm payrolls in the region averaged 7.30 million, a gain of 65,000 jobs, or 0.9 percent, from the first quarter of 2017. By comparison, during the first quarter of 2017, nonfarm payrolls increased by 71,700 jobs, or 1.0 percent, from the same period a year earlier. The slightly slower rate of growth was largely attributed to smaller gains in the education and health services and leisure and hospitality sectors. Despite the deceleration, these sectors accounted for 35 percent of jobs added in the region during the first quarter of 2018. Massachusetts led payroll growth with an increase of 38,200 jobs, or 1.1 percent. The highest percentage gain, 1.3 percent each, occurred in New Hampshire and Rhode Island, with 8,700 and 6,400 jobs added, respectively. Job gains in Connecticut totaled 7,700, or 0.5 percent; the rate
was up from 0.2 percent a year earlier mostly because of gains in the manufacturing sector. In Maine and Vermont, nonfarm payrolls rose by 2,300 and 1,800 jobs, or 0.4 and 0.6 percent, respectively.
The professional and business services sector led job growth in the region with a gain of 19,100 jobs, or 1.9 percent, and accounted for approximately 29 percent of all jobs added in the region. Every state in the region except Vermont had an increase in the sector; the largest gain of 13,500 jobs was in Massachusetts, which accounted for 70 percent of growth in the sector. Connecticut and Rhode Island each added 2,200 jobs. Continued growth is expected in the sector with the anticipated addition of 400 jobs through 2020 in the Boston metropolitan area at the consulting firm Accenture. Amazon.com Inc. announced plans to add 2,000 jobs focusing on cloud computing, speech science, and robotics on completion of office space in the Seaport district of Boston in 2021.
Goods-producing sectors accounted for nearly 30 percent of jobs added in the New England region during the first quarter of 2018, up from an average of 10 percent during the first quarters of 2011 through 2017.
First Quarter Year-Over-Year Change
2017 (thousands)
2018(thousands)
Absolute(thousands) Percent
Total nonfarm payrolls 7,238.8 7,303.8 65.0 0.9Goodsproducing sectors 861.8 881.2 19.4 2.3
Mining, logging, and construction 274.0 285.1 11.1 4.1Manufacturing 587.8 596.1 8.3 1.4
Serviceproviding sectors 6,377.0 6,422.6 45.6 0.7Wholesale and retail trade 1,045.3 1,045.3 0.0 0.0Transportation and utilities 201.8 206.5 4.7 2.3Information 153.0 150.8 – 2.2 – 1.4Financial activities 459.4 461.4 2.0 0.4Professional and business services 995.6 1,014.7 19.1 1.9Education and health services 1,545.0 1,561.3 16.3 1.1Leisure and hospitality 697.3 704.0 6.7 1.0Other services 274.5 277.7 3.2 1.2Government 1,005.3 1,000.8 – 4.5 – 0.4
Note: Numbers may not add to totals because of rounding. Source: U.S. Bureau of Labor Statistics
continued from page 1
continued on page 3
Region 1: New EnglandHUD PD&R Regional Reports3
U.S. Department of Housing and Urban Development | Office of Policy Development and Research
1st quarter 2018
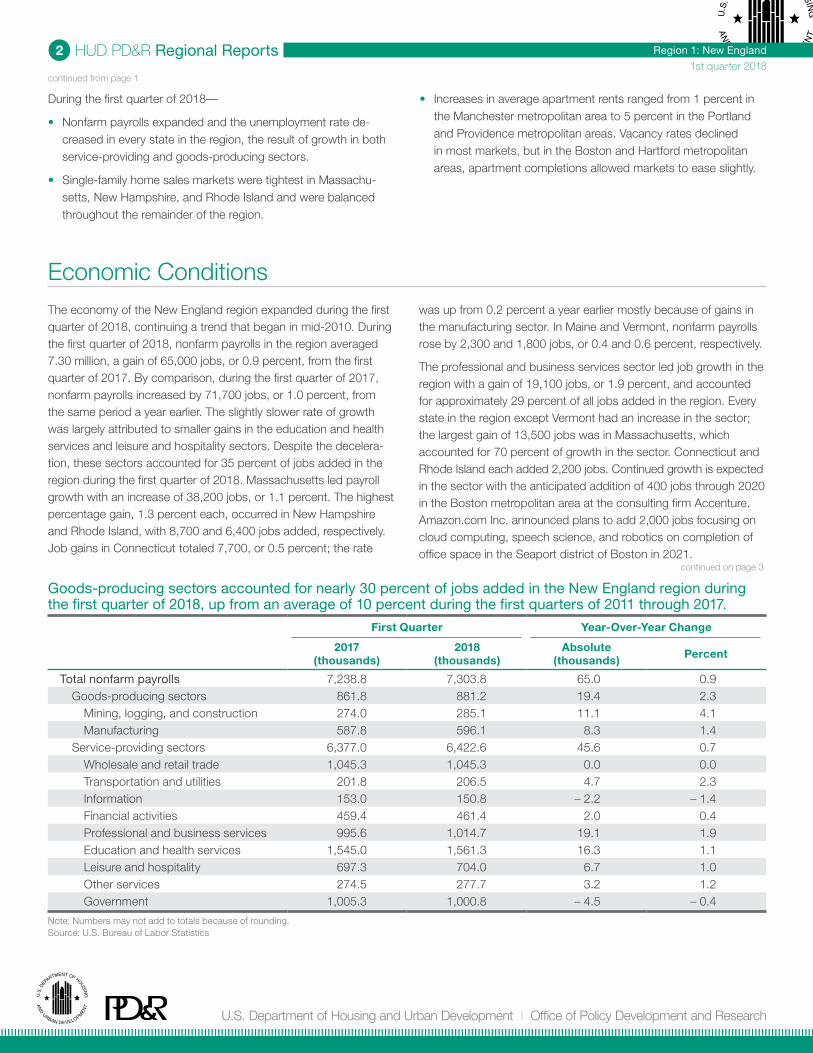
The unemployment rate in the region averaged 4.1 percent during the first quarter of 2018, down from 4.5 percent a year earlier. The current unemployment rate is below the national rate of 4.3 percent. Unemployment rates declined in every state in the region; the largest decrease was in Maine, where the rate fell from 4.0 percent during the first quarter of 2017 to 3.3 percent in the first quarter of 2018, because resident employment increased more rapidly than the labor force.
During the first quarter of 2018—
• After the professional and business services sector, the education and health services sector had the second highest job gain in the region, increasing by 16,300 jobs, or 1.1 percent, with Connecticut and Massachusetts combined accounting for nearly 60 percent of jobs added in the sector. Connecticut and Rhode Island were exceptions to the slower growth in the sector in most states, with a 1.6percent increase in each, up from average growth rates of 0.3 and 1.1 percent, respectively, during the first quarters of 2013 through 2017.
• The mining, logging, and construction sector had the highest percentage increase among all sectors in the region, at 4.1 percent; Massachusetts and New Hampshire led the growth with gains of 10,200 and 1,200 jobs, or 7.4 and 4.7 percent, respectively. Approximately 12 hotels with 3,700 rooms are under construction in the region, including the MGM Resort Casino in Springfield, which generated 4,650 construction jobs. Completion of the casino is anticipated in August 2018, followed by a 250room hotel with 54 residential apartments in late 2018 (McGrawHill Construction Pipeline database).
• The manufacturing sector in the region added 8,300 jobs, or 1.4 percent, reversing a declining trend that began in 2013, with an increase in every state except Vermont. The largest gains were in Connecticut and Massachusetts, which added 4,600 and 1,800 jobs, respectively, and accounted for 77 percent of the increase in the sector.
• The leisure and hospitality sector, the third fastest growing among serviceproviding sectors in terms of total jobs, increased by 6,700 jobs, or 1.0 percent, despite slower growth in most states compared with a year ago. In Maine, payrolls declined by 1,000 jobs, or 1.8 percent in the sector. Tourism expanded at a slower rate than previously with an estimated 36.7 million visitors in 2017, a 2.5percent increase from 2016 but down from a 6percent increase during 2015 (Maine Office of Tourism).
• Government and information were the only sectors to decline in the region, decreasing by 4,500 and 2,200 jobs, or 0.4 and 1.4 percent, respectively. Information sector payrolls fell in all states. Nearly 80 percent of the losses in the government sector were in Connecticut, which declined by 4,400 jobs and offset total gains of approximately 1,300 jobs among New Hampshire, Rhode Island, and Vermont. The decline in Connecticut was because of job losses in the state and local government subsectors due to fiscal tightening.
Average unemployment rates decreased throughout the New England region and were below the national rate in all states except Connecticut and Rhode Island.
1Q = first quarter.Source: U.S. Bureau of Labor Statistics
0.0
Une
mp
loym
ent
rate
1.0
2.0
3.0
4.0
5.0
6.0
7.0
New E
nglan
d
Conne
cticu
t
Main
e
Mas
sach
usett
s
New H
amps
hire
Rhode
Islan
d
Verm
ont
United
Sta
tes
1Q 2016 1Q 2017 1Q 2018
PopulationThe population of the New England region rose from 2016 to 2017 by 52,450, or 0.4 percent, to 14.81 million compared with a 0.7 percent growth rate for the nation overall (Census Bureau population estimates as of July 1). The rate of growth was stronger compared with a year ago mostly because of higher net inmigration, while net natural change (resident births minus resident deaths) decreased less than 2 percent to an increase of 20,100 people. Net inmigration totaled 32,550 people in the region and accounted for 62 percent of all population growth. International inmigration totaled 72,600 people, more than offsetting the domestic net outmigration of
40,050 people. Every state in the New England region had international net inmigration. Rates of population change ranged from an increase of 0.6 percent in New Hampshire to essentially no change in Connecticut and Vermont.
During the 12 months ending July 1, 2017—
• Massachusetts led the New England region in population growth, increasing by 36,100, or 0.5 percent, with net inmigration total ing 22,200 people and accounting for nearly 62 percent of all population growth in the state. International inmigration of 45,300 people more than offset domestic outmigration of 23,100 people.
continued from page 2
continued on page 4

Region 1: New EnglandHUD PD&R Regional Reports4
U.S. Department of Housing and Urban Development | Office of Policy Development and Research
1st quarter 2018
• New Hampshire had the highest growth rate among all states in the region at 0.6 percent. New Hampshire and Maine were the only states in the New England region with domestic net in migration.
• In Maine, the population growth rate was 0.4 percent, up from 0.2 percent a year earlier, despite a negative net natural change. West Virginia was the only other state in the nation with a net natural decrease.
• In Rhode Island, the rate of population growth was unchanged at 0.2 percent, although net inmigration more than doubled to 940 people compared with a year earlier. The population in Connecticut and Vermont remained stable with small increases of 500 and 300, respectively, reversing losses of 0.2 percent each a year earlier.
The rate of population growth in the New England region was below the national average; however, rates increased or were unchanged in all states compared with rates a year ago.
Population Estimate (as of July 1) Percent Change
2015 2016 2017 2015 to 2016 2016 to 2017
United States 321,039,839 323,405,935 325,719,178 0.7 0.7New England region 14,726,156 14,757,573 14,810,001 0.2 0.4
Connecticut 3,593,862 3,587,685 3,588,184 – 0.2 0.0Maine 1,327,787 1,330,232 1,335,907 0.2 0.4Massachusetts 6,794,002 6,823,721 6,859,819 0.4 0.5New Hampshire 1,330,134 1,335,015 1,342,795 0.4 0.6Rhode Island 1,055,916 1,057,566 1,059,639 0.2 0.2Vermont 624,455 623,354 623,657 – 0.2 0.0
Source: U.S. Census Bureau
Sales Market ConditionsSales housing market conditions ranged from balanced to tight across the New England region, unchanged from the previous quarter and the previous year. During the 12 months ending March 2018, the number of homes sold rose 1 percent in most states in the region compared with a year ago, which was equal to the increase for the nation (National Association of Realtors®). The inventory of homes for sale was low, with an average inventory below the national average of 3.6 months throughout most of the region. The supply of inventory in Massachusetts declined to 2.0 months in March 2018 compared with 2.9 months a year earlier (Massachusetts Association of Realtors®). In New Hampshire, the supply was 2.5 months, down from 3.6 months in March 2017 (New Hampshire Association of Realtors®). In Rhode Island, more than onehalf of ZIP Codes in the state had an inventory of homes for sale of 2 months or less, and an additional 38 percent of ZIP Codes had an inventory of 2 to 4 months in March 2018 (Rhode Island Association of Realtors®). In Maine, the inventory of homes for sale decreased from 3.5 months in February 2017 to 2.9 months in February 2018 (CoreLogic, Inc.). The supply of homes for sale was unchanged from a year earlier in Connecticut and Vermont at 4.7 and 6.7 months of inventory in February 2018.
Singlefamily home sales markets were tight in Massachusetts, slightly tight in New Hampshire and Rhode Island, and balanced
throughout the remainder of the region. In Connecticut, singlefamily home sales increased 11 percent to 34,600 homes during the 12 months ending March 2018, the largest increase of any state in the region. In Maine, New Hampshire, and Rhode Island, singlefamily home sales rose 1 percent each to 17,650, 17,500, and 11,150 homes sold, respectively. Similarly, in Vermont, singlefamily home sales increased 1 percent to 12,250 homes sold during the 12 months ending February 2018. In Massachusetts, the number of single family home sales declined 2 percent to 55,300 homes during the 12 months ending March 2018, largely due to a 30percent decrease in the number of homes available for sale.
Home sales prices in the region increased 6 percent in February 2018, relatively unchanged from a year earlier but less than the national average increase of 7 percent (Federal Housing Finance Agency House Price Index). Singlefamily homes sales prices rose in each state during the 12 months ending March 2018. Increases in home prices ranged from 5 percent in Massachusetts and Vermont, with median prices of $369,000 and $226,900 respectively, to 11 percent in Maine, where the median home sales price was $212,000. Rhode Island had the second highest percentage gain of 10 percent, with a median price of $252,300, followed by Connecticut and New Hampshire with 8percent increases each to $246,000 and $265,000, respectively.
continued from page 3
continued on page 5
Region 1: New EnglandHUD PD&R Regional Reports5
U.S. Department of Housing and Urban Development | Office of Policy Development and Research
1st quarter 2018
In February 2018, 2.2 percent of home loans in the region were seriously delinquent (90 or more days delinquent or in foreclosure) or had transitioned into real estate owned (REO) status, down from 2.9 percent a year earlier and below the national rate of 2.3 percent for the first time since April 2013 (CoreLogic, Inc.). The percentage of seriously delinquent mortgage loans and REO properties decreased in every state in the region, with the greatest declines of 0.8 and 0.9 percentage point in Maine and Rhode Island, respectively. The percentage of seriously delinquent mortgage loans and REO properties was highest in Maine, Connecticut, and Rhode Island at 3.1, 2.8, and 2.5 percent, respectively.
Homebuilding in the region from 2013 to 2017 was up 21 percent from the average level of construction from 2008 through 2012, following the Great Recession. Connecticut is the only state in the region where singlefamily construction has not recovered and is at the same level as from 2008 through 2012.
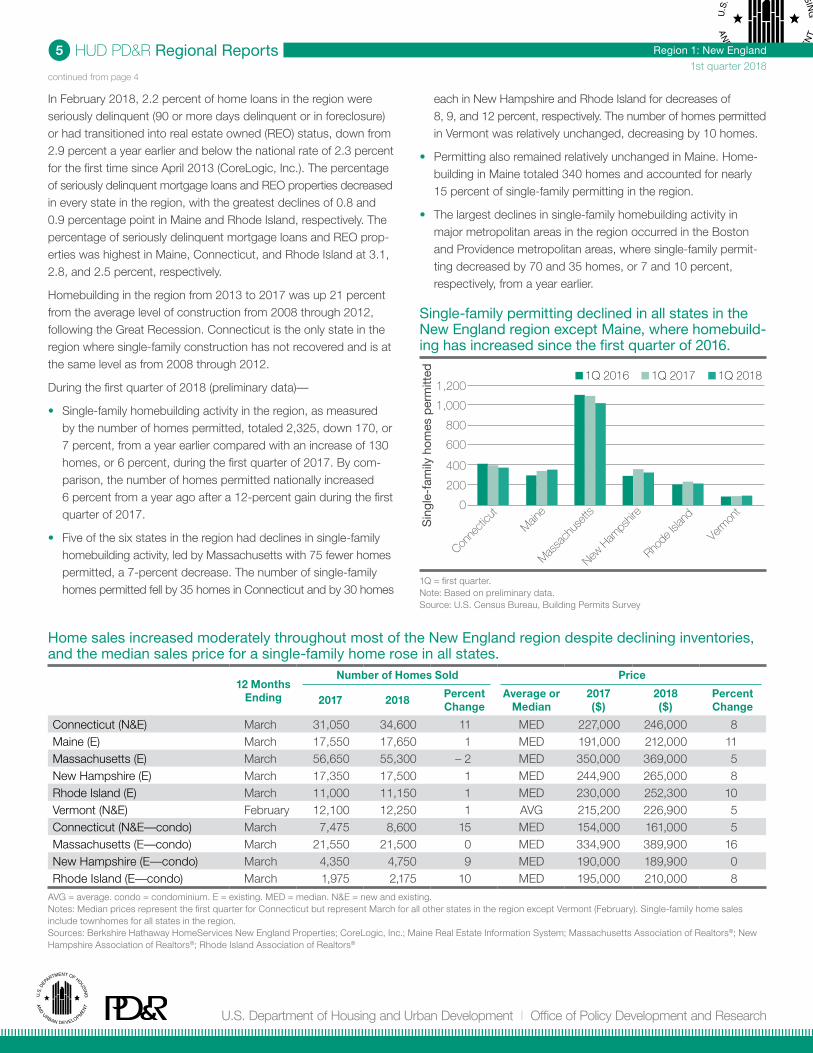
During the first quarter of 2018 (preliminary data)—
• Singlefamily homebuilding activity in the region, as measured by the number of homes permitted, totaled 2,325, down 170, or 7 percent, from a year earlier compared with an increase of 130 homes, or 6 percent, during the first quarter of 2017. By comparison, the number of homes permitted nationally increased 6 percent from a year ago after a 12percent gain during the first quarter of 2017.
• Five of the six states in the region had declines in single family homebuilding activity, led by Massachusetts with 75 fewer homes permitted, a 7percent decrease. The number of singlefamily homes permitted fell by 35 homes in Connecticut and by 30 homes
each in New Hampshire and Rhode Island for decreases of 8, 9, and 12 percent, respectively. The number of homes permitted in Vermont was relatively unchanged, decreasing by 10 homes.
• Permitting also remained relatively unchanged in Maine. Homebuilding in Maine totaled 340 homes and accounted for nearly 15 percent of singlefamily permitting in the region.
• The largest declines in singlefamily homebuilding activity in major metropolitan areas in the region occurred in the Boston and Providence metropolitan areas, where singlefamily permitting decreased by 70 and 35 homes, or 7 and 10 percent, respectively, from a year earlier.
0
200
Sin
gle-
fam
ily h
omes
per
mitt
ed
400
600
800
1,000
1,200
Conne
cticu
t
Main
e
Mas
sach
usett
s
New H
amps
hire
Rhode
Islan
d
Verm
ont
1Q 2016 1Q 2017 1Q 2018
Single-family permitting declined in all states in the New England region except Maine, where homebuild-ing has increased since the first quarter of 2016.
1Q = first quarter.Note: Based on preliminary data.Source: U.S. Census Bureau, Building Permits Survey
Home sales increased moderately throughout most of the New England region despite declining inventories, and the median sales price for a single-family home rose in all states.
12 Months Ending
Number of Homes Sold Price
2017 2018 Percent Change
Average or Median
2017($)
2018($)
Percent Change
Connecticut (N&E) March 31,050 34,600 11 MED 227,000 246,000 8Maine (E) March 17,550 17,650 1 MED 191,000 212,000 11Massachusetts (E) March 56,650 55,300 – 2 MED 350,000 369,000 5New Hampshire (E) March 17,350 17,500 1 MED 244,900 265,000 8Rhode Island (E) March 11,000 11,150 1 MED 230,000 252,300 10Vermont (N&E) February 12,100 12,250 1 AVG 215,200 226,900 5Connecticut (N&E—condo) March 7,475 8,600 15 MED 154,000 161,000 5Massachusetts (E—condo) March 21,550 21,500 0 MED 334,900 389,900 16New Hampshire (E—condo) March 4,350 4,750 9 MED 190,000 189,900 0Rhode Island (E—condo) March 1,975 2,175 10 MED 195,000 210,000 8
AVG = average. condo = condominium. E = existing. MED = median. N&E = new and existing.Notes: Median prices represent the first quarter for Connecticut but represent March for all other states in the region except Vermont (February). Singlefamily home sales include townhomes for all states in the region. Sources: Berkshire Hathaway HomeServices New England Properties; CoreLogic, Inc.; Maine Real Estate Information System; Massachusetts Association of Realtors®; New Hampshire Association of Realtors®; Rhode Island Association of Realtors®
continued from page 4

Region 1: New EnglandHUD PD&R Regional Reports6
U.S. Department of Housing and Urban Development | Office of Policy Development and Research
1st quarter 2018
Apartment Market ConditionsApartment market conditions in most major metropolitan areas in the New England states were balanced to tight during the first quarter of 2018. The 3,825 apartment units completed in the region during the first quarter of 2018 was up 59 percent from the 2,400 completions during the first quarter of 2017. Completions during the first quarter of 2018 followed a 3year trend of strong production averaging 14,950 units annually from 2015 through 2017 compared with average completions of 7,175 units a year from 2010 through 2014 (McGrawHill Construction Pipeline database). An estimated 25,900 apartment units were under construction in the region at the end of the first quarter of 2018, with approximately 70 percent expected to be completed by the first quarter of 2019. Completions have kept pace with increased demand for apartments in most metropolitan areas of the New England region.
The largest decrease in the apartment vacancy rate in the New England region, from 6.7 to 5.5 percent (Reis, Inc.), occurred in the Bridgeport metropolitan area, where conditions are balanced. The vacancy rate for Class A units was higher, at 6.9 percent during the first quarter of 2018, but down from 8.0 percent a year earlier, despite the completion of approximately 1,225 apartment units annually from 2015 through 2017 (McGrawHill Construction Pipeline database). The average rent of $2,122 in the metropolitan area was the second highest in the New England region (after the Boston metropolitan area), up 2 percent from a year ago. The Portland metropolitan area market was slightly tight and had the second largest decline in the apartment vacancy rate, from 5.3 percent during the first quarter of 2017 to 4.2 percent during the first quarter of 2018, while the average rent rose 5 percent to $1,395
Average rents increased and vacancy rates declined in most major metropolitan areas in the New England region.
(Axiometrics, Inc.). Apartment market conditions were tight in the Providence, Manchester, and Springfield metropolitan areas, with declining vacancy rates and rising rents. In the Providence metropolitan area, the vacancy rate fell from 4.2 to 3.7 percent, and the average rent was up 5 percent to $1,398, the highest percentage increase in the region along with the Portland metropolitan area (RealPage, Inc.). The vacancy rate declined in the Manchester metropolitan area, from 3.5 to 2.9 percent, and the average rent rose 1 percent to $1,338 (Axiometrics, Inc.). The Springfield metropolitan area had the lowest vacancy rate among the major metropolitan areas in the region at 1.3 percent, down from 1.6 percent during the first quarter of 2017, and the average rent increased 3 percent to $1,030 (Reis, Inc.).
Slightly tight apartment market conditions in the Boston and Hartford metropolitan areas eased somewhat during the first quarter of 2018. In the Boston metropolitan area, the vacancy rate rose from 4.2 percent in the first quarter of 2017 to 4.3 percent in the first quarter of 2018 (RealPage, Inc.). Approximately 6,875 apartment units were completed during the 12 months ending March 2018, up from 6,625 units completed a year earlier. The average rent in the Boston metropolitan area was the highest in the region at $2,221, a 4percent gain from a year earlier. The apartment vacancy rate in the Hartford metropolitan area rose from 4.4 to 4.8 percent, and the average rent increased 3 percent to $1,160 (Reis, Inc.). Apartment completions totaled 720 units during the 12 months ending March 2018, following completions of more than 1,200 units each during comparable periods in 2016 and 2017 (McGrawHill Construction Pipeline database).
Market Condition
Vacancy Rate Average Monthly Rent
1Q 2017(%)
1Q 2018(%)
Percentage Point Change
1Q 2017($)
1Q 2018($)
Percent Change
Bostona Slightly tight 4.2 4.3 0.1 2,131 2,221 4
Bridgeportb Balanced 6.7 5.5 – 1.2 2,082 2,122 2
Hartfordb Slightly tight 4.4 4.8 0.4 1,126 1,160 3
Manchesterc Tight 3.5 2.9 – 0.6 1,320 1,338 1
Portlandc Slightly tight 5.3 4.2 – 1.1 1,326 1,395 5
Providencea Tight 4.2 3.7 – 0.5 1,328 1,398 5
Springfieldb Tight 1.6 1.3 – 0.3 1,000 1,030 31Q = first quarter.Sources: Market condition—HUD, PD&R, Economic and Market Analysis Division; vacancy rate and average monthly rent—(a) RealPage, Inc. (b) Reis, Inc., (c) Axiometrics, Inc.
continued on page 7

Region 1: New EnglandHUD PD&R Regional Reports7
U.S. Department of Housing and Urban Development | Office of Policy Development and Research
1st quarter 2018
During the first quarter of 2018 (preliminary data)—
• The number of multifamily units permitted in the New England region rose to 3,450, up by 610, or 21 percent, compared with a year earlier after a 2percent decrease in the first quarter of 2017. By comparison, the number of multifamily units permitted nationally increased 7 percent from a year ago after a 1percent decline in the first quarter of 2017.
• The largest increase occurred in Connecticut, where multifamily permitting was up 85 percent, or 290 units, from the same period a year ago, to 630 units permitted; the level is below the recent peak of 1,350 units permitted during the first quarter of 2016 but above the average of 370 units permitted during the comparable periods from 2010 through 2015. Nearly all the net growth in multifamily construction can be attributed to a sixfold increase in permitting in the New Haven metropolitan area, where 320 units were permitted, an increase of 270 from a year earlier.
• New Hampshire had the second largest growth in multifamily units permitted in the New England region; multifamily construction more than doubled, rising by 230 units to 380 units permitted and accounting for nearly 40 percent of the increase in units permitted in the region. The Manchester metropolitan area added most of the net increase in the state; approximately 160 units were permitted after no multifamily construction had occurred during the first quarters of 2016 and 2017.
• Multifamily permitting in Massachusetts accounted for 60 percent of the total in the region, although multifamily construction was virtually unchanged in the state from a year earlier. A 120unit decline in multifamily permitting in the Worcester metropolitan area partially offset a 200unit, or 10 percent, increase in the Boston metropolitan area.
Multifamily permitting increased in the New England region overall.
1Q = first quarter.Note: Based on preliminary data.Source: U.S. Census Bureau, Building Permits Survey
0
500
1,000
2,500
1,500
2,000
Conne
cticu
t
Main
e
Mas
sach
usett
s
New H
amps
hire
Rhode
Islan
d
Verm
ont M
ultif
amily
uni
ts p
erm
itted
1Q 2016 1Q 2017 1Q 2018
continued from page 6