HUD PD&R Housing Market Profiles - HUDUser.gov | …€¦ · Chattanooga metropolitan area occurred...
5
HUD PD&R Housing Market Profiles Chattanooga, Tennessee-Georgia Quick Facts About Chattanooga Current sales market conditions: soft. Current apartment market conditions: balanced. In 2010, EPB Fiber Optics, the electric and telecommunications company owned by the city of Chattanooga, began offering Internet speeds of up to 1 gigabyte per second, the fastest in the country, and earned Chattanoo- ga the nickname “Gig City.” EPB Fiber Optics, which currently employs about 540 people, is considering expanding coverage beyond the metropolitan area. By Katharine Auchter | As of January 1, 2015 Overview The Chattanooga, TN-GA Metropolitan Statistical Area (hereafter, Chattanooga metropolitan area) comprises Hamilton, Marion, and Sequatchie Counties in southern Tennessee and Catoosa, Dade, and Walker Counties in northwestern Georgia. The principal city, Chattanooga, in Hamilton County, is bisected by the Tennessee River. The city of Chattanooga is a regional tourist destination; a hub for healthcare services for the southern Tennessee, northern Georgia, and northeastern Alabama areas; and home to the Uni- versity of Tennessee at Chattanooga (UTC). • As of January 1, 2015, the population of the metropolitan area was estimated to be 546,200, an increase of 3,800, or 0.7 per- cent, annually since April 2010. • Approximately 65 percent of the population of the HMA resides in Hamilton County (2013 American Community Survey 1-year estimates). • Net in-migration comprised approximately 73 percent of pop- ulation growth since 2010, averaging 3,150 people annually. Approximately 90 percent of the population growth in the Chattanooga metropolitan area occurred in Hamilton County. U.S. Department of Housing and Urban Development | Office of Policy Development and Research
Transcript of HUD PD&R Housing Market Profiles - HUDUser.gov | …€¦ · Chattanooga metropolitan area occurred...

HUD PD&R Housing Market Profiles Chattanooga, Tennessee-Georgia
Quick Facts About Chattanooga
Current sales market conditions: soft.
Current apartment market conditions: balanced.
In 2010, EPB Fiber Optics, the electric and telecommunications company owned by the city of Chattanooga, began offering Internet speeds of up to 1 gigabyte per second, the fastest in the country, and earned Chattanoo-ga the nickname “Gig City.” EPB Fiber Optics, which currently employs about 540 people, is considering expanding coverage beyond the metropolitan area.
By Katharine Auchter | As of January 1, 2015
OverviewThe Chattanooga, TN-GA Metropolitan Statistical Area (hereafter, Chattanooga metropolitan area) comprises Hamilton, Marion, and Sequatchie Counties in southern Tennessee and Catoosa, Dade, and Walker Counties in northwestern Georgia. The principal city, Chattanooga, in Hamilton County, is bisected by the Tennessee River. The city of Chattanooga is a regional tourist destination; a hub for healthcare services for the southern Tennessee, northern Georgia, and northeastern Alabama areas; and home to the Uni-versity of Tennessee at Chattanooga (UTC).
• As of January 1, 2015, the population of the metropolitan area was estimated to be 546,200, an increase of 3,800, or 0.7 per-cent, annually since April 2010.
• Approximately 65 percent of the population of the HMA resides in Hamilton County (2013 American Community Survey 1-year estimates).
• Net in-migration comprised approximately 73 percent of pop-ulation growth since 2010, averaging 3,150 people annually. Approximately 90 percent of the population growth in the Chattanooga metropolitan area occurred in Hamilton County.
U.S. Department of Housing and Urban Development | Office of Policy Development and Research

Chattanooga, TN-GAHUD PD&R Housing Market Profiles 2
U.S. Department of Housing and Urban Development | Office of Policy Development and Research
As of January 1, 2015
Seven employment sectors contributed to gains in nonfarm payrolls in the Chattanooga area.3 Months Ending Year-Over-Year Change
December 2013 (thousands)
December 2014 (thousands)
Absolute(thousands) Percent
Total nonfarm payrolls 240.9 244.4 3.5 1.5Goods-producing sectors 39.0 40.0 1.0 2.6
Mining, logging, and construction 9.0 9.5 0.5 5.6Manufacturing 30.0 30.5 0.5 1.7
Service-providing sectors 201.8 204.4 2.6 1.3Wholesale and retail trade 34.8 35.0 0.2 0.6Transportation and utilities 17.6 18.4 0.8 4.5Information 2.8 2.9 0.1 3.6Financial activities 13.8 13.6 – 0.2 – 1.4Professional and business services 27.7 27.8 0.1 0.4Education and health services 33.1 32.7 – 0.4 – 1.2Leisure and hospitality 25.0 27.5 2.5 10.0Other services 9.8 9.8 0.0 0.0Government 37.1 36.8 – 0.3 – 0.8
(percent) (percent)
Unemployment rate 6.9 6.1
Note: Numbers may not add to totals because of rounding.Source: U.S. Bureau of Labor Statistics
Economic ConditionsTotal nonfarm payrolls in the Chattanooga metropolitan area have increased every year since 2009; the strongest job growth was from 2010 to 2011, when nonfarm payrolls increased by 3,900 jobs, or 1.7 percent, in part because preparations to open the Volkswagen Group of America, Inc. manufacturing plant contributed to increas-es in manufacturing sector employment. Payroll sectors with sig-nificant increases since 2009 include manufacturing, professional and business services, transportation and utilities, and leisure and hospitality; however, nonfarm payrolls remain below the previous peak of 247,500 jobs in 2007.
During the fourth quarter of 2014—
• Nonfarm payrolls in the Chattanooga metropolitan area increased by 3,500 jobs, or 1.5 percent, from the same period in 2013, to 244,400 jobs.
• The greatest gain and highest rate of job growth occurred in the leisure and hospitality sector, which increased by 2,500 jobs, or 10.0 percent, compared with nonfarm payrolls a year earlier, to average 27,500 jobs. Tourism to the region increased and sever-al new restaurants and hotels opened during the past year. Hotel tax revenues in the city of Chattanooga increased 9 percent during the 12 months ending November 2014 from a year earlier (City of Chattanooga ChattaData).
continued on page 3
Nonfarm payroll growth remained slightly lower in the Chattanooga area than in the rest of the Southeast/Caribbean region and the nation.
Note: Nonfarm payroll jobs.Source: U.S. Bureau of Labor Statistics
Largest employers in the Chattanooga area
Name of Employer Nonfarm Payroll Sector
Number of Employees
BlueCross BlueShield of Tennessee, Inc.
Financial activities 4,238
Tennessee Valley Authority Government 4,126
Erlanger Health System Education and health services
3,468
Note: Excludes local school districts. Source: Chattanooga Area Chamber of Commerce
4.0
2.0
0.0
– 4.0
– 2.0
– 6.0
– 8.0
Per
cent
cha
nge
from
pre
viou
sye
ar (3
-mon
th a
vera
ge)
Chattanooga areaSoutheast/Caribbean region Nation
Dec 2
005
Dec 2
006
Dec 2
007
Dec 2
008
Dec 2
009
Dec 2
010
Dec 2
011
Dec 2
012
Dec 2
013
Dec 2
014

Chattanooga, TN-GAHUD PD&R Housing Market Profiles 3
U.S. Department of Housing and Urban Development | Office of Policy Development and Research
As of January 1, 2015
continued from page 2
• The transportation and utilities sector increased by 800 jobs, or 4.5 percent, to average 18,400 jobs compared with nonfarm payrolls during the fourth quarter of 2013. The city of Chatta-nooga is a regional transportation center at the nexus of rail and interstate highways. Local manufacturing companies such as Volkswagen and McKee Foods Corporation are therefore easily able to access larger distribution centers in the Midwest and Southeast, such as Atlanta.
• Reflecting continued job growth in the metropolitan area, the average unemployment rate declined to 6.1 percent compared with the rate of 6.9 percent during the fourth quarter of 2013.
Increases in tourism- and manufacturing-related payrolls are expected lead employment growth during the next 2 years. In
the leisure and hospitality sector, construction is expected to be complete in the spring of 2015 on a new entertainment district in the city of Chattanooga with a live music venue, comedy club, restaurants, and retail space, developed in conjunction with ren-ovations at the historic Chattanooga Choo Choo hotel. Plans are in place for the metropolitan area to host annual IRONMAN and IRONMAN 70.3 triathlons during the next 4 years. The inaugural Little Debbie IRONMAN triathlon competition in late September 2014 had a direct economic impact of $10.3 million and attracted more than 2,600 participants and nearly 10,300 out-of-town visitors to the metropolitan area (UTC Tourism Center). In the manufacturing sector, Volkswagen announced plans to add 2,000 jobs in 2016 when production begins on a sport utility vehicle.
Sales Market ConditionsThe sales housing market in the Chattanooga metropolitan area is currently soft but improving, with a sales vacancy rate of 2.2 per-cent, down from 2.9 percent in April 2010. The inventory of homes for sale represented a 7.5-month supply in December 2014, down from an 8.4-month supply in December 2013 (Greater Chattanooga Association of Realtors®). Improving economic conditions, driven by the opening of the Volkswagen manufacturing plant, and easing of lending standards during the recent years contributed to increased sales demand. Nearly 80 percent of new single-family homes, town- homes, and condominiums (hereafter, new homes) sold in the met-ropolitan area during the 12 months ending November 2014 were in Hamilton County, near major employment centers.
• During the 12 months ending November 2014, 670 new homes sold in the metropolitan area, down slightly from 680 new homes sold during the same period a year earlier (CoreLogic, Inc., with adjustments by the analyst). The sales price of a new home in the metropolitan area averaged $244,100 during the 12 months ending November 2014, up 3 percent from the average sales price of $237,100 a year earlier.
• Sales of existing single-family homes, townhomes, and condo-miniums (hereafter, existing homes) increased nearly 3 percent, to 8,725 homes sold, during the 12 months ending November 2014 from 8,500 homes sold a year earlier. Existing home sales in the Chattanooga metropolitan area were highest from 2000
continued on page 4
Home sales prices in the Chattanooga area have recovered from the losses during the national housing crisis, but increases slowed during the past year.
Note: Includes single-family homes, townhomes, and condominiums.Source: CoreLogic, Inc., with adjustments by the analyst
Home sales during the past year in the Chattanooga area increased slightly from a year earlier.
Note: Includes single-family homes, townhomes, and condominiums.Source: CoreLogic, Inc., with adjustments by the analyst
8.0
16.0
12.0
4.0
– 8.0
0.0
– 4.0
Per
cent
cha
nge
from
pre
viou
s ye
ar (1
2-m
onth
ave
rage
)
New home sales prices
Nov 2
008
Nov 2
009
Nov 2
010
Nov 2
011
Nov 2
012
Nov 2
014
Nov 2
013
Existing home sales prices
– 40.0
0.0
30.0
20.0
10.0
– 30.0
– 20.0
– 10.0
Per
cent
cha
nge
from
pre
viou
sye
ar (1
2 m
onth
s en
din
g)
New home salesExisting home sales
Nov 2
008
Nov 2
009
Nov 2
010
Nov 2
011
Nov 2
012
Nov 2
014
Nov 2
013
Chattanooga, TN-GAHUD PD&R Housing Market Profiles 4
U.S. Department of Housing and Urban Development | Office of Policy Development and Research
As of January 1, 2015
continued from page 3
through 2007, when an average of about 10,800 homes sold annually, before decreasing to an average of 7,750 homes sold annually from 2008 through 2012.
• The price of existing homes sold increased nearly 2 percent during the 12 months ending November 2014, to $148,600, compared with the average sales price of $146,000 a year earlier.
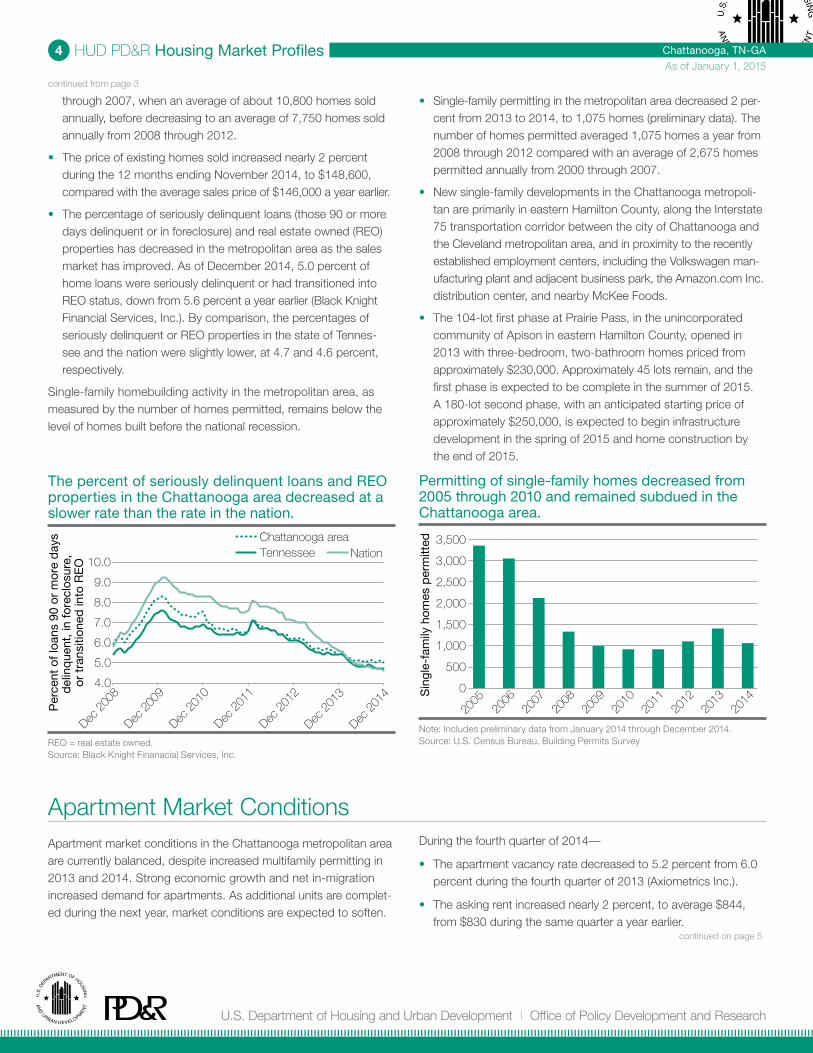
• The percentage of seriously delinquent loans (those 90 or more days delinquent or in foreclosure) and real estate owned (REO) properties has decreased in the metropolitan area as the sales market has improved. As of December 2014, 5.0 percent of home loans were seriously delinquent or had transitioned into REO status, down from 5.6 percent a year earlier (Black Knight Financial Services, Inc.). By comparison, the percentages of seriously delinquent or REO properties in the state of Tennes-see and the nation were slightly lower, at 4.7 and 4.6 percent, respectively.
Single-family homebuilding activity in the metropolitan area, as measured by the number of homes permitted, remains below the level of homes built before the national recession.
• Single-family permitting in the metropolitan area decreased 2 per-cent from 2013 to 2014, to 1,075 homes (preliminary data). The number of homes permitted averaged 1,075 homes a year from 2008 through 2012 compared with an average of 2,675 homes permitted annually from 2000 through 2007.
• New single-family developments in the Chattanooga metropoli-tan are primarily in eastern Hamilton County, along the Interstate 75 transportation corridor between the city of Chattanooga and the Cleveland metropolitan area, and in proximity to the recently established employment centers, including the Volkswagen man- ufacturing plant and adjacent business park, the Amazon.com Inc. distribution center, and nearby McKee Foods.
• The 104-lot first phase at Prairie Pass, in the unincorporated community of Apison in eastern Hamilton County, opened in 2013 with three-bedroom, two-bathroom homes priced from approximately $230,000. Approximately 45 lots remain, and the first phase is expected to be complete in the summer of 2015. A 180-lot second phase, with an anticipated starting price of approximately $250,000, is expected to begin infrastructure development in the spring of 2015 and home construction by the end of 2015.
The percent of seriously delinquent loans and REO properties in the Chattanooga area decreased at a slower rate than the rate in the nation.
REO = real estate owned.Source: Black Knight Finanacial Services, Inc.
Permitting of single-family homes decreased from 2005 through 2010 and remained subdued in the Chattanooga area.
Note: Includes preliminary data from January 2014 through December 2014.Source: U.S. Census Bureau, Building Permits Survey
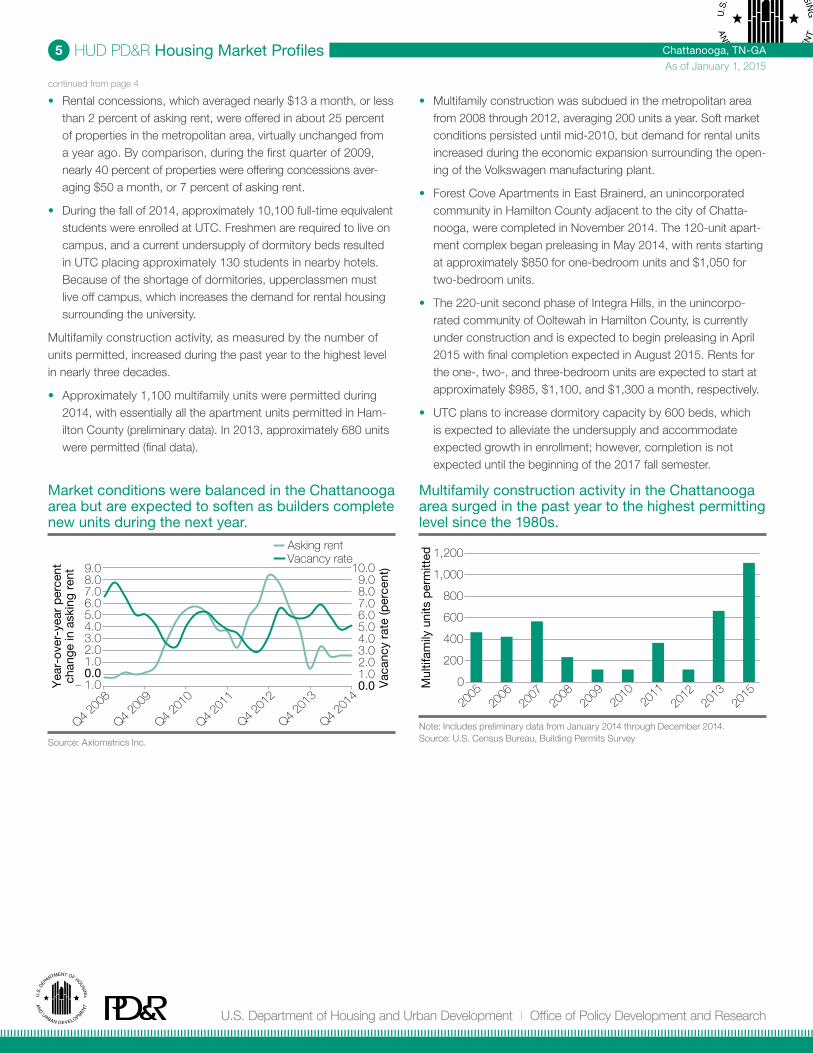
Apartment Market ConditionsApartment market conditions in the Chattanooga metropolitan area are currently balanced, despite increased multifamily permitting in 2013 and 2014. Strong economic growth and net in-migration increased demand for apartments. As additional units are complet-ed during the next year, market conditions are expected to soften.
During the fourth quarter of 2014—
• The apartment vacancy rate decreased to 5.2 percent from 6.0 percent during the fourth quarter of 2013 (Axiometrics Inc.).
• The asking rent increased nearly 2 percent, to average $844, from $830 during the same quarter a year earlier.
continued on page 5
4.0
5.0
10.0
9.0
8.0
6.0
7.0
Per
cent
of l
oans
90
or m
ore
day
sd
elin
que
nt, i
n fo
recl
osur
e,
or t
rans
ition
ed in
to R
EO
Chattanooga areaTennessee Nation
Dec 2
008
Dec 2
009
Dec 2
010
Dec 2
011
Dec 2
012
Dec 2
014
Dec 2
013 0
1,000
500
2005
2006
2007
2008
2009
2010
2011
2012
2014
2013
1,500
Sin
gle-
fam
ily h
omes
per
mitt
ed
2,000
2,500
3,500
3,000
Chattanooga, TN-GAHUD PD&R Housing Market Profiles 5
U.S. Department of Housing and Urban Development | Office of Policy Development and Research
As of January 1, 2015
continued from page 4
• Rental concessions, which averaged nearly $13 a month, or less than 2 percent of asking rent, were offered in about 25 percent of properties in the metropolitan area, virtually unchanged from a year ago. By comparison, during the first quarter of 2009, nearly 40 percent of properties were offering concessions aver- aging $50 a month, or 7 percent of asking rent.
• During the fall of 2014, approximately 10,100 full-time equivalent students were enrolled at UTC. Freshmen are required to live on campus, and a current undersupply of dormitory beds resulted in UTC placing approximately 130 students in nearby hotels. Because of the shortage of dormitories, upperclassmen must live off campus, which increases the demand for rental housing surrounding the university.
Multifamily construction activity, as measured by the number of units permitted, increased during the past year to the highest level in nearly three decades.
• Approximately 1,100 multifamily units were permitted during 2014, with essentially all the apartment units permitted in Ham-ilton County (preliminary data). In 2013, approximately 680 units were permitted (final data).
• Multifamily construction was subdued in the metropolitan area from 2008 through 2012, averaging 200 units a year. Soft market conditions persisted until mid-2010, but demand for rental units increased during the economic expansion surrounding the open-ing of the Volkswagen manufacturing plant.
• Forest Cove Apartments in East Brainerd, an unincorporated community in Hamilton County adjacent to the city of Chatta-nooga, were completed in November 2014. The 120-unit apart-ment complex began preleasing in May 2014, with rents starting at approximately $850 for one-bedroom units and $1,050 for two-bedroom units.
• The 220-unit second phase of Integra Hills, in the unincorpo-rated community of Ooltewah in Hamilton County, is currently under construction and is expected to begin preleasing in April 2015 with final completion expected in August 2015. Rents for the one-, two-, and three-bedroom units are expected to start at approximately $985, $1,100, and $1,300 a month, respectively.
• UTC plans to increase dormitory capacity by 600 beds, which is expected to alleviate the undersupply and accommodate expected growth in enrollment; however, completion is not expected until the beginning of the 2017 fall semester.
Market conditions were balanced in the Chattanooga area but are expected to soften as builders complete new units during the next year.
Source: Axiometrics Inc.
Multifamily construction activity in the Chattanooga area surged in the past year to the highest permitting level since the 1980s.
Note: Includes preliminary data from January 2014 through December 2014.Source: U.S. Census Bureau, Building Permits Survey
600
200
400
800
1,000
1,200
0Mul
tifam
ily u
nits
per
mitt
ed
2005
2006
2007
2008
2009
2010
2011
2012
2015
2013
6.0
0.0– 1.0
8.09.0
2.0
5.04.0
1.0
3.0
7.0
0.01.02.0
8.09.0
10.0
3.0
5.04.0
7.06.0
Q4 20
10
Q4 20
08
Q4 20
11
Q4 20
12
Q4 20
14
Vac
ancy
rat
e (p
erce
nt)
Yea
r-ov
er-y
ear
per
cent
chan
ge in
ask
ing
rent
Asking rent Vacancy rate
Q4 20
13
Q4 20
09