MDI Status and Plans Lau Gatignon / EN-MEF On behalf of the MDI working group.
INCOMBENT DEFENSE STRATEGIESAGAINST NEW PRODUCT ENTRY
by
HUBERT GATIGNON*THOMAS S. ROBERTSON**
&ADAM J. FEINt
95/49/MKT
Professor of Marketing, at INSEAD, Boulevard de Constance, Fontainebleau 77305 Cedex, France.
Sainsbury Professor of Marketing at the London Business School.
Doctoral Candidate at the Wharton School of the University of Pennsylvania.
A working paper in the INSEAD Working Paper Sertes is intended as a means whereby a faculty researcher'sthoughts and findings may be communicated to interested readers. The paper should be consideredpreliminary in nature and may require révision.
Printed at INSEAD, Fontainebleau, France
INCUMBENT DEFENSE STRATEGIESAGAINST NEW PRODUCT ENTRY
Hubert Gatignon
Thomas S. Robertson
and
Adam J. Fein
June 1995
Hubert Gatignon is Professor of Marketing at INSEAD, Thomas S. Robertson is the Sainsbury Professor ofMarketing at the London Business School, and Adam Fein is a Doctoral Candidate at the Wharton School ofthe University of Pennsylvania.
Please send all correspondance to:Hubert GatignonProfessor of MarketingINSEADBoulevard de Constance77305 Fontainebleau CedexTel: (33) (1) 60-72-40-00Fax: (33) (1) 60-72-42-42e:mail: [email protected]
INCOMBENT DEFENSE STRATEGIES AGAINST NEW PRODUCT ENTRY
Abstract
The objective of this study is to estimate the effectiveness of different defense strategies whenfaced with a new product introduction by a competitor. Using a sample of incumbents acrossa wide range of industries, we find that faster reactions to the new entrant have a positiveimpact on the perceived success of the defense strategy. However, the greater the breadth ofreaction (number of marketing mix instruments used), the less successful the defense. Theability of an incumbent to maintain its market position is also significantly affected by industrycharacteristics and the degree of competitive threat posed by the entrant.

INCOMBENT DEFENSE STRATEGIES AGAINST NEW PRODUCT ENTRY
The focus of this research is on the defense strategies that incumbents use when
confronted with new competitive products. The goal is to explain the success of reaction
strategies, radier than to explain the likelihood of reaction, which is the more prevalent
research objective in the extant literature. In other words our concem is not with whether
incumbents react, but given that they react, how successful will their responses be? In
particular, are faster responses likely to be more successful? Which marketing instruments
should be used? Are broad responses (in ternis of number of marketing mix instruments)
more successful than narrow responses?
The issue of market defense has considerable managerial relevance. In general, as the
success of incumbents increases within a product category, the likelihood of new entry
increases and with it the need for incumbents to defend their position. In many firms,
however, the bias is to develop elaborate new product launch plans but seldom to proactively
specify defense plans in advance of a competitive threat (Bazerman and Carroll 1987,
Robertson and Gatignon 1991).
The bottom line question for managers is what defense strategies will be most
effective. More specifically, the question is what responses will be most successful given a
certain set of procluct category characteristics and the nature of the competitive threat. It is
these managerial questions which have motivated the research endeavor.
We first develop a conceptual framework for structuring the determinants of a
successful defense strategy, especially conceming the characterization of reaction strategies.
Hypotheses are developed as part of this conceptualization. The survey used to collect the
data is tien described and the measures are defmed. Finally, the model used to test the
hypotheses is presented prior to the discussion of the results.
1
1. A Conceptualization of the Determinants of Successful Defense Strategies
Competitive defense is the basis of a rich stream of research in the economics, strategy
and marketing literatures. Most of this literature is theoretical or game-theory based,
especially in economics. Recently, however, an empirical base has been developing, as we
will. discuss.
The economics literature on market defense has been concemed traditionally with
entry deterrence and the role of price (Milgrom and Roberts 1982). More recently, the focus
has extended to consider competitive interactions more broadly (Caves 1984), including
technological interplay among competitors (Cohen and Levin 1989; Tusliman and Nelson
1990; Gilbert 1992). Within the strategy literature a considerable body of conceptual logic
has emerged regarding competitive interplay (Porter 1980, 1985). An empirical base also has
been developing, which tends to be industry and case study-based (Smith, Grimm, Chen and
Gannon 1991; Chen and MacMillan 1992). Within the marketing literature, the approaches to
the study of competitive defense range from the work on reaction matrices of Lambin, Naert
and Bultez (1975), Hanssens (1980) and , more recently, Leeflang and Wittink (1992), to the
analytical normative approach of Hauser and Shugan (1983), to the PIMS approaches of
Robinson (1988), Bowman and Gatignon (1995) and Ramaswamy, Gatignon and Reibstein
(1994).
Whereas the existing literature is concemed mainly with the likellood or type of
reaction, our particular focus is on the success of the firm's reaction strategy. We seek to
explain the incombent firm's perception of how successful it was in retaining sales volume and
market share when challenged by a new competitive product in the marketplace.
2
The conceptualization which we offer to explain the success of an incumbent's defense
against a new competitive product encompasses three overall categories ofvariables. The first
set is composed of the response variables — particularly speed and the type of reaction. We
examine the success of the incumbent firm's defense against a new competitive product based
on how quickly the firm reacts and how it reacted. The second set comprises the milieu of
product category characteristics. The variables of interest are the growth level of the product
category and the technological intensity of the product category. The third set ofvariables
characterizes the competitive threat. Specifically, we examine how success of response is
affected by the incumbent's relative marketing advantage, the new competitor's relative price
vs. the incumbent, and the new competitive product's relative innovativeness vs. the
incumbent's product.
1.1 Response Variables
Competitive response to a new product can be characterized along a number of
dimensions. For our purposes the focus is on three primary dimensions: (1) the speed of the
response, (2) the marketing mix instrument used (e.g., lower price, increased advertising, or
new product introduction) and (3) the breadth of reaction, i.e., the number of different
marketing mix instruments utilized. We recognize that it could also be interesting to assess
whether the response occurred in a different domain than where threatened, for example, in
another market or in another product category. In our pilot research (with fifty executive
education participants), however, we found the incidence of alternative domain reactions to be
almost non-existent and so we did not pursue this issue further at this time.
3

1.1.1. Speed of Reaction. Interestingly, the current management literature is replete with
admonitions to embrace speed as a business philosophy. Much of this literature is focused on
the speed (cycle time) of new product development (Smith and Reinertsen 1991; Millson, Raj
and Wilemon 1992; Brown and Karagozoglu 1993) or the value of early market entry and
penetration (Vessey 1991; Robertson 1993). More abstractly, speed is also espoused as an
overall philosophy for running the business (Stalk 1988; Eisenhardt 1990; Clark and
Wheelwright 1993). Nevertheless, very little empirical evidence is offered to support the
generalized value of speed. This general view suggests our first hypothesis which we discuss
in the spebific context of competitive responses:
H Speed of reaction is positively related to success of reaction.
The value of speed in responding to new competitors has been tested in a rather limited
marner. Smith, Grimm, Chen and Gannon (1991), for example, in a highly constrained sample
of 22 top-level managers in electronics' firms, documented a positive correlation between
speed of response to competitive "critical incidents" and performance (assessed by sales
growth and profits). However, they did not sort-out the causal relationships, i.e., did speed of
response lead to high performance or do high performance firms respond more quickly?
In a second study in the U. S. airline industry, the same authors utilized published data
on actions and reactions among industry participants to test for a relationship between speed
of response to various types of actions, such as price cuts and market entry, and performance
(measured as net alter tax profit rate) (Smith, Grimm, Gannon and Chen 1991). A major
caveat is that this study is not measuring profitability as a consequence of the reaction, but is
simply looking at secondary data on the firm's general level of profitability. The authors
documented a significant negative relationship (contrary to their expectations) between
4
response time and performance, i.e., the slower the firm's reaction to a competitive move, the
better the profitability. Although this seems to suggest that a delaying response will be more
successful, it may simply reflect the fact that dominant profitable competitors feel less need to
respond.
A possible explanation for the inconsistency in findings of the latter two studies is
offered by Chen and MacMillan (1992), who examined the role of market dependence in
affecting likehliood and speed of response in the U.S. airline industry to a composite of
competitive moves, such as price cuts, service improvements, and mergers. Their findings
suggest thât market dependence has a significant positive main effect on likelihood of reaction.
However, there is a tendency for such reactions to be siower and more cautious: ". . . when
attacked in their key markets, competitors . . . tend to act with determination but also with
deliberation and caution, for fear of precipitating escalation" (p. 564).
Thus, the strategy literature, which examines the determinants of response time, has
identified a number of firm and industry factors that are associated with reaction speed in
existing markets. The market pioneer literature (e.g., Lambkin 1988, Robinson 1988a,
Robinson and Fomell 1985, Urban et al. 1986), which conceptualizes a faster response as
lower numerical order of entry, finds that earlier entry has a positive influence on long-terni
market share. However, neither of there research streams provides a theoretical linkage
between the speed of reaction to new entrants and the success of an incombent. The logic for
speed relating positively to the success of reaction rests in botte consumer behavior and
competitive behavior arguments. We propose that a faster reaction is more successful due
botte to its influence on consumer preference formation and to its potential signaling value.
Consumer preferences are dynamic (Bettman 1979) and are often driven by earlier
entrants. Carpenter and Nakamoto (1989) demonstrate that order of entry influences
5

consumer preferences. In their experiments the pioneer is able to define the attributes that are
valued by buyers. This advantage, however, is only conferred when the attribute space is
fixed. An innovative entrant may be able to enlarge or redimensionalize attribute space
through access to newer technology or by shirting the bases of competition. The entrant then
has the opportunity to redefme the buyer's ideal point.
A quick reaction by the incumbent bluets this potential late-mover advantage. By
acting quickly, the incumbent limits the new competitor's ability to reshape preferences. A
speedy response also limits any association between the new entrant and a revised ideal point.
AT&T's rapid reponse to MCI's entry into the long-distance collect calling market illustrates
the value of a rapid response (Sellars 1994). MCI, taking advantage of new computer and
satellite technology, was able to offer a new 800-number collect calling service. Within two
months, AT&T responded by introducing a service with a similar name and virtually identical
positioning. Although MCI altered the basis of competition in the formerly monopolistic
collect calling market, AT&T effectively blunted the advantage by "co-pioneering" the new
location in product attribute space. Rapid response also lowers the likellhood of consumer
trial of new product alternatives. The introduction of a competitive entry can be a source of
consumer conflict and put fixed response patterns (habits) at risk (Bettman 1979). If loyalty
patterns are broken, they may be difficuh for the incumbent to reestablish.
In the competitive realm, speed sends a signal of commitment and an unwillingness to
relinquish sales (Heil and Robertson 1991). If a faster reaction represents a credible and clear
signal about the incumbent's intentions, then speed of reaction should be positively associated
with success. The effect is in both the action and the signaling value of the rapid response.
1.1.2. Marketing mix instrument used to react. We now focus on the impact of the type of
marketing mix reaction on the market success of the incumbent. Specifically, which marketing
6
mix instruments will be most effective — product reaction, pricing reaction, or
advertising/salesforce/channel reaction? Biggadike (1979) and Robinson (1988a) conclude
that a lack of reaction by incumbents is the norm. When reaction does occur, it is most
prevalent on price, whereas increased marketing expenditures and product changes are less
likely (Robinson 1988a). This evidence, however, is based on entries corresponding to start-
up businesses. The high level of uncertainty associated with these businesses could lead to a
cautionary attitude on the part of the incumbents which hinders response. In fact, Bowman
and Gatignon (1995) found a significantly higher level of reaction when the database was not
limited to stàrt-up businesses: 60.2% of the incumbents responded to a new product
introduction.
The basic for formulating hypotheses as to how the type of reaction affects
performance is limited. Robertson and Gatignon (1991) have proposed a number of
generalizntions but provide no empirical support. They suggest that aggressivepricing is
appropriate if the market is price sensitive, cross elasticity of demand is high, and economies
of scale strongly affect profitability. Of course, the lirait pricing literature in economics has
documented the role of aggressive pricing in discouraging entry, but this is a somewhat
different issue because it concems the attempts by existing competitors to prevent rather than
to react to entries (Caves and Porter 1977; Milgrom and Roberts 1982). Robertson and
Gatignon (1991) further advocate innovation or extended product positioning and
repositioning when threatened. They argue, in line with the classic work of Bain (1956), that
increasing advertising and salesforce expenditures can act as a substantial barrier to entry.
Within the marketing literature, the work of Hauser and Shugan (1983) has been
inftuential in specifying profit maximi7ing defensive strategies to new product entry. Their
analytic model is of normative value but is based on a specific set of assumptions, including a
7

specifiable multiattribute brand space, utility maximization by the consumer, consumer
heterogeneity, and the ability to model awareness and product availability as a function of
advertising and distribution. This yields some interesting recommendations, particularly that
incumbent profits will be maximized upon new entry if awareness advertising is decreased and
the distribution budget is decreased. The best pricing defense can be to increase price in
segmented markets (Hauser 1986). While this is the profit maximizing position, Hauser and
Shugan conclude that profit is alvvays decreased by a competitive new brand. The consumer
model has been tested empirically (Hauser and Gaskin 1984) and the DEFENDER model has
been applied to a number of managerial situations (Hauser 1988). However, the results might
depend on market conditions. For example, Kumar and Sudharshan (1988), in one of the few
extensions to the DEFENDER model, lied that if the market size increases due to entry, the
incumbent's advertising and distribution expenditures should be increased.
Gatignon, Anderson, and Helsen (1989) explain competitive reaction to new entry in
the airline and gynecological drug markets. They show that firms' reactions are a function of
the elasticity of marketing mix variables. In the two oligopolistic markets studied, firms
reacted positively with their most effective (elastic) marketing mix weapons and cut-back on
their least effective (inelastic) weapons. However, their model did not examine the success of
these reaction strategies.
Robertson and Gatignon (1991) provide managerially-focused generalizations as to
conditions under which each marketing instrument should be used. With the assomption that,
on average, firms use the most effective instrument given their competitive and market
conditions, in practice we will observe a positive relationship between the intensity of reaction
on any marketing instrument and the success of the reaction.
8
H2a Increases in advertising/salesforce/channel expenditures will be
positively related to success of reaction.
H2b Reaction on the product dimension will be positively related to
success of reaction.
Hic Price decreases will be positively related to success of reaction.
1.1.3. Breadth of reaction. Will reaction on a range of marketing mix variables be more or
less successful than reaction on a single variable? In line with Gatignon, Anderson and Helsen
(1989), we expect firms to react on the marketing mix instrument with the highest elasticity.
Since we also expect declining marginal effectiveness for each additional type of reaction, a
firm is likely to react primarily along one or two dimensions. An increased number of
reactions implies the use of less effective instruments. Given a fixed resource base, a large
number of reactions implies insufficient weight behind each reaction. Thus, we hypothesize
the following:
H3 Breadth of reaction will be negatively related to success of reaction.
Empirically, we are not aware that this proposition has been tested. In a somewhat
different domain (reaction to price decreases) and with a different concem (predicting
reaction), Heil, Morrison and Walters (1994) noted that firms reacting strongly (with
important commitment of resources relative to capability and relative to industry practice)
utilize a large number of variables. Although strength of reaction was the focus of their study
(the dependent variable), the number of reaction variables employed appears as a distinct (even
though possibly related) dimension of the defense strategy. Robinson (1988a) considered a
similar construct: his "reaction index" is based on the number of marketing mix instruments
used. Again, however, this measure was the dependent variable, rather than success of
9
reaction as in the present research. Thus, there is precedent for the breadth of reaction
variable but no empirical data that relates breadth to success of reaction.
The argument for the proposed negative relationship between breadth and success is
that breadth is likely not to properly take into account varying marketing instrument
elasticities. Indeed, the spread of resources across marketing variables would seem to dilute
the overall reaction effect and to indicate a lack of focus. It is possible that a broad reaction
strategy would be used in order to take advantage of all the means at hand to counter the
entrant. This would be done in order to: (1) benefit from possible interactions or a multiplier
effect amohg the marketing mix variables', (2) present the entrant from using any other
marketing mix instrument to react back and/or (3) send a non-equivocal signal of commitment
and willingness to defend. However, it is our contention that such a broad reaction would be
less effective than a narrow, focused, reaction.
1.2. Product Category Characteristics
1.2.1. Product Category Growth. Regardless of the defense strategy pursued by the
incumbent, the success of the entrant and of the incumbent depends on the nature of the
product category. 1-ligh growth markets typically are considered to be attractive markets in
which firms should have a propensity to invest. If a firm has already committed to such a
market opportunity, it is rmlikely that it will let new ftrms enter freely. This is especially true,
since in such markets a shake-out typically occurs before the maturity stage. Consequently,
competitors who want to survive have to establish and protect their position early in the
product life cycle.
This retaliation strategy has a deterrence effect on new or potential entrants by limiting
their ability to develop in the market and might encourage exit of the new entrant (depending
10
on exit barriers). The result is to force an industry shake-out earlier than it would occur
normally (Le., without entry deterrence) so that the stronger competitors achieve greater
concentration in the market. A case example is that of the artificial sweetener market in which
Nutrasweet has aggressively cut price in the face of new competitive entry as its patents
expire. The result has been the exit of at least two competitors from this market
(Brandenburger 1993).
Robinson (1988a) found retaliation to be associated with high growth markets, as did
Ramaswamy, Gatignon and Reibstein (1994), each using different PIMS data bases. Cubbin
and Domberger (1988) is the only study, to our knowledge, which found a greater likellhood
of retaliation and a greater extent of reaction in static markets. A rationale for a negative
relationship between market growth and reaction is provided by Robinson (1988a) who argues
that in expanding markets, fins tend to operate close to capacity. Consequently, they have
little margin for reacting, which might involve the need for a higher capacity level (with the
implication of investment in capacity expansion) and the need for additional financial resources
to support the marketing retaliation effort. These resources are problematic given that
resources tend to be constrained at early stages of the product life cycle. This reasoning,
therefore, argues for little reaction of any kind in high growth markets. However, most of the
empirical work fails to support this thesis. As reported above, studies which consider multiple
marketing response instruments (as opposed to Cubbin and Domberger which analyzes only
advertising rivalry), report a greater reaction in high growth markets, as well as a quicker
response (Bowman and Gatignon 1995).
The reader will note that the empirical research base to date has focused on the
likehliood of reaction in high growth markets and not the success of reaction. However, the
literature provides a rationale for explaining success of reaction. Firms encountering a high
11

growth market might be able to gain a position in market niches or segments without affecting
the sales and growth of the incumbents because of the high potential in developing a new
market which is often not yet segmented. This ease of entry in high growth markets has been
evoked in the marketing strategy literature (Acker and Day 1985). This theory has been
contested by Day (1986) who argues that incumbents, even in high growth markets, develop
expectations, and when these expectations are not met because of a new entrant, reactions can
be strong (Ramaswamy, Gatignon, and Reibstein 1994). However, even under these
conditions, the entrant will not affect the incumbent to the same extent as it would in a low
growth market. Regardless of the defense strategy used by the incumbent, the new entrant
does not hurt the incumbent as much in a high-growth market as in a low-growth market.
Therefore, we propose that:
H4 Product category growth rate will be positively related to success ofreaction.
1.2.2. Technological Intensity. The shortening of product life cycles has been documented
across a range of product categories as disparate as cosmetics, foods, toys, pharmaceuticals,
and computers (von Braun 1990), although Bayus (1992) has offered contrary evidence in the
home appliance industry. Relatedly, the firm's portfolio of sales has changed such that
volume is increasingly generated from products on the market for a shorter period of Lime.
Von Braun (1990), who was Head of Technology Strategy for Siemens, provided evidence
that in 1975, 40% of Siemens' sales were represented by products on the market less than six
years and that by 1986, this proportion had increased to 56% of sales.
In product categories characterized by a high level of technological intensity, product
reactions will be more difficult. Fligher levels of technological intensity create a "gateway to
entry" (Yip 1982) because new entrants have the ability to use the latest or lower cost
12
technology to leapfrog. An incumbent monopolist may not be amenable to this new
technology, since innovation destroys rents in the firm's existing products (Scherer and Ross
1990). For example, incumbents may seek to maintain backward compatibility with earlier
technologies, even at the cost of a lower level of innovation. Given the shorter product life
cycles of high technology product categories, the time to regain sales momentum is also
constrained (Von Braun 1990). It is our expectation, therefore, that success of reaction will
be lower under conditions of technological intensity.
Hs Technological intensity will be negatively related to success of reaction.
1.3. Competitive Threat
1.3.1. Incumbent's Relative Marketing Advantage. The management and marketing strategy
literatures recently have accentuated the notion of core competencies or capabilities (Prahalad
and Hamel 1990; Day 1994). We should note that the current specification of this form of
relative competitive advantage has a rich legacy in alternative but highly similar specifications
of the firm's capabilities, such as Selznick's (1957) concept of distinctive competencies or
Teece's (1986) notion of complementary assets.
The capabilities approach focuses attention on the distinctive, hard-to-duplicate
resources that the firm has developed over time. Prahalad and Hamel (1990) discuss
institutionalized capabilities which differentiate the firm strategically, such as investments in
collective leaming and the ability to harmonize streams of technology. These capabilities
represent a form of entry barrier that potentially limits the success of new entrants. We would
be remiss, however, if we did not indicate that the reverse of core competencies is "core
rigidifies" (Leonard-Barton 1992). Firms may pursue a particular set of capabilities that can
lead to "incumbent inertia," which retards the receptivity to new ways of conducting business
13
— whether new technologies or new marketing systems. IBM, for example, may be a classic
case of incombent inertia; its core competencies in mainframes resulted in late market entry in
PCs and workstations, and its core competencies in direct sales resulted in late endorsement of
alternative sales charnels, such as the catalog and telemarketing channels pioneered by Dell or
the mass merchant channels pioneered by Packard-Bell.
It is on marketing capability that we focus here because of our emphasis on the
incumbent's capability to mount a successful market defense. The proposition is that strong
capabilities in customer relationships, channel access and brand reputation will limit the
success of any new entrant.
H6 The incumbent's level of marketing advantage will be positively related tosuccess of reaction.
1.3.2. New Competitor's Relative Price. The relationsbip of price to reaction success requires
little justification. It is our expectation that the lower the relative price level of the new entry,
the less successful will be the competitive defense, ceteris paribus. Thus:
H, The new entry's level of relative price advantage will be negativelyassociated with success of reaction.
1.3.3. Relative Innovativeness of New Entry. Product design in many industries follows a
pattern of stability punctuated by discontinuities or radical innovations. During these periods
of stability (Landau 1984), firms may introduce a sertes of product enhancements or
technology migrations. The introduction of reasonably continuous innovations would seem to
favor the probability of successful defense by incombent firms, particularly if a dominant
design has been established (Teece 1986), although adherence to dominant designs may put
the firm at risk (Ghemawat 1991). Indeed, Anderson and Tushman (1990) have documented
that incombent firms tend to champion technologies which are "competence enhancing."
14

At the other externe incumbents may be faced by innovative entry by newcomers
which champion designs that are "competence destroying" (Anderson and Tushman 1990).
For example, biotechnology is not compatible with the existing R&D core competencies of
pharmaceutical fins (Pisano 1990), and innovation has corne from newcomers rather than
pharmaceutical industry incumbents. Interestingly, the downstream competencies of these
pharmaceutical firms are still formidable and biotech firms have tended to utilize their
sales/marketing resources by licensing and co-ventœing. Ettlie, Bridges and O'Keefe (1984)
have shown that unique strategy and structure are necessary for radical innovation, whereas
more traditiônal strategy and structure support incremental innovation. It is in these cases of
discontinuous innovation that the incumbent firm is least likely to be able to defend its market
position.
118 The new entrant's relative innovativeness will be negatively associatedwith the incumbent's success of reaction.
2. Methodology
2.1. Data
The data used to test the hypotheses corne from a large scale survey of marketing
executives across a range of industries in the U.S.A. We mailed a questionnaire to a sample of
two thousand executives in June 1993 obtained from a commercial list of marketing
executives. A financial incentive (the drawing of a $500 prize) was included. A reminder
mailing was made two weeks alter the initial one. A total of 416 questionnaires was returned,
representing a 21% response rate among potential respondents. This response rate is
comparable to other similar large scale surveys of executives and managers (Achrol and Stem
1988; Anderson, Chu, and Weitz 1987; Heide and John 1988; Gatignon and Robertson 1989;
Robertson, Rymon and Eliashberg 1995).
15

The survey elicited information about the presence and characteristics of a new
product introduced by a competitor into the respondent's main product category. Since our
study focuses exclusively on post-entry defense strategies, respondents who indicated that they
could not remember a new product from a competitor were asked to return their incomplete
surveys. Thirteen percent of the sample (55 respondents) indicated that they could not recall a
new entrant and 15 questionnaires had missing data, thus providing 346 complete surveys. An
andysis of the time since the competitor's new product had entered the market did not reveal
significant differences (92% of the sample reported on events which occurred less than two
years before).'
We evaluated nonresponse bias by comparing the industries represented in our sample
with the list utilized. No significant differences were found in the industries represented. We
also compared early respondents (first half) with late respondents (second hall), following
Armstrong and Overton's (1977) procedure. No significant differences were found on key
characteristics such as respondent industry, total company sales, or order of incumbent market
entry, suggesting that nonresponse bias may not be a substantial problem.
Our data have a number of distinct advantages over other multi-industry data sets that
have been used to study competitive reactions to market entry. Because we surveyed
incumbents reacting to entry, the data capture information about both successful and
unsuccessful entrants, limiting entrant survivor bias (Golder and Tellis 1993). Any remaining
bias due to incumbent exit is likely to be limited. The data also capture reactions that may not
have been perceived by the entrant, since we are taking the incumbent's perspective. In
addition, many previous studies of competitive reactions have focused on a single industry
(e.g., Smith, Grimm, Chen, and Gannon 1991). Our sample is reasonably representative of a
wide range of industries, as shown in Table 2.
16
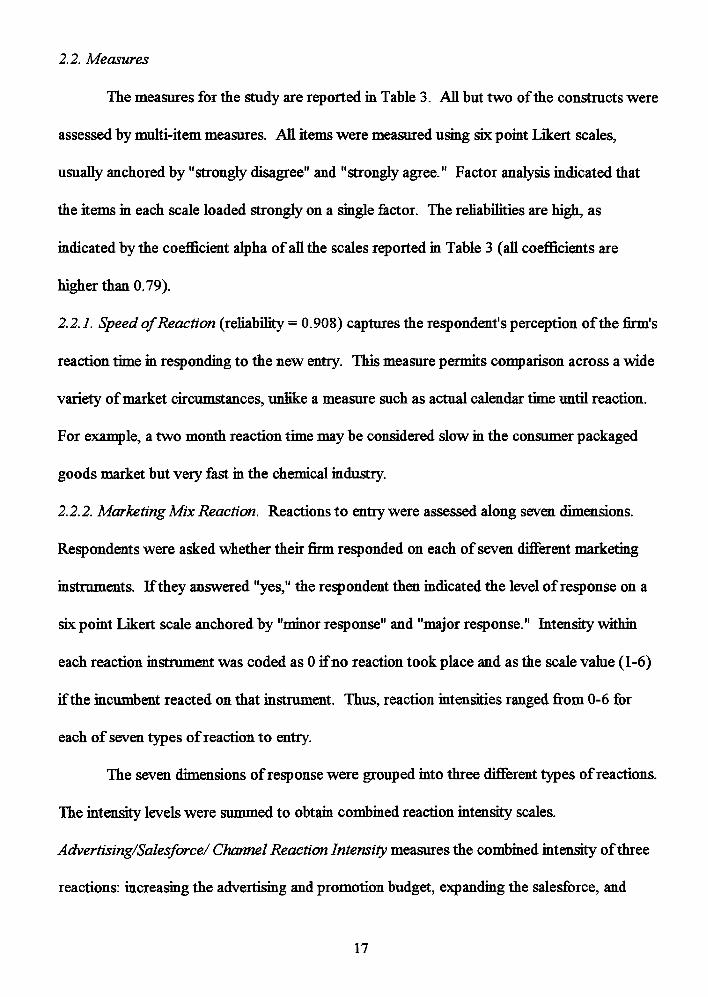
2.2. Measures
The measures for the study are reported in Table 3. All but two of the constructs were
assessed by multi-item measures. All items were measured using six point Likert scales,
usually anchored by "strongly disagree" and "strongly agree." Factor analysis indicated that
the items in each scale loaded strongly on a single factor. The reliabilities are high, as
indicated by the coefficient alpha of all the scales reported in Table 3 (all coefficients are
higher Chan 0.79).
2.2.1. Speed of Reaction (reliability = 0.908) captures the respondent's perception of the firm's
reaction time in responding to the new entry. This measure permits comparison across a wide
variety of market circumstances, unlike a measure such as actual calendar time until reaction.
For example, a two month reaction time may be considered slow in the consumer packaged
goods market but very fast in the chemical industry.
2.2.2. Marketing Mix Reaction. Reactions to entry were assessed along seven dimensions.
Respondents were asked whether their firm responded on each of seven different marketing
instruments. If they answered "yes," the respondent then indicated the level of response on a
six point Likert scale anchored by "minor response" and "major response." Intensity within
each reaction instrument was coded as 0 if no reaction took place and as the scale value (1-6)
if the incombent reacted on that instrument. Thus, reaction intensifies ranged from 0-6 for
each of seven types of reaction to entry.
The seven dimensions of response were grouped into three different types of reactions.
The intensity levels were summed to obtain combined reaction intensity scales.
Advertising/Salesforce/ Channel Reaction Intensity measures the combined intensity of three
reactions: increasing the advertising and promotion budget, expanding the salesforce, and
17

expanding distribution. Product Reaction Intensity measures the combined intensity of three
reactions: improving the existing product, repositioning the existing product, or introducing a
new product. Price Decrease Intensity measures the single reaction of a price decrease in
response to the competitive entry.
2.2.3. Breadth of Reaction. This variable, similar to Robinson's (1988a) "reaction index," is
the combined number of marketing mix instruments used to react. Its range is from zero to
seven reaction instruments.
2.2.4. Success of defense (reliability = 0.821) measures the perceived performance of the
incumbent following the new competitive entrant. Although self-assessment measures are
prone to potential bias, they are the most commonly used form of performance assessment in
marketing strategy research (Saunders, Brown and Laverick 1992). Their use has been
justified by a number of reasons. First, it is recognized that the presumably more "objective"
financial measures and sources can be biased as well "because of the ulterior motives for which
they are produced" (Saunders, Brown and Laverick 1992, p.184). Secondly, objective
financial data are generally available at the aggregate firm level and not at the level of the
product category where the research is focused. Thirdly, it may be asserted that managers
have the greatest knowledge of their own performance. Finally, self-assessed measures have
been shown to be reliable (Doyle, Saunders and Wright 1989, Dess and Robinson 1984,
Venkatraman and Ramanujam 1986). The items in our measures directly link the entry with
the incumbent's subsequent market performance. This provides a level of confidence that
changes in market position unrelated to the new entrant are not spuriously correlated with the
characteristics of the new competitor.
2.2.5. Product Category Characteristics. In our conceptualization, product category variables
influence the success of reaction. Growth measures the category growth rate and stage of the
18

product life cycle (reliability = 0.799). Level of Technology is a 3-item measure of the
importance of technology within the product category (reliability = 0.83 8).
2.2.6. Competitive Threat. Three separate measures captured the competitive threat posed by
the new entrant. Incumbent's Relative Marketing Advantage reflects competitive
differentiation in underlying organizational marketing capabilities between the incumbent and
the entrant. The capabilities included in the measure are intended to be distinctive,
imperfectly mobile, and Nard to imitate. These type of capabilities can be potent sources of
sustained competitive advantage (Bamey 1991). Relative Price vs. New Competitor gauges
the new entiant's attempt to compete with the incumbent on price. Relative Innovativeness of
New Competitor vs. Incumbent measures the advantage of the new competitor's product.
Therefore, the items characterize the degree to which the new product represented a
substantial change in underlying technology or in value to consumers, forming a scale with a
reliability of 0.866.
2.3. Model
The success of defense measure is regressed on the variables hypothesized to influence
it. The following model was, therefore, estimated:
SUCCESS, = + p ,SPEED, + MITGINT i + sPRODINT, + 13 eRICINT, + ps.13READTHi + (3pROW+ 7TECH, + p gRELCAL + 9RELPRICE, + ioNPINNOV, + u, THC)
where:
SUCCES SiSPEEDMKTGINTiPRODINTiPRICINTiBREADTHiGROWTHiTECK
Perceived performance of the incumbent respondentSpeed of response,Intensity of communication response,Intensity of response with product mix,Intensity of price decrease,Breadth of reactions of respondent iGrowth of market for incumbent respondentLevel of technology in product category,
19
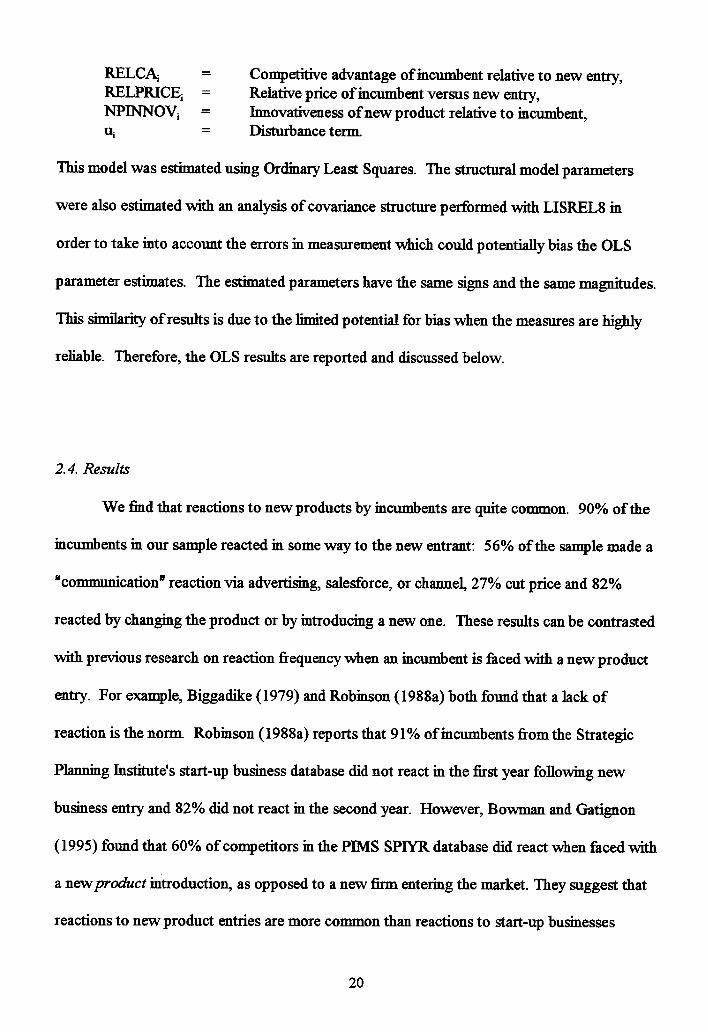
RELCAi = Competitive advantage of incumbent relative to new entry,RELPRICEi = Relative price of incumbent versus new entry,NP1NNOVi = Innovativeness of new product relative to incumbent,ui = Disturbance terni
This model was estimated using Ordinary Least Squares. The structural model parameters
were also estimated with an analysis of covariance structure performed with LISREL8 in
order to take into account the errors in measurement which could potentially bias the OLS
parameter estimates. The estimated parameters have the sanie signs and the sanie magnitudes.
This similarity of results is due to the limited potentiel for bias when the measures are highly
reliable. Therefore, the OLS results are reported and discussed below.
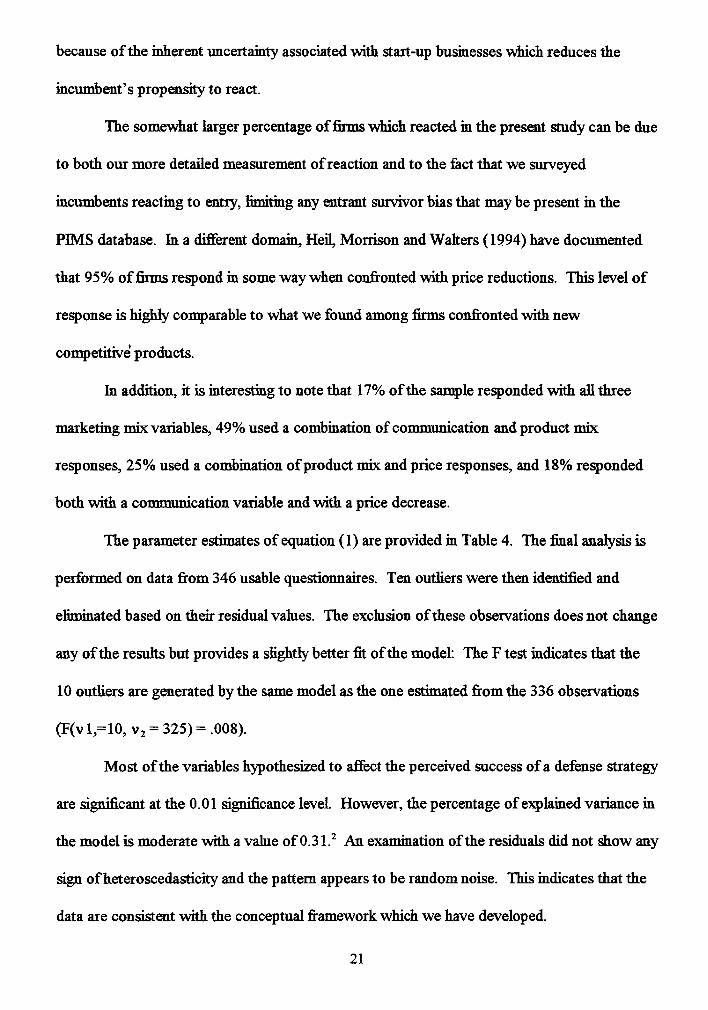
2.4. Results
We find that reactions to new products by incumbents are quite common. 90% of the
incumbents in our sample reacted in some way to the new entrant: 56% of the sample made a
"communication" reaction via advertising, salesforce, or channel, 27% cut price and 82%
reacted by changing the product or by introducing a new one. These results can be contrasted
with previous research on reaction frequency when an incumbent is faced with a new product
entry. For example, Biggadike (1979) and Robinson (1988a) both found that a lack of
reaction is the norm. Robinson (1988a) reports that 91% of incumbents from the Strategic
Planning Institute's start-up business database did not react in the first year following new
business entry and 82% did not react in the second year. However, Bowman and Gatignon
(1995) found that 60% of competitors in the PIMS SPIYR database did react when faced with
a new product introduction, as opposed to a new firm entering the market. They suggest that
reactions to new product entries are more common than reactions to start-up businesses
20
because of the inherent uncertainty associated with start-up businesses which reduces the
incumbent's propensity to react.
The somewhat larger percentage of firms which reacted in the present study can be due
to botte our more detailed measurement of reaction and to the fact that we surveyed
incumbents reacting to entry, limiting any entrant survivor bias that may be present in the
PIMS database. In a different domain, Heil, Morrison and Walters (1994) have documented
that 95% of firms respond in some way when confronted with price reductions. This level of
response is highly comparable to what we found among firms confronted with new
competitivè products.
In addition, it is interesting to note that 17% of the sample responded with ail three
marketing mix variables, 49% used a combination of communication and product mix
responses, 25% used a combination of product mix and price responses, and 18% responded
both with a communication variable and with a price decrease.
The parameter estimates of equation (1) are provided in Table 4. The final analysis is
performed on data from 346 usable questionnaires. Ten outliers were then identified and
eliminated based on their residual values. The exclusion of these observations does not change
any of the results but provides a slightly better fit of the model: The F test indicates that the
10 outliers are generated by the same model as the one estimated from the 336 observations
(F(v 1,=10, v 2 = 325) = .008).
Most of the variables hypothesized to affect the perceived success of a defense strategy
are significant at the 0.01 significance level. However, the percentage of explained variance in
the model is moderate with a value of 0.31. 2 An examination of the residuals did not show any
sign of heteroscedasticity and the pattern appears to be random noise. This indicates that the
data are consistent with the conceptual framework which we have developed.
21

2.4.1. Reaction Strategy. As expected, the speed of response by the incombent is a strong
predictor of the success of the reaction strategy (13 = 0.121, t = 2.64). The value of the speed
of reaction which is alluded to in the management literature is highly supported by this broad
cross-sectional study of incumbents confronted by new product entry.
As hypothesized, increases in advertising/salesforce/channel expenditures are positively
associated with the success of the reaction strategy (13 = 0.044, t = 3.17). Similarly, the
stronger the reaction on the product dimension, the more successful is the perceived defense
strategy (13 = 0.048, t = 3.75). In fact, the effect of reaction by either of there marketing mix
variables is similar, as indicated by a test of equality of the two coefficients. (F(v i = 1, v 2 =
325) = 0.076).
Contrary to our expectation, however, price decreases are not positively related to the
success of the reaction. In fact, there is a negative (but nonsignificant) tendency which
suggests that lowering price is associated with less reaction success. It may very well be that
lowering price is a default option when the incombent is unable to cope with the
innovativeness of the new product entry. Of course, failing to have cut price might have
resulted in a worse situation.
The breadth of reaction, as hypothesized, is shown to be related negatively to the
perceived success of the defense strategy = -0.228 t = -5.02). That is, firms which react on
multiple marketing mix instruments report less successful defenses. This might be because the
effect of reaction is being diluted by spreading resources over multiple marketing mix
instruments. The firm may not be optimizing response based on a sourd examination of
marketing mix elasticities for each instrument.
2.4.2. Product Category Characteristics. Variables characterizing the product category in our
model include market growth and level of technology. We hypothesized that a new entrant
22

tends to be perceived as less of a threat and, therefore, the incumbent will be perceived to be
more successful in defending its position in a fast growing market than in a slow growing
market. This hypothesis is supported by the data (p = 0.113, t = 2.31). This is consistent
with the role of market growth found in previous strategy research. The results also indicate
that in industries that are more technological, incumbents perceived that defending market
position is less successful (3 = -0.157, t = –3.57). This confirms our hypothesis that there
will be less success in responding to a new entry in highly technological markets.
2.4.3. Competitive Threat. It is expected that the level of the competitive threat variables will
have a strong impact on the perceived success of the reaction. It is important to control for
these effects since these variables are somewhat correlated with the defensive strategy used by
the incumbents. Therefore, omitting these variables would bias the estimates of the impact of
the defense strategy. These effects indicate the extent to vvhich an incumbent is directly
perceived to be hurt by a new entry, before, or regardless of, any reaction by the incumbent.
As expected, the extent of the threat of the new entry directly affects the perceived
success of the reaction. The three measures of competitive threat are statistically significant.
The greater the incumbent's relative marketing advantage, the more successful the incumbent
is in defending its position 03 = 0.123, t = 2.62). An innovative entry has a negative impact on
the perceived performance of the incumbent (g = -0.259, t = -5.84). The higher the price of
the incumbent relative to the new entry at the time of introduction, the worse the performance
of the incumbent (g = -0.084, t = -2.34). This indicates that in the absence of a reaction from
the incumbent, the greater the competitive threat, the more the incumbent's performance is
hurt.
3. Conclusion and Discussion
23

3.1. Intended Contribution
This study brings new information to academics and managers concerning the impact
of an incumbent's defense strategy when faced with a new product entry in the market. We
make inferences from a large cross section of firms, which we believe contributes to the
generalizability of the results.
This study seeks to add to the extant literature on market defense in multiple ways:
• We make inferences as to the success of reaction strategies, rather than the
likellood of reactions.
• We do not focus our attention on a single key element of the reaction strategy.
Instead, we investigate the impact of the speed of the reacrion, the impact of the
marketing mix instrument (communication, price, product) used to react, as well
as the impact of the breadth of the reaction.
• Our measure of the success of a reaction strategy is based on the perceived
market performance of the incumbent aller making the response. We consider
perceived performance in order to accommodate differences in industries in a
large-scale study involving a cross-sectional analysis.
• This study is differentiated from most of the existing research in this area
because it is based on the analysis of survey data. The only empirical literature
in marketing on defense to new entry involving cross-sectional data is based on
the PIMS database. The remaining empirical work on defense is limited to
single industry studies.
• While the existing literature often deals with new entrants, we focus on new
products.
24

• The existing literature does not distinguish whether the new entry is a
continuous or discontinuons innovation. In our study, we measure and control
for the degree of innovativeness of the new product.
These distinguishing features between our study and the existing literature enable us to draw a
number of managerial conclusions which would seem to transcend specific industries.'
3.2. Limitations
Although we explicitly selected a survey methodology, there are inherent limitations to
surveys. A first issue is that of non-response and whether bias exists as a resuh. It may be
that managers who are most likely to respond are somewhat more sensitized to competitive
signais and competitive interplay. In the present case our response rate is reasonable relative
to other surveys with managers and our analysis of early versus late responses suggests limited
potentiel for non-response bias.
Although we control for market characteristics, we canot model the impact of the
responses of all the competitors, since we only have information about the actions of a single
incumbent in every market. This might affect the perceived performance of the incumbent
being analyzed, especially in markets which become more competitive as a result of the entry.
In markets which were already competitive before the entry, management would probably
incorporate these expectations in their assessment of perceived performance.
It is also possible that incumbents operating in crowded markets may be unaware of
late entrants or the details of their entry strategies. However, this does not seem to be the case
in our sample because the respondent's degree of involvement with the response strategy does
not differ depending on the number of competitors in the market. Our research also relies on a
key informant data source. Although it is possible that multiple respondents within the firm
25
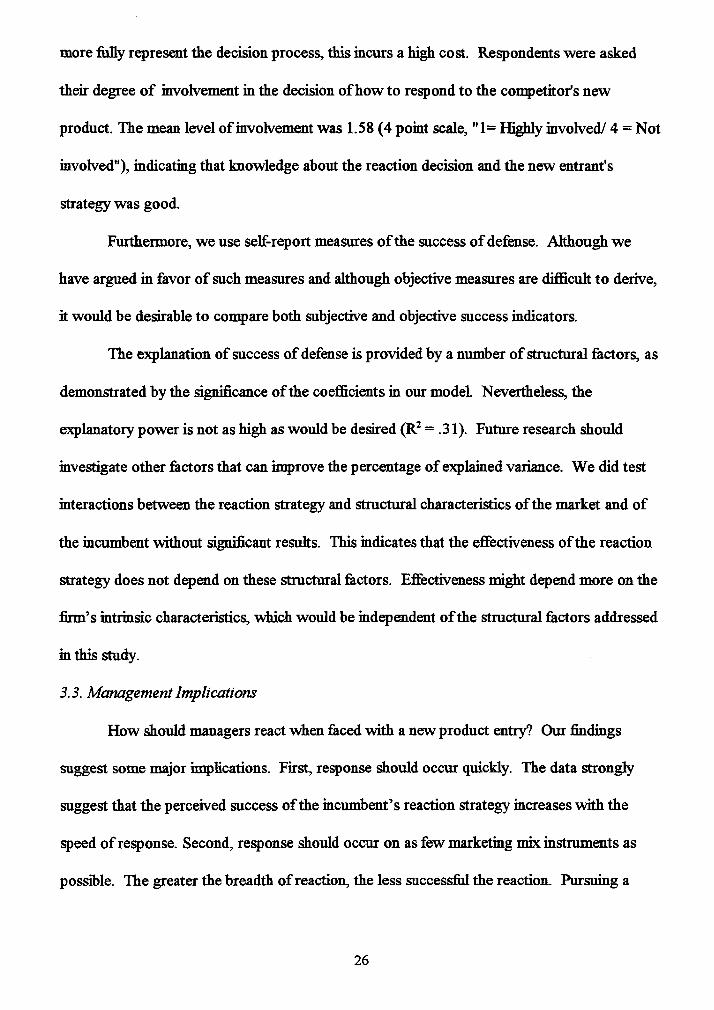
more fully represent the decision process, this incurs a high cost. Respondents were asked
their degree of involvement in the decision of how to respond to the competitor's new
product. The mean level of involvement was 1.58 (4 point scale, "1= Highly invoived/ 4 = Not
involved"), indicating that knowledge about the reaction decision and the new entrant's
strategy was good.
Furthermore, we use self-report measures of the success of defense. Although we
have argued in favor of such measures and although objective measures are difficult to derive,
it would be desirable to compare both subjective and objective success indicators.
The explanation of success of defense is provided by a number of structural factors, as
demonstrated by the significance of the coefficients in our model. Nevertheless, the
explanatory power is not as high as would be desired (R 2 = .31). Future research should
investigate other factors that can improve the percentage of explained variance. We did test
interactions between the reaction strategy and structural characteristics of the market and of
the incumbent without significant results. This indicates that the effectiveness of the reaction
strategy does not depend on these structural factors. Effectiveness might depend more on the
firm's intrinsic characteristics, which would be independent of the structural factors addressed
in this study.
3.3. Management Implications
How should managers react when faced with a new product entry? Our findings
suggest some major implications. First, response should occur quickly. The data strongly
suggest that the perceived success of the incumbent's reaction strategy increases with the
speed of response. Second, response should occur on as few marketing mix instruments as
possible. The greater the breadth of reaction, the less successful the reaction. Pursuing a
26

range of reactions seems to dilate the effectiveness of reaction, perhaps by underspending on
each marketing mix instrument relative to its marginal utility.
As to which marketing mix instrument(s) to use, this depends on the elasticity of each
instrument for a particular firm at a particular time. However, responses on
advertising/salesforce/channeLs and on the product mix can all be successful. By contrast,
price reductions are not associated with successful defense strategies. Lowering price may be
a sign of weakness when the firm is unable to make other responses. Of course, it may also be
that the results for these firms would have been even less favorable if they had not lowered
price. This ià especially true when the new product has a lower price than the incumbent,
sine a price differential is then detrimental to the incumbent.
The incumbent's relative marketing advantage provides a level of protection in
defending against new product entry. Of course, this advantage would have to be built over
time before being threatened by a new entry. The manager of an incumbent firm in a high
growth market is also somewhat more likely to maintain success after a new product entry and
when competing in a low technology product category. However, these are obviously factors
beyond the individual manager's controL
h would appear, based on these results, that there is value in the current "time-based"
approaches to management strategy. When confronted by a new product entry, it is
recommended that managers move with dispatch and focus on a limited set of marketing mix
variables. Success of reaction declines as a greater number of marketing instruments are
utilized. The selection of a particular marketing mix instrument was not the subject of our
analysis and different instruments can have positive effects, except for lower price which
seems not to be associated with successful response. This would indicate that incumbents
should avoid to respond price reactions after competitive entry. However, if they can
27

anticipate the entry price, they should adjust their price to reduce the price differential at the
time of entry.
28

ENDNOTES
1.We thank a reviewer for suggesting this possibility.
2. The breadth variable is correlated with the intensity of a product response (p=0.68), withthe intensity of a communication response (p=0.61) and to a lesser extent with the amount ofprice decrease (p=0.41). However, this did not appear to cause multicollinearity problems, asrevealed by the stability of the results and a reasonable R2.
3. We tested the contribution of industry dummy variables but found them to be insignificant.
29

REFERENCES
Aaker, D. A. and G. S. Day, 1985. The Perils of I-Egh Growth Markets. StrategicManagement Journal (October-December), 403-421.
Achrol, S. S. and L. W. Stem,1988. Environmental Determinants of Decision-MakingUncertainty in Marketing Channels. Journal of Marketing Research 25, 1 (February),36-50.
Anderson, E., W. Chu and B. Weitz, 1987. Industrial Purchasing: An Empirical Exploration ofthe Buyclass Framework. Journal of Marketing 51, 3, 71-86.
Anderson, P. and M. L. Tushman, 1990. Technological Discontinuities and Dominant Designs:A Cyclical Model of Technological Change. Administrative Science Quarterly 35, 604-633.
Armstrong, J. S. and T. S. Overton, 1977. Estimating Nonresponse Bias in Mail Surveys.Journal of Marketing Research 14 (August), 396-402.
Bain, J., 1956. Barriers to Competition. Cambridge, MA: Harvard University Press.
Bamey , J., 1991. Firm Resources and Sustained Competitive Advantage. Journal ofManagement 17, 1, 99-120.
Bayus, B. L., 1992. Have Diffusion Rates Been Accelerating Over Time? Marketing Letters 3(3), 215-226.
Bazerman, M. H. and J. S. Carroll, 1987. Negotiator Cognition. In: B. M. Staw and L. L.Cummings (eds.), Research in Organizational Behavior, 247-288. Greenwich, CT:JAI Press.
Bettman, J. R., 1979. An Information Processing Theory of Consumer Choice. Reading, MA:Addison-Wesley.
Biggadike, R. E. (1979). Corporate Diversification: Entry, Strategy and Performance.Cambridge, MA: Harvard University Press.
Bowman, D. and H. Gatignon, 1995. Determinants of Competitor Response Time to a NewProduct Introduction. Journal of Marketing Research 32, 1 (February), 42-53.
Brandenburger, A., 1993. Bitter Competition: The Holland Sweetener Company VersusNutrasweet. Case Study N9-794-079. Boston, MA: Harvard Business School.
Brown, W. B. and N. Karagozoglu, 1993. Leading the way to Faster New ProductDevelopment. Academy of Management Executive 7 (February), 36-47.
30

Carpenter, G. S. and K. Nakamoto, 1983. Consumer Preference Formation and PioneeringAdvantage. Journal of Marketing Research 26 (3), 285-298.
Caves, R. E., 1984. Economic Analysis and the Quest for Competitive Advantage. Papers andProceedings of the 96th Annual Meeting of the American Economic Association 74(2), 127-132.
Caves, R. E. and M. E. Porter, 1977. From Entry Barriers to Mobility Barriers: ConjecturalDecisions and Contrived Deterrence to New Competition. Quarterly Journal ofEconomics 91, (May), 241-262.
Chen, M. and I. C. MacMillan, 1992. Nonresponse and Delayed Response to CompetitiveMoves: The Roles of Competitor Dependence and Action Irreversibility. Academy ofManagement Journal 35, 3, 539-570.
Clark, K B. and S. C. Wheelwright, 1993. Managing New Product and Process Development.NeW York: The Free Press.
Cohen, W. M. and R. C. Levin, 1989. Empirical Studies of Innovation and Market Structure.In: R. Schmalensee and R. D. Willig (eds.), Handbook of Industrial Organization, Vol.2, New York: Elsevier.
Cubbin J. and S. Domberger, 1988. Advertising and Post-Entry Oligopoly Behavior. TheJournal of Industrial Economics 37, 2, 123-140.
Day, G. S., 1994. The Capabilities of Market-Driven Organi7ations. Working Paper. TheWharton School, University of Pennsy/vania.
Day, G. S., 1986. Analysis for Strategic market Decision. St. Paul, MN: West Publishing Co.
Dess, G. S. and R. B. Robinson, 1984. Measuring Organisational Performance in the Absenceof Objective Measures. Strategic Management Journal 5, 265-273.
Doyle, P., J. Saunders and L. Wright, 1989. A Comparative Study of US and JapaneseMarketing Strategies in British Market. International Journal of Research in Marketing5, 3, 171-184.
Eisenhardt, K M., 1990. Speed and Strategic Choice: How Managers Accelerate DecisionMarking. California Management Review 32 (Fall), 1-16.
Ettlie, J. E., W. P. Bridges and R. D. O'Keefe, 1984. Organization Strategy and StructuralDifferences for Radical Versus Incremental Innovation. Management Science 30(June), 682-695.
Gatignon, H, E. Anderson and K Helsen, 1989. Competitive Reactions to Market Entry:Explaining Interfirm Differences. Journal of Marketing Research 26 (February), 44-55.
31

Gatignon, IL and T. S. Robertson, 1989. Technology Diffusion: An Empirical Test ofCompetitive Effects. Journal of Marketing 53, 1 (January), 35-49.
Ghemawat, P., 1991. Market Incumbency and Technological Inertia. Marketing Science 10(Spring), 161 171.
Gilbert, R J., 1992. Symposium on Compatability Incentives and Market Structure. Journal ofIndustrial Economics 40 (March), 1-8.
Golder, P. N. and G. J. Tellis, 1993. Pioneer Advantage: Marketing Logic or MarketingLegend. Journal of Marketing Research 30 (May), 158-170.
Hanssens, D. M., 1980. Market Response, Competitive Behavior and Time Sertes Analysis.Journal of Marketing Research 17 (November), 470-485.
Hauser, J. R, 1986. Theory and Application of Defensive Strategy. In: L. G. Thomas III (ed.),ThiEconomics of Strategic Planning, Lexington, MA: Lexington Books.
Hauser, J. R, 1988. Competitive Price and Positioning. Marketing Science 7 , 1, 76-91.
Hauser, J. R. and S. P. Gaskin, 1984. Application of the DEFENDER consumer model.Marketing Science 3, 4, 327-351.
Hauser, J. R. and S. M. Shugan, 1983. Defensive Marketing Strategies. Marketing Science 2(Fall), 319-360.
Heide, J. B. and G. John, 1988. The Role of Depen.dence Balancing in SafeguardingTransaction-Specific Assets in Conventional Charnels. Journal of Marketing 52(January), 20-35.
Heil, O. P., D. G. Morrison and R. G. Walters, 1994. Explaining the Strengtb. of CompetitiveReactions to Price Reductions. A Working Paper. UCLA Anderson School ofManagement.
Heil, O. and T. S. Robertson, 1991. Toward a Theory of Competitive Market Signaling: AResearch Agenda. Strategic Management Journal 12, 403-418.
Hui L. C. and W. T. Robinson, 1992. The Impact of the Market Pioneer's Leadtime onMarket Share. Working Paper. School of Business Administration, University ofMichigan.
Kumar, K. R. and D. Sudharshan, 1988. Defensive Marketing Strategies: An EquilibriumAnalysis Based on Decoupled Response Function Models. Management Science 34, 7,805-815.
Lambin, J.J., P. A. Naert and A. Bultez, 1975. Optimal Marketing Behavior in Oligopoly.European Economic Review 6, 105-128.
32
Lambkin, M., 1988. Order of Entry and Performance in New Market. Strategic ManagementJournal 9, 127-140.
Landau, R., 1984. The Nature of Technological Knowledge. Boston: Reidel.
Leeflang, P. S. IL and D. R. Wittink, 1992. Diagnosing Competitive Reactions Using(aggregated) Scanner Data. International Journal of Research in Marketing 9, 39-57.
Leonard-Barton, D., 1992. Core Capabilities and Core Rigidities: A Paradox in ManagingNew Product Development. Strategic Management Journal 13, 111-125.
Milgrom, P. and J. Roberts, 1982. Limit Pricing and Entry Under Incomplete Information: AnEquilibriwn Analysis. Econometrica 50 (March), 443-459.
Millson, M. R., S. P. Raj and D. Wilemon, 1992. A Survey of Major Approaches forAccelerating New Product Development. Journal of Product Innovation Management9, 53-69.
Pisano, G. P., 1990. The R&D Boundaries of the Firm An Empirical An.alysis. AdministrativeScience Quarterly 35 (March), 153-176.
Porter, M. E., 1980. Competitive Strategy: Techniques for Analyzing Industries andCompetitors. New York: The Free Press.
Porter, M. E., 1985. Competitive Advantage: Creating and Sustaining Superior Performance.New York: The Free Press.
Prahalad, C. K and G. Hamel, 1990. The Core Competence of the Corporation. HarvardBusiness Review 68 (May-June), 79-91.
Ramaswamy, V., H. Gatignon, and D. J. Reibstein, 1994. Competitive Marketing Behavior inIndustriel Markets. Journal of Marketing, 58 (April), 45-55.
Robertson, T. S., 1993. How to Reduce Market Penetration Cycle Times. Sloan ManagementReview 35 (Fall), 87-96.
and IL Gatignon, 1991. How Innovators Thwart New Entrants Into Their Market.Planning Review 19, September-October, 4-11 and 48.
T. Rymon and J. Eliashberg, 1995. NPA Signais and Incumbent Reactions. Journalof Marketing 59 (July), forthcoming.
Robinson, W. T., 1988a. Marketing Mix Reactions to Entry. Marketing Science 7 (Fall), 368-385.
,1988b. Sources of Market Pioneer Advantages: The Case of Industriel GoodsIndustries. Journal of Marketing Research 25 (February), 87-94.
33

and C. Fornell, 1985. Sources of Market Pioneer Advantages in Consumer GoodsIndustries. Journal of Marketing Research 22 (August), 305-317.
Saunders, John, Michael Brown and Stuart Laverick, 1992. Research Notes on the BestBritish Companies: A Peer Evahiation of Britain's Leading Firms. British Journal ofManagement 3, 181-195.
Scherer, F. M. and D. Ross, 1990. Industrial Market Structure and Economic Performance.Boston: Houghton Mifflin Company.
Sellars, P., 1994. MCI Communications: Yes, Brands Can Still Work Magic. Fortune 129, 3(February 7), 133-134.
Selznick, P., 1957. Leadership in Administration. New York: Harper & Row.
Smith, K. G., C. M. Grimm, M. Chen and M. J. Gannon, 1991. Predictors of Response Timeto Cbmpetitive Strategic Actions: Preliminary Theory and Evidence. Journal ofBusiness Research 18, 245-258.
Smith, K G., C. M. Grimm, M. J. Gannon and M. Chen, 1991. Organizational InformationProcessing, Competitive Responses, and Performance in the U. S. Domestic AirlineIndustry. Academy of Management Journal 34, 1, 60-85.
Smith P. E. and D. G. Reinertsen, 1991. Developing Products in Half the Time. New York:Van Nostrand Reinhold.
Stalk, G. Jr., 1988. Time: The Next Source of Competitive Advantage. Harvard BusinessReview (July-August), 41-51.
Teece, D. J., 1986. Profiting from Technological Innovation: Implications for Integration,Collaboration, Licensing and Public Policy. Research Policy 15, 228-305.
Tushman, M. L. and R. R. Nelson, 1990. Introduction: Technology, Organizations andInnovation. Administrative Science Quarterly 35, 1-8.
Urban, G. L., T. Carter, S. Gaskin and Z. Mucha, 1986. Market Share Rewards to PioneeringBrands: An Empirical Analysis and Strategic Implications. Management Science 32(June), 645-659.
Vessey, J. T., 1991. The New Competitors: They Think In Ternis of 'Speed to Market'.Academy of Management Executive 5, 2, 23-33.
Venkatraman, N. and Ramanujam, V., 1986. Measurement of Business Performance inStrategic Research: A Comparison of Approaches. Academy of Management Review11, 4, 801-814.
Von Braun, C., 1990. The Acceleration Trap. Sloan Management Review 49 (Fall), 49-58.
34

Yip, G. S., 1982. Barriers to Entry. Lexington, MA: Lexington Books.
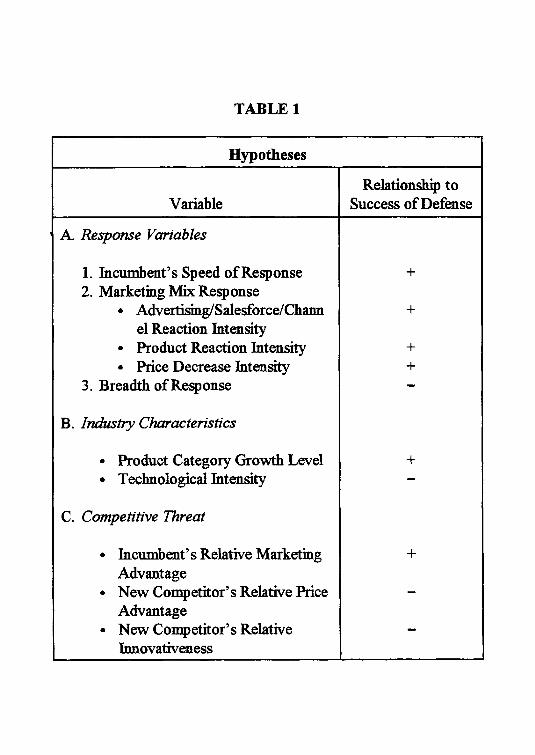
TABLE 1
Hypotheses
VariableRelationship to
Success of Defense
A. Response Variables
1. Incumbent's Speed of Response +2. Marketing Mix Response
• Advertising/Salesforce/Channel Reaction Intensity
+
• Product Reaction Intensity +• Price Decrease Intensity +
3. Breadth of Response —
B. Industry Characteristics
• Product Category Growth Level +• Technologicanntensity —
C. Competitive Threat
• Incumbent's Relative Marketing +Advantage
• New Competitor's Relative PriceAdvantage
• New Competitor's Relativekmovativeness
_
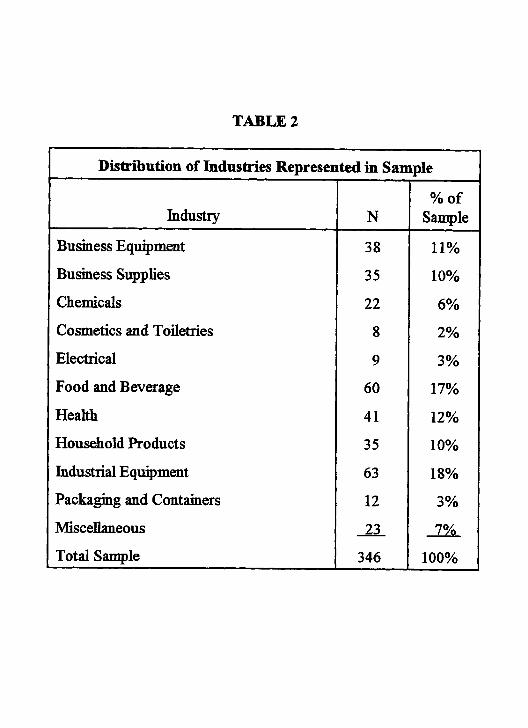
TABLE 2
Distribution of Industries Represented in Sample
Industry N% of
Sample
Business Equipment 38 11%
Business Supplies 35 10%
Chemicals 22 6%
Cosmetics and Toiletries 8 2%
Electrical 9 3%
Food and Beverage 60 17%
Health 41 12%
Household Products 35 10%
Industrial Equipment 63 18%
Packaging and Containers 12 3%
Miscellaneous 23 :aQ_
Total Sample 346 100%
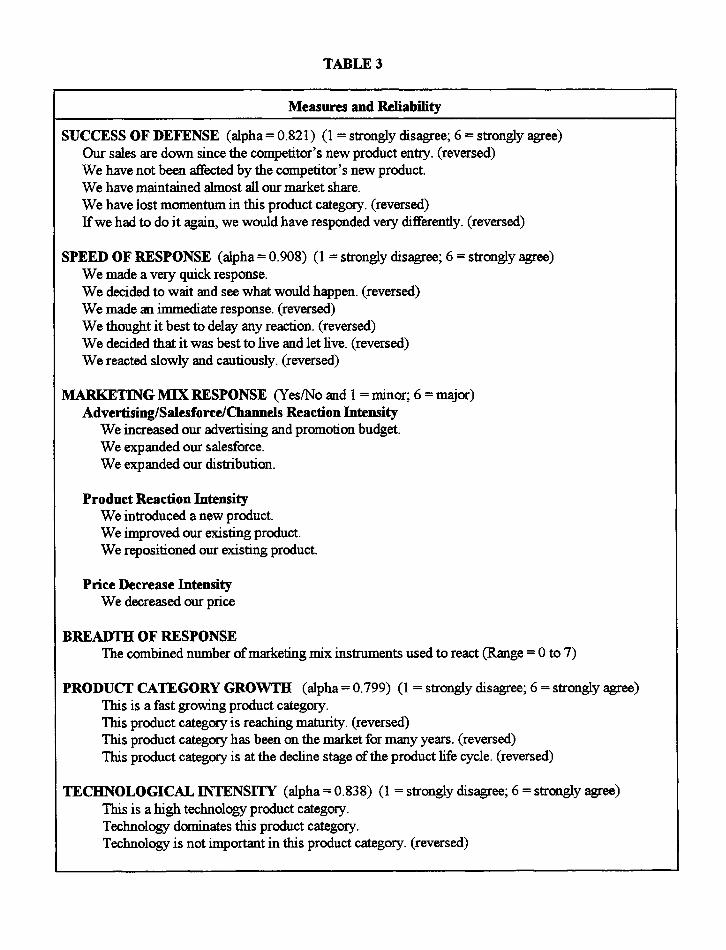
TABLE 3
Measures and Reliability
SUCCESS OF DEFENSE (alpha = 0.821) (1 = strongly disagree; 6 = strongly agree)Our sales are down since the competitor's new product entry. (reversed)We have not been affecte(' by the competitor's new product.We have maintained almost all our market share.We have lost momentum in this product category. (reversed)If we had to do it again, we would have responded very differently. (reversed)
SPEED OF RESPONSE (alpha = 0.908) (1 = strongly disagree; 6 = strongly agree)We made a very quick response.We decided to wait and see what would happen. (reversed)We made an immediate response. (reversed)We thought it best to delay any reaction. (reversed)We decided that it was best to live and let live. (reversed)We reacted slowly and cautiously. (reversed)
MARKETING M]X RESPONSE (Yes/No and 1= minor; 6 = major)Advertising/Salesforce/Channels Reaction Intensity
We increased our advertising and promotion budget.We expanded our salesforce.We expanded our distribution.
Product Reaction IntensityWe introduced a new product.We improved our existing product.We repositioned our existing product.
Price Decrease IntensityWe decreased our price
BREADTH OF RESPONSEThe combined number of marketing mix instruments used to react (Range = 0 to 7)
PRODUCT CATEGORY GROWTH (alpha = 0.799) (1 = strongly disagree; 6 = strongly agree)This is a fast growing product category.This product category is reaching maturity. (reversed)This product category has been on the market for many years. (reversed)This product category is at the decline stage of the product life cycle. (reversed)
TECHNOLOGICAL INTENSITY (alpha = 0.838) (1 = strongly disagree; 6 = strongly agree)This is a high teclinology product category.Technology dominates this product category.Technology is not important in this product category. (reversed)

Measures ami Reliability
INCUMBENT'S RELATIVE MARKETING ADVANTAGE (1 = major competitive disadvantage;6 = major competitive advantage)
Please tell us whether your firm has a competitive advantage on each capability vs. the new productentry.
Customer relationshipMarketing skipsAccess to channels of distributionBrand reputationService capability
NEW COMPETITOR'S RELATIVE PRICE (alpha = n.a.) (1 = strongly disagree; 6 = stronglyagree)
The competitor's new product is priced lower titan ours.
NEW COMPETITOR'S RELATIVE INNOVATIVENESS (alpha = 0.866) (1 = strongly disagree;6 = strongly agree)
The competitor's new technology was a substantial change in technology.The competitor's new product was a "me too" innovation. (reverse»Customers saw the competitor's new product as a major innovation in the product category.The competitor's new product added significance customer benefits.
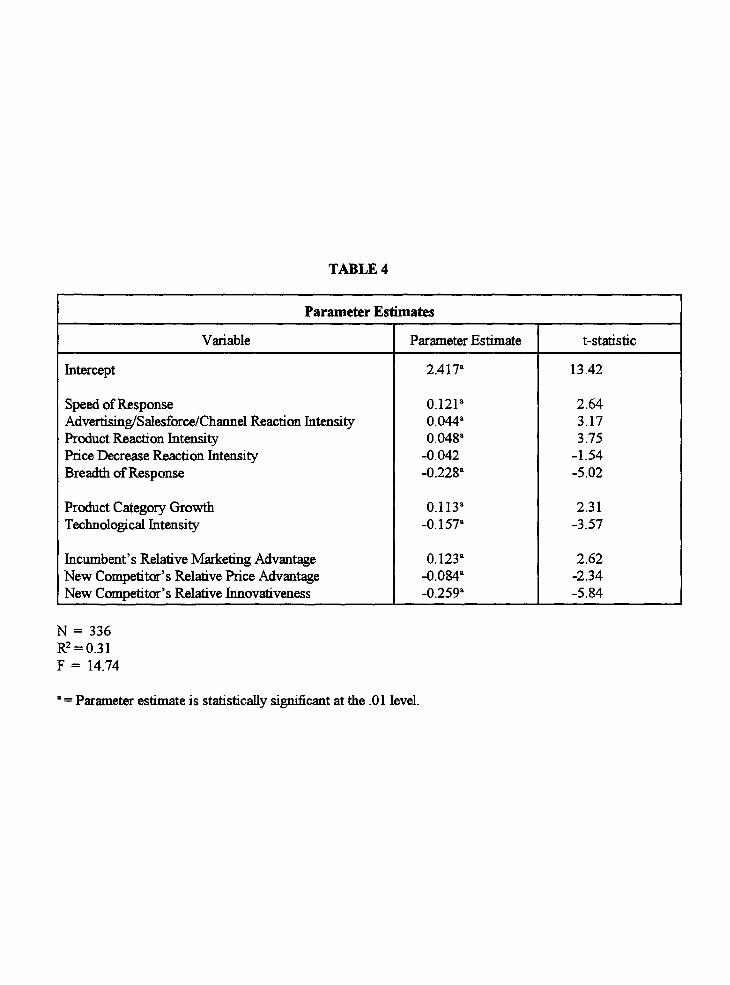
TABLE 4
Parameter Estimates
Variable Parameter Estimate t-statistic
Intercept 2.417a 13.42
Speed of Response 0.121a 2.64Advertising/Salesforce/Channel Reaction Intensity 0.0442 3.17Product Reaction Intensity 0.0482 3.75Price Decrease Reaction Intensity -0.042 -1.54Breadth of Response -0.2282 -5.02
Product Category Growth 0.1132 2.31Technological Intensity -0.157a -3.57
Incumbent's Relative Marketing Advantage 0.1232 2.62New Competitor's Relative Price Advantage -0.0842 -2.34New Competitor's Relative Innovativeness -0.2592 -5.84
N = 336R2= .0 31F = 14 .74
a = Parameter estimate is statistically significant at the .01 level.