
hu2011
19
Nonlinear analysis of short concrete-filled double skin tube columns subjected to axial compressive forces Hsuan-Teh Hu * , Feng-Chien Su Department of Civil Engineering and Sustainable Environment Research Center, National Cheng Kung University, Tainan, Taiwan 701, ROC article info Article history: Received 25 August 2010 Received in revised form 10 March 2011 Accepted 11 May 2011 Keywords: Concrete-filled double skin tube Lateral confining pressure abstract Proper material constitutive models for concrete-filled double skin tube (CFDST) columns with circular cross-section and subjected to axial compressive forces are proposed and verified against exper- iment data using the nonlinear finite element program Abaqus. It is shown that CFDST columns can provide a good confining effect for concrete core, especially when the diameter-to-thickness ratios of both the outer and the inner tubes are small. In addition, empirical equations are proposed to predict the lateral confining pressure of the concrete core for CFDST columns. Finally, the axial strengths of the CFDST columns calculated by the proposed formulations are compared with AISC formulations against the experimental data. It has been shown that the proposed formu- lations are better than the AISC formulations. Ó 2011 Elsevier Ltd. All rights reserved. 1. Introduction A concrete-filled tube (CFT) column consists of a steel tube filled with concrete. The steel tube acts as longitudinal and transverse reinforcement and the concrete delays the local buckling of tube. Due to the benefit of composite action of both materials, the CFT columns provide excellent seismic-resistant structural properties such as high strength, high ductility and large energy absorption capacity. Therefore, CFT columns have gained popularity in supporting heavy loads in high-rise buildings, bridges, offshore structures and marine structures. Various experimental and analytical studies have been performed on CFT columns [1–10]. * Corresponding author. Tel.: þ886 6 2757575x63168; fax: þ886 6 2358542. E-mail address: [email protected] (H.-T. Hu). Contents lists available at ScienceDirect Marine Structures journal homepage: www.elsevier.com/locate/ marstruc 0951-8339/$ – see front matter Ó 2011 Elsevier Ltd. All rights reserved. doi:10.1016/j.marstruc.2011.05.001 Marine Structures 24 (2011) 319–337
-
Upload
yahia-raad-al-ani -
Category
Documents
-
view
212 -
download
0
description
Proper material constitutive models for concrete-filled double skintube (CFDST) columns with circular cross-section and subjected toaxial compressive forces are proposed and verified against experimentdata using the nonlinear finite element program Abaqus.
Transcript of hu2011

Marine Structures 24 (2011) 319–337
Contents lists available at ScienceDirect
Marine Structuresjournal homepage: www.elsevier .com/locate/
marstruc
Nonlinear analysis of short concrete-filled double skin tubecolumns subjected to axial compressive forces
Hsuan-Teh Hu*, Feng-Chien SuDepartment of Civil Engineering and Sustainable Environment Research Center, National Cheng Kung University, Tainan,Taiwan 701, ROC
a r t i c l e i n f o
Article history:Received 25 August 2010Received in revised form 10 March 2011Accepted 11 May 2011
Keywords:Concrete-filled double skin tubeLateral confining pressure
* Corresponding author. Tel.: þ886 6 2757575x6E-mail address: [email protected] (H.-T. H
0951-8339/$ – see front matter � 2011 Elsevier Ltdoi:10.1016/j.marstruc.2011.05.001
a b s t r a c t
Proper material constitutive models for concrete-filled double skintube (CFDST) columns with circular cross-section and subjected toaxial compressive forces are proposed and verified against exper-iment data using the nonlinear finite element program Abaqus. Itis shown that CFDST columns can provide a good confining effectfor concrete core, especially when the diameter-to-thickness ratiosof both the outer and the inner tubes are small. In addition,empirical equations are proposed to predict the lateral confiningpressure of the concrete core for CFDST columns. Finally, the axialstrengths of the CFDST columns calculated by the proposedformulations are compared with AISC formulations against theexperimental data. It has been shown that the proposed formu-lations are better than the AISC formulations.
� 2011 Elsevier Ltd. All rights reserved.
1. Introduction
A concrete-filled tube (CFT) column consists of a steel tube filled with concrete. The steel tube actsas longitudinal and transverse reinforcement and the concrete delays the local buckling of tube. Due tothe benefit of composite action of both materials, the CFT columns provide excellent seismic-resistantstructural properties such as high strength, high ductility and large energy absorption capacity.Therefore, CFT columns have gained popularity in supporting heavy loads in high-rise buildings,bridges, offshore structures and marine structures. Various experimental and analytical studies havebeen performed on CFT columns [1–10].
3168; fax: þ886 6 2358542.u).
d. All rights reserved.

H.-T. Hu, F.-C. Su / Marine Structures 24 (2011) 319–337320
A concrete-filled double skin tube (CFDST) column with circular cross-section (Fig. 1) consists oftwo concentric steel tubes with concrete filled between the two tubes. The CFDST columns also haveexcellent resistance to seismic [11–15] and are lighter and have more fire resistant than CFT columns[16]. The ultimate strength of a CFDST column is affected by the compressive strength of theconcrete, the concrete confined pressure, the yield strength of the tubes, and the diameter-to-thickness ratios of the inner and outer tubes. It is known that the circular cross-sections have thebest confinement effect [8] and offshore loading resistance [17,18]. Therefore, CFDST columns withcircular cross-section and subjected to axial compressive forces are studied. In this paper, thematerial constitutive models for concrete and steel are proposed. Then nonlinear analyses are carriedout using the finite element program Abaqus [19] and verified against experiment data reported byTao et al. [13] and Zhao et al. [15]. Finally, the effects of the outer-diameter-to-outer-thickness ratio(Do/to) and the inner-diameter-to-inner-thickness ratio (Di/ti) on the confined pressure are studiedand discussed.
2. Material properties and constitutive models
The cross-section of CFDST columns is circular, as shown in Fig. 1. The material constitutive modelsare given below.
2.1. Steel tube
In the numerical analysis, the Poisson’s ratio ns of the steel tube is assumed to be 0.3. For thespecimens of Tao et al. [13], the elastic modulus Es of the steel tubes is assumed to be 200 GPa.For the specimens of Zhao et al. [15], the elastic modulus Es is directly obtained from the experi-mental data. The steel tubes are simulated using an elastic-perfectly plastic model. When the steeltube is subjected to multiple stresses, a von Mises yield criterion F is employed to define the elasticlimit,
F ¼ffiffiffiffiffiffiffi3J2
p¼ 1ffiffiffi
2p
ffiffiffiffiffiffiffiffiffiffiffiffiffiffiffiffiffiffiffiffiffiffiffiffiffiffiffiffiffiffiffiffiffiffiffiffiffiffiffiffiffiffiffiffiffiffiffiffiffiffiffiffiffiffiffiffiffiffiffiffiffiffiffiffiffiffiffiffiffiffiffiffiffiffiðs1 � s2Þ2þðs2 � s3Þ2þðs3 � s1Þ2
q¼ fy (1)
where J2 is the second stress invariant of the stress deviator tensor, s1, s2, and s3 are the principalstresses, and fy is the yield stress of the steel tube. Fig. 2 shows the vonMises yield surface in the three-dimensional principal stress space. The steel tubes behave linearly elastic when the stress points fallinside the yield surface. When stress points reach the yield surface, the steel tubes behave perfectlyplastic and can not resist further loading.
Fig. 1. Cross-section of CFDST columns.
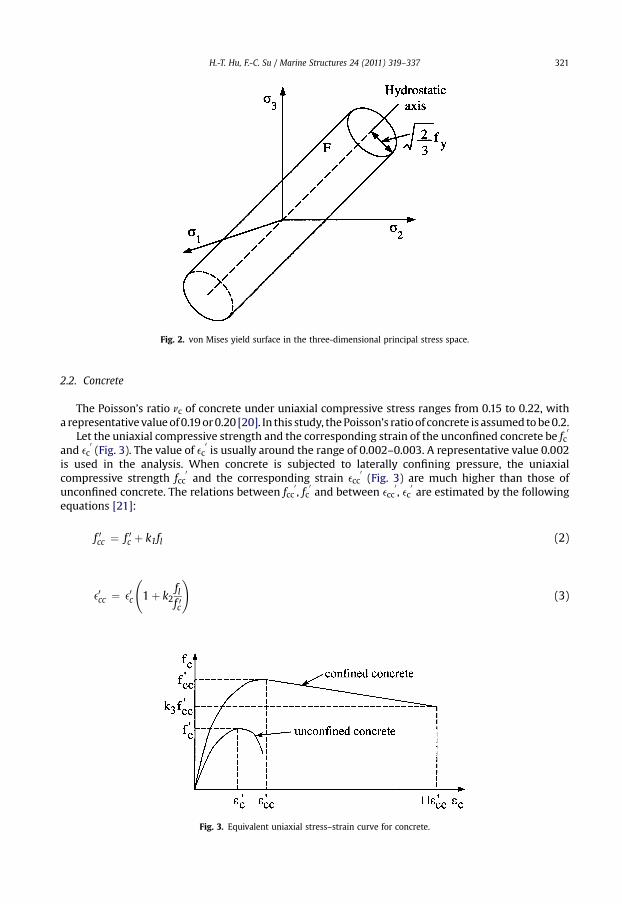
Fig. 2. von Mises yield surface in the three-dimensional principal stress space.
H.-T. Hu, F.-C. Su / Marine Structures 24 (2011) 319–337 321
2.2. Concrete
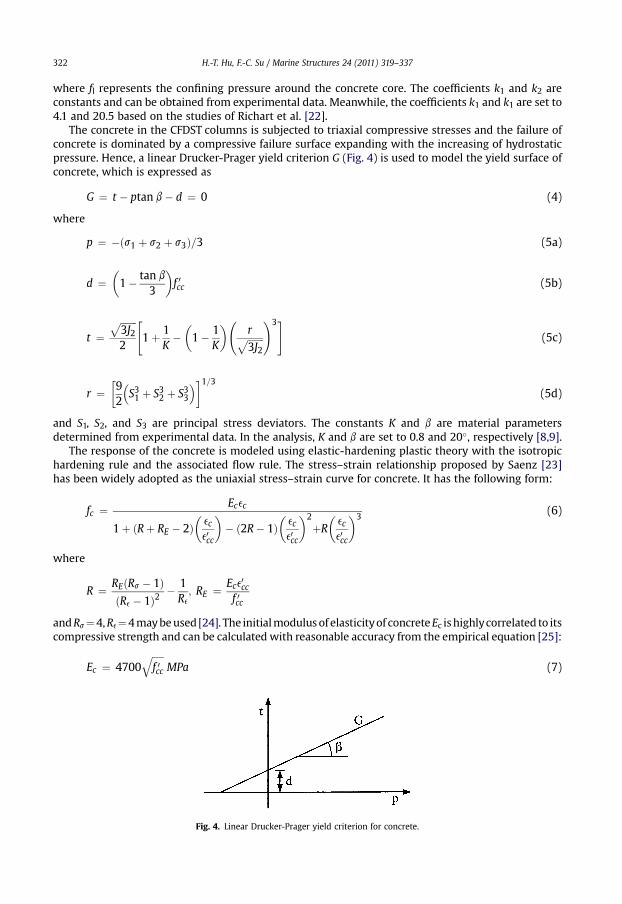
The Poisson’s ratio nc of concrete under uniaxial compressive stress ranges from 0.15 to 0.22, witha representative valueof0.19or0.20 [20]. In this study, thePoisson’s ratioof concrete is assumed tobe0.2.
Let the uniaxial compressive strength and the corresponding strain of the unconfined concrete be fc0
and ec0(Fig. 3). The value of ec
0is usually around the range of 0.002–0.003. A representative value 0.002
is used in the analysis. When concrete is subjected to laterally confining pressure, the uniaxialcompressive strength fcc
0and the corresponding strain ecc
0(Fig. 3) are much higher than those of
unconfined concrete. The relations between fcc0, fc
0and between ecc
0, ec
0are estimated by the following
equations [21]:
f 0cc ¼ f 0c þ k1fl (2)
e0cc ¼ e0c
1þ k2
flf 0c
!(3)
Fig. 3. Equivalent uniaxial stress–strain curve for concrete.
H.-T. Hu, F.-C. Su / Marine Structures 24 (2011) 319–337322
where fl represents the confining pressure around the concrete core. The coefficients k1 and k2 areconstants and can be obtained from experimental data. Meanwhile, the coefficients k1 and k1 are set to4.1 and 20.5 based on the studies of Richart et al. [22].
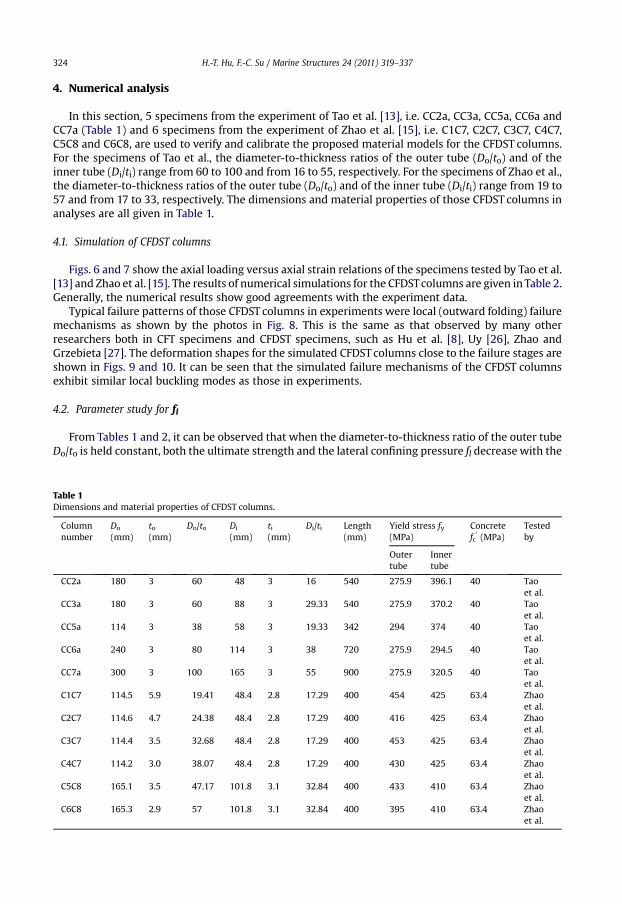
The concrete in the CFDST columns is subjected to triaxial compressive stresses and the failure ofconcrete is dominated by a compressive failure surface expanding with the increasing of hydrostaticpressure. Hence, a linear Drucker-Prager yield criterion G (Fig. 4) is used to model the yield surface ofconcrete, which is expressed as
G ¼ t � ptan b� d ¼ 0 (4)
where
p ¼ �ðs1 þ s2 þ s3Þ=3 (5a)
d ¼�1� tan b
3
�f 0cc (5b)
t ¼ffiffiffiffiffiffiffi3J2
p2
"1þ 1
K��1� 1
K
� rffiffiffiffiffiffiffi3J2
p!3#
(5c)
r ¼�92
�S31 þ S32 þ S33
��1=3(5d)
and S1, S2, and S3 are principal stress deviators. The constants K and b are material parametersdetermined from experimental data. In the analysis, K and b are set to 0.8 and 20�, respectively [8,9].
The response of the concrete is modeled using elastic-hardening plastic theory with the isotropichardening rule and the associated flow rule. The stress–strain relationship proposed by Saenz [23]has been widely adopted as the uniaxial stress–strain curve for concrete. It has the following form:
fc ¼ Ecec
1þ ðRþ RE � 2Þ�ece0cc
�� ð2R� 1Þ
�ece0cc
�2þR�ece0cc
�3 (6)
where
R ¼ REðRs � 1ÞðRe � 1Þ2
� 1Re; RE ¼ Ece0cc
f 0cc
andRs¼4,Re¼4maybeused [24]. The initialmodulus of elasticityof concreteEc ishighlycorrelated to itscompressive strength and can be calculated with reasonable accuracy from the empirical equation [25]:
Ec ¼ 4700ffiffiffiffiffif 0cc
qMPa (7)
Fig. 4. Linear Drucker-Prager yield criterion for concrete.

H.-T. Hu, F.-C. Su / Marine Structures 24 (2011) 319–337 323
In the analysis, Eq. (6) is taken as the equivalent uniaxial stress–strain curve for concrete when theconcrete strain ec is less than ecc
0(Fig. 3). When ec > ecc
0, a linear descending line is used to model the
softening behavior of concrete. If k3 is defined as the material degradation parameter, the descendingline is assumed to be terminated at the point where fc ¼ k3fcc
0and ec ¼ 11ecc
0[8,9].
Generally, the parameters fl and k3 should be provided in order to completely define the equivalentuniaxial stress–strain relationship. These two parameters depend on the diameter-to-thickness ratiosDo/to and Di/ti. Consequently, their values are determined by matching the numerical results withexperimental data via parametric studies.
3. Finite element model for CFDST columns
Due to symmetry, onlyone-half of theCFDSTcolumnsare analyzedanda typicalfinite elementmesh isshown in Fig. 5. Symmetry boundaryconditions are enforced on the symmetric planes,which areu¼0onthe plane normal to the x-axis. The bottom surface of CFDST columns is assumed to be fixed withu ¼ v ¼ w ¼ 0. The uniformly compressive loading is applied to the top surface of the column in thez direction directly. In the finite element mesh, both the concrete and the steel tubes are modeled bya20-node solid element (threedegrees of displacement freedompernode)with reduced integration rule.
There are two interfaces existed in the finite element mesh, which are the concrete to the inner tubeinterface and the concrete to the outer steel tube interface. Both of the interfaces are modeled by pairsof contact surfaces. The nodes on these interfaces are connected through the contact surfaces whichcan model infinitesimal sliding and friction [19] between the concrete and the steel tubes. The frictioncoefficient used in all the analyses is ms ¼ 0.25 [8,9]. As the results, the nodes on the interfaces areallowed to either contact or separate but not to penetrate each other.
Convergent studies of the finite element meshes have been done by the authors using variouselement sizes for CFDST columns. It has been shown that the numerical results are not too sensitive tothe element sizes and mesh refinements. This trend is similar to that of the CFT columns [8,9].
Fig. 5. Finite element mesh for CFDST columns.
H.-T. Hu, F.-C. Su / Marine Structures 24 (2011) 319–337324
4. Numerical analysis
In this section, 5 specimens from the experiment of Tao et al. [13], i.e. CC2a, CC3a, CC5a, CC6a andCC7a (Table 1) and 6 specimens from the experiment of Zhao et al. [15], i.e. C1C7, C2C7, C3C7, C4C7,C5C8 and C6C8, are used to verify and calibrate the proposed material models for the CFDST columns.For the specimens of Tao et al., the diameter-to-thickness ratios of the outer tube (Do/to) and of theinner tube (Di/ti) range from 60 to 100 and from 16 to 55, respectively. For the specimens of Zhao et al.,the diameter-to-thickness ratios of the outer tube (Do/to) and of the inner tube (Di/ti) range from 19 to57 and from 17 to 33, respectively. The dimensions and material properties of those CFDST columns inanalyses are all given in Table 1.
4.1. Simulation of CFDST columns
Figs. 6 and 7 show the axial loading versus axial strain relations of the specimens tested by Tao et al.[13] and Zhao et al. [15]. The results of numerical simulations for the CFDSTcolumns are given in Table 2.Generally, the numerical results show good agreements with the experiment data.
Typical failure patterns of those CFDST columns in experiments were local (outward folding) failuremechanisms as shown by the photos in Fig. 8. This is the same as that observed by many otherresearchers both in CFT specimens and CFDST specimens, such as Hu et al. [8], Uy [26], Zhao andGrzebieta [27]. The deformation shapes for the simulated CFDST columns close to the failure stages areshown in Figs. 9 and 10. It can be seen that the simulated failure mechanisms of the CFDST columnsexhibit similar local buckling modes as those in experiments.
4.2. Parameter study for fl
From Tables 1 and 2, it can be observed that when the diameter-to-thickness ratio of the outer tubeDo/to is held constant, both the ultimate strength and the lateral confining pressure fl decrease with the
Table 1Dimensions and material properties of CFDST columns.
Columnnumber
Do
(mm)to(mm)
Do/to Di
(mm)ti(mm)
Di/ti Length(mm)
Yield stress fy(MPa)
Concretefc
0(MPa)
Testedby
Outertube
Innertube
CC2a 180 3 60 48 3 16 540 275.9 396.1 40 Taoet al.
CC3a 180 3 60 88 3 29.33 540 275.9 370.2 40 Taoet al.
CC5a 114 3 38 58 3 19.33 342 294 374 40 Taoet al.
CC6a 240 3 80 114 3 38 720 275.9 294.5 40 Taoet al.
CC7a 300 3 100 165 3 55 900 275.9 320.5 40 Taoet al.
C1C7 114.5 5.9 19.41 48.4 2.8 17.29 400 454 425 63.4 Zhaoet al.
C2C7 114.6 4.7 24.38 48.4 2.8 17.29 400 416 425 63.4 Zhaoet al.
C3C7 114.4 3.5 32.68 48.4 2.8 17.29 400 453 425 63.4 Zhaoet al.
C4C7 114.2 3.0 38.07 48.4 2.8 17.29 400 430 425 63.4 Zhaoet al.
C5C8 165.1 3.5 47.17 101.8 3.1 32.84 400 433 410 63.4 Zhaoet al.
C6C8 165.3 2.9 57 101.8 3.1 32.84 400 395 410 63.4 Zhaoet al.

Fig. 6. Axial loading–strain relations of the CFDST columns tested by Tao et al.
H.-T. Hu, F.-C. Su / Marine Structures 24 (2011) 319–337 325
increasing of the diameter-to-thickness ratio of the inner tube Di/ti. Similarly, when the diameter-to-thickness ratio of the inner tube Di/ti is held constant, both the ultimate strength and the lateralconfining pressure fl also decreases with the increasing of the diameter-to-thickness ratio of the innertube Do/to. As a result, when the Do/to and the Di/ti ratios are small, the lateral confining pressure flusually has a large value (say 5 MPa for the C1C7 column) and the steel tubes provide strong lateralsupport to the concrete core.

Fig. 7. Axial loading–strain relations of the CFDST columns tested by Zhao et al.
H.-T. Hu, F.-C. Su / Marine Structures 24 (2011) 319–337326
Regression analyses of the multivariate statistics method [28,29] are applied to the numericalresults of CFDST to fit a surface through the lateral confining pressure fl. The following three equationsare proposed for fl:
fl ¼ a1 þ a2ðDo=toÞ þ a3ðDi=tiÞ þ a4ðDo=toÞ2þa5ðDo=toÞðDi=tiÞ þ a6ðDi=tiÞ2 (8a)
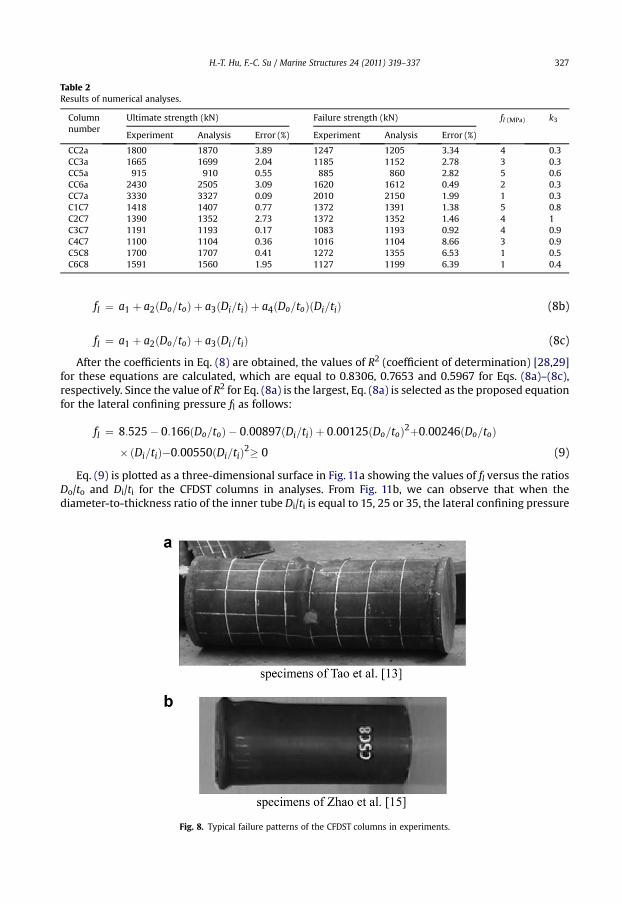
Table 2Results of numerical analyses.
Columnnumber
Ultimate strength (kN) Failure strength (kN) fl (MPa) k3
Experiment Analysis Error (%) Experiment Analysis Error (%)
CC2a 1800 1870 3.89 1247 1205 3.34 4 0.3CC3a 1665 1699 2.04 1185 1152 2.78 3 0.3CC5a 915 910 0.55 885 860 2.82 5 0.6CC6a 2430 2505 3.09 1620 1612 0.49 2 0.3CC7a 3330 3327 0.09 2010 2150 1.99 1 0.3C1C7 1418 1407 0.77 1372 1391 1.38 5 0.8C2C7 1390 1352 2.73 1372 1352 1.46 4 1C3C7 1191 1193 0.17 1083 1193 0.92 4 0.9C4C7 1100 1104 0.36 1016 1104 8.66 3 0.9C5C8 1700 1707 0.41 1272 1355 6.53 1 0.5C6C8 1591 1560 1.95 1127 1199 6.39 1 0.4
H.-T. Hu, F.-C. Su / Marine Structures 24 (2011) 319–337 327
fl ¼ a1 þ a2ðDo=toÞ þ a3ðDi=tiÞ þ a4ðDo=toÞðDi=tiÞ (8b)
fl ¼ a1 þ a2ðDo=toÞ þ a3ðDi=tiÞ (8c)
After the coefficients in Eq. (8) are obtained, the values of R2 (coefficient of determination) [28,29]for these equations are calculated, which are equal to 0.8306, 0.7653 and 0.5967 for Eqs. (8a)–(8c),respectively. Since the value of R2 for Eq. (8a) is the largest, Eq. (8a) is selected as the proposed equationfor the lateral confining pressure fl as follows:
fl ¼ 8:525� 0:166ðDo=toÞ � 0:00897ðDi=tiÞ þ 0:00125ðDo=toÞ2þ0:00246ðDo=toÞ� ðDi=tiÞ�0:00550ðDi=tiÞ2� 0 (9)
Eq. (9) is plotted as a three-dimensional surface in Fig. 11a showing the values of fl versus the ratiosDo/to and Di/ti for the CFDST columns in analyses. From Fig. 11b, we can observe that when thediameter-to-thickness ratio of the inner tube Di/ti is equal to 15, 25 or 35, the lateral confining pressure
Fig. 8. Typical failure patterns of the CFDST columns in experiments.
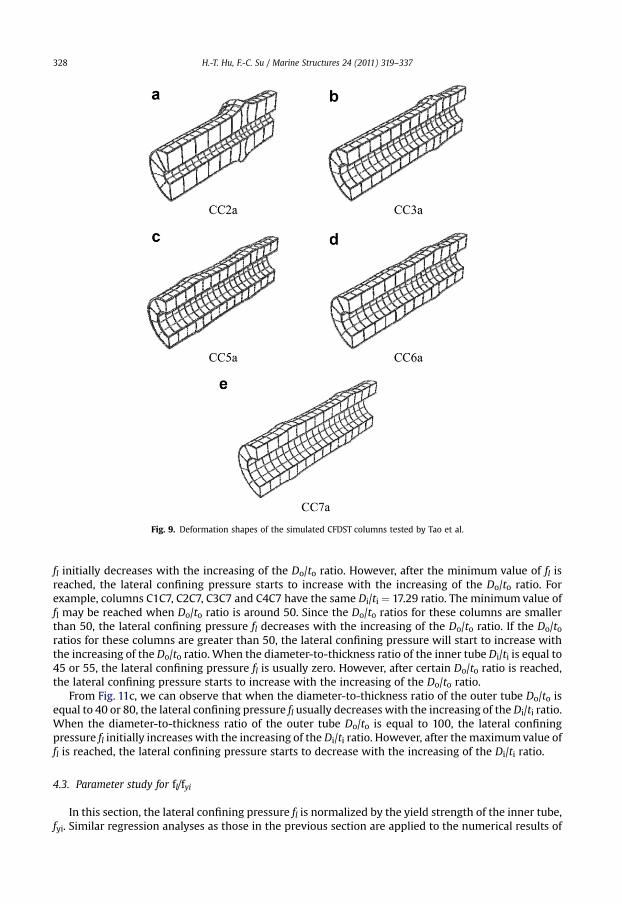
Fig. 9. Deformation shapes of the simulated CFDST columns tested by Tao et al.
H.-T. Hu, F.-C. Su / Marine Structures 24 (2011) 319–337328
fl initially decreases with the increasing of the Do/to ratio. However, after the minimum value of fl isreached, the lateral confining pressure starts to increase with the increasing of the Do/to ratio. Forexample, columns C1C7, C2C7, C3C7 and C4C7 have the same Di/ti ¼ 17.29 ratio. The minimum value offl may be reached when Do/to ratio is around 50. Since the Do/to ratios for these columns are smallerthan 50, the lateral confining pressure fl decreases with the increasing of the Do/to ratio. If the Do/toratios for these columns are greater than 50, the lateral confining pressure will start to increase withthe increasing of the Do/to ratio. When the diameter-to-thickness ratio of the inner tube Di/ti is equal to45 or 55, the lateral confining pressure fl is usually zero. However, after certain Do/to ratio is reached,the lateral confining pressure starts to increase with the increasing of the Do/to ratio.
From Fig. 11c, we can observe that when the diameter-to-thickness ratio of the outer tube Do/to isequal to 40 or 80, the lateral confining pressure fl usually decreases with the increasing of the Di/ti ratio.When the diameter-to-thickness ratio of the outer tube Do/to is equal to 100, the lateral confiningpressure fl initially increases with the increasing of the Di/ti ratio. However, after the maximumvalue offl is reached, the lateral confining pressure starts to decrease with the increasing of the Di/ti ratio.
4.3. Parameter study for fl/fyi
In this section, the lateral confining pressure fl is normalized by the yield strength of the inner tube,fyi. Similar regression analyses as those in the previous section are applied to the numerical results of

Fig. 10. Deformation shapes of the simulated CFDST columns tested by Zhao et al.
H.-T. Hu, F.-C. Su / Marine Structures 24 (2011) 319–337 329
CFDST to fit a surface through the normalized value of fl/fyi. The values of R2 for Eqs. (8a)–(8c) with flreplaced by fl/fyi are 0.6985, 0.5677 and 0.4501, respectively. Since the largest value of R2 is 0.6985, theproposed equation for the normalized value of fl/fyi is given as follows:
fl=fyi ¼ 0:01844� 0:00055ðDo=toÞ þ 0:00040ðDi=tiÞ þ 0:00001ðDo=toÞ2þ0:00001ðDo=toÞ� ðDi=tiÞ � 0:00002ðDi=tiÞ2
(10)
Fig. 12 shows the values of fl/fyi versus Do/to and Di/ti for the CFDST columns in analyses. It can beseen that it shows the similar trend as that in Fig. 11.
4.4. Parameter study for fl/fyo
In this section, the lateral confining pressure fl is normalized by the yield strength of the outer tube,fyo. Similar regression analyses as those in the previous sections are applied to the numerical results ofCFDST to fit a surface through the normalized value of fl/fyo. The values of R2 for Eqs. (8a)–(8c) with fl

Fig. 11. fl versus Do/to and Di/ti for CFDST columns.
H.-T. Hu, F.-C. Su / Marine Structures 24 (2011) 319–337330
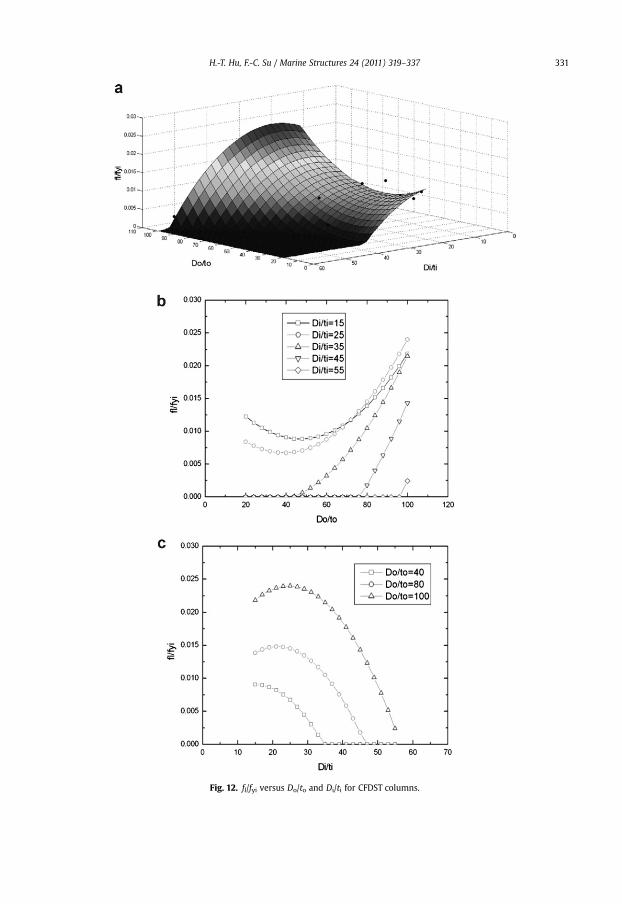
Fig. 12. fl/fyi versus Do/to and Di/ti for CFDST columns.
H.-T. Hu, F.-C. Su / Marine Structures 24 (2011) 319–337 331

H.-T. Hu, F.-C. Su / Marine Structures 24 (2011) 319–337332
replaced by fl/fyo are 0.5397, 0.4702 and 0.4332, respectively. Since the largest value of R2 is 0.5397, theproposed equation for the normalized value of fl/fyo is given as follows:
fl=fyo ¼ 0:01791� 0:00036ðDo=toÞ � 0:00013ðDi=tiÞ þ 0:00001ðDo=toÞ2þ0:00001ðDo=toÞ� ðDi=tiÞ � 0:00002ðDi=tiÞ2� 0
(11)
Fig. 13 shows the values of fl/fyo versus Do/to and Di/ti for the CFDST columns in analyses and itexhibits the similar trend as that in Fig. 11.
In this paper, three equations, i.e. Eqs. (9)–(11), are proposed to predict the lateral confiningpressure fl for the CFDST columns. For practical engineering application, the minimum value of flpredicted by these three equations could be used.
4.5. Parameter study for k3
The material degradation parameter k3 is used to model the behavior of concrete beyond theultimate strength. It should be noted that the value of k3 varies between 0 and 1. Similar regressionanalyses as those in the previous sections are applied to the numerical results of CFDST to fit a surfacethrough the value of k3. The values of R2 for Eqs. (8a)–(8c) with fl replaced by k3 are 0.8961, 0.8562 and0.7200, respectively. Since the largest value of R2 is 0.8961, the proposed equation for the materialdegradation parameter k3 is given as follows:
k3 ¼ 1:73916� 0:00862ðDo=toÞ � 0:04731ðDi=tiÞ � 0:00036ðDo=toÞ2þ0:00134ðDo=toÞðDi=tiÞ� 0:00058ðDi=tiÞ2� 0
(12)
Fig. 14 shows the values of k3 versus Do/to and Di/ti for the CFDST columns. It can be observed thatthe surface of k3 has a saddle shape (Fig. 14a). When the Do/to and the Di/ti ratios are small, the materialdegradation parameter k3 usually has a large value.
5. Comparison between the proposed design formulations with the AISC formulations
In this section, the relevant design formulations according to AISC specification [30] are modifiedslightly. The calculated axial ultimate strengths of CFDST columns based on the AISC formulations andthe proposed formulations are compared to the experimental data.
According to the AISC specification [30], the axial ultimate strength Pn of CFDST column can beobtained using the following expressions:
Pn ¼ Poh0:658ðPo=PeÞ
iwhen Pe � 0:44Po (13a)
Pn ¼ 0:877Pe; when Pe < 0:44Po (13b)
where
Po ¼ Asfy þ C2Acf 0c (14)
C2 ¼ 0:85 for rectangular cross sections (15a)
C2 ¼ 0:95 for circular cross sections (15b)

Fig. 13. fl/fyo versus Do/to and Di/ti for CFDST columns.
H.-T. Hu, F.-C. Su / Marine Structures 24 (2011) 319–337 333

Fig. 14. k3 versus Do/to and Di/ti for CFDST columns.
H.-T. Hu, F.-C. Su / Marine Structures 24 (2011) 319–337334

H.-T. Hu, F.-C. Su / Marine Structures 24 (2011) 319–337 335
Pe ¼ p2
ðKLÞ2ðEsIs þ C3EcIcÞ (16)
C3 ¼ 0:6þ 2�
As
As þ Ac
�� 0:9 (17)
In the above equations, As and Ac are the cross-section areas of steel tubes and concrete, respec-tively. L is the laterally unbraced length of the CFDST column. The constant K is the effective lengthfactor and is equal to 2 for the CFDST columns in this investigation. Is and Ic are the moments of inertiaof steel tubes and concrete, respectively. The values of As, Ac, Is and Ic can be calculated using thefollowing expressions.
As ¼ p
4
hD2o � ðDo � 2toÞ2þD2
i � ðDi � 2tiÞ2i
(18a)
Ac ¼ p
4
hðDo � 2toÞ2�D2
i
i(18b)
Is ¼ p
64
hD4o � ðDo � 2toÞ4þD4
i � ðDi � 2tiÞ4i
(19a)
Ic ¼ p
64
hðDo � 2toÞ4�D4
i
i(19b)
In Eq. (16), the modulus of elasticity of steel Es is equal to 200 GPa for the CFDST columns in thisinvestigation. The modulus of elasticity of concrete Ec can be calculated as [25]
Ec ¼ 0:043w1:5c
ffiffiffiffif 0c
qMPa (20)
where wc is the density of concrete. For normal-weight concrete, it may be assumed thatwc ¼ 2400 kg/m3.
For the formulations proposed by the authors to calculate the ultimate strengths of the CFDSTcolumns, only Eqs. (14) and (20) are slightly modified by replacing the compressive strength ofconcrete fc
0with the confined compressive strength of concrete fcc
0. The rest formulations are the same
as those in AISC specification. The two modified Eqs. become
Po ¼ Asfy þ C2Acf 0cc (21)
Ec ¼ 0:043w1:5c
ffiffiffiffiffif 0cc
qMPa (22)
The value of fcc0can be obtained from Eq. (2), which is listed below.
f 0cc ¼ f 0c þ k1fl
In the above expression, k1 is equal to 4.1 and the value of the lateral confining pressure fl is theminimum value obtained by Eqs. (9)–(11). Table 3 shows the parameters used to calculate the ultimatestrengths of the CFDST columns. Table 4 shows the ultimate strengths of the CFDST columns calculatedby the AISC formulations and the proposed formulations. It can be observed that the proposedformulations are better than the AISC formulations. For some specimens (say CC2a and CC6a), the errorpercentages are reduced significantly.

Table 3Parameters for calculating the ultimate strengths of CFDST columns.
Columnnumber
C3 fl (MPa) fc0(MPa) fcc
0(MPa) Ec (MPa) Pe (kN) 0.44Po (kN)
0:043w1:5c
ffiffiffiffif 0c
p0:043w1:5
cffiffiffiffiffiffif 0cc
pAISC Proposed AISC Proposed
CC2a 0.77 3.8 40 55.8 31,975 37,758 9379 11,073 621 766CC3a 0.84 2.3 40 49.3 31,975 35,516 9626 10,690 596 665CC5a 0.99 2.8 40 51.6 31,975 36,325 3725 4231 311 343CC6a 0.78 2.0 40 48.2 31,975 35,100 16,543 18,157 947 1059CC7a 0.77 0.8 40 43.2 31,975 33,224 24,807 25,774 1303 1365C1C7 1.15 5.0 63.4 83.8 40,256 46,287 2910 3345 622 677C2C7 1.06 4.0 63.4 79.8 40,256 45,163 3217 3608 552 599C3C7 0.97 4.0 63.4 79.8 40,256 45,163 3505 3931 494 544C4C7 0.93 3.0 63.4 75.7 40,256 43,988 3614 3949 466 504C5C8 0.98 1.0 63.4 67.3 40,256 41,475 14,212 14,642 799 817C6C8 0.94 1.0 63.4 67.5 40,256 41,537 14,824 15,296 738 758
Table 4Ultimate strengths of CFDST columns calculated by the AISC formulations and the proposed formulations.
Columnnumber
Ultimate strength (kN) Error (%)
Experiment AISC Proposed AISC Proposed
CC2a 1800 1334 1641 �25.89 �8.85CC3a 1665 1284 1432 �22.91 �13.98CC5a 915 659 727 �28.02 �20.53CC6a 2430 2048 2289 �15.72 �5.80CC7a 3330 2830 2963 �15.02 �11.01C1C7 1418 1177 1293 �17.02 �8.80C2C7 1390 1083 1180 �22.12 �15.09C3C7 1191 995 1097 �16.44 �7.86C4C7 1100 948 1026 �13.84 �6.74C5C8 1700 1729 1770 1.72 4.14C6C8 1591 1607 1652 1.01 3.80
H.-T. Hu, F.-C. Su / Marine Structures 24 (2011) 319–337336
6. Conclusion
In this paper, nonlinear finite element analysis was conducted for CFDST columns. Based on thenumerical results, the following conclusions were obtained:
(1) When the diameter-to-thickness ratio of the outer tube Do/to is held constant, both the ultimatestrength and the lateral confining pressure fl decrease with the increasing of the diameter-to-thickness ratio of the inner tube Di/ti. Similarly, when the diameter-to-thickness ratio of theinner tube Di/ti is held constant, both the ultimate strength and the lateral confining pressure fl alsodecreases with the increasing of the diameter-to-thickness ratio of the outer tube Do/to.
(2) Double skin concrete-filled tubes can provide a good confining effect for concrete, especially whenthe diameter-to-thickness ratios of the outer and inner tubes (Do/to, Di/ti) are small.
(3) For practical engineering application, the minimum value of fl predicted by equations (9)–(11)could be used.
(4) When the Do/to and the Di/ti ratios are small, the material degradation parameter k3 usually hasa large value. The value of k3 might be predicted by Eq. (12).
(5) Based on the experiment data, the proposed design equations are applicable to the CFDST columnswith the diameter to thickness ratios fallen in the ranges 20� Do/to � 100 and 16� Di/ti � 55. Suchranges of diameter to thickness ratios are ordinary for engineering applications.
(6) The comparison of the proposed formulations with the AISC formulations against the experimentaldata shows that the proposed formulations are better than the AISC formulations. For somespecimens (say CC2a and CC6a), the error percentages are reduced significantly.

H.-T. Hu, F.-C. Su / Marine Structures 24 (2011) 319–337 337
References
[1] Ge HB, Usami T. Strength of concrete-filled thin-walled steel box columns: experiment. Journal of Structural Engineering,ASCE 1992;118(1):3036–54.
[2] Boyd FP, Cofer WF, McLean D. Seismic performance of steel-encased concrete column under flexural loading. ACI StructuralJournal 1995;92(3):355–65.
[3] Bradford MA. Design strength of slender concrete-filled rectangular steel tubes. ACI Structural Journal 1996;93(2):229–35.[4] Schneider SP. Axial loaded concrete-filled steel tubes. Journal of Structural Engineering, ASCE 1998;124(10):1125–38.[5] Roeder CW, Cameron B, Brown CB. Composite action in concrete filled tubes. Journal of Structural Engineering, ASCE 1999;
125(5):477–84.[6] Huang C-S, Yeh Y-K, Liu G-Y, Hu H-T, Tsai KC, Weng YT, et al. Axial load behavior of stiffened concrete-filled steel columns.
Journal of Structural Engineering, ASCE 2002;128(9):1222–30.[7] Elchalakani M, Zhao XL, Grzebieta RH. Plastic mechanism analysis of circular tubes under pure bending. International
Journal of Mechanical Sciences 2002;44(6):1117–43.[8] Hu H-T, Huang CS, Wu M-H, Wu Y-M. Nonlinear analysis of axially loaded CFT columns with confinement effect. Journal of
Structural Engineering, ASCE 2003;129(10):1322–9.[9] Hu H-T, Huang CS, Chen ZL. Finite element analysis of CFT columns subjected to combined axial force and bending
moment. Journal of Constructional Steel Research 2005;61(12):1692–712.[10] Lu FW, Li SP, Sun G. A study on the behavior of eccentrically compressed square concrete-filled steel tube columns. Journal
of Constructional Steel Research 2007;63(7):941–8.[11] Lin ML, Tsai KC. Behavior of double-skinned composite steel tubular columns subjected to combined axial and flexural
loads. In: Proceedings of the first international conference on steel and composite structures, Pusan, Korea, June 14–16,2001, pp. 1145–52.
[12] Han L-H, Huang H, Tao Z, Zhao XL. Concrete-filled double skin steel tubular (CFDST) columns subjected to cyclic bending.Engineering Structures 2006;29(12):1698–714.
[13] Tao Z, Han LH, Zhao XL. Behaviour of concrete-filled double skin (CHS inner and CHS outer) steel tubular stub columns andbeam-columns. Journal of Constructional Steel Research 2004;60(8):1129–58.
[14] Wei S, Mau ST, Vipulanandan C, Mantrala SK. Performance of new sandwich tube under axial loading: experiment. Journalof Structural Engineering, ASCE 1995;121(12):1806–14.
[15] Zhao XL, Grzebieta RH, Elchalakani M. Tests of concrete-filled double skin CHS composite stub columns. Steel andComposite Structures 2002;2(2):129–46.
[16] Han LH, Xu L, Zhao XL. Tests and analysis on the temperature field within concrete-filled steel tubes with or withoutprotection subjected to a standard fire. Advances in Structural Engineering 2003;6(2):121–33.
[17] Dawson TH. Offshore structural engineering. Prentice-Hall Inc.; 1983.[18] Sumer BM, Fredsoe J. Hydrodynamics around cylindrical structures. World Scientific; 1997.[19] Abaqus. Analysis user’s manuals and example problems manuals, version 6.9. Providence, Rhode Island: Abaqus, Inc.;
2009.[20] ASCE Task Committee on Concrete and Masonry Structure. State of the art report on finite element analysis of reinforced
concrete. New York: ASCE; 1982.[21] Mander JB, Priestley MJN, Park R. Theoretical stress-strain model for confined concrete. Journal of Structural Engineering,
ASCE 1988;114(8):1804–23.[22] Richart FE, Brandtzaeg A, Brown RL. A study of the Failure of Concrete under Combined Compressive Stresses Bulletin, vol.
185. Champaign, Illinois: University of Illinois Engineering Experimental Station; 1928.[23] Saenz LP. Discussion of “Equation for the stress-strain curve of concrete” by Desayi P, Krishnan S. ACI Journal 1964;61:
1229–35.[24] Hu HT, Schnobrich WC. Constitutive modelling of concrete by using nonassociated plasticity. Journal of Materials in Civil
Engineering, ASCE 1989;1(4):199–216.[25] ACI Committee 318. Building code requirements for structural concrete and commentary (ACI 318-08). Detroit, Michigan:
American Concrete Institute; 2008.[26] Uy B. Local and post-local buckling of concrete filled steel welded box columns. Journal of Constructional Steel Research
1998;47(1–2):47–72.[27] Zhao XL, Grzebieta RH. Strength and ductility of concrete filled double skin (SHS inner and SHS outer) tubes. Thin-Walled
Structures 2002;40(2):199–213.[28] Lancaster P, Salkauskas K. Curve and surface fitting: an introduction. Academic Press; 1986.[29] Tabachnick BG, Fidell LS. Using multivariate statistics. 5th ed. Allyn and Bacon; 2006.[30] AISC Committee on Specifications. Specification for structural steel buildings, ANSI/AISC 360-05. Chicago: American
Institute of Steel Construction; 2005.


