Http:// Terrence E. Zavecz [email protected] Weir TR Temporal and Sequential Data Analysis and...
41
http://www.TEAsystems.com Terrence E. Zavecz [email protected] Weir TR Temporal and Sequential Data Analysis and Performance Matching Interfaces of Thermal, Probe and CD Uniformity data Data Loading speed increase 5x to 8x Improved wafer modeling Improved intra-site data interpolation Wafer-Contour plot speed improvement 12x to 20x Improvements with Release 2.0
-
date post
19-Dec-2015 -
Category
Documents
-
view
214 -
download
0
Transcript of Http:// Terrence E. Zavecz [email protected] Weir TR Temporal and Sequential Data Analysis and...
http://www.TEAsystems.com
Terrence E. Zavecz [email protected]
Weir TRTemporal and Sequential Data Analysis and Performance Matching Interfaces ofThermal, Probe and CD Uniformity data
Data Loading speed increase 5x to 8x Improved wafer modeling Improved intra-site data interpolation Wafer-Contour plot speed improvement 12x to 20x
Improvements with Release 2.0

http://www.TEAsystems.com - 2Yield Enhancement thru ModelingTEA SystemsTEA Systems
Product Features Weir TR Sequence & Weir TR Matching
o Requires Weir TR version 2.0 or later.o Product has two interfaces
Weir TR; Sequence AnalysisTime dependent analysis of Temperature or
any metrology variableDerives critical phase elements of the cycle
Weir TR: MatchingTwo dataset/system matching of
Thermal-to-Thermal Thermal-to-Metrology Metrology-to-Metrology
Can use Weir TR Temporal Analysis calculated variablesExample:
Cumulative-Energy vs feature sizeMatch any metrology, probe or sequence data
Weir TRRange response by sensor over time
Weir TR: MatchingTemperature-to-BCD Feature

http://www.TEAsystems.com - 3Yield Enhancement thru ModelingTEA SystemsTEA Systems
Weir TR Time Response Analysis Data sources
Accept sequenced or time based data from any metrology source
Clean-Track, Develop & In-line Data
Scanner log and metrology
Metrology & Probe Data
CD-SEM and Scatter
Wafer & Substrate Sensor
Weir PW Process Derived Analyses &
Variables
http://www.TEAsystems.com - 4Yield Enhancement thru ModelingTEA SystemsTEA Systems
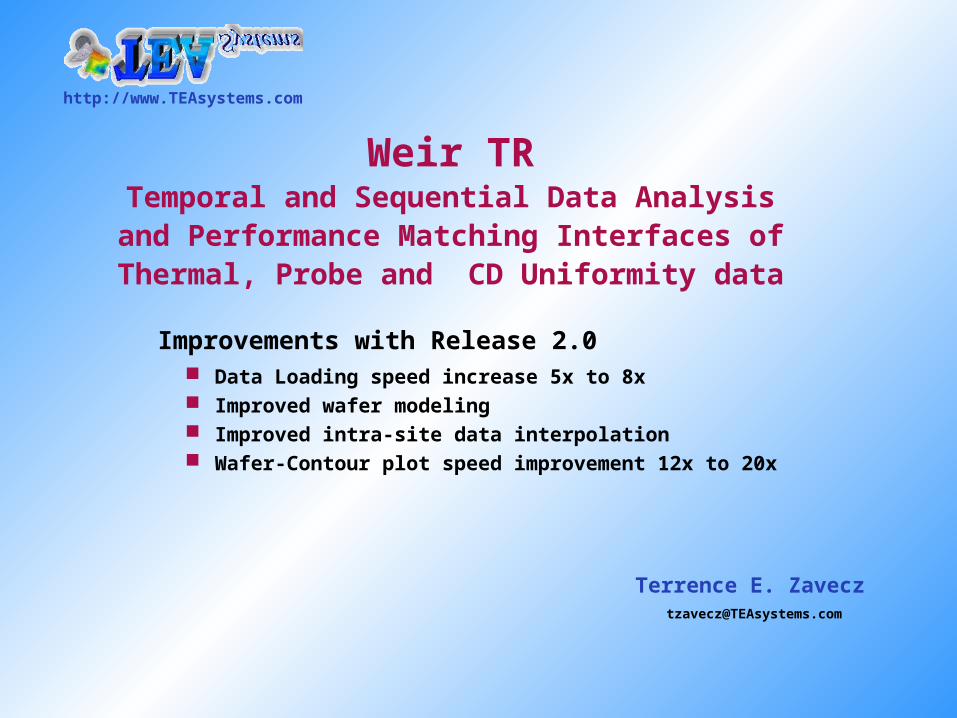
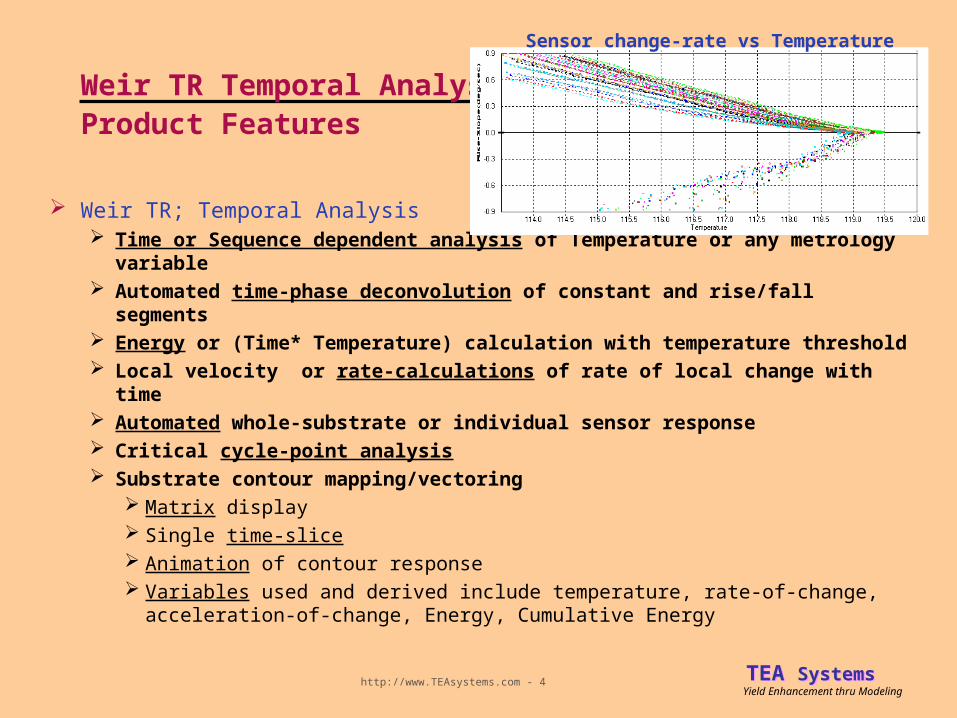
Weir TR Temporal AnalysisProduct Features
Weir TR; Temporal Analysis Time or Sequence dependent analysis of Temperature or any metrology variable Automated time-phase deconvolution of constant and rise/fall segments Energy or (Time* Temperature) calculation with temperature threshold Local velocity or rate-calculations of rate of local change with time Automated whole-substrate or individual sensor response Critical cycle-point analysis Substrate contour mapping/vectoring
Matrix display Single time-slice Animation of contour response Variables used and derived include temperature, rate-of-change, acceleration-of-
change, Energy, Cumulative Energy
Sensor change-rate vs Temperature

http://www.TEAsystems.com - 5Yield Enhancement thru ModelingTEA SystemsTEA Systems
Thermal response ranges
Displays variation at each sensor relative to average temperature of wafer

http://www.TEAsystems.com - 6Yield Enhancement thru ModelingTEA SystemsTEA Systems
Average times for each phase
Data is saved in Weir Data Workbook
Phase Period Type TimeStart TimeEnd TimeDelta TempStart TempEnd TempDelta Energy (deg*sec) Ramp (deg/sec)1 Constant 10.0 1063.1 1053.1 319.8 279.5 -40.3 2.740E+05 -0.04032 Constant 1078.1 1223.4 145.3 280.0 282.0 2.0 4.090E+04 0.01563 Rise 1238.4 1396.9 158.4 285.3 340.3 55.0 5.120E+04 0.35244 Constant 1411.9 1905.0 493.1 340.7 341.7 1.1 1.680E+05 0.00275 Rise 1920.0 2053.4 133.4 344.5 381.6 37.1 4.960E+04 0.28606 Constant 2068.4 2275.0 206.6 381.3 379.5 -1.8 7.850E+04 -0.00957 Rise 2290.0 2380.3 90.3 383.3 395.1 11.9 3.540E+04 0.15758 Constant 2395.3 2560.0 164.7 395.1 394.5 -0.7 6.500E+04 -0.0036

http://www.TEAsystems.com - 7Yield Enhancement thru ModelingTEA SystemsTEA Systems
Automated Phase Deconvolution
Statistics show four thresholds which are plotted as yellow-filled squares.
Range of data across wafer @ time is plotted by blue circles
Max Temp
Min Temp
Phase change
Range

http://www.TEAsystems.com - 8Yield Enhancement thru ModelingTEA SystemsTEA Systems
Critical phase evaluation by sensor point
Customize the sampling or graphic to zoom-in on time/sequence critical segments
http://www.TEAsystems.com - 9Yield Enhancement thru ModelingTEA SystemsTEA Systems
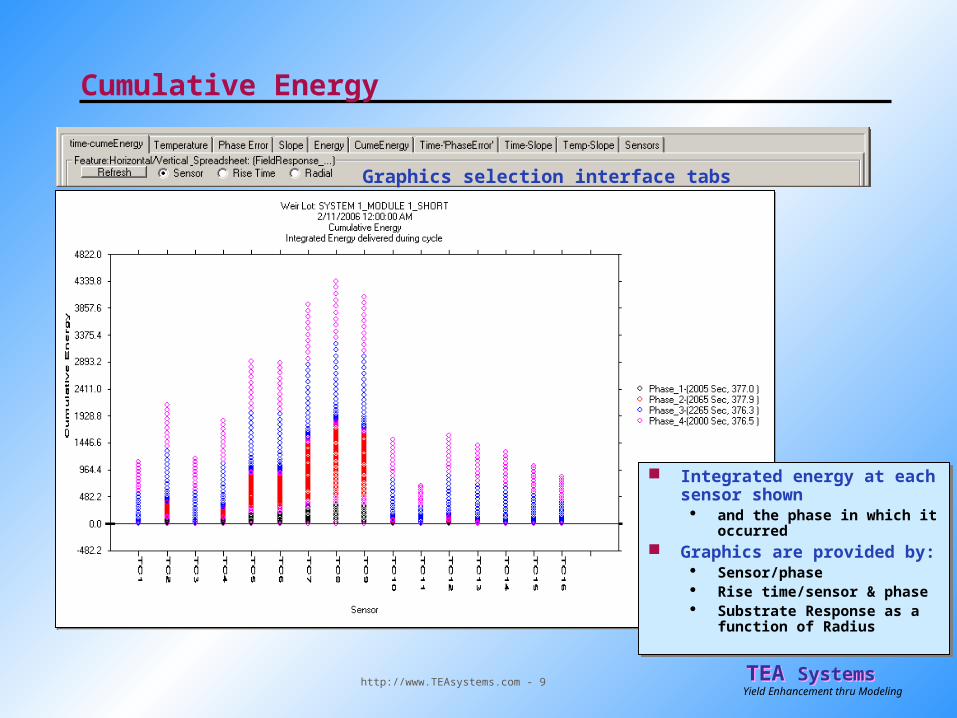
Cumulative Energy
Integrated energy at each sensor shown and the phase in which it
occurred Graphics are provided by:
Sensor/phase Rise time/sensor & phase Substrate Response as a
function of Radius
Integrated energy at each sensor shown and the phase in which it
occurred Graphics are provided by:
Sensor/phase Rise time/sensor & phase Substrate Response as a
function of Radius
Graphics selection interface tabs

http://www.TEAsystems.com - 10Yield Enhancement thru ModelingTEA SystemsTEA Systems
Temperature Mean, Rise, Phase Length, Start Value
http://www.TEAsystems.com - 11Yield Enhancement thru ModelingTEA SystemsTEA Systems
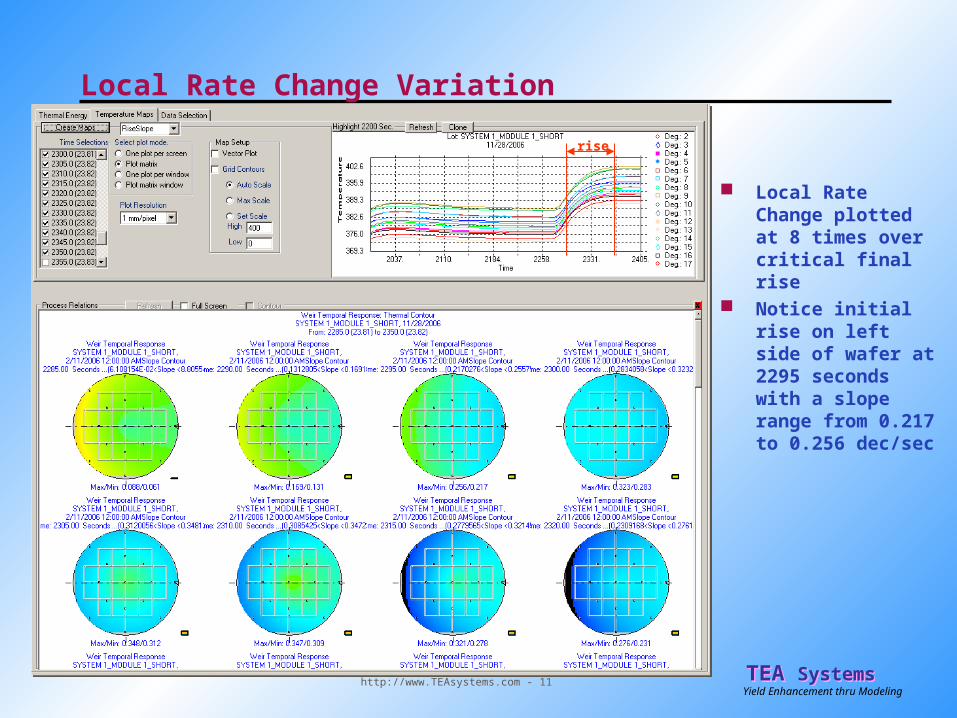
Local Rate Change Variation
Local Rate Change plotted at 8 times over critical final rise
Notice initial rise on left side of wafer at 2295 seconds with a slope range from 0.217 to 0.256 dec/sec
rise

http://www.TEAsystems.com - 12Yield Enhancement thru ModelingTEA SystemsTEA Systems
Vector/Contour mapping of user selected time-slices
Three vector plots of accumulated energy
http://www.TEAsystems.com - 13Yield Enhancement thru ModelingTEA SystemsTEA Systems
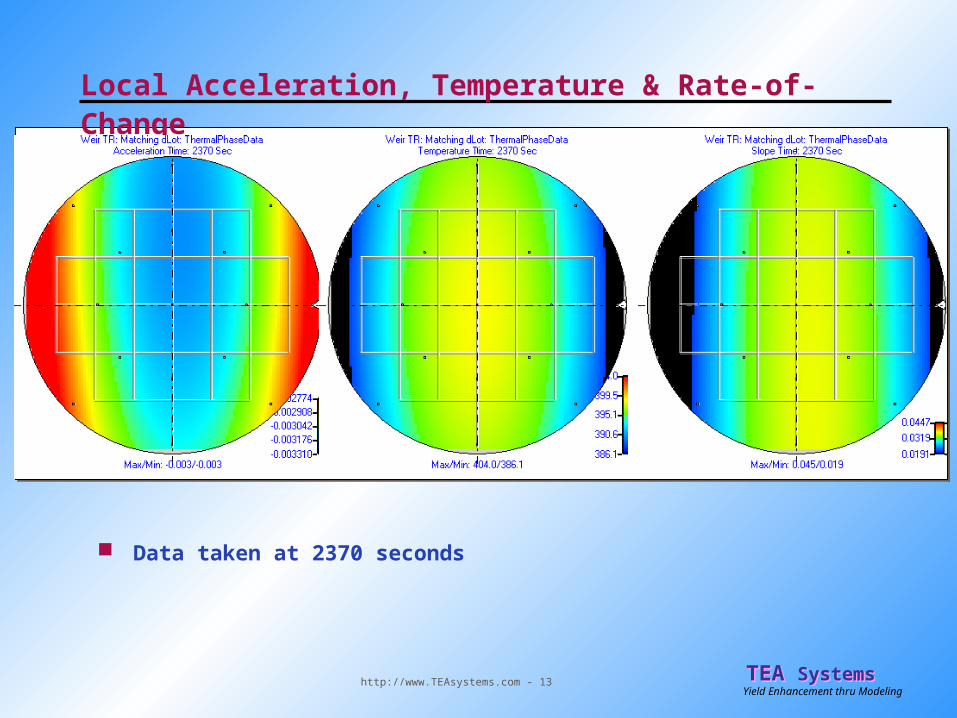
Local Acceleration, Temperature & Rate-of-Change
Data taken at 2370 seconds

http://www.TEAsystems.com - 14Yield Enhancement thru ModelingTEA SystemsTEA Systems
Localized Rise/Fall Plot vs Variable
Details process-critical response to any variable such as temperature
Raw Temp vs Time Cycle
Mouse-zoomed response at critical
settling point

http://www.TEAsystems.com - 15Yield Enhancement thru ModelingTEA SystemsTEA Systems
Threshold Analysis data
Data from the “RiseTimesPhase” worksheet for 16 sensors Transition points are marked on the thermal curve as black squares with a yellow center (previous slide) Data stored on Weir TR Spreadsheet in data workbook
Temperature variation

http://www.TEAsystems.com - 16Yield Enhancement thru ModelingTEA SystemsTEA Systems
Separate window display of Thermal variation
Matrix view Animation also
provided

http://www.TEAsystems.com - 17Yield Enhancement thru ModelingTEA SystemsTEA Systems
Weir TR MatchingProduct Features
Weir TR; Matching Match any two Temporal/Metrology/Log sources Match Bake, Temperature,Cumulative Energy ,
Process etc uniformity Infinitely-Variable Rotation and Notch Alignment
Controls Features Includes:
Automated data culling Histograms, contour, vector, XY, etc plots. Individual time-slice or integrated analysis Model across-wafer variation User-customized graphics Easy plot/copy into reports/html interfaces Reports and data stored in standardized workbook
format
Across-Wafer ModeledBottom CD Variation
Across two Bake Plates
(Scatter data)

http://www.TEAsystems.com - 18Yield Enhancement thru ModelingTEA SystemsTEA Systems
Weir TR Time Response Analysis Data sources
Any metrology, sequenced or log based data
Clean-Track, Develop & In-line Data
Scanner log and metrology
Metrology & Probe Data
CD-SEM and Scatter
Wafer & Substrate Sensor
Weir PW Process Derived Analyses &
Variables
Weir TR Temporal Analysis Variables

http://www.TEAsystems.com - 19Yield Enhancement thru ModelingTEA SystemsTEA Systems
Basic Operation of Weir TR Matching
Wafers from two separate bake plates shown
Provides a basic visual & statistical match comparison
Covariance matching over time/space
Compare static or sequential data For example; Bottom
CD to Temperature or Cumulative Energy on the substrate

http://www.TEAsystems.com - 20Yield Enhancement thru ModelingTEA SystemsTEA Systems
Variable Culling
BCD based culling removed 309 data points to properly display wafer-graphic shown on left
Easily removed Intra-Field variation and improves accuracy
Original BCD data distribution
Command used to generate histogram
And then apply the wafer model
http://www.TEAsystems.com - 21Yield Enhancement thru ModelingTEA SystemsTEA Systems
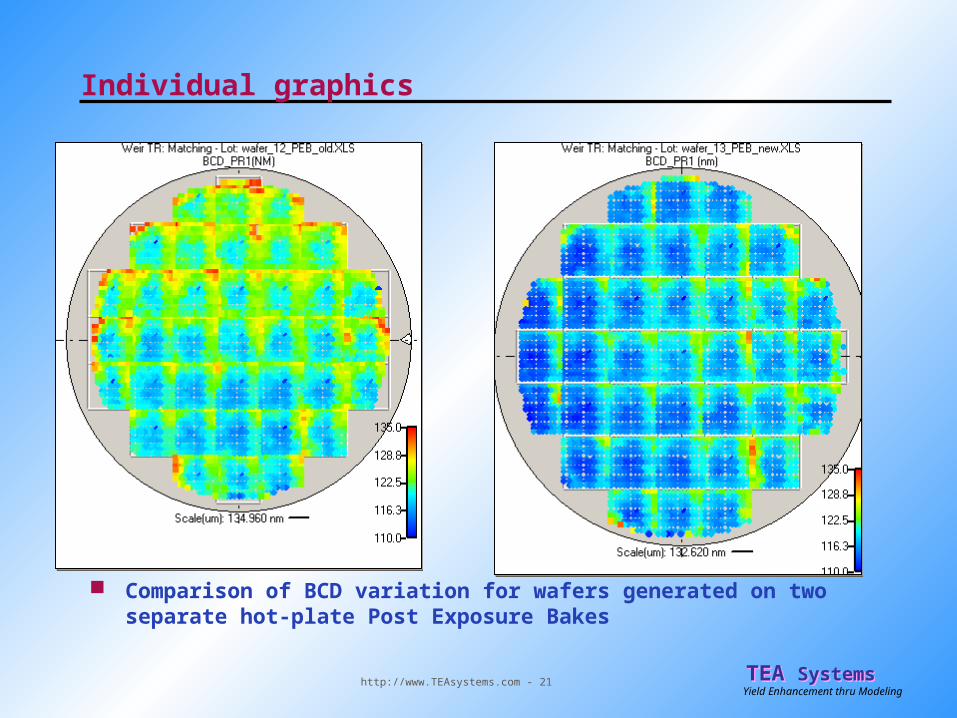
Individual graphics
Comparison of BCD variation for wafers generated on two separate hot-plate Post Exposure Bakes

http://www.TEAsystems.com - 22Yield Enhancement thru ModelingTEA SystemsTEA Systems
Variation by X-location on wafer
Vector
Contour
Radial
XY Horizontal
XY Vertical
VS Time/sequence
Data here not modeled, this is raw data

http://www.TEAsystems.com - 23Yield Enhancement thru ModelingTEA SystemsTEA Systems
Modeled wafer variation
BCD Modeled variation due to slow across-wafer changes Data from two bake plates

http://www.TEAsystems.com - 24Yield Enhancement thru ModelingTEA SystemsTEA Systems
BCD wafer fit to temperature
Response as a function of X position on the wafer On-Wafer Temperature at 135.52 sec vs final Wafer-Modeled BCD 2nd order line fitted to each dataset using mouse interface

http://www.TEAsystems.com - 25Yield Enhancement thru ModelingTEA SystemsTEA Systems
Weir TR calculated Cumulative Energy and BCD Variation
Contour grid (left) can be turned on/off

http://www.TEAsystems.com - 26Yield Enhancement thru ModelingTEA SystemsTEA Systems
Thermal-Time Cycle & BCD Information

http://www.TEAsystems.com - 27Yield Enhancement thru ModelingTEA SystemsTEA Systems
Thermal Energy & wafer-modeled BCD Problem
OnWafer probe and CD-SEM oriented wafer differently
Left=Thermal vector plot Right= Scatter-tool
Contour

http://www.TEAsystems.com - 28Yield Enhancement thru ModelingTEA SystemsTEA Systems
Thermal rotated by –135 degrees
Data Rotation interface allowed thermal data to be rotated by –135 degrees to provide improved alignment
http://www.TEAsystems.com - 29Yield Enhancement thru ModelingTEA SystemsTEA Systems
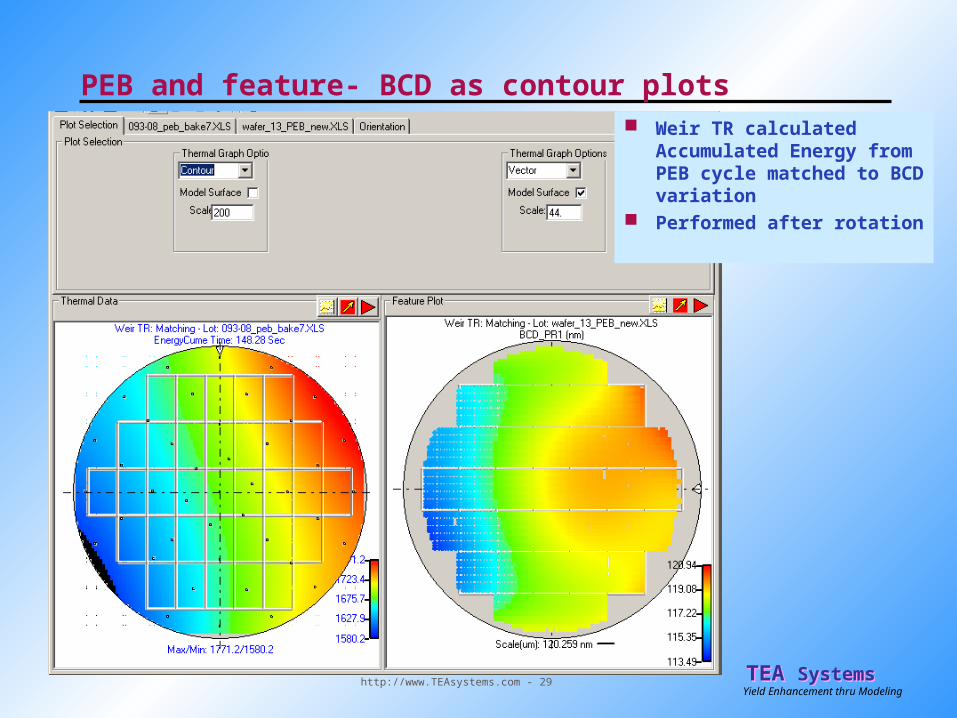
PEB and feature- BCD as contour plots Weir TR calculated
Accumulated Energy from PEB cycle matched to BCD variation
Performed after rotation

http://www.TEAsystems.com - 30Yield Enhancement thru ModelingTEA SystemsTEA Systems
Radial Variation

http://www.TEAsystems.com - 31Yield Enhancement thru ModelingTEA SystemsTEA Systems
Horizontal Variation: Temperature vs BCD modeled

http://www.TEAsystems.com - 32Yield Enhancement thru ModelingTEA SystemsTEA Systems
Modeled Comparison of Temperature & Top CD (TCD)
Analysis used the BCD variable to remove “poor” metrology Any variable such as
MSE, TCD, BARC, SWA etc can be used to cull data

http://www.TEAsystems.com - 33Yield Enhancement thru ModelingTEA SystemsTEA Systems
Thermal and Feature DistributionsTemperature @ 30 sec BARC SWA2 (Side Wall Angle)
Bottom Feature Size (BCD)Top Feature Size (TCD)SWA1 (Side Wall Angle)

http://www.TEAsystems.com
Terrence E. Zavecz [email protected]
Weir TR: MatchingThermal Response Comparison of two hot plates
Comparison of two separate PEB bake plates

http://www.TEAsystems.com - 35Yield Enhancement thru ModelingTEA SystemsTEA Systems
Time sequence for two bake plates

http://www.TEAsystems.com - 36Yield Enhancement thru ModelingTEA SystemsTEA Systems
Timed Response of Temperature

http://www.TEAsystems.com - 37Yield Enhancement thru ModelingTEA SystemsTEA Systems
Temperature response at curve peak

http://www.TEAsystems.com - 38Yield Enhancement thru ModelingTEA SystemsTEA Systems
Temperature at 148.77 Sec

http://www.TEAsystems.com - 39Yield Enhancement thru ModelingTEA SystemsTEA Systems
Horizontal variation across plate
Hot-plate comparison for two PEB sequences Temperature variation at 148.77 seconds Fitted curves up to 4th order can be mouse-added to plots

http://www.TEAsystems.com - 40Yield Enhancement thru ModelingTEA SystemsTEA Systems
Total cumulative Energy @ end of cycle

http://www.TEAsystems.com - 41Yield Enhancement thru ModelingTEA SystemsTEA Systems
Summary Two very-unique companion products are offered
Weir TR – Time/Sequence Response Analysis software Weir TR – Matching for any sequence, probe or metrology data
Weir TR: Time Response Goes beyond thermal sensor software provided by OnWafer & SensArray Automated
Sequence Phase extraction Process-Energy Injection calculation Localized Rise/Fall calculation & plotting Individual phase and sensor analysis
Vector, histogram and XY plots of any time/sequence slide Matrix, Animation and visualization plots
Weir TR: Matching Matching software for Critical Features and metrology elements
Similar to historic overlay matching methods Includes ability to match time/sequenced data
Such as Post-Exposure Bake, scanner logs, OnWafer & SensArray data Match
Time-to-time Time-to-Feature distribution Feature-to-Feature
Automated Data culling Wafer Model Data Rotational Alignment