Document
15
occupied Palestinian territory The Humanitarian Monitor Nov 2008 Number 31 Tables of Indicators
-
Upload
united-nations-office-for-the-coordination-of-humanitarian-affairs -
Category
Documents
-
view
213 -
download
0
description
http://www.ochaopt.org/documents/ocha_opt_humanitarian_monitor_table_2008_11_english.pdf
Transcript of Document

occupied Palestinian territoryThe Humanitarian Monitor
Nov 2008Number 31
Tables of Indicators

The Humanitarian Monitoro c c u p i e d P a l e s t i n i a n t e r r i t o r y
Number 31 • Nov 2008 • 2
Total 2005
(monthly average)
Total 2006
(monthly average)
Total 2007
(monthly average)
D e c -07
J a n -08
F e b -08
M a r -08
A p r -08
M a y -08
J u n e -08
J u l y -08
A u g -08
S e p -08
O c t -08
N o v -08
Number of Palestinian deaths - direct conflict1
West Bank
216(18)
678(57)
396(33)
4 9 6 8 3 3 5 4 1 5 4 0
Gaza Strip 58 80 67 104 70 41 26 1 0 0 0 15
Israel 0 0 2 1 3 0 0 2 0 1 0 0
Malen/a n/a 385*
(32)
61 84 75 102 61 42 29 7 1 4 4 15
Female 1 5 0 11 2 2 2 0 0 1 0 0
Number of Palestinian injuries - direct conflict
West Bank 1260(105)
3194(266)
1843(153)
53 111 58 122 45 87 139 218 149 130 98 91
Gaza Strip 84 182 143 215 155 107 41 3 0 4 2 24
Malen/a n/a 1,106*
(85)
136 276 185 197 125 162 148 212 138 83 100 110
Female 0 17 16 10 6 3 7 5 13 51 9 5
Number of Israeli deaths - direct conflict
oPt 48(4)
25(2)
13(1)
2 1 0 3 8 0 0 1 0 0 1 0
Israel 0 0 2 8 0 2 1 3 0 0 0 0
Malen/a n/a 13*
(1)
2 1 1 11 8 1 1 2 0 0 1 0
Female 0 0 1 0 0 1 0 2 0 0 0 0
Number of Israeli injuries - direct conflict
oPt 484(40)
377(31)
322(27)
14 11 12 36 27 11 9 15 7 22 27 12
Israel 6 9 23 18 3 20 15 42 0 19 0 9
Malen/a n/a 249*
(21)
17 18 25 51 30 13 9 16 7 22 25 19
Female 2 2 10 3 0 2 2 0 0 0 2 2
Number of Palestinian deaths - internal violence2
West Bank 12(>1)
146(12)
490(41)
3 0 2 7 1 0 3 0 5 1 1 0
Gaza Strip 12 9 4 3 1 4 10 14 19 17 3 2
Number of Palestinian injuries - internal violence
West Bank 130(11)
871(76)
2726(227)
2 45 4 19 17 4 16 0 5 3 11 1
Gaza Strip 107 22 19 21 9 53 16 67 113 73 19 7
Average weekly IDF searches, arrests and detentions in the West Bank3
Search CampaignsAve
Weekly (61)
Ave Weekly (109)
Ave Weekly
(102)71 94 103 113 117 105 117 121 113 84 92 86
Arrests and Detentions
Ave Weekly
(74)
Ave Weekly (101)
Ave Weekly
(96)83 92 94 115 90 92 50 102 76 74 62 85
*Data by gender is not complete. Totals for this category are lower than the overall casualty totals indicated above.
For more information, please contact OHCHR, (02) 2965534 or OCHA, (02) 582 9962 (Mai Yassin)
Protection of Civilians “Protection encompasses all activities aimed at ensuring full respect for the rights of the individuals in accordance with international human rights law, international humanitarian law and refugee law.”a
The Humanitarian Monitoro c c u p i e d P a l e s t i n i a n t e r r i t o r y
Number 31 • Nov 2008 • 3
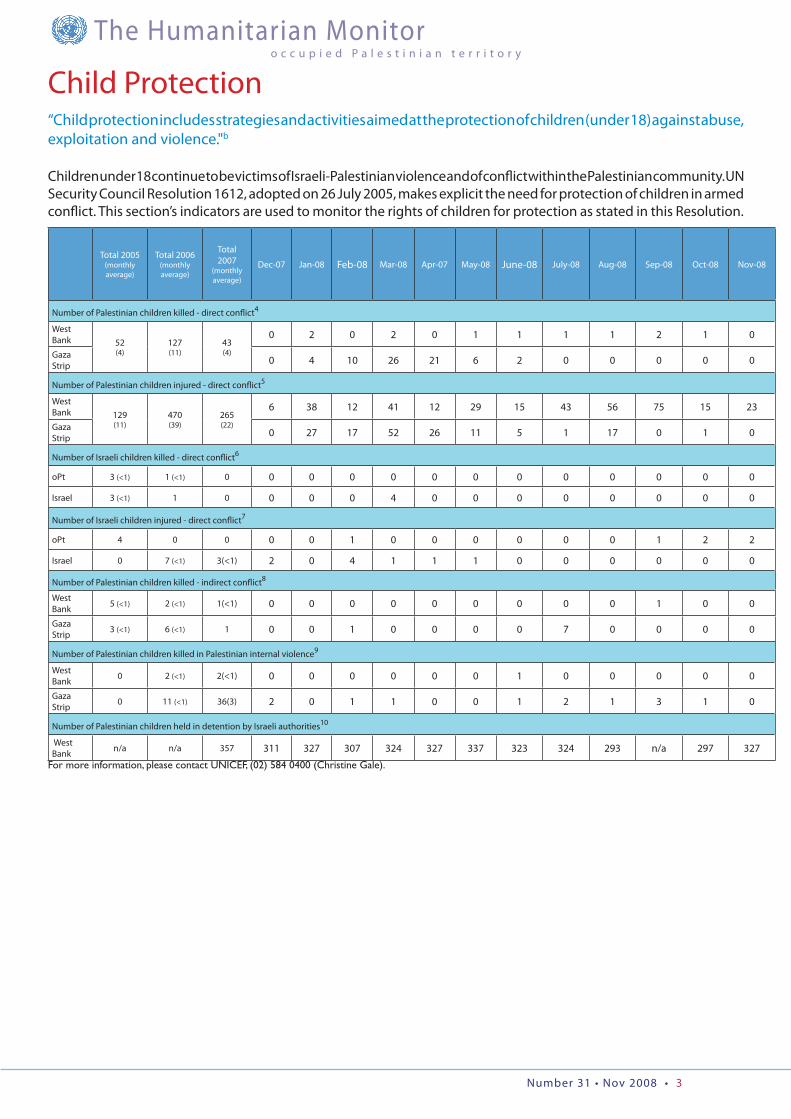
Child Protection “Child protection includes strategies and activities aimed at the protection of children (under 18) against abuse, exploitation and violence."b
Children under 18 continue to be victims of Israeli-Palestinian violence and of conflict within the Palestinian community. UN Security Council Resolution 1612, adopted on 26 July 2005, makes explicit the need for protection of children in armed conflict. This section’s indicators are used to monitor the rights of children for protection as stated in this Resolution.
Total 2005
(monthly average)
Total 2006(monthly average)
Total 2007
(monthly average)
Dec-07 Jan-08 Feb-08 Mar-08 Apr-07 May-08 June-08 July-08 Aug-08 Sep-08 Oct-08 Nov-08
Number of Palestinian children killed - direct conflict4
West Bank 52
(4)127(11)
43(4)
0 2 0 2 0 1 1 1 1 2 1 0
Gaza Strip 0 4 10 26 21 6 2 0 0 0 0 0
Number of Palestinian children injured - direct conflict5
West Bank 129
(11)470(39)
265(22)
6 38 12 41 12 29 15 43 56 75 15 23
Gaza Strip 0 27 17 52 26 11 5 1 17 0 1 0
Number of Israeli children killed - direct conflict6
oPt 3 (<1) 1 (<1) 0 0 0 0 0 0 0 0 0 0 0 0 0
Israel 3 (<1) 1 0 0 0 0 4 0 0 0 0 0 0 0 0
Number of Israeli children injured - direct conflict7
oPt 4 0 0 0 0 1 0 0 0 0 0 0 1 2 2
Israel 0 7 (<1) 3(<1) 2 0 4 1 1 1 0 0 0 0 0 0
Number of Palestinian children killed - indirect conflict8
West Bank 5 (<1) 2 (<1) 1(<1) 0 0 0 0 0 0 0 0 0 1 0 0
Gaza Strip 3 (<1) 6 (<1) 1 0 0 1 0 0 0 0 7 0 0 0 0
Number of Palestinian children killed in Palestinian internal violence9
West Bank 0 2 (<1) 2(<1) 0 0 0 0 0 0 1 0 0 0 0 0
Gaza Strip 0 11 (<1) 36(3) 2 0 1 1 0 0 1 2 1 3 1 0
Number of Palestinian children held in detention by Israeli authorities10
West Bank n/a n/a 357 311 327 307 324 327 337 323 324 293 n/a 297 327
For more information, please contact UNICEF, (02) 584 0400 (Christine Gale).

The Humanitarian Monitoro c c u p i e d P a l e s t i n i a n t e r r i t o r y
Number 31 • Nov 2008 • 4
Violence and Private Property“The civilian population and individual civilians shall enjoy general protection against dangers arising from military operations…The civilian population as such, as well as individual civilians, shall not be the object of attacks. Acts or threats of violence, the primary purpose of which is to spread terror among the civilian population are prohibited.”c
Total 2005
(monthly average)
Total2006
(monthly average)
Total2007
(monthly average)
D e c -07
J a n -08
F e b -08
M a r -08
A p r -08
M a y -08
June-08
J u l y -08
A u g -08
S e p -08
O c t -08
N o v -08
Incidents involving Israeli settlers11
Total number of incidents n/a 235(20)
291(24) 24 28 24 50 53 33 37 48 40 25 50 28
Leading to Palestinian casualties n/a 63
(5)76(6) 3 9 1 12 12 9 2 6 13 5 13 9
Leading to Israeli Settler casualties n/a 28
(2)25(2) 4 1 8 4 2 1 1 1 0 1 7 2
Leading to international casualties n/a 11
(<1)4
(<1) 0 0 0 0 0 1 0 1 2 0 1 0
Number of rockets fired into/towards Israel12
From the Gaza Strip 1 194(100)
1 786(149)
1331(111) 155 267 207 347 149 172 99 9 10 5 14 138
Number of IDF artillery shells
Into the Gaza Strip 509(42)
14 111(1175) 0 0 0 0 0 0 0 0 0 0 0 0 0
Number of IAF air strikes
In the Gaza Strip n/a 573(48)
173(14) 26 33 26 91 35 23 20 0 0 0 0 11
Number of Mortars fired from the Gaza Strip13
Towards Israel n/a n/a 1071(97) 342 256 98 147 174 133 128 7 1 3 0 13
Towards IDF troops n/a n/a 178(16) 55 52 145 87 443 143 71 0 0 0 0 140
Physical structures demolished - West Bank14
Structures demolished n/a 201 190(16) 1 69 42 42 3 2 8 7 34 36 43 15
Of which residential (occupied) n/a 56
(5)90(7) 0 31 20 20 3 1 4 5 2 17 5 12
Physical structures demolished - Gaza Strip
Structures demolished n/a 246(21)
24(2) 1 1 14 11 11 30 8 0 0 0 0 1
Of which homes demolished n/a 127(11)
7(<1) 1 1 7 5 9 8 3 0 0 0 0 1
For more information, please contact OCHA, (02) 582 9962 (Mai Yassin)

The Humanitarian Monitoro c c u p i e d P a l e s t i n i a n t e r r i t o r y
Number 31 • Nov 2008 • 5
Access “Everyone has the right of freedom of movement and residence within the borders of each State. Everyone has the right to leave any country, including his own, and to return to his country.”d
The West Bank Barrier
57% Completed
0 km 723km
source: OCHA, November 2007
Monthlyaverage
2005
Monthlyaverage
2006
Monthlyaverage
2007
D e c -07
J a n -08
F e b -08
M a r -08
A p r -08
M a y -08
June-08
J u l y -08
A u g -08
Sep-08
Oct-08
Nov-08
IDF Physical obstacles in the West Bank15
Staffed 62 74 86 87 87 87 88 88 88 88 88 89 93 93 93
Unstaffed 410 445 467 476 482 493 522 519 517 514 522 545 537 532 531
Total 472 518 552 563 569 580 n/a 607 605 602 610 634 630 625 642
Average weekly Random or ‘Flying’ checkpoints 73 136 113 50 61 85 88 71 79 83 109 73 61 52 58
Curfews imposed by IDF16
No. incidents - West Bank 9 4 5 11 19 11 15 9 8 2 7 3 5 8 7
Total hours under curfew - West Bank 126 40 73 93 177 239 360 96 98 16 64 19 48 87 130
No. incidents - Gaza Strip 0 0 0 0 0 0 0 0 0 0 0 0 0 0 0
Total hours under curfew - Gaza Strip 0 18 0 0 0 0 0 0 0 0 0 0 0 0 0
Access incidents reported by humanitarian organisations17
Access incidents reported in the West Bank n/a 79 40 47 47 63 139 181 138 108 72 37 62 n/a n/a
Average reported time to exit the Gaza Strip via Erez, in minutes.
n/a n/a n/a n/a n/a n/a n/a n/a n/a n/a n/a n/a n/a n/a n/a
Ambulances incidents in the West Bank and access for medical referrals from the Gaza Strip to the West Bank and Israel18
Ambulance access delays reported at West Bank checkpoints
n/a 10 28 n/a 24 25 24 13 n/a n/a n/a 6 13 n/a n/a
Ambulance access denial reported at West Bank checkpoints
n/a 9 23 n/a 32 38 26 22 n/a n/a n/a 25 30 n/a n/a
MoH medical referral requests (via Erez ) n/a 459 735 1041 776 841 1036 1077 1089 909 976 874 449 460 878
Actual no. of medical referrals receiving permits to cross (via Erez)
n/a 416 599 669 542 664 683 709 570 472 652 606 348 355 531
Actual no. of medical referrals who approached Palestinian side to cross via Erez (number reported being denied passage on Israeli side)
n/a n/a n/a 602(6)
645(5)
651(5)
664(n/a)
622(54)
517(31)
452 (16)
651(24)
560 (32)
333 (15)
343 (n/a)
506 (n/a)
Access for Palestinians to East Jerusalem and Israel from oPt19
West Bank (total closure days) n/a n/a 3 0 5 0 8 11 13 0 0 0 2 12 0
Gaza Strip (total closure days) n/a 17 n/a 31 30 29 31 30 31 30 31 31 30 31 30
Movement of people from/to Gaza Strip - daily average20
Workers to Israel - Erez 1029 378 0 0 0 0 0 0 0 0 0 0 0 0 0
Traders to Israel - Erez 107 42 150 n/a 7 2 2 2 1 2 10 11 11 10 2
Rafah - daily crossing out n/a 423 n/a 0 0 0 0 13 36 7 14 108 89 1 123
Rafah daily crossing in n/a 424 n/a 0 0 0 0 13 18 13 18 35 26 34 27For more information, please contact OCHA, (02) 582 9962

The Humanitarian Monitoro c c u p i e d P a l e s t i n i a n t e r r i t o r y
Number 31 • Nov 2008 • 6
Access “Everyone lawfully within the territory of a State shall, within that territory, have the right to liberty of movement and freedom to choose his residence.”e
Monthly average
2005
Monthly average
2006
Monthly average
2007
Dec-07
Jan-08
F e b -08
M a r -08
A p r -08
M a y -08
June -08
July -08
A u g -08
S e p -08
O c t -08
N o v -08
Functioning of the Gaza Strips crossing points - percentage of days open/sheduled days open21
Rafah crossing n/a 57% n/a 0% 0% 0% 0% 0% 0% 0% 0% 0% 0% 0% 0%
Karni crossing n/a 71% n/a 0% 0% 0% 0% 0% 0% 0% 0% 0% 0% 0% 0%
Sufa crossing n/a 60% n/a 46% 48% 79% 23% 70.3% 73.1% 76.9% 96% 61% 38% 0% 0%
Nahal Oz energy pipelines n/a n/a n/a n/a n/a n/a n/a n/a n/a n/a n/a 58% n/a 65% 29%
Movement of goods trough Karni crossing - daily average22
Karni import (Conveyer belt) n/a 156 n/a 18 18 21 40 13 21 30 107 59 84 50 9
Karni export n/a 17 n/a 0 0 0 0 0 0 0 0 0 0 0 0
Other imports into the Gaza Strip - total23
Sufa import - aggregates (construction materials) truckloads 3 527 1 598 n/a 0 0 0 0 0 0 0 0 0 0 0 0
Nahal Oz import - Fuel truckloads n/a 583 n/a 364 n/a n/a n/a 129 n/a 237 n/a 342 342 245 40For more information, please contact OCHA, (02) 582 9962.

The Humanitarian Monitoro c c u p i e d P a l e s t i n i a n t e r r i t o r y
Number 31 • Nov 2008 • 7
PCBS Poverty Consumption-based Yearly FiguresWest Bank Gaza Strip oPt
1998 14.5% 33% 20.3%2001 16.2% 41.9% 23.6%2004 19.8% 37.2% 25.6%2005 22.3% 43.7% 29.5%2006 24% 50.7% 30.8%2007 19.1% 51.8% 30.3%
Socio-economic Conditions“Everyone has the right to work, to free choice of employment, to just and favourable conditions of work and to protection against unemployment” f
Poverty can be defined by using either of two indices: Consumption-based poverty, and Income-based povert. For clarifications on definitions, please see footnote # 25.
Deep Poverty in the oPt Consumption-based (PCBS)
West Bank Gaza Strip oPt1998 8.4% 21.6% 12.5%2001 12.0% 35.4% 19.5%2004 11.6% 26.0% 16.4%2005 13.1% 27.9% 18.0%
2006 13.0% 34.8% 18.5%
2007 9.7% 35.0% 18.3%Source: PCBS, Poverty in Palestine (various years)
Q1 2001
Q1 2002
Q1 2003
Q1 2004
Q1 2005
Q12006
Q3 2006
Q42006
Q1 2007
Q22007
Q32007
Q42007
Q12008
Q2 2008
Q3 2008
Unemployment rate - relaxed definition - % - PCBS24
West Bank 32.5% 35.0% 40.3% 31.0% 28.8% 27.2% 25.3% 23.4% 24.3% 22.6% 25.20% 25.90% 25.70% 23.20% 26.40%
Gaza Strip 48.8% 46.4% 37.3% 35.1% 38.0% 39.6% 41.8% 39.6% 35.4% 32.3% 37.60% 35.30% 35.50% 49.10% 46.1%
oPt 37.7% 38.7% 39.3% 32.3% 31.7% 31.1% 30.3% 28.4% 27.9% 25.7% 29.10% 28.80% 28.90% 31.50% 32.7%
Number of Palestinians employed in Israel and in the settlements - PCBS26
West Bank 105501 57000 43281 49750 65255 59846 69478 68100 68100 63700 66800 n/a n/a n/a n/a
Gaza Strip 2580 2000 6295 5849 0 852 0 0 0 0 0 n/a n/a n/a n/a
oPt 107630 59000 49576 55999 65255 60698 69478 68100 68100 63700 66800 n/a n/a n/a n/a
Economic dependency ratio - PCBS27
West Bank 5.7 6 6.6 5.7 5.6 5 5 5 5.0 4.7 4.9 n/a n/a n/a n/a
Gaza Strip 9.1 8.8 7.5 7.5 8.2 8 9 8 7.3 6.9 7.4 n/a n/a n/a n/a
oPt 6.6 6.8 6.9 6.3 6.3 6 6 6 5.7 5.3 5.6 n/a n/a n/a n/a
Evolution of consumer price index (CPI) - PCBS28
West Bank 26.0% 32.0% 39.7% 44.2% 49.2% 54.3% 55.3% 57.0% 57.0% 55.7% 59.3% 64.1% 70.7% 20.9% 22.8%
Gaza Strip 22.8% 23.2% 26.4% 32.0% 33.8% 38.1% 41.5% 40.7% 42.0% 41.9% 46.1% 53.0% 60.0% 24.2% 27.0%
oPt 24.2% 28.4% 36.2% 41.4% 46.1% 51.0% 53.1% 52.9% 53.5 53.1% 56.9% 62.2% 68.3% 20.1% 23.0%
Evolution of daily wages in NIS - PCBS29
West Bank 60 57.7 60 62.8 60 70 69.2 67.3 70.0 69.2 70.0 70.0 76.9 77 n/a
Gaza Strip 60 50 50 50 55.8 65.4 65.4 61.5 66.9 57.7 57.7 60.7 57.7 58 n/a
oPt 55 53.85 55.6 57.7 57.7 69.2 69.2 65.4 69.2 65.4 67.3 69.2 70.0 70 n/a
For more information, please contact UNRWA, (02) 589 0500 (Christine Rackwitz)
PCBS Labour Force Survey Q2 2008Current number of P.A employees represents:
22.7% of the employed people in the oPt • 14.9% of the employed people in the West Bank • 47.5% of the employed people in the Gaza Strip •

The Humanitarian Monitoro c c u p i e d P a l e s t i n i a n t e r r i t o r y
Number 31 • Nov 2008 • 8
Agriculture
Monthly Average
2006Nov-07 Dec-07 Jan -08 Feb-08 Mar-08 Apr-08 May-08 June-08 July-08 Aug-
08 Sep-08 Oct-08 Nov-08
Arable land requisitoned, levelled and reclaimed in dunums - West Bank36
Requistioned 484 20 60 0 0 0 30 540 40 390 376 20 100 307
Levelled n/a 2 6 26945 100 30 50 30 20 8 70 10 10 0
People affected n/a 32 77 n/a 60 21 196 294 84 294 348 48 110 12
Reclaimed n/a 150 70 71 110 98 230 100 120 200 55 1,220 115 57
Arable land requisitioned levelled or reclaimed in dunums - Gaza Strip
Requistioned n/a 0 0 0 0 0 0 0 0 0 0 0 0 0
Levelled n/a 0 1300 6000 100 850 1723 1290 1136 0 0 0 0 0
People affected n/a 0 1750 n/a 150 670 3192 1740 1000 0 0 0 0 0
Reclaimed n/a 0 170 200 40 611 190 165 0 0 0 0 0 0
Greenhouses land destroyed and rehabilitated in dunums - West Bank37
Destroyed n/a 7 2 4797 7 25 4 0 0 0 0 0 0 0People affected n/a 35 14 n/a 30 84 28 n/a 0 0 0 0 0 0Rehabilitated n/a 285 30 60 39 226 12 10 15 0 10 121 25 3
Greenhouses land destroyed and rehabilitated in dunums - Gaza Strip
Destroyed n/a 0 0 4561 0 0 23 8 14 0 0 0 0 0
People affected n/a 0 0 n/a 0 0 28 18 60 0 0 0 0 0
Rehabilitated n/a 50 0 0 0 0 0 5 10 0 0 0 0 0
Number of trees destroyed38
Treesdestroyed in the West Bank n/a 140 0 2059 500 3150 700 1140 5460 300 0 0 200 0
People affected n/a 28 0 n/a 180 49 714 264 258 60 0 0 18 0
Trees destroyed in the Gaza Strip n/a 0 10000 n/a 400 n/a 11940 7500 22240 0 0 0 0 0
People affected n/a 0 1750 n/a 150 n/a 2303 300 2000 0 0 0 0 0
Agricultural produce trading in/out the Gaza Strip - metric tonnes39
Import 12901 4753 13902 n/a n/a 14049 4526 11382 17561 n/a n/a n/a n/a n/a
Export 1370 37 238 n/a n/a 0 0 0 0 0 0 0 0 0For more information, please contact FAO, (02) 532 1950 (Rana Hannoun or Azzam Saleh)

The Humanitarian Monitoro c c u p i e d P a l e s t i n i a n t e r r i t o r y
Number 31 • Nov 2008 • 9
Food Security
BenchmarkMonthly average200645
Monthly average
2007
D e c -07
J a n -08
F e b -08
M a r -08
A p r -08
M a y -08
J u n e -08 July-08 A u g -
08 Sep-08 Oct-08 N o v -08
Retail price of basic food commodities - West Bank, in NIS40
Wheat flour 50 kg - 91.0 128.7 190 205 205 184.5 184.5 190.5 190.5 186.4 186.4 171.9 171.9 149.4
Olive oil 1 Kg - 18.6 19 25 23.8 23.8 22.5 22.5 24 24 21.5 21.5 25.5 25.5 23.6
Rice 1 kg - 3.6 4.3 4.6 4.9 4.9 5.1 6 6 6 6.5 6.5 6.6 6.6 7.1
Veg. oil 1 kg - 5.5 6.4 7.4 8.7 8.7 9.4 9.4 9.3 9.3 9.8 9.8 9.5 9.5 8.8
Chickpeas 1 kg - 4.8 4.9 5.4 5.6 5.6 5.6 5.6 6.3 6.3 7.3 7.3 7.5 7.5 7.6
Refined sugar 1 kg - 3.7 3.3 3.2 3.1 3.1 3 3 3 3 3 3 3 3 3.1
Milk powder 1 kg - 23.2 25.5 28 32.1 32.1 32.6 32.6 32.4 32.4 33.5 33.5 33.7 33.7 32.3
7Basket of 7 items - 150.5 192.1 263.6 283.1 283.1 262.7 263.6 271.5 271.5 268 268 257.7 257.7 231.9
Price of basic food commodities - Gaza Strip, in NIS41
Wheat flour 50 kg - 82.9 104 130 135.0 135 130.75 130.5 130 126.2 121.8 116.5 110.17 104.3 103.12
Olive oil 1 Kg - 23.1 24.09 27 27.0 27 27 27 27 27 27 27.00 27 27 27
Rice 1 kg - 3.3 3.57 3.50 3.3 3 3.5 3.875 4 4 4.3 4.375 4.84 5.1 5.1
Veg. oil 1 kg - 5.5 6.28 7 6.8 6.75 6.5 7.5 8 7 7 7 7 7 7
Chickpeas 1 kg - 5.3 5.36 5.90 5.7 5.7 5 5 5 5 5.55 6 6 6 6
Refined sugar 1 kg - 4.2 3.09 2.66 2.6 2.6 2.53 2.5 2.55 2.33 2.33 2.516 2.73 2.66 2.69
Milk powder 1 kg - 33.4 35.14 28.8 29.0 31.7 29 31.5 32.75 32.6 34.6 34.72 34.92 34.61 33
Basket of 7 items - 157.1 178.6 205 209.4 211.8 204.28 207.88 209.3 204.13 202.58 198.11 192.66 186.67 183.91
Quantities of food imported in the Gaza Strip - metric tonnes43
Wheat - mT 450 mt/day/pop - 7338 11473 8784 13341 12644 4478 4279 15650 9,525 9,974 12,539 5,059 4,000
Rice 72 mt/day/pop - 1382 1592 3916 2091 1200 2361 48 386 118 616 377 1,340 582
Veg. oil 44 mt/day/pop - 1437 1860 3054 311 2991 1302 2116 2245 920 1,431 2,374 3,547 259
Sugar 111 mt/day/pop - 3350 5250 4984 2496 4692 6115 1423 3450 625 1,686 1,893 6,127 920
Total - - 13512 20175 20738 18239 21527 14256 7866 21731 11188 10,788 17,183 16,073 5,761
Fishing catch in the Gaza Strip44 Total
mT 2,323 (in 2005) 1604.2 2704.7 82.4 62.7 246.0 75.0 154.0 757 429.62 490.2 302.6 173.7 250.0 245.1
For more information, please contact FAO, (02) 532 1950 (Rana Hannoun or Azzam Saleh) or WFP, (02) 540 1340 (Salah Lahham)

The Humanitarian Monitoro c c u p i e d P a l e s t i n i a n t e r r i t o r y
Number 31 • Nov 2008 • 10
The Institutional Response to the Crisis Humanitarian and development assistance to the oPt
FUNDEDin $ million
The UN and the CAP ICRC INGOs PNGOss ECHO Other EC
Commitment USAID
2005 193.3 30.6 n/a n/a 35 241 386
2006 273 34.5 n/a n/a 104.4 225 176
2007 272.5 57.4 (appeal) n/a n/a n/a n/a 29.8*
2008 448 n/a n/a n/a n/a n/a n/a Source: Relief web, ICRC, ECHO, USAID websites.*Available up till April
The CAP In S million CAP 2008 - revised May 2008 CAP 2009
Sector Requirements in $ million
Number of
Projects
Level of funding as of 18 December
2008
CAP 08 % funded
Agriculture 22.4 26 11.9 53% 25.9
Coordination and support services 18.3 8 25.3 100+% 15.5
Economic Recovery and Infrastructure 138.4 17 74.8 54% 133.3
Education 5.3 6 3.7 69% 9.3
Food 198.5 9 159.6 79% 208.5
Health & Psychosocial 28.8 26 23.5 82% 24.3
Protection 8.6 15 2.7 31% 24.7
Water and Sanitation 18.3 17 6 32% 17.8
Shelter and non-food items - - 0 - 2.5
Multi-Sector 7.2 1 1.4 19% -
Sector not yet specified 2 1 4.9 100+% 1
Mine action 0.2 1 0 0%
Total 448 127 313.8 69% 462.8 Source: OCHA, Financial Tracking System (FTS).
The PA operating budget$ million 2005 2006 2007 2008
$ million % $
million % Q1 2007($million) % $
million % 2008 ($ million) %
Clearance revenues collected by GoI 894 40 344 24 105 17 1318 51 1067 40
Domestic revenues 476 22 378 26 289 46 323 12 419 16
External finances for budgetary support 349 16 738 51 219 35 1012 39 1200 45
Total other financing, incl. Palestinian Investment Fund Dividend 477 22 -25 -2 15 2 -54 -2 0 0
TOTAL 2,196 100 1435 100 628 100 2599 100 2686 100
Source: Palestinian Ministry of Finance, www.pmof.ps , Monthly and annual financial reports for selected years
The PA (Palestinian Authority) fiscal situation recovered in 2007, following a significant decline in 2006, which resulted from the sanctions Israel and the international donor community imposed on the Hamas-led government in the aftermath of the January 2006 elections. The recovery took place in the second half of 2007, in response to the resumption of the clearance revenues, including VAT and customs, which the Government of Israel collects monthly on behalf of the PA. A further improvement was observed during the first quarter of 2008 following an increase in external aid income.
Requirements in $ million

The Humanitarian Monitoro c c u p i e d P a l e s t i n i a n t e r r i t o r y
Number 31 • Nov 2008 • 11
Type # of beneficiaries
# of allowances received since February 2008
Total amount received in US$ as of 5 December 2008
Public service providers 70,000 11 266.10
Pensioners 8000 11 26.02
Total Fuel delivered to Gaza Power Plant since February 2008 in million litres 89.4
Cost in US$ 118.43
Axis II: Social Development
2) Aid to vulnerable Palestinian families
PEGASE
$ million Confirmed pledges in million $US Total disbursed in US$ million as of 5 December 2008
ESSP 78.00 65.00
Axis I682.00
n/aAxis II 440.86Axis III 30.86Total 760.00 536.72
3)Provision of essential public services
Axis III : Economic and private sector development
TIM ended as of 31 March 2008, PEGASE is the new European mechanism launched on 1 February 2008 that aims to shift from emergency assistance to a sustainable Palestinian
development process
1) Public administration and services
Type # of beneficiaries
# of allowances received since February 2008
Total amount received in US$ as of 5 December 2008
Suppot to Social Hardship Cases 46,000+ 3 30.30
# of payments since February 2008 Total amount received in US$ as of 5 December 2008
5 30.86
1 euro = US$1.27.
The Humanitarian Monitoro c c u p i e d P a l e s t i n i a n t e r r i t o r y
Number 31 • Nov 2008 • 12
Sources and Rationale
The following sector groups and organisations contribute to the Humanitarian Monitor:Sector Sector Lead
Protection OHCHR/OCHASocio-Economic UNRWAHealth WHOChild Protection and Psychosocial UNICEFFood WFPAgriculture FAOEducation UNICEFWater and Sanitation UNICEFCoordination and Security OCHA
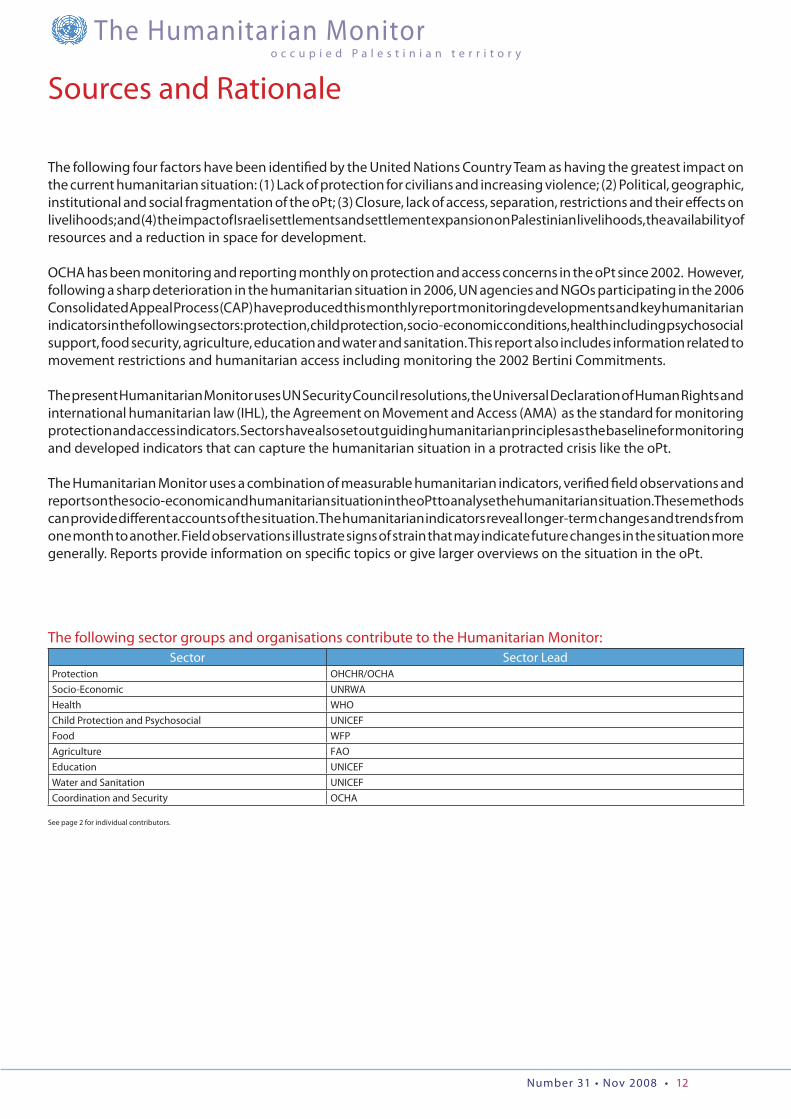
The following four factors have been identified by the United Nations Country Team as having the greatest impact on the current humanitarian situation: (1) Lack of protection for civilians and increasing violence; (2) Political, geographic, institutional and social fragmentation of the oPt; (3) Closure, lack of access, separation, restrictions and their effects on livelihoods; and (4) the impact of Israeli settlements and settlement expansion on Palestinian livelihoods, the availability of resources and a reduction in space for development.
OCHA has been monitoring and reporting monthly on protection and access concerns in the oPt since 2002. However, following a sharp deterioration in the humanitarian situation in 2006, UN agencies and NGOs participating in the 2006 Consolidated Appeal Process (CAP) have produced this monthly report monitoring developments and key humanitarian indicators in the following sectors: protection, child protection, socio-economic conditions, health including psychosocial support, food security, agriculture, education and water and sanitation. This report also includes information related to movement restrictions and humanitarian access including monitoring the 2002 Bertini Commitments. The present Humanitarian Monitor uses UN Security Council resolutions, the Universal Declaration of Human Rights and international humanitarian law (IHL), the Agreement on Movement and Access (AMA) as the standard for monitoring protection and access indicators. Sectors have also set out guiding humanitarian principles as the baseline for monitoring and developed indicators that can capture the humanitarian situation in a protracted crisis like the oPt.
The Humanitarian Monitor uses a combination of measurable humanitarian indicators, verified field observations and reports on the socio-economic and humanitarian situation in the oPt to analyse the humanitarian situation. These methods can provide different accounts of the situation. The humanitarian indicators reveal longer-term changes and trends from one month to another. Field observations illustrate signs of strain that may indicate future changes in the situation more generally. Reports provide information on specific topics or give larger overviews on the situation in the oPt.
See page 2 for individual contributors.

The Humanitarian Monitoro c c u p i e d P a l e s t i n i a n t e r r i t o r y
Number 31 • Nov 2008 • 13
Protection of Civilians
Child Protection
Number of Palestinian and Israeli casualties (fatalities and injuries) - direct conflict. Source: OCHA. Casualities included within this figure relate directly to the conflict with Israel and the occupation of the oPt 1. including in IDF military operations, artillery shelling, search and arrest campaigns, Barrier demonstrations, targeted killings, settler violence etc. The figures do not include events indirectly related to the conflict such as casualties from unexploded ordnance, etc. or events when the circumstances remain unclear or are in dispute. The figures include all reported casualties of all ages and both genders. Number of Palestinian casualties - internal violence. Source: OCHA. Casualties included within this figure are caused by factional violence, family feuding, during internal demonstrations (that are linked to the 2. conflict/occupation) and shooting of alleged collaborators with Israel. These incidents began to be comprehensively reported from May 2006 and earlier figures will be under-reported. Number of search and arrest campaigns and arrests and detentions. Source: OCHA. These indicators refer to operations by the Israeli security forces to search houses or other properties throughout the oPt or 3. arrests/detentions that take place at checkpoints or during demonstrations (i.e. no search). During these operations individuals are often detained or arrested. Detentions (without arrest) typically last for a few days but can last be extended up to a period of three months or longer. Since Israel’s unilateral disengagement from the Gaza Strip the vast majority of these operations occur in West Bank towns and villages.
Table Definitions
Number of Palestinian children killed - direct conflict. Source: OCHA. This indicator is used to monitor UN Security Council Resolution 1612, adopted on 26 July 2005 and relative to the protection of children in 4. armed conflict. Children are killed in incidents related directly to the conflict and occupation of the oPt. These include casualties caused in IDF military operations, artillery shelling, search and arrest campaigns, demonstrations, targeted killing and Israeli settler violence. Number of Palestinian children injured - direct conflict. This indicator is used to monitor UN Security Council Resolution 1612. Children are injured in incidents directly related to the conflict and occupation 5. of the oPt. These include injuries caused in IDF military operations, artillery shelling, search and arrest campaigns, demonstrations, targeted killing and Israeli settler violence. Number of Israeli children killed - direct conflict. Source: OCHA. This indicator is used to monitor UN Security Council Resolution 1612. 6. Number of Israeli children injured - direct conflict. Source: OCHA. This indicator is used to monitor UN Security Council Resolution 1612. 7. Number of Palestinian children killed – indirect conflict. These are children killed in incidents indirectly related to the conflcit and occupation of the oPt such as in incidents involving unexploded ordnance (UXO), 8. traffic incidents in the oPt with Israeli vehicles, Palestinian homemade rockets (Qassams, etc.) missing their target, deaths in prison, deaths from probable underlying medical conditions that occurred during military operations or where access to medical care was denied. Number of Palestinian children killed in Palestinian internal violence. Source OCHA. This indicator is used to monitor UN Security Council Resolution 1612. Children are killed in incidents by factional violence 9. or family feuding, internal demonstrations and shooting of alleged collaborators with Israel. These incidents began to be comprehensively reported from May 2006: earlier figures will be underreported. Figure does not include the number of children killed as a result of reckless handling of explosives Number of Palestinian children held in detention by Israeli authorities. Source: Defence for Children International (DCI) from 1 January 2007. This indicator reflects the general level of tension in the West Bank. 10. The UN Convention on the Rights of the Child states that deprivation of liberty of children should always be a last resort and for the shortest appropriate period.
Access
Violence & Private PropertyIncidents involving Israeli settlers. Source: OCHA. This indicator shows the level of tension between Palestinians and Israeli settlers in the West Bank. An incident is any event involving an aggressive action 11. perpetrated by either Israeli settlers or Palestinians towards each other or others in the community (such as international observers) and that may – but not necessarily – lead to a death or an injury. The aggressive action can be an incident involving a car, such as the stoning of a car or driving it in a dangerous manner; any type of harassment such as intimidation and physical threats, stoning people, chasing people etc. that do not cause any casualty; an incident related to property damage to a private house, land, livestock, etc; and any incident involving the entry into a private or prohibited property. This figure also included incidents when the IDF restrict Palestinian access due to Israeli settler presence or activity. Number of Palestinian homemade (Qassam, etc.) rockets, IDF artillery shells and IAF airstrikes in and from the Gaza Strip. Source: OCHA Gaza Field Office relying on secondary sources from 12. UNRWA reporting and the Palestinian DCL. These indicators show trends and the level of conflict existing in the Gaza Strip. This number includes rockets that detonated in the Gaza Strip.
Prior to July 07, the figure for mortars fired “in the Gaza Strip” included mortars known to be fired towards IDF troops in the Gaza Strip. In July 07, these figures were broken down. 13. Number of physical structures demolished in the West Bank and Gaza Strip. Source: OCHA. A structure is demolished when it is completely destroyed, damaged to such an extent that it will have to be 14. demolished before rebuilding can commence, damaged beyond use and includes structures where the owner chose to demolish his structure which was under a demolition order issued by Israeli authorities. The majority of demolitions in the West Bank occur when the Israeli authorities demolish a structure for reportedly being built without a permit although some demolitions occur in other contexts such as during military incursions or due to the construction of the Barrier. In the Gaza Strip, demolitions usually occur during IAF air strikes or ground incursions. A residential (occupied) structure is any form of inhabited shelter/residence including seasonal shelters, during the time of the olive harvest for example.
IDF physical obstacles in the West Bank. Source: OCHA field monitoring. The movement of Palestinians in the West Bank is restricted by a series of physical obstacles such as checkpoints, roadblocks, trenches, 15. earthmounds, etc. that severely restrict Palestinians’ freedom of movement. ‘Flying’ or random checkpoints further disrupt Palestinian movement as they are often deployed on key transit roads during morning and evening peak travelling times. Delays of more than one hour are regularly reported at flying checkpoints and their unpredictable nature means that Palestinians are unable to make travel plans. The annual total of curfew incidents is less than the aggregate of monthly incidents for that year because some curfew incidents began at the end of one month and continued into the next month and were, thus, counted as one incident in each of the two months. In 2007, there are three such incidents. Curfews imposed by IDF. Source: OCHA field monitoring. The duration of a curfew is counted once for each curfew incident. A single curfew affecting multiple neighbouring locations is counted as one incident. 16. A curfew that is lifted and re-imposed in the same place on a single day is counted as two incidents. A single curfew incident may last for several days. Access incidents reported by humanitarian organisations. Source: ACIS forms collected by OCHA and UNRWA Operations in the West Bank and Gaza Strip. The UN Security Council Resolution 1405 adopted 17. in 2002 “emphasizes the urgency of access of medical and humanitarian organisations to the Palestinian civilian population.” In addition, the Governement of Israel committed to “fully facilitate the assistance activities of international organisations…” (Bertini Commitments, 2002). In discussions between UNSCO and the IDF it was agreed that internationals should not wait any longer than 20 minutes at Erez crossing. Incidents of ambulances delays and denials in the West Bank and medical movement from the Gaza Strip. Source: Palestinian Red Crescent Society and WHO. Incidents reported by PRCS ambulance crews at IDF 18. checkpoints throughout the West Bank. Only delays in excess of 30 minutes are reported. For medical movement, Palestinians from the Gaza Strip referred for medical treatment by the MoH in the West Bank, including East Jerusalem, and Israel must travel through Erez crossing while those seeking medical treatment abroad must cross through Rafah. Referral patients crossing Erez require a permit from the Israeli authorities. Figures for November 2007 inclusive only of the 13-30 November period. External acces to/from the oPt – closure days. Source: Ministry of Labour, closure reports, AMA bi-weekly reports and OCHA. These are the days when Palestinians from the West Bank cannot access East 19. Jerusalem or Israel regardless of a valid permit. Normally (1) staff of international organisations, (2) medical staff, (3) humanitarian cases and (4) Palestinians with legal issues (needing to attend a court in Israel etc) are excluded from this comprehensive closure. In the Gaza Strip, these are days when Erez crossing is closed for all Palestinian access as reported in the bi-weekly AMA report. Movement of people from/to the Gaza Strip – daily average. Source: OCHA Gaza Field Office; Erez is the only crossing point for Palestinian workers and traders to enter Israel from the Gaza Strip. The Rafah 20. crossing is the Gaza Strip’s only international crossing point with Egypt. Functioning of the Gaza Strips crossing points - percentage of days open/scheduled days open. Source: AMA bi-weekly report. In terms of scheduled days open: (1) Karni is scheduled to be open six days per 21. week; (2) Sufa is scheduled to open five days per week though at times opens on an additional day to allow the import of non-aggregates; and (3) Nahal Oz energy pipelines are scheduled to operate six days per week. Movement of goods through Karni crossing - daily average. Source: AMA bi-weekly report. The daily average number of trucks is calculated on the basis of scheduled days open at Karni crossing point. Karni 22. crossing is the main transit point for imports/exports into/from the Gaza Strip as well as humanitarian supplies. According to the 15 November 2005 Agreement on Access and Movement (AMA) signed between the GoI and PA, a minimum of 150 truckloads should be exported every day throughout 2006, to reach 400 per day by 31 December 2006. Other imports into the Gaza Strip - total. Source: IDF, and Paltrade. This indicators reflects the total number of truckloads of aggregates (through Sufa) and fuel (through Nahal Oz energy pipelines) into the 23. Gaza Strip each month. Sufa allwoed construction materials into Gaza previously. Now it is functioning as a crossing point for entrance of all materials, as Karni remains closed.
The Humanitarian Monitoro c c u p i e d P a l e s t i n i a n t e r r i t o r y
Number 31 • Nov 2008 • 14
Unemployment rate – relaxed definition. Source: PCBS labour force surveys. In the context of a protracted crisis, the standard unemployment definition might be somehow deficient, as a considerable number 24. of people are simply no longer seeking employment. A “relaxed definition” of unemployment is applied here, by adding to the total number of unemployed people according to International Labour Organization (ILO) standards the number of people currently not engaged in active job search (commonly defined as “inactive”). Households living on poverty – consumption based. Source: PCBS. The poverty line is the level of income below which one cannot afford to purchase all the resources one requires to live. The official Palestinian 25. (relative) poverty line is based on the average consumption of essential goods (food, clothing, housing, housekeeping supplies, utensils and bedding, personel and health care, transportation and education) by a six-member family. For 2006, PCBS estimates it at NIS 2,300 ($518). The subsistence (absolute or deep) poverty line is calculated to reflect a budget for food, clothing and housing for a six-member family and stands at NIS 1,837 ($419) in 2006 (PCBS).
The number of Palestinians employed in Israel and in the settlements. Source: PCBS labour force surveys. In 2000, around 146,000 Palestinians from the oPt were employed in Israel and Israeli settlements. This 26. figure represents roughly 3% of the Palestinian labour force and demonstrates how vital for Palestinians’ livelihoods is the ability to have acces to Israel for working opportunities.
Economic dependency ratio. Source PCBS labour force surveys. No. of population divided by No. of employed. The higher the ratio, the more the inactive population is dependent on the active one. 27. Evolution of Consumer Price Index (CPI). Source: PCBS. Measures changes in prices of purchased goods and services at given time intervals, providing a measure of inflation. Source: PCBS, CPI press releases, 28. quarterly and annually, available from 1996. Evolution of daily wages. Source: PCBS labour force survey. Total net wages paid to all employees divided by total workdays in a given period (median value would be considered). To be looked at in conjuction 29. with changes in CPI to determine purchasing power.
Socio-economic Conditions
Health Number of primary health care consultations by service provider. Source: Primary Health Care (PHC) Directorates; Mother and Child Health Department, UNRWA Epidemiology Department. Compiled by 30. WHO. The number of consultations by service provider indicates the availability of the Ministry of Health (MoH) and UNRWA (free) services, the availability of and recourse to alternative private paying services. It also shows how ecomomical constraints may affect people’s choice to health services providers. NGOs in the Gaza Strip include Palestinian Red Crescent Society (PRCS), Palestinian Medical Relief Society (PMRS) and Union of Health Workers Committees (UHWC), which are the main non-governmental providers of health services. Proportion of deliveries by service provider. Source: Birth certificates showed at PHC during BCG immunization, compiled by WHO. This indicator shows the public services’ capacity to provide obstetric 31. services, as well as the burden on these services. It also indicates the availability of and recourse to alternative private paying services. It shows how financial barriers may affect people’s access choice to health services. Number of pharmaceutical items out of stock. Source: MoH Central Drugstore, compiled by WHO. Out of stock means ‘less than one month’s stock’. There are 416 drug items and 596 consumables that should 32. always be available at central level in stock for more than three months to ensure an adequate response to pharmaceutical needs. This indicator shows the quality of care as well as the donors’ response. Malnutrition among children 9-12 months in the Gaza Strip and 0-24 months in the West Bank. Source: On underweight in the Gaza Strip, data source is MoH newly developed national Nutrition Surveillance 33. system in June 2006, where indicator is - 2SD. On Anemia in the Gaza Strip, the same source has been used since June 2006, whilst MoH PHC directorate has been used as a source for the data on Anemia between January and May 2006. Although data on both sources is for children 9-12 months and collected during measles immunization, trend cannot be defined when using the data from the two systems, as the methodology of data collection substantially differs. However, this new data should be more reliable than the previous ones, showing a more accurate prevalence. In the West Bank, data from the new surveillance system is not available yet, and the 5th percentile has been used as cut off point instead of -2SD for the Underweight. Also, the limit of West Bank data is that they are clinic based and it may not give a representative picture for all the children 0-2 years. Underweight is the weight for age ratio which indicates acute malnutrition. Anemia is defeciency in Iron mirconutrient, where the level of hemoglobin is less than 11mg/l. Indicators of malnutrition are used as early warning for a humanitarian crisis generally linked to food intake, poor living conditions, poor water and sanitation conditions. These indicators allow monitoring the impact of the ongoing economic crisis.
Number of consultation for diarrhoea in refugee children between tha ages of 0-3 years at UNRWA clinics. Source: UNRWA, Epidemiology Department, West Bank and Gaza Strip Field Offices. This indicator 34. enables follow up of environmental health status and the quality and effectiveness of environmental programmes. Monthly figures are compared to the corresponding month in the previous year in order to check for seasonal patterns of disease.
Number of new cases attending UNRWA community mental health services, MoH community and hospital mental health services and Gaza Community Mental Health Program (GCMHP) in Gaza Strip and in 35. the West Bank. Source: UNRWA, Epidemiology Department, West Bank and Gaza Strip Field Offices, MoH, Palestinian Health Information centre and PHC directorate in the West Bank and Gaza Strip compiled by WHO. This indicator shows how the crisis affects the psychological status of the Palestinians. It also indicates the quality of the Palestinians’ access to psychosocial care.
Food Security
Arable land requisitioned, levelled or reclaimed in dunums - West Bank and Gaza Strip. Sources: Ministry of Agriculture, Palestinian Agriculture Relief Committees, compiled by FAO. Requisitioned land is public 36. or private arable land either confiscated or made unavailable to Palestinian farmers by the IDF for any reason (Barrier construction, settlements, roads, military areas, etc.). Levelled land is public or private land that has been deforested or devoid of inhabitation by the IDF. It, however, remains accessible to farmers and can be re-used once the levelling is completed. Reclaimed land is that land, which is originally non-productive, and is transformed into farming land, under a private or NGO/UN-led initiative. Most of the time, this land is privately owned. Greenhouses’ land destroyed (greenhouses and land they are on) and rehabilitated or constructed in dunums - West Bank and Gaza Strip. Sources: Ministry of Agriculture, Palestinian Agriculture Relief 37. Committees, compiled by FAO. Number of trees destroyed (uprooted, burnt or cut by Israeli authorities or settlers). Source: FAO; Ministry of Agriculture Directorates, Palestinian Agriculture Relief Committees. 38. Agricultural produce trading in or out of the Gaza Strip - the quantities of plant or animal produce that are imported to or exported from Gaza (metric tonnes). Source: Ministry of Agriculture, Gaza 39. Strip,Directorates of Agricultural Marketing.
Retail price of basic food commodities – West Bank, in NIS. Source: WFP, Market Monitoring System. The VAM Market Price Survey is the primary means by which WFP collects commodity prices in the local 40. markets. The prices are collected during the first week of each month from retail shops in all governorates of the oPt. Retail price of basic food commodities – Gaza Strip, in NIS. Source: WFP, Market Monitoring System. The VAM Market Price Survey is the primary means by which WFP collects commodity prices in the local 41. markets. The prices are collected during the first week of each month from retail shops in all governorates of the oPt. Availability of basic commodities - Gaza Strip.Source : Ministry of National Economy, collected by WFP. Basic commodities refers to commercial food only (humanitarian stocks excluded). The availability of each 42. item is comparable to the estimated daily quantity of each item needed to cover the needs of the total population of the Gaza Strip. Quantities of food imported in the Gaza Strip. Source : Paltrade, collected by WFP. Basic commodities refers to commercial and humanitarian food being imported every month into the Gaza Strip. Each 43. commodity is compared to the estimated need in that specific commodity.
Fishing catch in the Gaza Strip. Source: Ministry of Agriculture, collected by WFP. Fish is the cheapest available animal protein source in the Gaza Strip. In addition, it contributes to the livelihoods of fisherfolk 44. and their families. According to the Oslo Accords, the Palestinians are granted a fish catch area within 20 nautical miles off the Gazan coastline. The GoI agreed under the 2002 Bertini Commitments to a fishing zone of 12 nautical miles. Fisherfolk are presently able to fish up to 6 nautical miles off the Gaza Strip coastline except at a 1.5 and 1 nautical mile exclusion zone to the north and south respectively.
Agriculture
The Humanitarian Monitoro c c u p i e d P a l e s t i n i a n t e r r i t o r y
Number 31 • Nov 2008 • 15
Water & Sanitation
2006 averages cover only data from 1 April - 31 December 2006. 45. Per capita use of water per day – in litres - West Bank. This is the average volume of water used per day per person (including domestic agriculture, domestic livestock and all loss). 46. Per capita use of water per day – in litres – Gaza Strip. This is the average volume of water used per day per person (including domestic agriculture, domestic livestock and all loss). 47. Price of tankered watered in the West Bank- in NIS. Prices are indicated in NIS to limit distortion due to frequent fluctuations of the exchange rate between the shekel and the dollar. 48. Price of tankered watered in the Gaza Strip - in NIS. Prices are indicated in NIS to limit distortion due to frequent fluctuations of the exchange rate between the shekel and the dollar. 49. Percentage of HH connected to water network paying their bills. These figures reflect the percentage of HH from which the municipality, due to capacity limitations, is able to collect payment. 50. Percentage of HH monthly income spent on sanitation services 51. 2006 averages cover only data from 1 June - 31 December 2006. 52. Cost recovery of water bills by village councils and Municipalities in the West Bank 53. Cost recovery of water bills by village councils and Municipalities in the Gaza Strip. 54.
Education Number of schools with at least one day of disruption – West Bank. Source: MoEHE, collected by UNICEF. The indicator “Complete disruption” indicates that all students and teachers were unable to reach 55. their schools and, therefore, the school was closed on that day. “Partial disruption” indicates that some students and/or teachers were unable to reach their schools and, therefore, some classes were not in session.
Number of schools with at least one day of disruption – Gaza Strip. Source: MoEHE. This indicator shows access to schools for students. 56.
Sources of Sector Quotationsa. Protection of Civilians: Inter Agency Standing Committee (IASC)
b. Child Protection: UNICEF
c. Violence: Protocol 1 Additional to the Geneva Conventions, Article 51
d. Access: Universal Declaration of Human Rights, Article 13
e. Access: International Covenant on Civil and Political Rights, Article 12 (1)
f. Socio Economic: Universal Declaration of Human Rights, Article 23
g. Health: WHO Constitution, 1948
h. Health: WHO
i. Food Security: FAO/WHO/WFP
j. Water and Sanitation: United Nations Committee on Economic, Social and Cultural Rights, General Comment No. 15 (November 2002)
k. Education: UNICEF