Http:// austinisd.org/academics/specialeduc/index.phtml 2011-2012.
47
http://austinisd.org/academics/ specialeduc/index.phtml 2011-2012
-
date post
21-Dec-2015 -
Category
Documents
-
view
215 -
download
0
Transcript of Http:// austinisd.org/academics/specialeduc/index.phtml 2011-2012.

http://austinisd.org/academics/specialeduc/index.phtml
2011-2012

Department of Special Education
2
STATE OF THE DISTRICT FOR SPECIAL EDUCATION
Janna Lilly, Director Special Education
August 2011

Department of Special Education
3
Meeting Purpose:To inform stakeholders of:
1) 2010-2011 Activities in Review2) Current Status of Critical Indicators3) 2011-2012 Goals for Improvement
Outcome: As a result of this information, stakeholders will understand what
has been done, where we are now and where we are going.
Alignment to AISD Strategic Plan

Department of Special Education
What Has Been Done?
4
5
• Tier 3 Reading
• Child study teams
• District Response to Intervention/Tiered Academic Plan
• ARRA funded bilingual speech training program
• Planning for all Rosedale teachers ESL certified
• Adding bilingual special education teacher at Rosedale
FOR STUDENTS:
6
FOR STUDENTS CONTINUED…
• Decreased wait time for In Home Training services to begin
• Reviewed all English Language Learners identified as Autistic
• 2011-2012 – piloting Social Behavior Skills model

7
• IEP Best Practice on line course
• On-going ARD/LPAC training
• District wide training for bilingual special education
teachers
• District RTI/Tiered Academic Plan
FOR EDUCATORS

8
•Campus IEP
• Special education curriculum specialists to differentiate curriculum
• 105 campus teams completed Model Inclusion Us+ training
• 6000 licenses for differentiated coursework to campuses
FOR EDUCATORS CONTINUED…

9
• Intensive summer professional development
• Standards ‘Improved and Aligned to Us+’
• 2 additional behavior specialists to be BCBA certified
• Summer PD – Behavior strategies for bus monitors
FOR EDUCATORS CONTINUED…

10
FOR PARENTS
• 1000+ home pre-literacy sessions with parents and PPCD students
•Advancement letters to students and parents
•SEEDs progress monitoring reports
•Spanish IEP piloted
11
FOR PARENTS
• 2 Community Forums
• Platicas, Co op
• SECAC
•Continue IEP at a Glance

12
• Stronger connections to: • General education curriculum• Social Emotional Learning (SEL) Initiative• Associate superintendents• Technology• Bilingual• Response to Intervention (RTI)
• Shifting responsibilities to general education:• Homebound• Nurses• Parent support• Funding
ORGANIZATIONAL
13
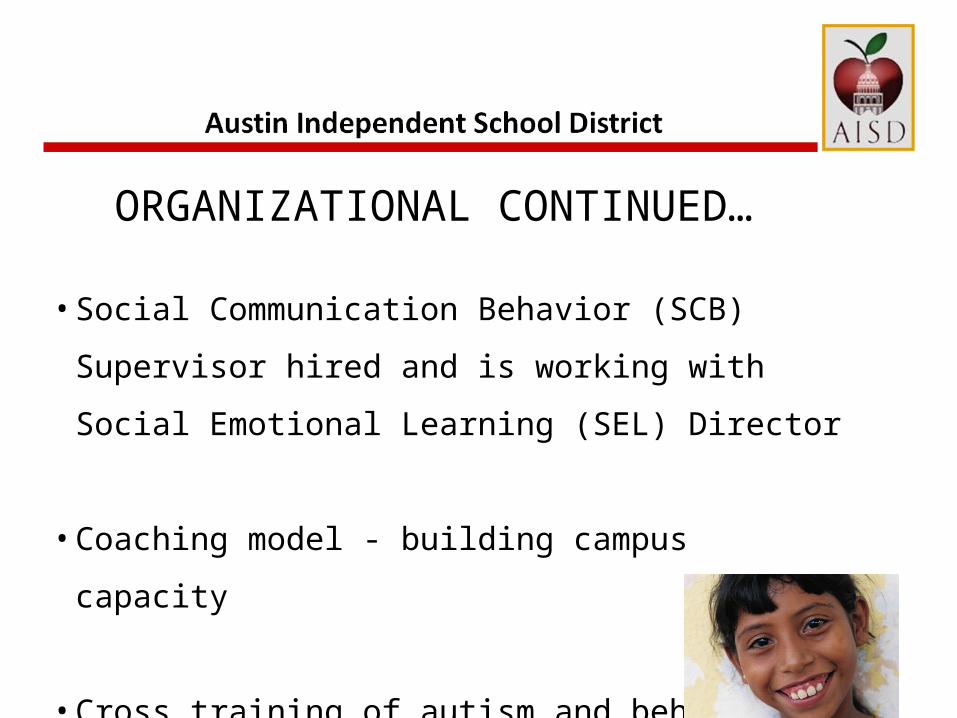
• Social Communication Behavior (SCB) Supervisor hired and
is working with Social Emotional Learning (SEL) Director
• Coaching model - building campus capacity
• Cross training of autism and behavior specialists
ORGANIZATIONAL CONTINUED…
14
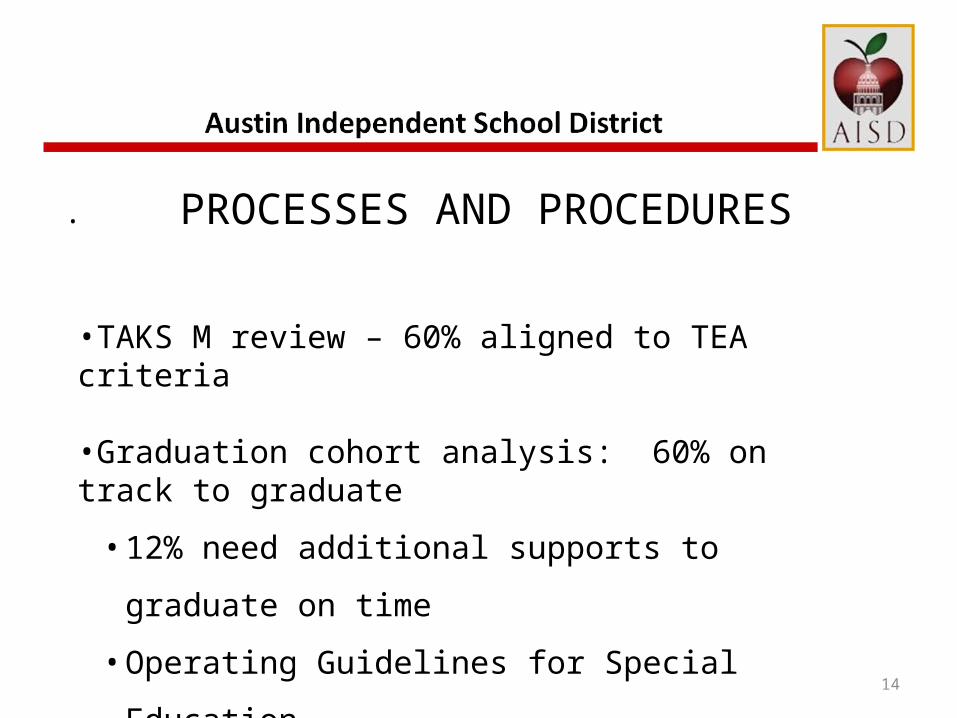
. PROCESSES AND PROCEDURES
•TAKS M review – 60% aligned to TEA criteria
•Graduation cohort analysis: 60% on track to graduate
• 12% need additional supports to graduate on time
• Operating Guidelines for Special Education.
15
.PROCESSES AND PROCEDURES CONTINUED…
Equitable Staffing Distribution:
• SOP 2 – Tiered staffing model

Where Are We Now?
Academic OutcomesParent outcomes
Compliance outcomes
16
17
ACADEMIC OUTCOMES
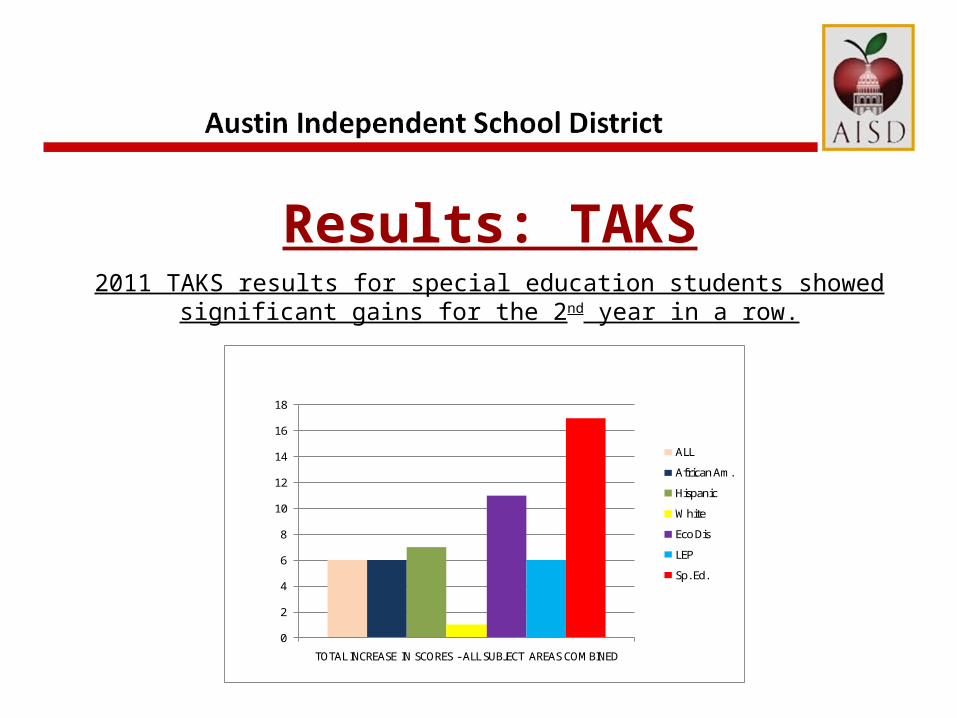
Results: TAKS2011 TAKS results for special education students showed significant gains for the
2nd year in a row.
0
2
4
6
8
10
12
14
16
18
TOTAL INCREASE IN SCORES - ALL SUBJECT AREAS COMBINED
ALL
African Am.
Hispanic
White
Eco Dis
LEP
Sp. Ed.
19
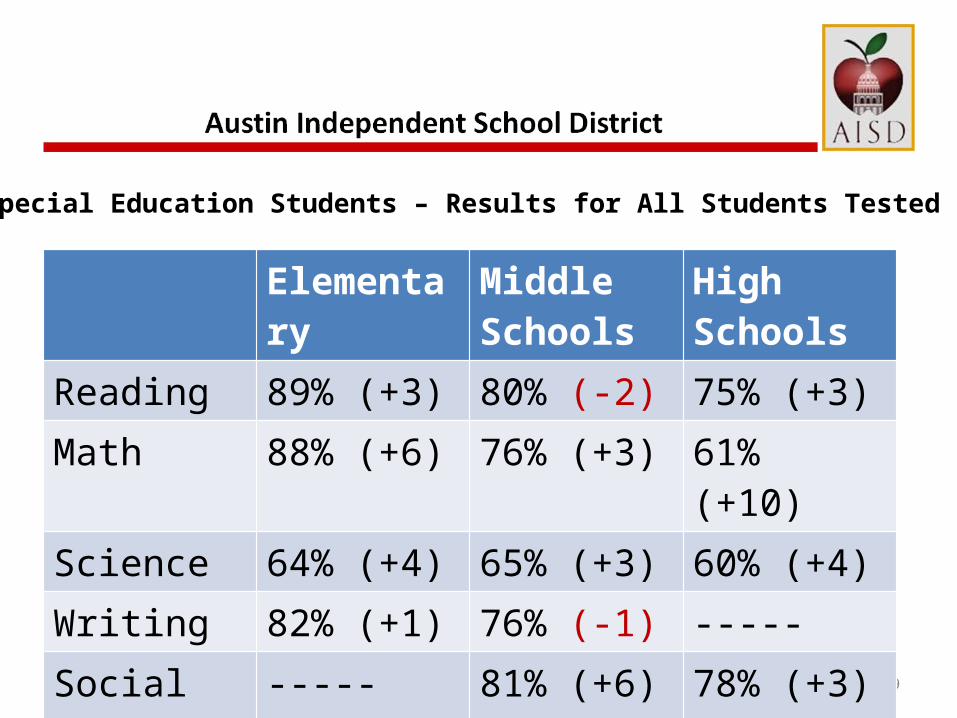
Elementary Middle Schools
High Schools
Reading 89% (+3) 80% (-2) 75% (+3) Math 88% (+6) 76% (+3) 61% (+10) Science 64% (+4) 65% (+3) 60% (+4) Writing 82% (+1) 76% (-1) ----- Social Studies
----- 81% (+6) 78% (+3)
Special Education Students – Results for All Students Tested
20
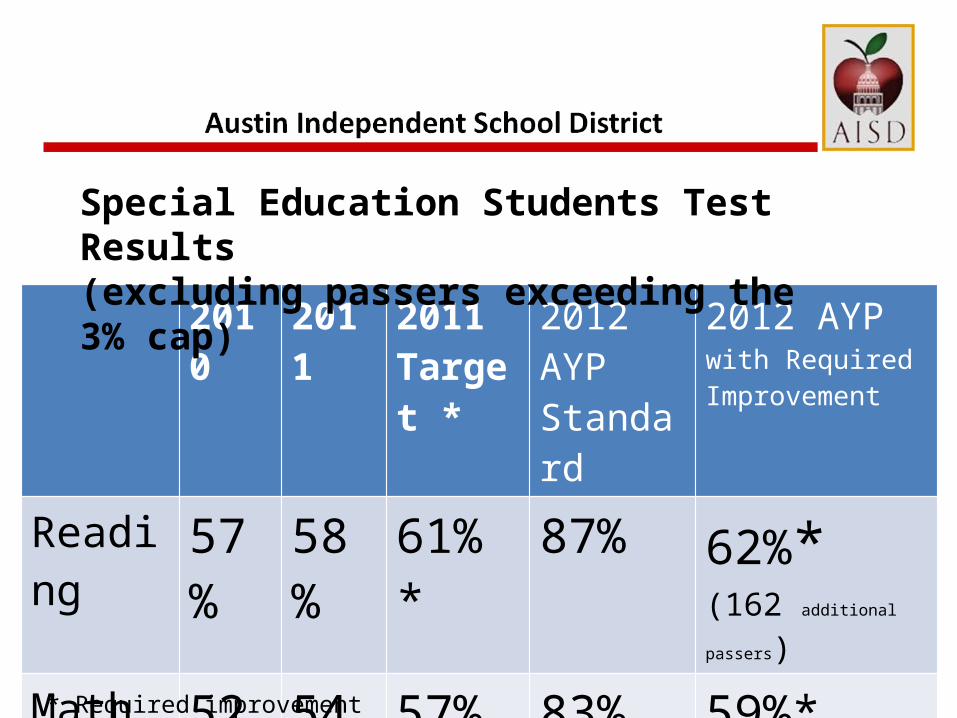
2010 2011 2011 Target *
2012 AYP Standard
2012 AYP with Required Improvement
Reading 57% 58% 61% * 87% 62%*(162 additional passers)
Math 52% 54% 57% * 83% 59%*(200additional passers)
Special Education Students Test Results(excluding passers exceeding the 3% cap)
* Required improvement target
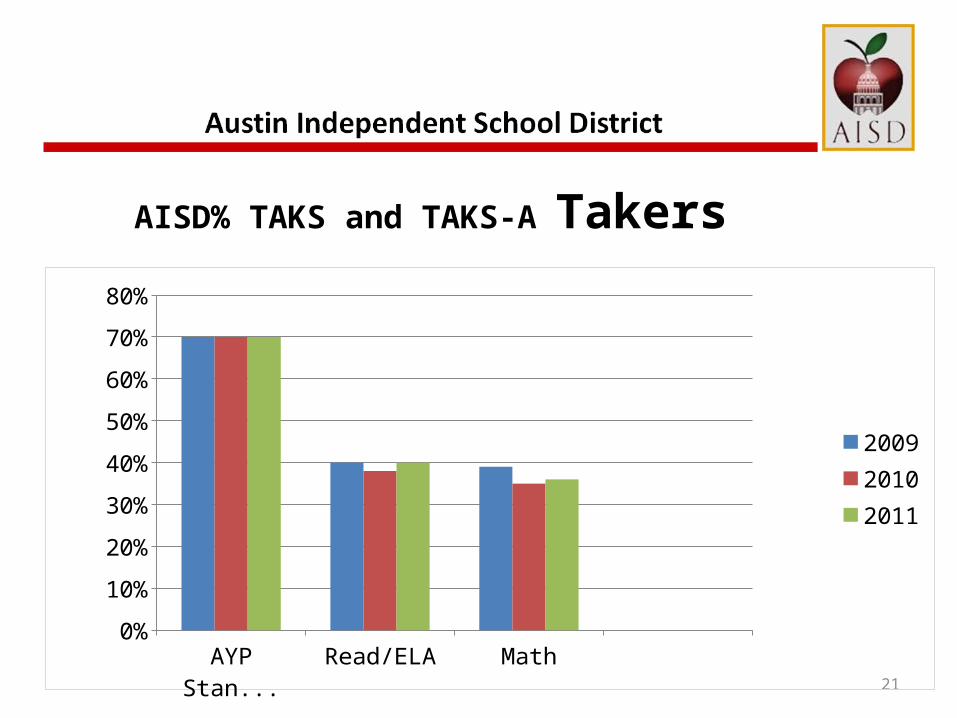
21AYP Standard Read/ELA Math
0%
10%
20%
30%
40%
50%
60%
70%
80%
200920102011
AISD% TAKS and TAKS-A Takers

22
AISD Will NOT Meet AYP
Results: TAKS
Need 70% of special education students on each campus taking and passing the the non-modified assessment.
Consequences to a ‘modified’ assessment decision:If the child takes a modified assessment, they are automatically1) Graduating on a minimum plan2) Loose all access to a 4 year college3) 3rd grade sets the stage for the child’s life4) 9th grade is generally too late to change to a
non modified assessment5) ‘Pobrecito’ versus high expectations

23
Results: LRE
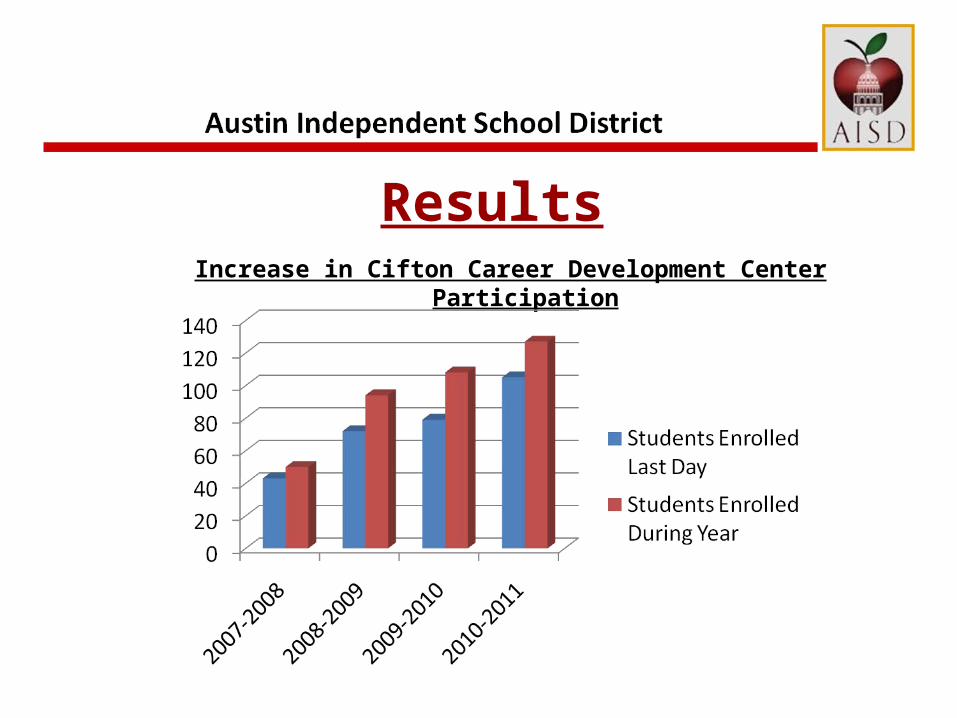
ResultsIncrease in Cifton Career Development Center Participation

25
Results: Sp. Ed. Graduation Rates
Class of 2008 Class of 2009 Class of 2010 Comparison0.00%
10.00%
20.00%
30.00%
40.00%
50.00%
60.00%
70.00%
80.00%
200820092010State StandardEl PasoFt. WorthDallasSan AntonioTexas

26
PARENT OUTCOMES
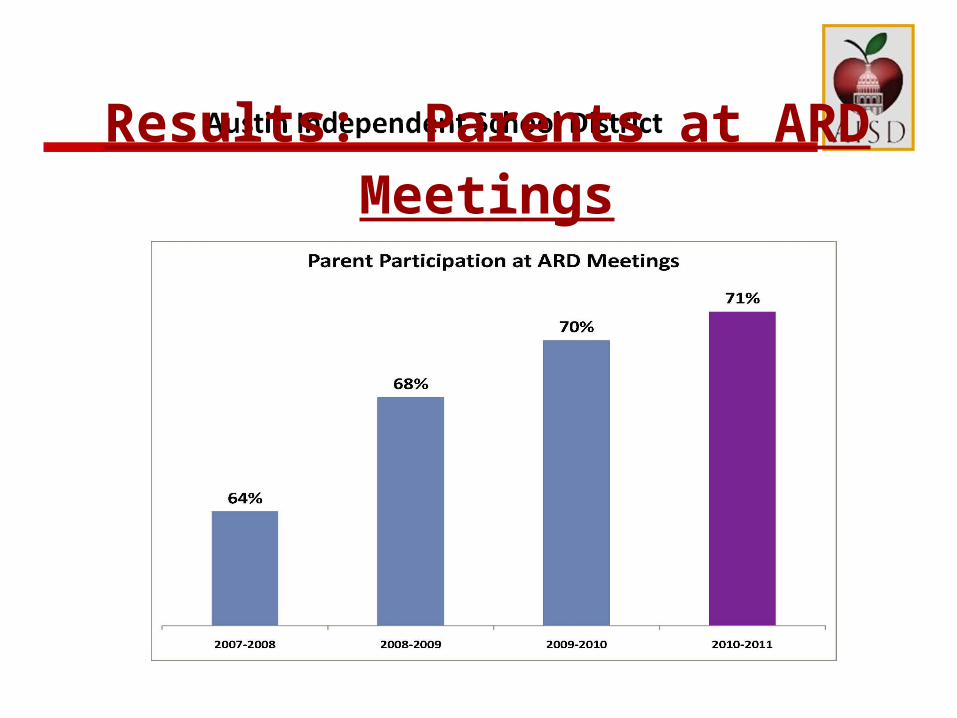
Results: Parents at ARD Meetings

28
Results: Parents Receiving ARD Notice31+ Days or No Notice prior to ARD Meeting
2%

Results: Parent SurveySPP 8 Results - Increase in parent satisfaction survey
:

30
Compliance Outcomes

31
IMPROVEMENTS HAVE BEEN MADE IN EVERY FEDERAL100% COMPLIANCE AREA SINCE 2007
SPP 11 SPP 12 SPP 130
20
40
60
80
100
120
2007-20082008-20092009-20102010-2011
Results: Federal Compliance

32
Results: Discretionary Discipline Placement Percent
DAEP ISS OSS0.00%5.00%
10.00%15.00%20.00%25.00%30.00%35.00%
SWDAll Students

33
Where Are Going?

34
2011 Vision: AISD will be nationally recognized for providing all students who receive special education services with a high quality educational experience that
promotes their independence and individual success.
Mission:
The Department of Special Education exists to design and deliver quality supports that ensure:
• Students are successful,• Parents are partners and
• Educators are empowered.
35
Students are Successful as Evidenced by:
S1- S10

36
By Sept. 1 2012, special education students district wide will be successful as evidenced by:
S1. 2% increase in SWD graduation rate from 2011 cohort to 2012 cohort
S2. 10 % increase in SWD participating in reading STAAR 10% increase in SWD participating in math STAAR
S3. Increase STAAR passing rate for reading to 62% and math to 59% (passing rate in STAAR not available until Nov. 2012)
S4. Increase completion of IEP goals to 50%
S5. 1% decrease in difference rate for discretionary DAEP removals
S6. 5 % decrease in discretionary ISS removals
S7. 5 % decrease in discretionary OSS removals

37
S8. An increase to 66% of SWD served 80% or more of day in general education
S9. Secondary Campuses set quantitative targets to increase enrollment of SWD in extracurricular classes (ie band, athletics, drama, yearbook etc)
S10. Campuses set quantitative targets to increase participation of SWD % in school organizations/clubs/identified social opportunities
S11a - 10% reduction of staff assigned to campuses for intensive supports S11b –10% reduction in total temp assignments provided
Continued…By Sept. 1 2012, special education students district wide will be successful as evidenced by

38
Parents are Partners as Evidenced by:
P1 – P8

39
By July 1 2012, special education parents are partners as evidenced by:
P1. 75% of ARDs have a parent in attendance
P2. 5% increase in parent attendance at community events including Co- op, community forums, Platicas
P3. 25% (11) decrease in due process cases (formal mediation, TEA complaints, filed hearings)
P4. 25% decrease in number of parents who file for any type of due process listed above
40
Continued: By July 1 2012, special education parents are partners as evidenced by:
P5. SECAC campus parent rep program established on 8 campuses
P6. SECAC membership increase to 12 members that includes 2 ELL parents
P7. 82% of parents surveyed in SPP indicator 8 indicate satisfaction with special education services
P8 100% of Spanish speaking families will received the IEP in Spanish: either audio or written copy
41
Educators are Empowered as Evidenced by:
E1 – E16

42
By July 1 2012, educators are empowered as evidenced by:
E1. .5% reduction in identification rate
E2. Increase to 70% of ARDs that provide parent 7-30 day notice
E3. Increase % of students ages 16 and above with an IEP that includes measureable post secondary goals to 96%
E4. ______% of random IEP sampling reflect meaningful PLAAFP and measureable IEP goals
43
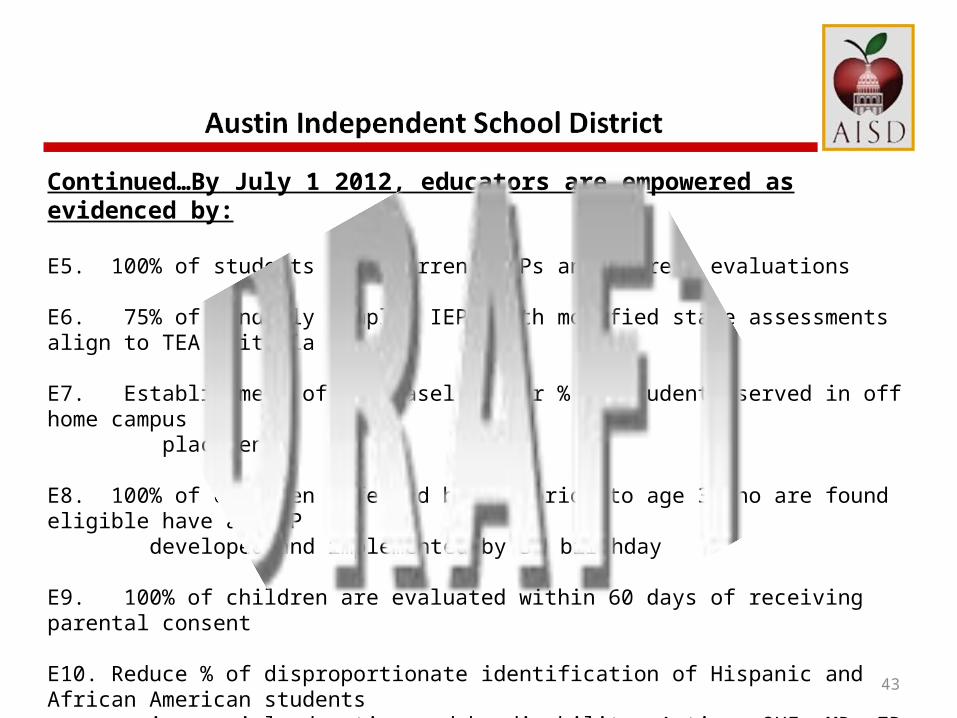
Continued…By July 1 2012, educators are empowered as evidenced by:
E5. 100% of students have current IEPs and current evaluations
E6. 75% of randomly sampled IEPs with modified state assessments align to TEA criteria
E7. Establishment of new baseline for % of students served in off home campus placements
E8. 100% of children referred by ECI prior to age 3 who are found eligible have an IEP developed and implemented by 3rd birthday
E9. 100% of children are evaluated within 60 days of receiving parental consent
E10. Reduce % of disproportionate identification of Hispanic and African American students in special education and by disability: Autism, OHI, MR, ED, LD
E11. Reduce % difference between district representation rate and special identification rate for African American students in special education to 5.9%.

44
Continued…By July 1 2012, educators are empowered as evidenced by:
E12. Creation and implementation of SOPs (Standard Operating Procedures) for: a) Purchasing and contracting b) IEP assessment manual c) Hiring procedures d) Related services manual e) Due process debrief
E13. Support responsibilities shifted from special education to other district departments: a) Nursing to Student Health Services b) Homebound to Community & Family Education c) FASST to Community and Family Education d) ASH – to ALC Principal e) Funding to State & Federal Accountability f) 504 Assistive Tech to 504
45
Continued…By July 1 2012, educators are empowered as evidenced by:
E14. MAPS are created, distributed, trained on and implemented in 5 critical compliance areas
E15 Identify performance measures in the appraisals of principals, teacher, support staff appraisals to use performance measures
E16 Improve systems to reduce paperwork for teachers

So What Do We Do With This Information?
1. Spread the good news!2. Attend SECAC meeting. Consider application. 3. Attend those ARDs. 4. Encourage others to attend ARDs.5. Attend Co-op meetings to stay current on STAAR etc.6. Promote efficiency and advocate for rights.
For More Information Contact:Janna Lilly

47
Never doubt that a small group of thoughtful, committed people can change the world. Indeed, it is the only thing that ever has.
~Margaret Meade