HTF Venting System - Mojave
29
E LLISON , S CHNEIDER &H A RRIS L.L.P. CHRISTOPHER T. ELLISON ANNE J. SCHNEIDER JEFFERY D. HARRIS DOUGLAS K. KERNER ROBERT E. DONLAN ANDREW B. BROWN GREGGORY L. WHEATLAND CHRISTOPHER M. SANDERS LYNN M. HAUG PETER J. KIEL A TTORNEYS AT L AW 2600 CAPITOL AVENUE, SUITE 400 SACRAMENTO, CALIFORNIA 95816 TELEPHONE (916) 447-2166 FAX (916) 447-3512 ELIZABETH P. EWENS, OF COUNSEL BRIAN S. BIERING TERESA W. CHAN SHANE E. CONWAY KATHRYN C. COTTER JEDEDIAH J. GIBSON CHASE B. KAPPEL SAMANTHA G. POTTENGER February 2, 2010 Commissioner Anthony Eggert, Presiding Member Vice Chair James D. Boyd, Associate Member Mr. Craig Hoffman, Project Manager Abengoa Mojave Solar Project (09-AFC-5) California Energy Commission 1516 Ninth Street Sacramento, CA 95814 Re: Abengoa Mojave Solar Project (09-AFC-5): Second Supplemental Written Response to Data Request Set 1A (Nos. 1-93) for Air Quality and Public Health Dear Commissioners Eggert and Boyd: Abengoa Solar Inc. (“the Applicant”) hereby files these written responses to certain Data Requests in Set 1A promulgated by Staff on October 22, 2009. The Applicant requested additional time to respond to several Data Requests in Set 1A regarding Air Quality and Public Health in a Notice filed on November 11, 2009 and has discussed the need for additional time for this second supplemental response with Staff and the Project Manager. This supplemental response contains responses to the remaining outstanding requests: Data Requests 17 and 85. In addition, this supplemental response contains revised responses to the following: Data Requests 3, 6, 8, 10, 12, 13, 15, 16, 18, 19, 23, 25, 30, 83 and 86. The Applicant appreciates Staff’s time and efforts reviewing the enclosed materials. The Applicant looks forward to continuing to work with Staff as the project moves forward to achieve complete and satisfactory resolution of all issues in a timely manner. Thank you for your time and consideration of this matter. Sincerely, Christopher T. Ellison Shane E. Conway Attorneys for Abengoa Solar Inc. Attachment DOCKET 09-AFC-5 DATE FEB 02 2010 RECD. FEB 02 2010
Transcript of HTF Venting System - Mojave
E L L I S O N , S C H N E I D E R & H A R R I S L . L . P . CHRISTOPHER T. ELLISON
ANNE J. SCHNEIDER
JEFFERY D. HARRIS
DOUGLAS K. KERNER
ROBERT E. DONLAN
ANDREW B. BROWN
GREGGORY L. WHEATLAND
CHRISTOPHER M. SANDERS
LYNN M. HAUG
PETER J. KIEL
A T T O R N E Y S A T L A W
2600 CAPITOL AVENUE, SUITE 400 SACRAMENTO, CALIFORNIA 95816
TELEPHONE (916) 447-2166 FAX (916) 447-3512
ELIZABETH P. EWENS, OF COUNSEL
BRIAN S. BIERING
TERESA W. CHAN
SHANE E. CONWAY
KATHRYN C. COTTER
JEDEDIAH J. GIBSON
CHASE B. KAPPEL
SAMANTHA G. POTTENGER
February 2, 2010 Commissioner Anthony Eggert, Presiding Member Vice Chair James D. Boyd, Associate Member Mr. Craig Hoffman, Project Manager Abengoa Mojave Solar Project (09-AFC-5) California Energy Commission 1516 Ninth Street Sacramento, CA 95814
Re: Abengoa Mojave Solar Project (09-AFC-5): Second Supplemental Written Response to Data Request Set 1A (Nos. 1-93) for Air Quality and Public Health
Dear Commissioners Eggert and Boyd: Abengoa Solar Inc. (“the Applicant”) hereby files these written responses to certain Data Requests in Set 1A promulgated by Staff on October 22, 2009. The Applicant requested additional time to respond to several Data Requests in Set 1A regarding Air Quality and Public Health in a Notice filed on November 11, 2009 and has discussed the need for additional time for this second supplemental response with Staff and the Project Manager. This supplemental response contains responses to the remaining outstanding requests: Data Requests 17 and 85. In addition, this supplemental response contains revised responses to the following: Data Requests 3, 6, 8, 10, 12, 13, 15, 16, 18, 19, 23, 25, 30, 83 and 86. The Applicant appreciates Staff’s time and efforts reviewing the enclosed materials. The Applicant looks forward to continuing to work with Staff as the project moves forward to achieve complete and satisfactory resolution of all issues in a timely manner. Thank you for your time and consideration of this matter. Sincerely, Christopher T. Ellison
Shane E. Conway Attorneys for Abengoa Solar Inc.
Attachment
DOCKET09-AFC-5
DATE FEB 02 2010
RECD. FEB 02 2010
Data Request 1A Response
Table of Contents
Table of Contents ........................................................................................1
Air Quality ...................................................................................................2
Public Health..............................................................................................16
February 2, 2010 1 Mojave Solar Project
Data Request Response
Air Quality
Item 3 (Revised):
Information Required:
Please explain the MRI level 2 fugitive dust emission calculation approach and provide information that clearly shows that this emission estimation method does not significantly underestimate or overestimate emissions in comparison with a calculation approach for fugitive dust emissions based on a more detailed activity by activity analysis.
Response:
We are not aware of any guidance provided by the South Coast AQMD that indicates that the MRI Study is not appropriate for use. The South Coast Air Quality Management District (SCAQMD) CEQA Handbook is undergoing revisions, but to date we have not seen any proposed or revised text which changes the existing handbook sections, methods, or procedures regarding fugitive dust emissions estimations from construction projects. Notwithstanding the foregoing, although the SCAQMD may no longer use the method or approach, this does not mean that it is invalid or barred from use by others in producing construction emissions estimates. The proposed project is in San Bernardino County (within Mojave Desert Air Quality Management District (MDAQMD)), so the application of the method is not subject to any policy decisions made within and for the SCAQMD. We do note that all of the Fugitive Emissions Mitigations tables currently available from the SCAQMD rely upon the WRAP Fugitive Dust Handbook dated 9-7-06 (which we believe is the most recent version of this document), and that the WRAP Handbook (Chapter 3-Construction and Demolition) specifically relies upon the MRI study procedures and conclusions used in our analysis, i.e., (1) Improvement of Specific Emissions Factors-BACM #1, MRI, 3/96, (2) Estimating Particulate Matter Emissions from Construction Operations, USEPA, MRI, 9/99, and (3) MRI Report of 2005 which updates the PM2.5/PM10 ratios developed for WRAP. Additionally, we note that the current version of Urbemis (Ver 9.2.4), as well as earlier versions also rely solely upon the MRI BACM (3/96) report for calculating fugitive dust emissions. Urbemis is used, not only statewide in California, but in other states as well, and in numerous CEQA guidelines published by both planning and air quality jurisdictions within California, Urbemis is either required or strongly recommended for computing/estimating project construction fugitive dust emissions and other construction related emissions estimates. Furthermore, we note the following:
1. A search of the SCAQMD website shows a total of 12 guidance documents available, none of which address any new guidance on fugitive dust emissions calculations.
2. The AQMD prepared the CEQA Air Quality Handbook in April 1993, and made minor revisions in November 1993. Copies of this handbook can be obtained by contacting AQMD's Subscription Services.
February 2, 2010 2 Mojave Solar Project
Data Request 1A Response
February 2, 2010 3 Mojave Solar Project
The SCAQMD states: “While the Handbook is under revision, it is recommended that the lead agency follow the calculation methodologies in Chapter 9 and the Appendix to Chapter 9 in the Handbook. Other methodologies can be used as long as documentation is provided regarding the source and applicability to the project.” Obsolete sections of the current Handbook are as follows: “Lead agencies should also be aware that the on-road mobile source emission factors in Table A9-5-J1 through A9-5-L are obsolete. The most current on-road mobile source emission factors can be found at the California Air Resources Board (CARB) website. The AQMD also recommends that the lead agency avoid using the screening tables in the Handbook’s Chapter 6 for the following reasons: a. The tables were derived using an obsolete version of CARB's mobile source emission factors inventory (EMFAC7E) instead of the currently approved version (EMFAC2007), and, b. The trip generation characteristics of the land uses identified in the Chapter 6 screening tables were based on the fifth edition of the ITE Trip Generation Manual. The most current version of this manual is the sixth edition.”
3. CEC staff indicates that the MRI BACM method is no longer supported by SCAQMD, but yet the exact language from the SCAQMD website (see below, obtained on 11-18-09) clearly recommends the use of Urbemis, which is based upon the MRI BACM methodology, as noted in our earlier comments.
“In conjunction with the Handbook, the AQMD developed the Mobile Assessment for Air Quality Impacts (MAAQI) to calculate emissions from land use projects. The AQMD recommends against using the MAAQI model for the same two reasons identified above. The AQMD recommends using other approved models for this purpose, such as the URBEMIS 20071 model. The screening tables should no longer be used under any circumstances because they are based on obsolete mobile source emission factors and trip generation data. The reader should use the methodologies in the Appendix to Chapter 9 of the CEQA Air Quality Handbook or use a land use model, such as URBEMIS2. Other air quality analysis methodologies not in the CEQA Air Quality Handbook are acceptable as long as they are well documented, including source(s), assumptions, equations used, calculations, etc.” Therefore the method approach is considered to be both sound and widely accepted. The MRI Level 2 analysis procedure was used to “estimate” fugitive particulate emissions from general construction activities. Per the WRAP Handbook, general construction
1 http://www.aqmd.gov/ceqa/urbemis.html 2 http://www.aqmd.gov/ceqa/faq.html#What is the URBEMIS model, and what is it used for?
Data Request Response
activities include land clearing, drilling, blasting, ground excavation, cut and fill operations, as well as demolition and debris removal, site preparation (earth moving) activities, and other general construction activities. The Level 2 procedure expands upon the Level 1 analysis by further refining the emissions factor for general construction activities and adding an emissions factor and calculation procedure for cut and fill operations. These are exactly the types of construction activities proposed at the Abengoa Mojave Solar site. The emissions factors presented in the WRAP Handbook (Table 3-2) for the Level 2 analysis procedure are: 0.011tons PM10/acre-month for general construction (for each month of construction activity), and 0.059 tons PM10/1000 yd3 for cut and fill operations (onsite). In the revised emissions calculations, the applicant has replaced the MRI cut and fill methodology with the following: (a) soil handling emissions from cut and fill activities have been estimated using the AP-42, Section 13.2.4, equation #1 with site-specific data on wind speed, soil moisture, number of soil drops, etc. This procedure was used in the Palen Solar Power Plant (PSPP) project (Appendix E-2. Volume II, AFC, August 2009). In the PSPP calculations, a soil moisture of 15% was used, with no further reductions due to watering. In our revised calculation, the site soil moisture value per the geotechnical report was averaged at 3%; and since watering is being used, a reduction of 60% (per the SCAQMD mitigation tables) was applied. Per the original BACM (MRI, 1996), the 0.011 tons/acre-month factor was based on an activity level of 168 hours per month. We note that the MRI report indicates that the SCAQMD uses a general Level 1 construction factor (worst-case) of 0.42 tons/acre-month, which is based upon detailed information developed in that air basin, and that CARB states this factor should be reduced to 0.11 tons PM10/acre-month for other areas of the state where the detailed data is not available. Per WRAP, the PM2.5/PM10 ratio for fugitive construction dust is 0.1, which results in the Level 2 factor of 0.011 tons PM10/acre-month. Therefore, the MRI Level 2 factors were used in the fugitive dust emissions estimates. The 0.011 ton PM10/acre-month value was linearly scaled up to a value of 0.0144 tons/PM10/acre-month to more accurately represent an emissions factor for the proposed project work period. Neither the project proponent, nor anyone else to our knowledge, is able to conclusively show that any chosen method for the computation of fugitive dust emissions from construction activities significantly under or over-estimates such emissions. The method chosen is both technically justified and approved for use via a number of references as noted above. The attached CD contains copies of all the documents referenced in the above comments.
Item 6 (Revised Tables provided):
Information Required:
Please revise the fugitive dust calculations to reflect the available on-site surface/near surface silt content data.
February 2, 2010 4 Mojave Solar Project
Data Request 1A Response
Response:
The fugitive dust emissions calculations which rely upon soil silt content have been reviewed and updated. Revised Tables C.5-5, C.5-6, C.5-7, and C.1-7 are provided electronically in the attached file “DR_1A_6_Tables_Revised 1-28-2010.zip.”
Item 8 (Revised):
Information Required:
Please provide the electronic versions of the emission spreadsheets with the embedded calculations.
Response:
The data spreadsheets are supplied in “locked” .xls format. The calculations within each spreadsheet can be easily followed and are readily confirmable.
Item 10 (Revised):
Information Required:
Please provide the original equipment usage estimates provided by the applicant to the applicant’s air quality consultant.
Response:
The original and recently updated equipment list and usage estimates provided by the Applicant to the consultant staff are delineated in revised Tables C.5-6 and C.5-7 (attached).
Item 12 (Revised):
Information Required:
Please re-evaluate the off-road equipment schedule to provide a corrected worst-case, not average case, daily onsite emissions estimate.
Response:
The Applicant has provided revised construction equipment data (see the attached revised Tables C.5-5, C.5-6, and C.5-7 for the revised data and resultant emissions estimates). Table C.5-5 (Construction Equipment Exhaust Emissions, page 4) indicates the estimated average daily and estimated maximum daily exhaust emissions values, which provides that requested worst-case daily emissions estimate. The construction emissions summary tables at the end of these responses also presents the applicant’s best estimate for overall daily maximum emissions.
February 2, 2010 5 Mojave Solar Project
Data Request Response
Item 13 (Revised):
Information Required:
Please describe how the trip distance assumptions for construction were determined for each vehicle type/use.
Response:
Table C.5-7 (revised) indicates the types of vehicles, numbers of vehicles, and estimated mileages for vehicles proposed for construction support activities. Vehicle mileages are based on a round trip length of 55 miles from the Barstow urban area (which includes the Barstow rail yard site).
The 55 mile round trip distance is conservative, since the Barstow urban area, as well as the Barstow rail yard, are approximately 27 miles from the project site.
See the Socioeconomic section of the AFC for further discussion of labor issues, etc.
Item 14 (Revised):
Information Required:
For each of the construction materials delivery/waste removal truck trip types, please provide the following information:
A. The types and quantities of construction materials delivered to the site and wastes hauled from the site,
B. The types of delivery trucks that will be used to deliver these materials, C. The number of delivery trucks on a daily basis for each of these materials, and D. The number of miles traveled round trip daily for each vehicle used for project
construction within the Mojave Desert Air Quality management District (MDAQMD) jurisdictional portion of San Bernardino County, for each of these materials.
Response:
(A) Tables C.5-5 and C.5-7 break out the quantities and materials delivered to the site for each month. This general breakdown is the best estimate that can be provided at this time based on the preliminary construction materials takeoff. (B) Table C.5-7 (original and updated versions) indicates the types of vehicles to be used to support construction, including site deliveries. (C) Tables C.5-5 and C.5-7 (original and updated versions) delineate the estimated numbers of delivery vehicles for any given month/day during the construction period. (D) A 55-mile round trip was assumed for all deliveries. Worker travel was assumed at a 60-mile round trip distance, i.e., 60 miles round trip for those workers not using the bus service, and 60 miles round trip for workers accessing the bus yard. The round trip distance used for the buses was 50 miles (bus staging area to site round trip is actually 46 miles).
February 2, 2010 6 Mojave Solar Project

Data Request 1A Response
Item 15 (Revised):
Information Required:
Please include the personal vehicle trip mileage, necessary for construction employees to get to the assumed construction employee busing locations, in the construction emission estimate.
A. Please estimate the on-site whole round trip travel including unpaved road travel and corresponding emissions for all on-road construction vehicles, including heavy duty delivery trucks, light service and delivery trucks, personal vehicles and buses, etc. necessary to complete the construction activities throughout the project site.
B. Please correct, based on revisions to the round-trip distance assumptions, the on-road (paved and unpaved) vehicle tailpipe and fugitive dust emissions.
Response:
The applicant has included this mileage in the worker travel VMT (Table C.5-5), based upon the following assumptions:
Average number of workers on site per day = 830
Average number of workers bussed per day = 576
Average number of workers not bussed per day = 254
Assumed round trip distance for workers using the bus yard = 60 miles (30- mile radius around the bus yard encompasses the entire Barstow urban and non-urban area).
Assumed round trip distance for non-bussed workers = 60 miles
Total daily VMT ~= 49,800
Total period VMT ~= 27,838,200
(A) The emissions from on-site unpaved road use during construction is included in the overall site fugitive dust and equipment exhaust calculations presented in Table C.5-5 for all phases of project construction, i.e., rough grading and site preparation, finish grading, power block erection, and solar field erection (See response to data request #3). Emissions from delivery vehicles, light duty support vehicles, worker vehicles, and buses are also included in Table C.5-5 (tables included with Data Request Item 6). (B) The emissions for construction activities (fugitive dust and equipment exhaust) have been revised (see Tables C.5-5, C.5-6, and C.5-7) (tables included with Data Request Item 6).
February 2, 2010 7 Mojave Solar Project
Data Request Response
Item 16 (Update):
Table C.5-5 has been revised and should be referred to in the review of this Data Response.
Item 17 (Initial response):
Information Required:
Please explain the rationale as to why the locations for the volume and area source emission inputs did not change from short-term to annual modeling, or please provide annual construction modeling that matches the extent of annual construction activities.
Response:
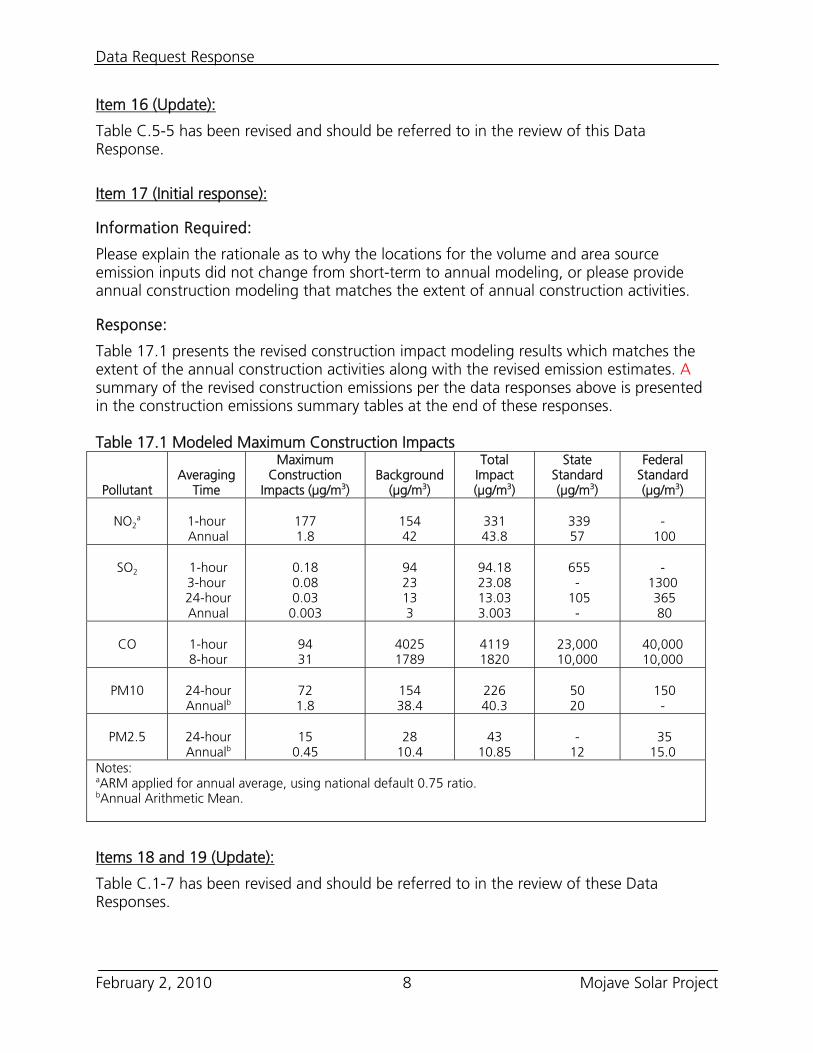
Table 17.1 presents the revised construction impact modeling results which matches the extent of the annual construction activities along with the revised emission estimates. A summary of the revised construction emissions per the data responses above is presented in the construction emissions summary tables at the end of these responses. Table 17.1 Modeled Maximum Construction Impacts
Pollutant
Averaging
Time
Maximum Construction
Impacts (μg/m3) Background
(μg/m3)
Total Impact (μg/m3)
State Standard (μg/m3)
Federal Standard (μg/m3)
NO2
a
1-hour Annual
177 1.8
154 42
331 43.8
339 57
-
100
SO2
1-hour 3-hour
24-hour Annual
0.18 0.08 0.03
0.003
94 23 13 3
94.18 23.08 13.03 3.003
655
- 105
-
-
1300 365 80
CO
1-hour 8-hour
94 31
4025 1789
4119 1820
23,000 10,000
40,000 10,000
PM10
24-hour Annualb
72 1.8
154 38.4
226 40.3
50 20
150
-
PM2.5
24-hour Annualb
15
0.45
28
10.4
43
10.85
-
12
35 15.0
Notes: aARM applied for annual average, using national default 0.75 ratio. bAnnual Arithmetic Mean.
Items 18 and 19 (Update):
Table C.1-7 has been revised and should be referred to in the review of these Data Responses.
February 2, 2010 8 Mojave Solar Project
Data Request 1A Response
Item 23 (Revised):
Information Required:
Please estimate the whole round trip travel including any onsite unpaved road travel.
Response:
Table C.1-7 and the Support table which accompanies it (tables included with Data Request Item 6), provides detailed estimates of onsite vehicle use, annual mileage rates, and a breakdown of onsite travel on paved versus unpaved roads. As provided in the Traffic and Transportation section of the AFC (Section 5.13), the Applicant estimates that the facility during the operations phase will have up to 38 deliveries per month, or 1.26 deliveries per day. These deliveries and hauls will be made by vehicles and service providers not under the control of the facility. It is estimated and assumed that deliveries to the site will be part of a normal or day specific delivery route that is controlled by the service provider, and as such the Applicant has no way of breaking out any mileage values beyond the nearby region of the site, which is the mileage that would be specifically allocated to the project site. In addition, the Applicant notes that these emissions are not included in an applicability analysis for imposition of NSR or PSD, nor are they included in the stationary source emissions tabulation for purposes of determining offset requirements per the MDAQMD rules, etc. Emissions for this category of vehicle use are based on the following assumptions:
38 deliveries per average operations month
Roundtrip distance of 55 miles assuming use of Harper Lake Road for all delivery ingress and egress.
Annual mileage from these deliveries will be 25,080 VMT. 50% or 12,540 VMT will be allocated to gasoline vehicles, and 50% or 12,540 VMT will be allocated to diesel vehicles. The emissions from operations delivery vehicles are presented in Table C.5-5 (table included with Data Request Item 6).
Employee commute emissions and assumptions are provided on the Support table to Table C.1-7 (table included with Data Request Item 6).
Item 25 (Update):
Table C.1-7 has been revised and should be referred to in the review of this Data Response.
February 2, 2010 9 Mojave Solar Project
Data Request Response
Item 30 (Revised):
Information Required:
Please identify whether the applicant is willing to stipulate to the incorporation of a carbon adsorption, or other VOC control system, to control VOC emissions from the HTF expansion system venting by at least 98 percent. If unwilling to stipulate to this condition, please identify the basis for this position.
Response:
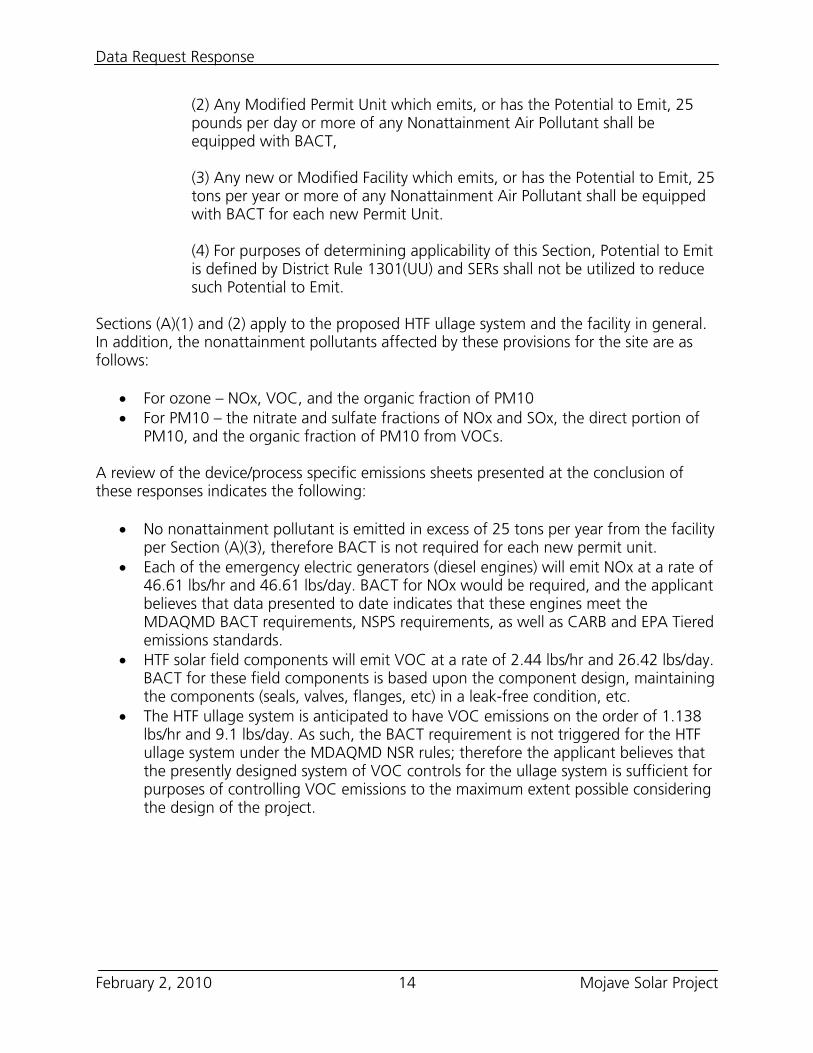
The Applicant proposes the following system for VOC control from the HTF expansion system, which will achieve a minimum overall VOC emissions control efficiency of 98%. NITROGEN VENTING OF THE HEAT TRANSFER FLUID SYSTEM HTF Expansion System Basis The heat transfer fluid (HTF) will be either Therminol VP-1 produced by Solutia, Inc. or Dowtherm A produced by Dow Chemical Company. Both materials are comprised of diphenyl oxide (73-73.5%) and biphenyl (26.5-27%). These materials in gaseous form represent VOCs with biphenyl and are classified as a hazardous air pollutant (HAP). The Mojave project has two identical Alpha and Beta plants. The numbers on the following flow diagram are totals for both plants together. The HTF system of each plant will consist of 5 vertical ASME-rated expansion tanks, one nitrogen-condensing ASME-rated tank (same size as expansion tank) and two vertical HTF storage tanks. These expansion tanks and the nitrogen condensing tanks will be sized such that during normal operation the expansion/contraction of the HTF will be kept within these tanks and an initial fill of nitrogen will also be kept within tanks by allowing the nitrogen/vapor space pressure to vary from 3 bara to 11 bara nominally. However, after filling all pipes initially at ambient temperature (with high density – lower specific volume), the expansion of the HTF from the ambient temperature to the daily operating temperatures will push the HTF that is not needed in the system during daily operation from the expansion tanks into two storage tanks that will be kept cooler (at about 165 °F) and blanketed with 2-15 inches Water Column (in. WC) nitrogen pressure. During daytime operation, when the HTF is heated and expands, the expanded volume will move into the expansion tanks and the nitrogen will be compressed and pushed into the nitrogen condensing tank. At night when the HTF cools and contracts, the HTF will move back into the piping and the nitrogen in the vapor space will expand into the expansion tanks. After some time of operation some of the HTF will break down into Low Boilers (LB’s) such as Benzene, Phenol, etc.; and High Boilers (HB’s) – heavier sludge. After a few years of
February 2, 2010 10 Mojave Solar Project
Data Request 1A Response
operation, these HB’s and LB’s will accumulate to high enough concentrations that they need to be removed from the system. Although venting would be limited by letting the nitrogen space pressure rise and fall as necessary to keep it contained within the expansion and nitrogen condensing tanks, the LB’s which will be released into the vapor space at operating temperature will be removed from nitrogen space by condensing them in the nitrogen condensing tank by cooling them in the tank to about 176 °F. HB’s will be removed from the system through a side stream distillation system. Types of Venting There are two types of venting from HTF system:
the daily venting of nitrogen due to HTF Storage Tank breathing venting of low boilers (HTF degradation products)
Daily Breathing Venting: As indicated above, during most normal operation there will be no exchange of HTF or nitrogen between expansion tanks and the storage tanks. However in unusual cases when the HTF temperature swings outside of the normal daily range, some hotter HTF and nitrogen may need to be transferred from expansion tanks into the storage tanks and vice versa. During these unusual exchanges the storage tank levels will fall and rise, thus requiring nitrogen space venting. The worst case would be if the HTF system got very cold (limited to 100 °F) in which case all the HTF from the storage tanks will be pumped into the system; and next time the system is brought back to normal operation, all HTF that was pumped out of the storage tanks will return to the storage tanks. Under that condition, the total amount of nitrogen vented is calculated to be 66,530 cu ft or 5200 lb/hr total for both plants. The storage tanks have coolers on their vent stacks. Nitrogen and HTF mixture to be released passes through the vent coolers, cooled to 120 °F, that will condense most of the HTF vapor vented from the storage tanks before reaching atmosphere. The storage tanks are maintained at 165 ºF to minimize HTF venting. The HTF storage tank has a liquid HTF air cooler to maintain this tank’s temperature at 165 ºF. Low Boilers Venting: As the HTF is normally cycled from 428ºF to 740ºF every day, there will be some degradation of the HTF. This degradation will result in primarily phenol and benzene with smaller concentrations of toluene and naphthalene. These degradation products will affect the thermal efficiency of the HTF and increase vapor pressure. As the HTF daily moves into and out of the expansion tanks, the LB’s along with some vaporous HTF will be released into the vapor space. To help this separation of LB’s into the vapor space, a side stream of HTF will also be sprayed to the top of the expansion tanks continuously. When the expansion tanks fill up with HTF and compress the nitrogen+vapors into the nitrogen condensing tanks which will be kept cooled to 176 °F, the LB’s along with a large amount of HTF vapor will be condensed.
February 2, 2010 11 Mojave Solar Project
Data Request Response
The HTF+LB’s condensate will be sent to an HTF LB’s and HB’s Cleaning System in which the HTF will be recovered as much as achievable with a distillation system. The LB’s will be pulled out of the top of the distillation unit and most of the LB’s along with some residual HTF will be condensed at about 120 °F (with cooling water) and collected in a tank to be disposed/sold for heat value. The non-condensibles will then be vented through a single point (the same point) as the storage tanks vents. As the concentrations of the LB’s increases in the HTF system, more and more LB’s will be released, condensed and recovered until daily degradation equals to the amount recovered for disposal plus a small amount that is vented to atmosphere along with nitrogen. Based on Solutia’s simulations and lab and field tests, daily degraded low boilers are calculated to be approximately 46.5 lbs/day per plant (93 lbs/day total for both plants). Low Boilers Removal Scheme: The HTF system is sized to not require nitrogen venting due to HTF expansion. However, to purge low boilers from the system, the expansion tanks will be vented at regular intervals instead of once per year recommended by HTF vendor. The amount of nitrogen vented is the volume of five expansion tanks from 0 to 90% volume. This vented nitrogen at 11 bars (159.5 psia) will include small amounts of HTF and HTF degraded by-products, the LB’s. An ASPEN simulation predicted that it is better to condense low boilers under pressure than by expanding the mixture and cooling it (scrubbing through a cooler pool of liquid) in the HTF Storage Tank followed by atmospheric condensation. The expansion tanks’ vent stream is cooled to 176 °F at 159.5 psia through a HTF-cooled nitrogen condenser and pressurized condensing tank. The majority of nitrogen is recycled back to the expansion tanks. Condensed HTF along with the low boilers are sent to a HTF Cleaning System. This continuous cleaning system operating 8 hours/day is a side-stream distillation for removal of high boiling degradation products called high boilers consisting of dibenzofuran, phenoxy biphenyl isomers, terphenyl, quaterphenyls, and phenoxy-polyphenyl compounds. These high boilers form over time in HTF which must be effectively managed for extending fluid life. This can be done by either dilution (replacement of old fluid with new fluid) or on-site distillation. A small side stream of in-service heat transfer fluid is continuously fed into a distillation unit. The HTF and LB’s originating from the expansion tanks are removed in the two separate overhead streams cut at different temperatures. An HTF stream containing small amounts of high and low boilers, taken as a middle stream from the distillation unit, is condensed and returned to service through the HTF Expansion Tanks. The LB’s stream, taken as a top overhead stream from the distillation unit, is condensed at 120 °F, stored in a slightly pressurized tank and disposed of as a hazardous liquid. The bottoms stream is enriched in HB’s (and insoluble solids), which are removed for disposal either as a hazardous liquid or sent to the HTF vendor under EPA “used oil” regulations for credit on recoverable HTF. The vent stream from the distillation unit will be combined with HTF Storage Tank breather vent and cooled to 120 °F through a water-cooled condenser to recover HTF and returned to HTF Storage Tank. Release Control Efficiency: Maximum VOC emissions from nitrogen venting are thus 5.1 lb/day HTF with a maximum of 27% or 1.38 lb/day comprised of biphenyl, a hazardous air pollutant (HAP) and 4 lbs/day of benzene, toluene, and phenol. The Title V threshold for
February 2, 2010 12 Mojave Solar Project

Data Request 1A Response
hazardous air pollutants is 10 tons/year for any individual HAP. So the HTF and benzene release as calculated is much less than the maximum level allowed. Since the expansion is expected to take place over the course of more than one hour in the morning, the maximum hourly emissions is also the same as daily maximums. Based on the calculations submitted, this control reduces the potential mass of HTF released from 6867 lbs/day to 5.1 lbs/day resulting in an overall VOC control efficiency of about 99.9%. Based on the above design considerations and system control efficiency, the project is not anticipating the need for any additional add-on VOC controls. Emissions Summary Therefore, the HTF tanking and venting system will result in VOC (HTF plus low boiler compounds) emissions on the order of 1.1375 lbs/hr, 9.1 lbs/day (based on 8 hours/day of venting), 3322 lbs/year, or 1.66 tpy for the entire facility. VOC emissions for a single power block would be approximately 0.57 lbs/hr, 4.55 lbs/day (based on 8 hours/day of venting), 1661 lbs/yr, or 0.831 tpy. Waste hauling (total load-out emissions for the 250 MW facility) will be approximately 0.0013 lbs/hr, 0.0013 lbs/day, 0.0157 lbs/yr, or 7.84E-6 tpy. These emissions are based on the following data and assumptions:
a. 12 facility load-outs per year (1 per month) maximum.
b. 2 hours per load-out (1 hour at each power block). The actual load-out pumping or transfer time will be less than an hour, but an hour was used as the basic emissions period.
c. VOC emissions loss rate is ~0.0013 lbs/hr (based upon the haul truck evacuated vapor space volume and VOC concentration in the vapor per facility load-out).
HTF VOC fugitive emissions from valves, flanges, pumps, seals, etc., will be 2.44 lbs/hr, 26.42 lbs/day, 9644.7 lbs/year, or 4.82 tpy, based on the data and assumptions in the VOC Component Count and Emissions spreadsheet attached at the end of these responses. In addition, we note the following with respect to Staff concerns on the BACT for the HTF ullage system: MDAQMD Rule 1303 Requirements state the following:
(A) Best Available Control Technology is required on:
(1) Any new Permit Unit which emits, or has the Potential to Emit, 25 pounds per day or more of any Nonattainment Air Pollutant shall be equipped with BACT,
February 2, 2010 13 Mojave Solar Project
Data Request Response
February 2, 2010 14 Mojave Solar Project
(2) Any Modified Permit Unit which emits, or has the Potential to Emit, 25 pounds per day or more of any Nonattainment Air Pollutant shall be equipped with BACT, (3) Any new or Modified Facility which emits, or has the Potential to Emit, 25 tons per year or more of any Nonattainment Air Pollutant shall be equipped with BACT for each new Permit Unit. (4) For purposes of determining applicability of this Section, Potential to Emit is defined by District Rule 1301(UU) and SERs shall not be utilized to reduce such Potential to Emit.
Sections (A)(1) and (2) apply to the proposed HTF ullage system and the facility in general. In addition, the nonattainment pollutants affected by these provisions for the site are as follows:
For ozone – NOx, VOC, and the organic fraction of PM10 For PM10 – the nitrate and sulfate fractions of NOx and SOx, the direct portion of
PM10, and the organic fraction of PM10 from VOCs. A review of the device/process specific emissions sheets presented at the conclusion of these responses indicates the following:
No nonattainment pollutant is emitted in excess of 25 tons per year from the facility per Section (A)(3), therefore BACT is not required for each new permit unit.
Each of the emergency electric generators (diesel engines) will emit NOx at a rate of 46.61 lbs/hr and 46.61 lbs/day. BACT for NOx would be required, and the applicant believes that data presented to date indicates that these engines meet the MDAQMD BACT requirements, NSPS requirements, as well as CARB and EPA Tiered emissions standards.
HTF solar field components will emit VOC at a rate of 2.44 lbs/hr and 26.42 lbs/day. BACT for these field components is based upon the component design, maintaining the components (seals, valves, flanges, etc) in a leak-free condition, etc.
The HTF ullage system is anticipated to have VOC emissions on the order of 1.138 lbs/hr and 9.1 lbs/day. As such, the BACT requirement is not triggered for the HTF ullage system under the MDAQMD NSR rules; therefore the applicant believes that the presently designed system of VOC controls for the ullage system is sufficient for purposes of controlling VOC emissions to the maximum extent possible considering the design of the project.
Data Request 1A Response
February 2, 2010 15 Mojave Solar Project
Process Flow Block Diagram - HTF Venting SystemThese numbers are total for two plants Alpha & Beta.
Note Vent To Atmosphere
lbs/dayHTF 5.10
Benzene 0.64 Note Toluene 0.15
CWR 100 ˚F Phenol 0.00HTF + LB 5.89Nitrogen 5200
120 Flbs/day lbs/day Overall HF Recovery 99.93 %
HTF 0.004 HTF 30 Water Cooled Overall LB Recovery 95.84 %Benzene 3.06 Benzene 0.65 Vent CondenserToluene 0.11 Toluene 0.15 120 ˚FPhenol 0.04 Phenol 0.01 lbs/day
lbs/day HTF + LB 3.2 HTF + LB 30.8 HTF 24.9HTF 4.2 Nitrogen 10.7 Nitrogen 5200 Benzene 0.010
Benzene 15 120 F Toluene 0.002Toluene 0.61 Nitrogen Phenol 0.008Phenol 0.38 HTF + LB 24.91
HTF + LB 20 Nitrogen 0.006Nitrogen 4314
176 ˚F HTF from Solar Field & Exchange to / from Expansion Tanks
lbs/dayHTF 103.00
Nitrogen HTF Return 16 psia, 120 F Benzene 38.90Toluene 4.20
293 C (560 ˚F) Phenol 49.7011 bara (159.5 psia) HTF + LB 196
HTF 165 F 120 F Nitrogen Trace Low Boilerslbs/day (HTF, Benzene,Toluene &
HTF 6870.8 lbs/day Phenol) for Hazardous Liquid DisposalBenzene 56.91 HTF 6866.6Toluene 4.93 Benzene 41.93 lbs/dayPhenol 50.1 Toluene 4.32 HTF 13227.41
HTF + LB 6983 Phenol 49.73 502 F HTF Return to Expansion Tank Benzene 4.37Nitrogen 4325 HTF + LB 6963 Toluene 0.52
Nitrogen 10.7 lbs/day Phenol 11.28176 F HTF + HB from Solar Field HTF 6602.00 Dibenzo 19.14
159.5 psia, 716 F Benzene 4.40 HTF+HB+LB 13262.7Toluene 0.52 Nitrogen 1.25Phenol 11.29
16 psia, 524 F Dibenzo 166.00High Boilers for Disposal HTF + HB 6784.2
lbs/day Nitrogen 1.22 HTF to Solar Field HTF 138.19
Benzene TraceHTF from Toluene Trace -Solar Field / Phenol TraceStm Gen area HTF Circulation Pumps Dibenzo 146.86
HTF + HB 285.1Nitrogen Trace
Note 1: With 8 hours per day operation, the numbers are per dayNote 2: One hour per day during initial heat up in morning.
HTF Expansion Tanks (5)
Low Boilers &High Boiler Cleaning System (Distillation)
HTF StorageTanks (2)
11
2
Data Request Response
Public Health
Item 83 (Revised):
Information Required:
Please describe and discuss the potential for all toxic thermal degradation products of HTF.
Response:
According to the MSDS for both Therminol-VP1 and Dowtherm-A as provided in Appendix C.1 of the AFC, note the following:
1. Both fluids are stable under normal conditions of handling and storage.
2. Neither fluid has the potential to undergo hazardous polymerization.
3. Both fluids have compound characteristics similar to the RCRA class of chemicals identified as category D018 (benzene).
4. Both fluids can decompose at elevated temperatures.
5. Decomposition products may include “trace” amounts of benzene and phenol.
According to data provided by the HTF manufacturer and the HTF system designer, as analyzed by the project engineering staff (using the Aspen Plus Model, version 2006.5), the amounts and types of hazardous air pollutants in the ullage system decomposition off-gas would be approximately as follows:
Benzene wt% of total VOC = 40.6% Phenol wt% of total VOC = 0.44% Toluene wt% of total VOC = 2.86% And the HTF itself: Biphenyl wt% of total VOC = 14.9% Diphenyl Oxide (a.k.a. Diphenyl Ether) wt% of total VOC = 41.2%
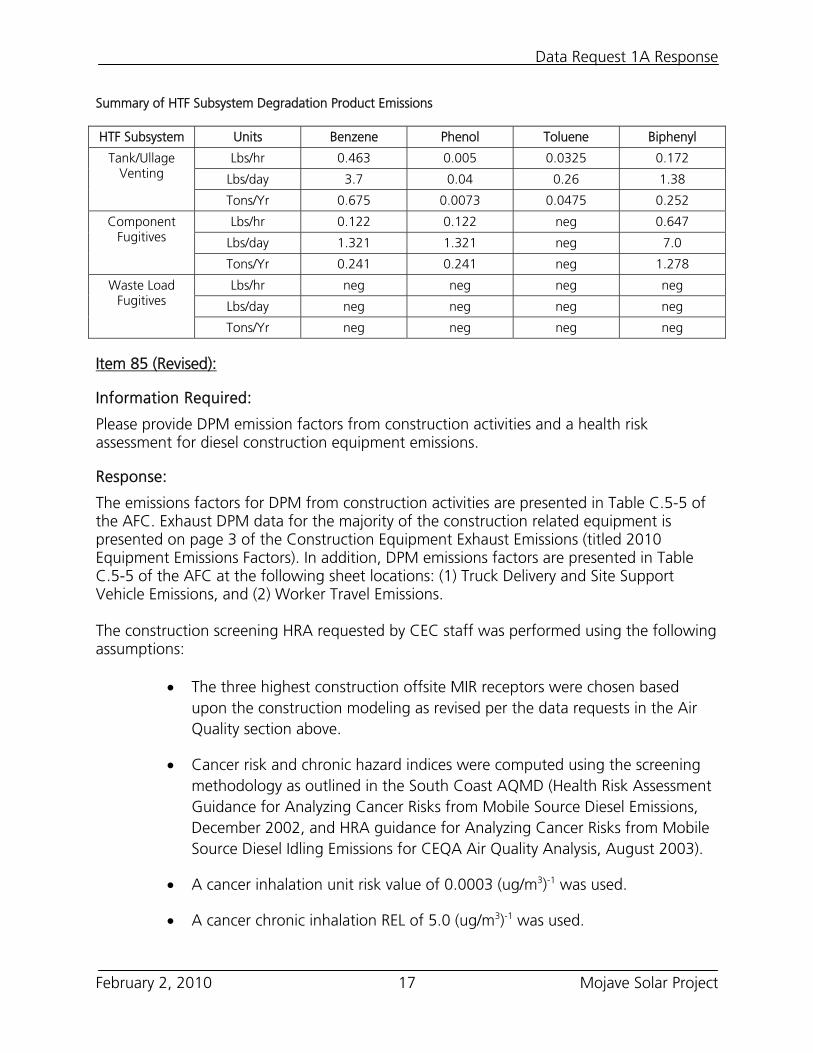
For the breakdown of HAPs in the solar field components, the MSDS states that the decomposition products of benzene and phenol occur in “trace amounts”. For purposes of calculating the HAPs emissions from the component fugitives in the solar field, a value of 5% by wt of total VOCs of each compound (except biphenyl at 26.5%) was used as an upper limit representative of a “trace amount”. The following table presents the estimates of emissions for the identified degradation products from the various HTF subsystems.
February 2, 2010 16 Mojave Solar Project
Data Request 1A Response
Summary of HTF Subsystem Degradation Product Emissions HTF Subsystem Units Benzene Phenol Toluene Biphenyl
Lbs/hr 0.463 0.005 0.0325 0.172
Lbs/day 3.7 0.04 0.26 1.38
Tank/Ullage Venting
Tons/Yr 0.675 0.0073 0.0475 0.252
Lbs/hr 0.122 0.122 neg 0.647
Lbs/day 1.321 1.321 neg 7.0
Component Fugitives
Tons/Yr 0.241 0.241 neg 1.278
Lbs/hr neg neg neg neg
Lbs/day neg neg neg neg
Waste Load Fugitives
Tons/Yr neg neg neg neg
Item 85 (Revised):
Information Required:
Please provide DPM emission factors from construction activities and a health risk assessment for diesel construction equipment emissions.
Response:
The emissions factors for DPM from construction activities are presented in Table C.5-5 of the AFC. Exhaust DPM data for the majority of the construction related equipment is presented on page 3 of the Construction Equipment Exhaust Emissions (titled 2010 Equipment Emissions Factors). In addition, DPM emissions factors are presented in Table C.5-5 of the AFC at the following sheet locations: (1) Truck Delivery and Site Support Vehicle Emissions, and (2) Worker Travel Emissions. The construction screening HRA requested by CEC staff was performed using the following assumptions:
The three highest construction offsite MIR receptors were chosen based upon the construction modeling as revised per the data requests in the Air Quality section above.
Cancer risk and chronic hazard indices were computed using the screening methodology as outlined in the South Coast AQMD (Health Risk Assessment Guidance for Analyzing Cancer Risks from Mobile Source Diesel Emissions, December 2002, and HRA guidance for Analyzing Cancer Risks from Mobile Source Diesel Idling Emissions for CEQA Air Quality Analysis, August 2003).
A cancer inhalation unit risk value of 0.0003 (ug/m3)-1 was used.
A cancer chronic inhalation REL of 5.0 (ug/m3)-1 was used.
February 2, 2010 17 Mojave Solar Project
Data Request Response
No acute inhalation REL exists for diesel PM.
The adjustment factor applied to the final risk and hazard index values was based upon a construction work schedule of 10 hrs/day, 6 days/week, 50 weeks/year, for 12 months (1 yr) for year one (including Phase I), and 26 months (2.167 yrs) for Year two (including Phases II-IV).
With respect to emissions from diesel fueled engines, use of the diesel PM exposure factors noted above are approved by CARB for the characterization of diesel engine exhaust and subsequent risk exposures. The diesel PM factor includes the range of fuel bound, and potentially emitted metals, PAHs, and a wide variety of other semi-volatile substances. CARB notes the following in Appendix K of the current HARP Users Manual:
The surrogate for whole diesel exhaust is diesel PM. PM10 is the basis for the potential risk calculations.
When conducting an HRA, the potential cancer risk from inhalation exposure to diesel PM will outweigh the potential non-cancer health effects.
When comparing whole diesel exhaust to speciated diesel exhaust, potential cancer risk from inhalation exposure to whole diesel exhaust will outweigh the multi-pathway cancer risk from the speciated compounds. For this reason, there will be few situations where an analysis of multi-pathway risk is necessary.
With respect to diesel particulate related risk values, the following should be noted:
The US Department of Energy (DOE) as well as the US Environmental Protection Agency (EPA) have disagreed with the CARB/OEHHA and South Coast AQMD positions on the relative threat and relative contribution of diesel exhaust to “toxic” air pollution, and neither of the agencies, including the EPA’s prestigious Health Effects Institute identify diesel exhaust as a “known” carcinogen, since the scientific studies show only “weak” cancer links. EPA and DOE believe that the studies relied upon by CARB and SCAQMD are flawed in that they use a problematic elemental carbon surrogate for ambient diesel particulate matter and ignored a significant portion of PM2.5 captured at the SCAQMD’s own monitoring stations. In view of these conflicting studies, we suggest that caution be used in the decision making process regarding diesel PM and its associated risks, i.e., the actual risks may be much lower than those calculated by screening method herein. For these reasons, the risk table below reports the construction risk values using DPM only, and the inhalation pathway.
February 2, 2010 18 Mojave Solar Project
Data Request 1A Response
February 2, 2010 19 Mojave Solar Project
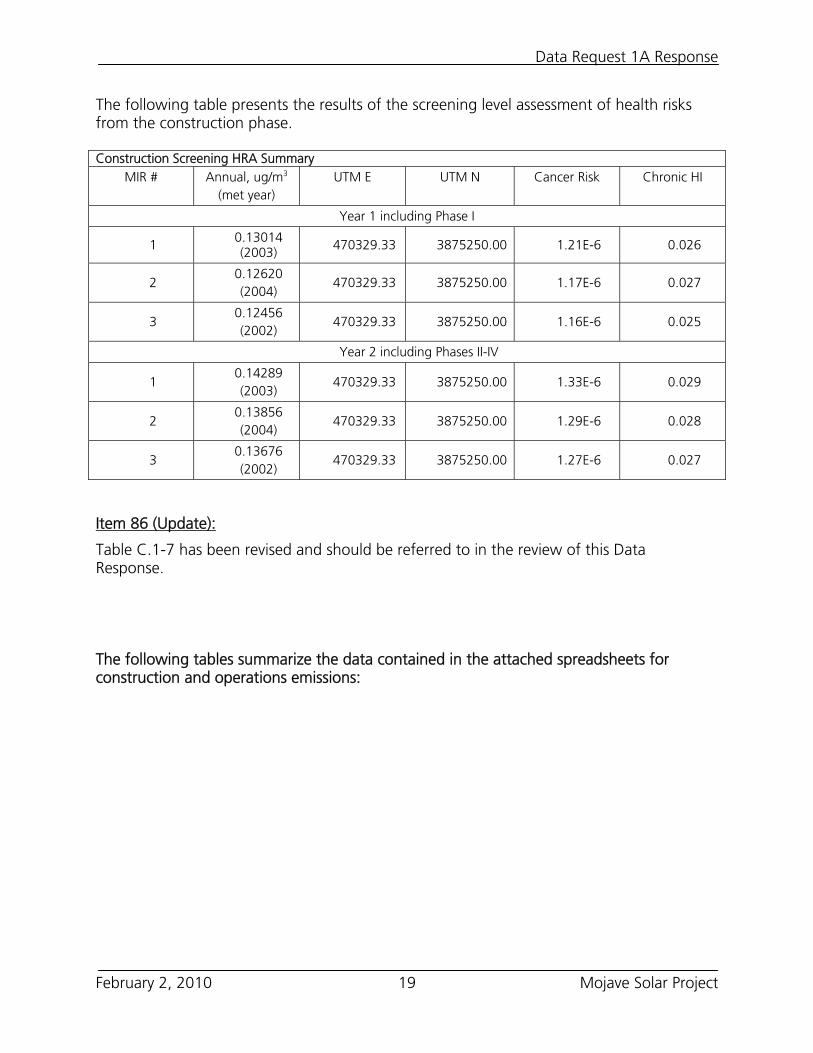
The following table presents the results of the screening level assessment of health risks from the construction phase. Construction Screening HRA Summary
MIR # Annual, ug/m3 (met year)
UTM E UTM N Cancer Risk Chronic HI
Year 1 including Phase I
1 0.13014 (2003) 470329.33 3875250.00 1.21E-6 0.026
2 0.12620 (2004)
470329.33 3875250.00 1.17E-6 0.027
3 0.12456 (2002)
470329.33 3875250.00 1.16E-6 0.025
Year 2 including Phases II-IV
1 0.14289 (2003)
470329.33 3875250.00 1.33E-6 0.029
2 0.13856 (2004)
470329.33 3875250.00 1.29E-6 0.028
3 0.13676 (2002)
470329.33 3875250.00 1.27E-6 0.027
Item 86 (Update):
Table C.1-7 has been revised and should be referred to in the review of this Data Response. The following tables summarize the data contained in the attached spreadsheets for construction and operations emissions:
Data Request Response
February 2, 2010 20 Mojave Solar Project
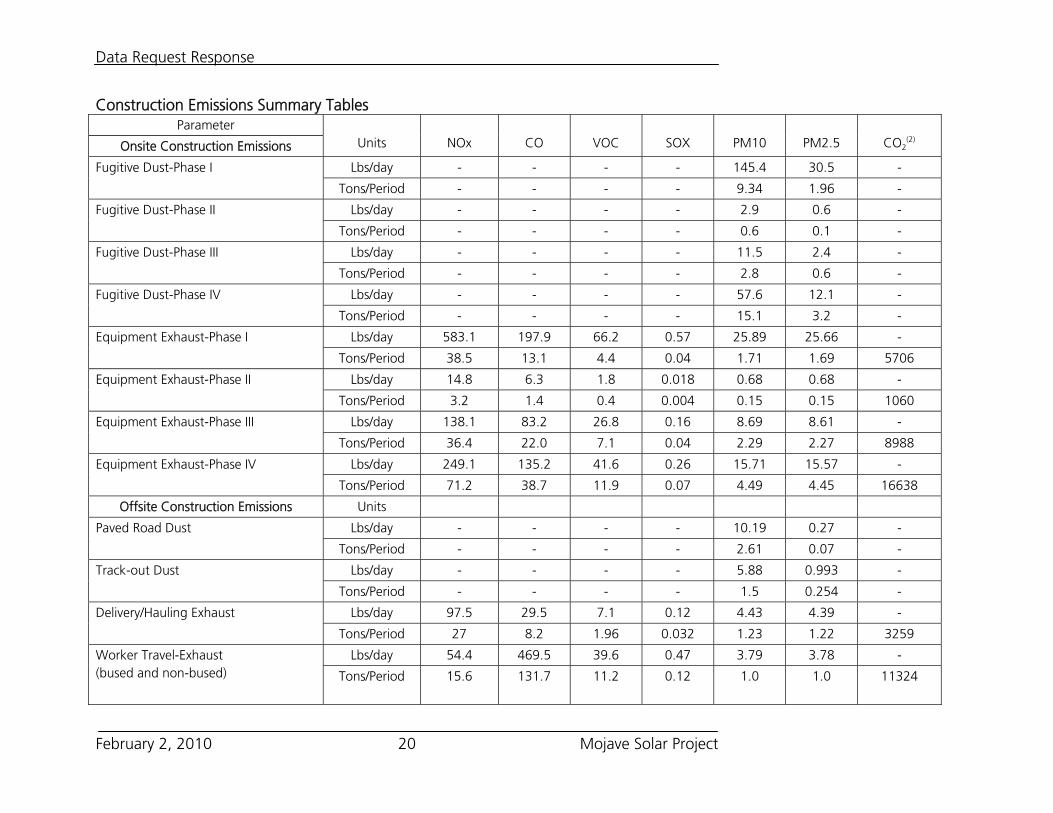
Construction Emissions Summary Tables Parameter
Onsite Construction Emissions
Units
NOx
CO
VOC
SOX
PM10
PM2.5
CO2
(2)
Lbs/day - - - - 145.4 30.5 - Fugitive Dust-Phase I
Tons/Period - - - - 9.34 1.96 -
Lbs/day - - - - 2.9 0.6 - Fugitive Dust-Phase II
Tons/Period - - - - 0.6 0.1 -
Lbs/day - - - - 11.5 2.4 - Fugitive Dust-Phase III
Tons/Period - - - - 2.8 0.6 -
Lbs/day - - - - 57.6 12.1 - Fugitive Dust-Phase IV
Tons/Period - - - - 15.1 3.2 -
Lbs/day 583.1 197.9 66.2 0.57 25.89 25.66 - Equipment Exhaust-Phase I
Tons/Period 38.5 13.1 4.4 0.04 1.71 1.69 5706
Lbs/day 14.8 6.3 1.8 0.018 0.68 0.68 - Equipment Exhaust-Phase II
Tons/Period 3.2 1.4 0.4 0.004 0.15 0.15 1060
Lbs/day 138.1 83.2 26.8 0.16 8.69 8.61 - Equipment Exhaust-Phase III
Tons/Period 36.4 22.0 7.1 0.04 2.29 2.27 8988
Lbs/day 249.1 135.2 41.6 0.26 15.71 15.57 - Equipment Exhaust-Phase IV
Tons/Period 71.2 38.7 11.9 0.07 4.49 4.45 16638
Offsite Construction Emissions Units
Lbs/day - - - - 10.19 0.27 - Paved Road Dust
Tons/Period - - - - 2.61 0.07 -
Lbs/day - - - - 5.88 0.993 - Track-out Dust
Tons/Period - - - - 1.5 0.254 -
Lbs/day 97.5 29.5 7.1 0.12 4.43 4.39 - Delivery/Hauling Exhaust
Tons/Period 27 8.2 1.96 0.032 1.23 1.22 3259
Lbs/day 54.4 469.5 39.6 0.47 3.79 3.78 - Worker Travel-Exhaust (bused and non-bused) Tons/Period 15.6 131.7 11.2 0.12 1.0 1.0 11324

Data Request 1A Response
February 2, 2010 21 Mojave Solar Project
Notes: 1. Daily maximum emissions for equipment exhaust can be found on Table C.5-5. Daily average emissions are presented here as they
represent site activity and emissions levels over the course of the project. 2. CO2e emissions are calculated and totaled on Table C.5-5. CO2e emissions for the construction period are ~ 43,015 metric tons.
Based upon the applicant’s best estimate, the maximum daily onsite emissions will be as follows: 1. Fugitive dust emissions will be the greatest during the Phase I grading and site preparation period. 2. Exhaust emissions will peak during Phases II-IV (month 15 or 16). Estimated Maximum Daily Onsite Emissions (lbs/day)
Phase Category NOx CO VOC SOx PM10 PM2.5 Fugitive Dust - - - - 145.4 30.5 I
Exhaust 583 198 66.2 0.57 25.9 25.7 Total Phase I 583 198 66.2 0.57 171.3 56.2
Fugitive Dust - - - - 72.0 15.1 II-IV Exhaust 556 311 70.2 0.60 34.6 34.2
Total Phases II-IV 556 311 70.2 0.60 106.6 49.3
Data Request Response
February 2, 2010 22 Mojave Solar Project
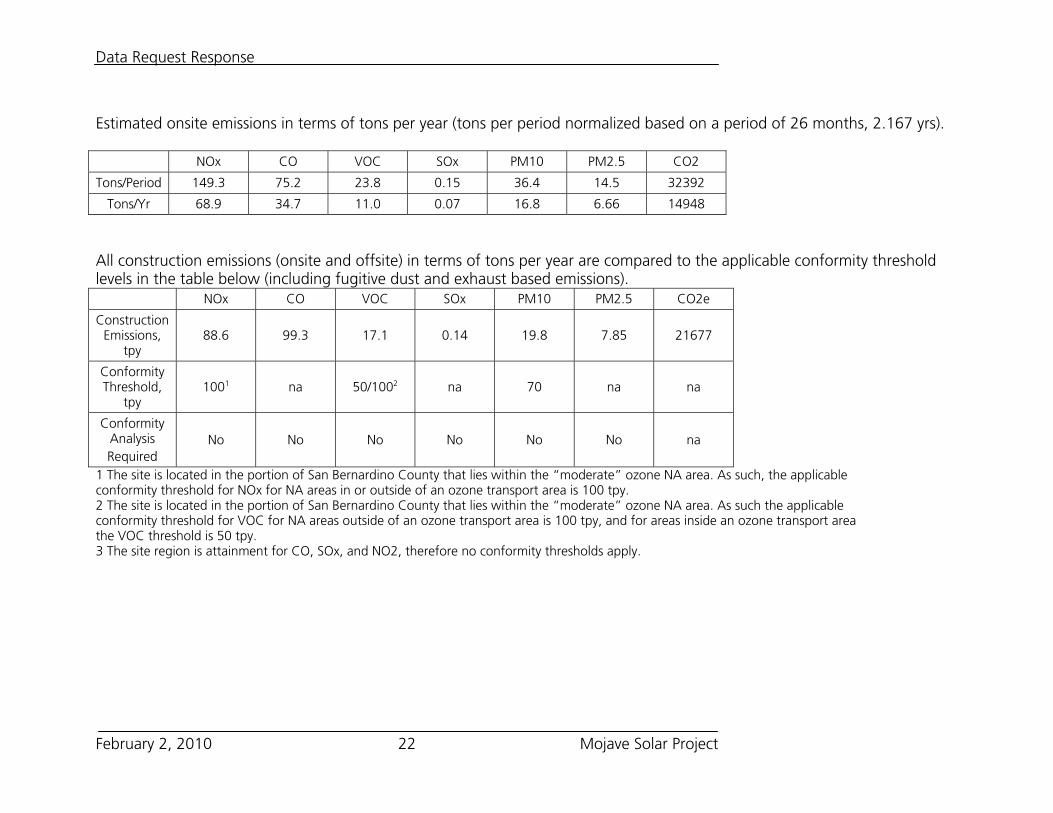
Estimated onsite emissions in terms of tons per year (tons per period normalized based on a period of 26 months, 2.167 yrs).
NOx CO VOC SOx PM10 PM2.5 CO2
Tons/Period 149.3 75.2 23.8 0.15 36.4 14.5 32392
Tons/Yr 68.9 34.7 11.0 0.07 16.8 6.66 14948
All construction emissions (onsite and offsite) in terms of tons per year are compared to the applicable conformity threshold levels in the table below (including fugitive dust and exhaust based emissions).
NOx CO VOC SOx PM10 PM2.5 CO2e
Construction Emissions,
tpy 88.6 99.3 17.1 0.14 19.8 7.85 21677
Conformity Threshold,
tpy 1001 na 50/1002 na 70 na na
Conformity Analysis Required
No No No No No No na
1 The site is located in the portion of San Bernardino County that lies within the “moderate” ozone NA area. As such, the applicable conformity threshold for NOx for NA areas in or outside of an ozone transport area is 100 tpy. 2 The site is located in the portion of San Bernardino County that lies within the “moderate” ozone NA area. As such the applicable conformity threshold for VOC for NA areas outside of an ozone transport area is 100 tpy, and for areas inside an ozone transport area the VOC threshold is 50 tpy. 3 The site region is attainment for CO, SOx, and NO2, therefore no conformity thresholds apply.
Data Request 1A Response
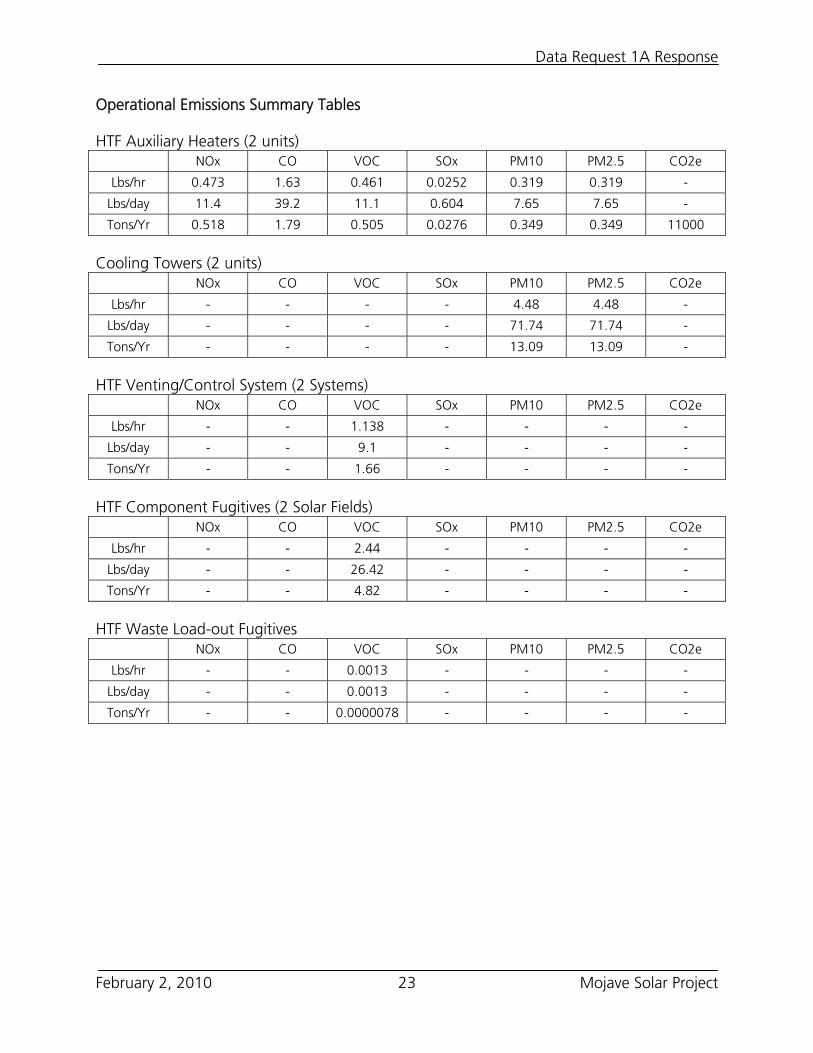
Operational Emissions Summary Tables HTF Auxiliary Heaters (2 units)
NOx CO VOC SOx PM10 PM2.5 CO2e
Lbs/hr 0.473 1.63 0.461 0.0252 0.319 0.319 -
Lbs/day 11.4 39.2 11.1 0.604 7.65 7.65 -
Tons/Yr 0.518 1.79 0.505 0.0276 0.349 0.349 11000
Cooling Towers (2 units)
NOx CO VOC SOx PM10 PM2.5 CO2e
Lbs/hr - - - - 4.48 4.48 -
Lbs/day - - - - 71.74 71.74 -
Tons/Yr - - - - 13.09 13.09 -
HTF Venting/Control System (2 Systems)
NOx CO VOC SOx PM10 PM2.5 CO2e
Lbs/hr - - 1.138 - - - -
Lbs/day - - 9.1 - - - -
Tons/Yr - - 1.66 - - - -
HTF Component Fugitives (2 Solar Fields)
NOx CO VOC SOx PM10 PM2.5 CO2e
Lbs/hr - - 2.44 - - - -
Lbs/day - - 26.42 - - - -
Tons/Yr - - 4.82 - - - -
HTF Waste Load-out Fugitives
NOx CO VOC SOx PM10 PM2.5 CO2e
Lbs/hr - - 0.0013 - - - -
Lbs/day - - 0.0013 - - - -
Tons/Yr - - 0.0000078 - - - -
February 2, 2010 23 Mojave Solar Project
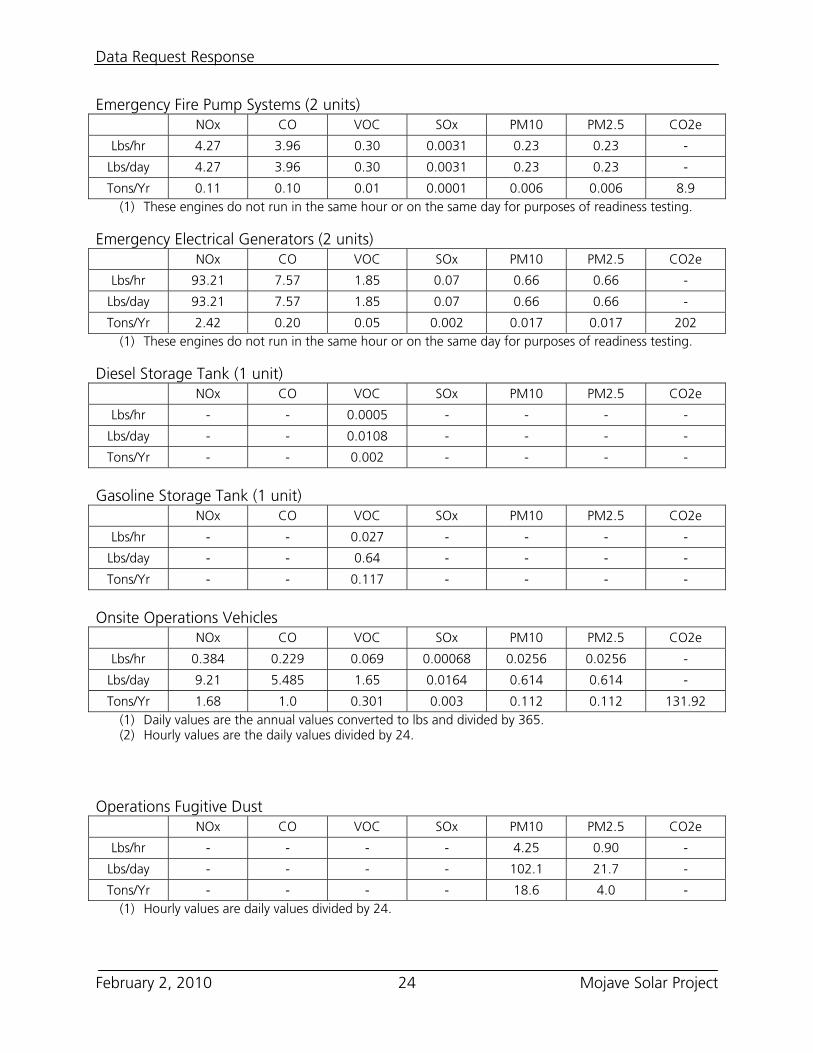
Data Request Response
Emergency Fire Pump Systems (2 units) NOx CO VOC SOx PM10 PM2.5 CO2e
Lbs/hr 4.27 3.96 0.30 0.0031 0.23 0.23 -
Lbs/day 4.27 3.96 0.30 0.0031 0.23 0.23 -
Tons/Yr 0.11 0.10 0.01 0.0001 0.006 0.006 8.9 (1) These engines do not run in the same hour or on the same day for purposes of readiness testing.
Emergency Electrical Generators (2 units) NOx CO VOC SOx PM10 PM2.5 CO2e
Lbs/hr 93.21 7.57 1.85 0.07 0.66 0.66 -
Lbs/day 93.21 7.57 1.85 0.07 0.66 0.66 -
Tons/Yr 2.42 0.20 0.05 0.002 0.017 0.017 202 (1) These engines do not run in the same hour or on the same day for purposes of readiness testing.
Diesel Storage Tank (1 unit) NOx CO VOC SOx PM10 PM2.5 CO2e
Lbs/hr - - 0.0005 - - - -
Lbs/day - - 0.0108 - - - -
Tons/Yr - - 0.002 - - - -
Gasoline Storage Tank (1 unit)
NOx CO VOC SOx PM10 PM2.5 CO2e
Lbs/hr - - 0.027 - - - -
Lbs/day - - 0.64 - - - -
Tons/Yr - - 0.117 - - - -
Onsite Operations Vehicles
NOx CO VOC SOx PM10 PM2.5 CO2e
Lbs/hr 0.384 0.229 0.069 0.00068 0.0256 0.0256 -
Lbs/day 9.21 5.485 1.65 0.0164 0.614 0.614 -
Tons/Yr 1.68 1.0 0.301 0.003 0.112 0.112 131.92 (1) Daily values are the annual values converted to lbs and divided by 365. (2) Hourly values are the daily values divided by 24.
Operations Fugitive Dust
NOx CO VOC SOx PM10 PM2.5 CO2e
Lbs/hr - - - - 4.25 0.90 -
Lbs/day - - - - 102.1 21.7 -
Tons/Yr - - - - 18.6 4.0 - (1) Hourly values are daily values divided by 24.
February 2, 2010 24 Mojave Solar Project
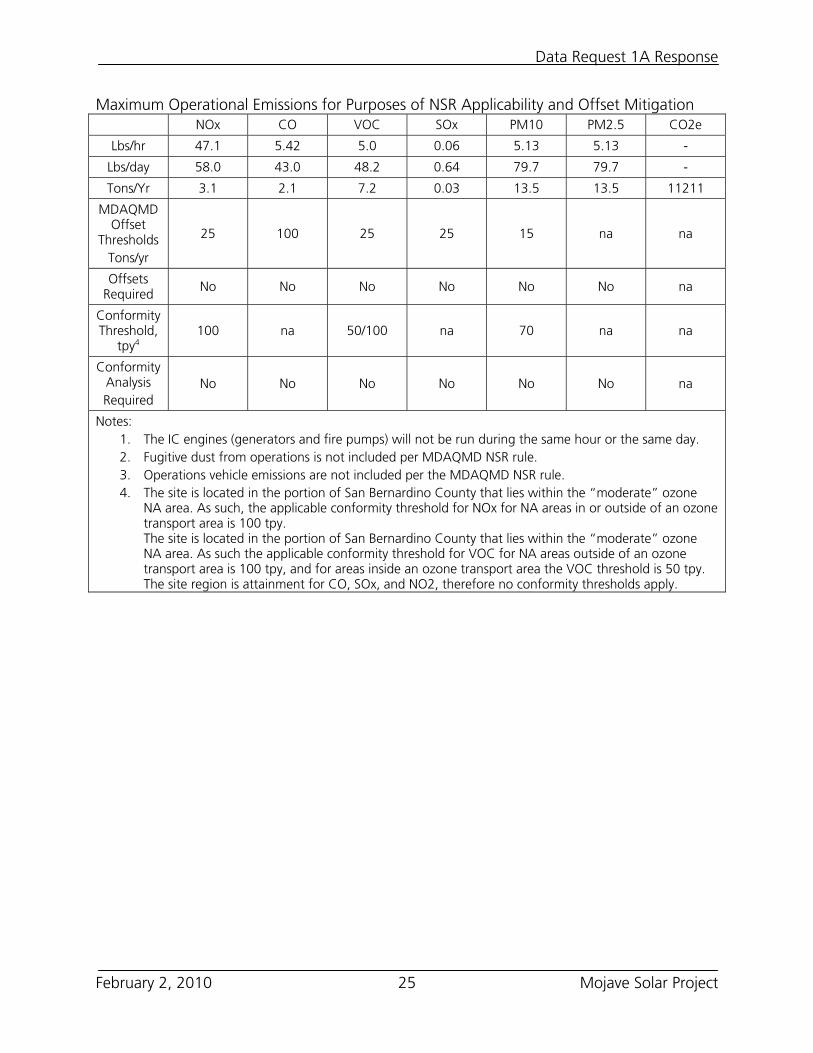
Data Request 1A Response
Maximum Operational Emissions for Purposes of NSR Applicability and Offset Mitigation NOx CO VOC SOx PM10 PM2.5 CO2e
Lbs/hr 47.1 5.42 5.0 0.06 5.13 5.13 -
Lbs/day 58.0 43.0 48.2 0.64 79.7 79.7 -
Tons/Yr 3.1 2.1 7.2 0.03 13.5 13.5 11211
MDAQMD Offset
Thresholds Tons/yr
25 100 25 25 15 na na
Offsets Required No No No No No No na
Conformity Threshold,
tpy4 100 na 50/100 na 70 na na
Conformity Analysis Required
No No No No No No na
Notes: 1. The IC engines (generators and fire pumps) will not be run during the same hour or the same day. 2. Fugitive dust from operations is not included per MDAQMD NSR rule. 3. Operations vehicle emissions are not included per the MDAQMD NSR rule. 4. The site is located in the portion of San Bernardino County that lies within the “moderate” ozone
NA area. As such, the applicable conformity threshold for NOx for NA areas in or outside of an ozone transport area is 100 tpy. The site is located in the portion of San Bernardino County that lies within the “moderate” ozone NA area. As such the applicable conformity threshold for VOC for NA areas outside of an ozone transport area is 100 tpy, and for areas inside an ozone transport area the VOC threshold is 50 tpy. The site region is attainment for CO, SOx, and NO2, therefore no conformity thresholds apply.
February 2, 2010 25 Mojave Solar Project
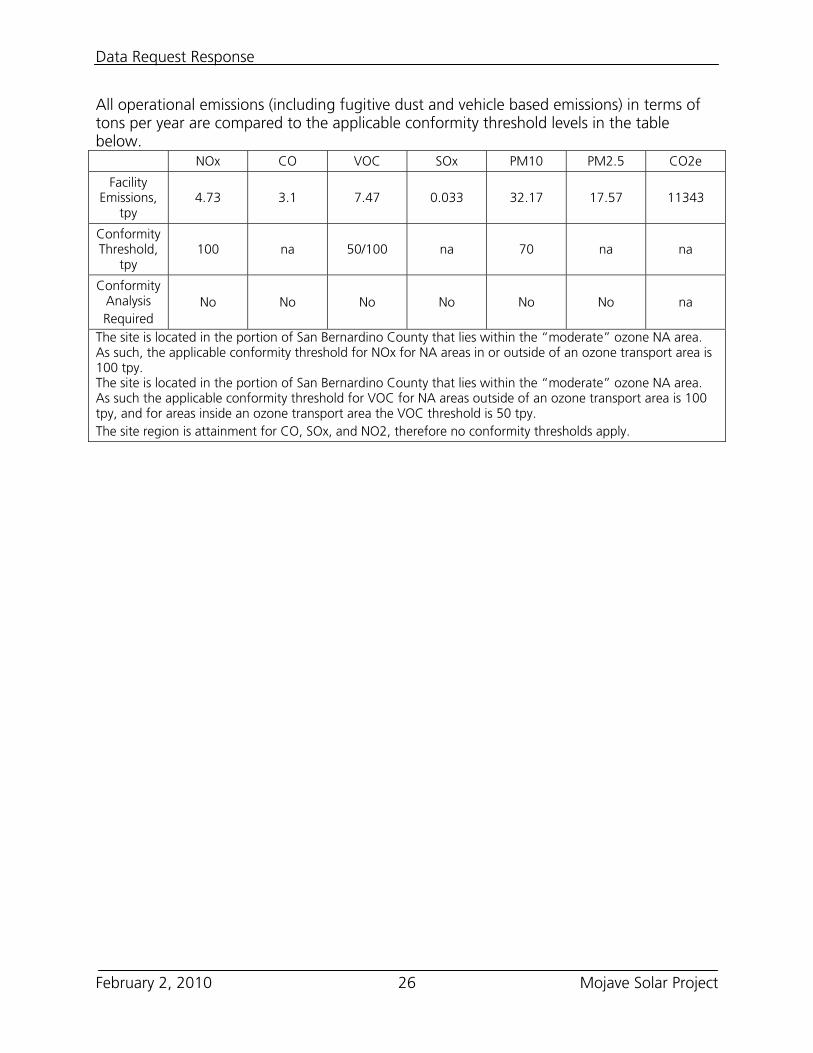
Data Request Response
February 2, 2010 26 Mojave Solar Project
All operational emissions (including fugitive dust and vehicle based emissions) in terms of tons per year are compared to the applicable conformity threshold levels in the table below.
NOx CO VOC SOx PM10 PM2.5 CO2e
Facility Emissions,
tpy 4.73 3.1 7.47 0.033 32.17 17.57 11343
Conformity Threshold,
tpy 100 na 50/100 na 70 na na
Conformity Analysis Required
No No No No No No na
The site is located in the portion of San Bernardino County that lies within the “moderate” ozone NA area. As such, the applicable conformity threshold for NOx for NA areas in or outside of an ozone transport area is 100 tpy. The site is located in the portion of San Bernardino County that lies within the “moderate” ozone NA area. As such the applicable conformity threshold for VOC for NA areas outside of an ozone transport area is 100 tpy, and for areas inside an ozone transport area the VOC threshold is 50 tpy. The site region is attainment for CO, SOx, and NO2, therefore no conformity thresholds apply.
STATE OF CALIFORNIA
Energy Resources Conservation and Development Commission
Application for Certification for the ABENGOA MOJAVE SOLAR POWER PLANT
))))
Docket No. 09-AFC-5
PROOF OF SERVICE I, Karen A. Mitchell, declare that on February 2, 2010, I served the attached Second
Supplemental Written Response to Data Request Set 1A (Nos. 1-93) for Air Quality and Public
Health via electronic mail and United States Mail to all parties on the attached service list.
I declare under the penalty of perjury that the foregoing is true and correct.
__________________________ Karen A. Mitchell

*indicates change 1
BEFORE THE ENERGY RESOURCES CONSERVATION AND DEVELOPMENT COMMISSION OF THE STATE OF CALIFORNIA
1516 NINTH STREET, SACRAMENTO, CA 95814 1-800-822-6228 – HUWWW.ENERGY.CA.GOVUH
1BAPPLICATION FOR CERTIFICATION Docket No. 09-AFC-5
FOR THE ABENGOA MOJAVE PROOF OF SERVICE SOLAR POWER PLANT (Revised 1/29/2010)
UAPPLICANT U Emiliano Garcia Sanz General Manager Abengoa Solar Inc. 11500 West 13th Avenue Lakewood, CO 80215 [email protected] Scott D. Frier Chief Operating Officer Abengoa Solar Inc. 13911 Park Ave., Ste. 206 Victorville, CA 92392 [email protected] Tandy McMannes 2030 Addison Street, Suite 420 Berkeley, CA 94704 [email protected] UAPPLICANT’S CONSULTANTS *Frederick H. Redell, PE Engineering Manager Abengoa Solar, Inc. 11500 West 13th Avenue Lakewood, CO 80215 [email protected] UCOUNSEL FOR APPLICANT Christopher T. Ellison Ellison, Schneider & Harris 2600 Capitol Ave. Sacramento, CA 95816 [email protected]
UINTERESTED AGENCIES California ISO [email protected] U
INTERVENORS California Unions for Reliable Energy (“CURE”) Tanya A. Gulesserian Marc D. Joseph Elizabeth Klebaner Adams Broadwell Joseph & Cardozo 601 Gateway Boulevard, Suite 1000 South San Francisco, CA 94080 E-mail Preferred [email protected] [email protected] Luz Solar Partners Ltd., VIII Luz Solar Partners Ltd., IX Jennifer Schwartz 700 Universe Blvd Juno Beach, FL 33408 [email protected]
ENERGY COMMISSION JAMES D. BOYD Vice Chairman and Associate Member [email protected] *ANTHONY EGGERT Commissioner and Associate Member [email protected] Paul Kramer Hearing Officer [email protected] Craig Hoffman Project Manager [email protected] Christine Hammond Staff Counsel [email protected] Public Adviser’s Office [email protected]