
HSS4303B – Intro To Epidemiology Jan 11, 2010 - Interpretation of epidemiologic literature.
84
HSS4303B – Intro To Epidemiology Jan 11, 2010 - Interpretation of epidemiologic literature
-
Upload
rosa-townsend -
Category
Documents
-
view
217 -
download
0
Transcript of HSS4303B – Intro To Epidemiology Jan 11, 2010 - Interpretation of epidemiologic literature.

HSS4303B – Intro To Epidemiology
Jan 11, 2010 - Interpretation of epidemiologic literature

First, the good news.
Or is it bad news?

Tutorials
• Yes, contrary to what I said last week, this class does have a tutorial
• It is held Thursdays from 11:30AM to 1:00pm in LPR 155
• However….– It is not mandatory
– Erin will lead most of the sessions
– These sessions will constitute her office hours
– They begin next week

Consider This Scenario
1. A 40-year-old accountant visited her family physician for a routine checkup. The patient's mother had been diagnosed with breast cancer in the past year, and the patient wanted advice about what she could do to reduce her own risk of developing this disease. The patient had two children aged 6 and 8 years. She was in good health, with regular menstrual cycles, and she had a recent normal Papanicolaou smear and mammogram.
2. In responding to the patient's questions about breast cancer, the physician confirmed that a positive family history increases the risk of developing this disease.

3. A number of other characteristics are associated with a reduced risk of developing breast cancer, such as early age at first full-term pregnancy and increasing number of pregnancies. Unfortunately, these factors are not easily susceptible to intervention, and the patient already had completed her childbearing.

4. The physician was also aware of a controversy regarding the relationship between the intake of dietary fat and the occurrence of breast cancer
So what advice should the doctor give?
Before recommending that the patient reduce her fat intake, however, the physician wished to review the pertinent medical literature

Evidence Based Medicine (EBM)

What is EBM?
“Evidence Based Medicine (EBM) is the integration of best research evidence with clinical expertise and patient values.”
-Sackett, et al
It’s a way to use the literature to help you make clinical decisions in a systematic fashion
Common sense?
Ideology?

What is “best research evidence”?
Clinically relevant research, often from the basic sciences but typically from medical literature.
What is “clinical expertise”?
The ability to use your clinical skills and past experience to rapidly identify each patient’s unique health state and diagnosis, individual risks and benefits of potential intervention, and their personal values and expectations.
What are “patient values”?
The unique preferences, concerns and expectations each patient brings to a clinical encounter and which must be integrated into clinical decisions if they are to serve the patient.

Why the sudden interest in EBM?
EBM has been around since post-revolutionary Paris. But recent interest has been spurred by 4 realizations:
1. Doctors need daily information about diagnosis, prognosis, therapy and prevention
2. Textbooks are often out of date; experts are often wrong; CMEs are often useless; and there are too many journal articles
3. Clinicians’ technical knowledge declines over time4. Only a few seconds can be afforded per patient for assimilating a
mountain of evidence, and only 30 min per week can be set aside for general reading
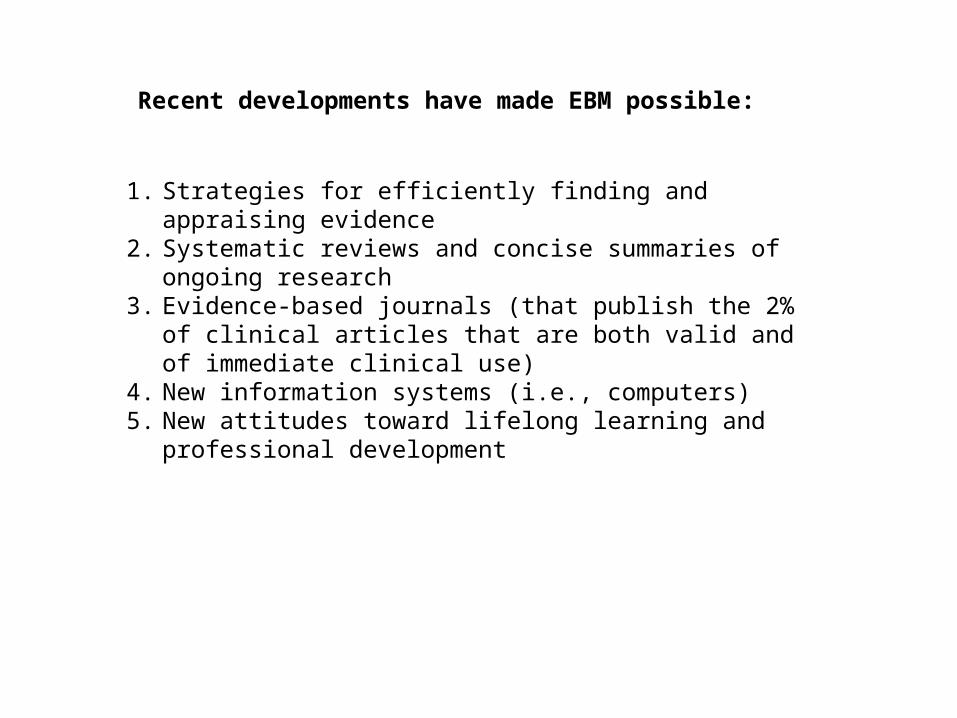
Recent developments have made EBM possible:
1. Strategies for efficiently finding and appraising evidence2. Systematic reviews and concise summaries of ongoing
research3. Evidence-based journals (that publish the 2% of clinical
articles that are both valid and of immediate clinical use)4. New information systems (i.e., computers)5. New attitudes toward lifelong learning and professional
development

Why Is EBM So Popular?
• Purports to employ the vast body of medical research that has been accumulating over the past few decades for direct clinical application
• In theory, it’s cheaper

How does one actually practice EBM?
Five Steps:
1. Convert the need for information (about prevention, diagnosis, prognosis, therapy, causation, etc) into an answerable question
2. Track down the best evidence with which to answer that question
3. Critically appraise that evidence for its validity (closeness to the truth), impact (size of the effect) and applicability (usefulness)
4. Integrate the evidence with your clinical expertise, experience and the patient’s unique biology, circumstances and values… and discuss with patient to make joint decision
5. Evaluate your effectiveness and efficiency in doing steps 1-4 so that they can be improved next time

Are there alternatives to EBM?
(From Isaacs & Fitzgerald (1999). BMJ:319:pp1618-1619)
1. Eminence based medicine - The more senior the colleague, the less importance he places on the need for anything as mundane as evidence. Experience, it seems, is worth any amount of evidence. Experience is "making the same mistakes with increasing confidence over an impressive number of years.“
2. Vehemence based medicine - The substitution of volume for evidence is an effective technique for brow beating your more timorous colleagues.
3. Eloquence based medicine - Elegance and eloquence are powerful substitutes for evidence.
4. Providence based medicine - If the doctor has no idea of what to do next, thedecision may be best left in the hands of the Almighty.
5. Nervousness based medicine - Fear of litigation is a powerful stimulus for overinvestigation and overtreatment.
6. Confidence based medicine - This is restricted to surgeons

Types of Relevant Literature
• Peer-reviewed journal studies
• Meta-analyses
• Systematic reviews

Must find “current best” evidence… Last year’s “best” may not be this year’s “best”.
From Sackett, et al:
1. Burn your textbooks.
“We begin with textbooks only to dismiss them.” Textbooks are good for the pathophysiology of a clinical problem, but
not for establishing cause, diagnosis, prognosis, prevention or treatment. Trust only those that are revised once a year and that are referenced.
2. Rely on clinical databases (most of which are now electronic). Online journals, like Evidence-Base Medicine
(Sackett is a bit extreme.)

The best sources for pre-approved evidence-based studies –if you can get access to them-- are the Cochrane Collaboration Library and any number of EBM online journals, such as Best Evidence
1. Cochrane Library: update.cochrane.co.uk or www.updateusa.com-provides systematic reviews of trials of health care interventions
2. Best Evidence: www.acponline.com-summarizes individual studies and systematic reviews from over
100 medical journals
3. Aidsline -like Medline, but for AIDS studies
4. Evidence Based Medicine Reviews (EBMR): www.ovid.com -combines many electronic databases, such as Cochrane, Medline,
Cancerlit and Aidsline

RCT – groups of patients are randomized into either experiment or control groups
Cohort – following exposed and unexposed patients forward to determine outcome
Case Control – looking at patients with the outcome of interest and looking back to see if they had the exposure in question
Case Series – a report on a series of patients with an outcome of interest; no control group involved
Systematic Review – a summary of the literature that uses explicit methods to appraise and combine studies
Meta Analyses – A systematic review that uses quantitative methods to summarize the results

Literature search
• Formulate research ____________– State your hypothesis or ask your question
• Define the ___________ of the study– Steps to find an answer to the research question
• Develop a search _________– Identify key words, scope and limitation of the search
• Conduct literature ________– Identify databases, search criteria– Search the databases both electronically and manually– Create your database of the identified literature– Read the collected literature
question
scope
strategy
search

Reading of the collected literature
• Read the paper and collect information on:– Research question or hypothesis
– Study design
– Selection of cases and controls
– Outcome and predictor variables
– Method of analyses
– Sources of bias
– Interpretation of results
– Group studies by type of study design and type of reporting
– Prepare study summaries
– Summarize the findings in a tabular format

Step 1. Consider the research hypothesis
Is there a clear statement of the research hypothesis?
Does the study address a question that has clinical relevance?
Step 2. Consider the study design
Is the study design appropriate for the hypothesis?
Does the design represent an advance over prior approaches?
Does the study use an experimental or an observational design?
Step 3. Consider the outcome variable
Is the outcome being studied relevant to clinical practice?
What criteria are used to define the presence of disease?
Is the determination of the presence or absence of disease accurate?
Step 4. Consider the predictor variable(s)
How many exposures or risk factors are being studied?
How is the presence or absence of exposure determined?
Is the assessment of exposure likely to be precise and accurate?
Is there an attempt to quantify the amount or duration of exposure?
Are biological markers of exposure used in the study?
Stepwise Approach to Critical Appraisal of Published Medical Research.

Step 5. Consider the methods of analysis
Are the statistical methods employed suitable for the types of variables (nominal versus ordinal versus continuous) in the study?
Have the levels of type I and type II errors been discussed appropriately?
Is the sample size adequate to answer the research question?
Have the assumptions underlying the statistical tests been met?
Has chance been evaluated as a potential explanation of the results?
Step 6. Consider possible sources of bias (systematic errors)
Is the method of selection of subjects likely to have biased results?
Is the measurement of either the exposure or the disease likely to be biased?
Have the investigators considered whether confounders could account for the observed results?
In what direction would each potential bias influence the results?
Step 7. Consider the interpretation of results
How large is the observed effect?
Is there evidence of a dose-response relationship?
Are the findings consistent with laboratory models?
Are the effects biologically plausible?
If the findings are negative, was there sufficient statistical power to detect an effect?
Step 8. Consider how the results of the study can be used in practice
Are the findings consistent with other studies of the same questions?
Can the findings be generalized to other human populations?
Do the findings warrant a change in current clinical practice?

So remember our example?
• The doctor wants to research the effects of dietary fat on breast cancer risk

Asking Research Question• The PICO model:
• Patient Population - Who are your patient and his/her cohorts? Intervention - What action are you considering? Comparison - What are the alternatives? Outcomes - What do you expect to accomplish?
• What type of question do you want to ask?
• Therapy - What treatment and outcomes? Diagnosis - Should I perform this test? Prognosis - What is the outlook for the patient? Harm - What is the relationship between a disease and a possible cause?

A Well Built Clinical Question
Another Example: A new patient presents with mid upper right abdominal pain. She is a 47 year old white woman without any significant past medical history. She is nauseous but has not vomited. She reports no change in her bowel movements and has not eaten anything out of the ordinary today. On physical examination she is very tender in her mid and right upper abdominal region. Lab tests and abdominal x-rays are ordered.
The patient is given over-the-counter antacids. If the pain is not relieved soon, you are considering offering prescription pain control drugs, such as codeine or morphine. But you are worried that the administration of opioid analgesics will interfere with your ability to diagnose the problem….

The appropriate question might be:
PATIENT POPULATION: patients with acute abdominal pain
INTERVENTION: narcotics
COMPARISON: (none)
OUTCOME: do narcotics affect the diagnosis?
Type of Question: Diagnosis or Therapy
Type of Study: Randomized Controlled Trial.
“In patients with acute abdominal pain does the use of narcotics affect the diagnosis of the problem?”

What about our dietary fat and breast cancer question?

The appropriate question might be:
PATIENT POPULATION: adult women
INTERVENTION: dietary fat
COMPARISON: (none)
OUTCOME: breast cancer?
Type of Question: Etiologic
Type of Study: Any
“In adult women, is dietary fat a risk factor for breast cancer?”

Type Meaning Assessment
Statistical Exclusion of chance as an explanation for findings
Statistical test
Clinical Importance of findings for changing current clinical practice
Magnitude of clinical response to an intervention
Biological Findings help to clarify mechanism of action
Compare findings to information from in vitro and in vivo laboratory experimentation
Types of Significance in Clinical Research.
Significance of the reported finding in the context of our research question• statistically significant• biologically plausible• causal association between exposure and disease development• significance of biological markers used in the study• relevance to the population of interest
What Does “Significant” Mean?

Study design considerations• The appropriateness of the study design to the research question should be
assessed. • The incidence rate of the disease in question may be a determining factor. • Although breast cancer is the most common form of cancer among women
in the United States, this disease is diagnosed among only a small proportion of women during a short period of time.
• Accordingly, a case–control study would offer an efficient approach to studying this disease, since the sampling scheme for this type of study identifies affected women once they are diagnosed.
• In fact, studies of dietary fat intake and occurrence of breast cancer have utilized several different designs, including descriptive, case–control, and cohort studies. – The descriptive studies are useful for hypothesis generation, but not for
hypothesis testing. – The case–control and cohort designs provide more compelling evidence to test
specific hypotheses. – To date, all of the published studies of dietary fat and risk of developing breast
cancer in humans have employed observational designs.

“Hierarchy of Evidence”
[Source: Source: SUNY Downstate Medical Center. Medical Research Library of Brooklyn. Evidence Based Medicine Course. A Guide to Research Methods: The Evidence Pyramid: http://servers.medlib.hscbklyn.edu/ebm/2100.htm]

Outcome variables
• In investigations of the relationship between dietary fat intake and risk of developing breast cancer, it is important to specify how the presence or absence of breast cancer was determined. There are several possibilities.
1. Death certificates limit information to deceased subjects. In addition, a variety of studies have shown that information on death certificates may be incomplete or inaccurate
2. Self-reports require that subjects be alive or have relatives who can provide information on breast cancer. If the subjects are not medically sophisticated, they may mistake benign forms of breast disease for breast cancer.
3. Medical records may provide more accurate information. However, it is possible that diagnostic criteria differ from physician to physician, over time, or across geographic regions or countries.
4. Histopathologic diagnoses provide the most definitive information, but adequate tissue must be available for pathologic examination.

Predictor variables (1)
• The _________________ is the risk factor or exposure under investigation.
• Studies may involve a single risk factor of interest or several different predictor variables. If a number of exposure variables are included, they may or may not be closely linked.
• In a study of the cause of breast cancer, an investigator might choose to examine a variety of exposure variables, including reproductive factors such as age at first full-term pregnancy, hormone levels, exposure to radiation, and dietary fat intake.
• Although this sort of study may provide a more comprehensive picture of the causes of breast cancer, it may limit the ability to collect detailed information on each exposure of interest.
Primary explanatory variable?

Predictor variables (2)
• Even if a study is focused on the question of dietary fat and the risk of developing breast cancer, it is necessary to collect some basic information on other possible determinants of breast cancer that could act as confounders.
• _________________ are important because they can provide quantitative documentation of exposure in certain circumstances.
• No biological markers of fat intake are currently available, but to assess long-term intake of dietary fat, the fatty acid content of adipose tissue could be measured in biopsies.
• Obviously, the utility of such a measure depends on the extent to which it accurately reflects consumption patterns.
Covariates?

Method of analysis• The type of statistical test that should be used is determined by:
– The goal of the analysis (eg, to compare groups, to explore an association, or to predict an outcome) and
– The types of variables used in the analysis (eg, categorical, ordinal, or continuous variables).
• By convention, the 5% level of statistical significance is used as a standard in many biomedical studies. That is, the investigator is willing to accept a 1 in 20 risk that the observed effect is a result of chance variation alone.
– 1% or smaller are also quite common (p<0.01)
• However, care must be taken to avoid over-simplistic interpretations of p values. (p<0.05)
• One common mistake is to assume that a statistically significant result is biologically or clinically important (p<0.05).
• Clinical importance and biological plausibility of results are not assessed by hypothesis tests.

Possible sources of bias
Types of Bias in Clinical Research.
Bias Source of Error
Sample distorted by selection process
Misclassification of the variables
An extraneous variable that accounts for the observed result rather than the risk factor of interest
Biases can occur in any study, although certain study designs are moresusceptible to biases than othersPotential biases cannot be assessed in precise quantitative terms but can bereduced or even eliminated through proper study design considerations

Possible sources of bias
Types of Bias in Clinical Research.
Bias Source of Error
selection Sample distorted by selection process
(mis)classification Misclassification of the variables
confounding An extraneous variable that accounts for the observed result rather than the risk factor of interest
Biases can occur in any study, although certain study designs are moresusceptible to biases than othersPotential biases cannot be assessed in precise quantitative terms but can bereduced or even eliminated through proper study design considerations

Selection Bias
• If a paper describes a study of 20 women who ate a variety of fatty foods to see which ones got breast cancer
• Turns out they selected the 20 women from a small town of 200 people whose families had been there for centuries
• Where is the bias?

Misclassification bias
• A case-control study tries to relate dietary fat to breast cancer by looking at death certificates (for cause of death) and comparing them to family-reported dietary activities– 50 cases of women who did not die of breast cancer were
compared to 50 cases of women who did
• But breast cancer may not have been primary cause of death in many cases– Some controls may have been misclassified as non-breast
cancer patients

Confounding Bias
• What is confounding?
• A variable that masks an association between an exposure and an outcome –or that creates a false association

Confounding
Exposure Outcome
Confounder
Shop class/ BreathingEnglish class problems
Smoking

Classic Confounders
AgeSexSocioeconomic statusSmoking status
That’s why, often analyses are stratified by these variables

Confounding
Exposure Outcome
Confounder
Nursing students/ PregnancyEngineering students
Sex

Confounding
A confounder is not in the causal pathway
Example:
Exposure: diet Outcome: heart disease
cholesterol

In the Fat-Breast Cancer Example….? Confounder?
• In studies of dietary fat intake and occurrence of breast cancer, the known risk factors for breast cancer include age, race, reproductive characteristics (eg, age at first full-term pregnancy, number of pregnancies, duration of lactation), obesity among postmenopausal women, alcohol intake, and exposure to radiation.
• If women who eat a high-fat diet have fewer pregnancies than those who eat a low-fat diet, an apparent association between consumption of dietary fat and occurrence of breast cancer could be attributable to the effects of reproductive history rather than to diet per se.

Interpretation of results
• Identify and estimate the magnitude of the effect of bias
• Interpretation of the findings having considered bias• Clinical significance of the findings• Benefit to individual and community health• Importance of non-significant findings

Clinical utility of research findings
Clinical Applications of Various Types of Studies.
Type of Study Application to Clinical Practice
Etiologic Can risk be reduced among susceptible persons?
Diagnostic Can accuracy and timeliness of diagnosis be improved?
Prognostic Can prognosis be determined more definitively?
Therapeutic Can treatment be improved?

And Now A Word on Causality

And Now A Word on Causality

And Now A Word on Causality

And Now A Word on Causality

And Now A Word on Causality
Causality
• Bradford Hill published his “nine criteria” for causality– Not everyone agrees with these criteria
– http://www.drabruzzi.com/hills_criteria_of_causation.htm

Hill’s Criteria
• Temporal relationship• Strength of association• Dose-response relationship• Consistency• Plausibility• Other explanations have been explored• Experiment• Coherence with current knowledge

The Textbook only Likes These:
Strength of observed association
Presence of a dose–response relationship
Correct temporal sequence
Consistency of results across studies
Biological plausibility

So What Has The Lit Review Revealed?

Dietary fat and breast cancer (1)
• Ecologic or correlation studies have demonstrated a consistently strong relationship between dietary habits, as estimated by per-capita consumption of dietary fat, and breast cancer occurrence in different countries.
• Plots of these data have yielded a linear relationship, with increasing fat consumption associated with higher breast cancer occurrence.
• The problem with such studies is that they do not demonstrate that increased dietary fat in individuals is associated with breast cancer occurrence in the same individuals (ie, the ecologic fallacy may be involved).
• In industrialized countries in which fat consumption and breast cancer mortality tend to be higher than in developing countries, it may not be the high fat consumers who are developing breast cancer.

Aside: Ecological Fallacy
• often called an ecological inference fallacy• assumes that individual members of a group have the
average characteristics of the group at large• Stereotypes are one form of ecological fallacy, which
assumes that groups are homogeneous• Example: study shows that areas with high
concentrations of farm animals are also the areas with lowest concentrations of childhood asthma. – It’s a fallacy to then assume that a child who has asthma
must not live near any farm animals

Dietary fat and breast cancer (2)
• The comparatively high mortality rates of breast cancer in industrialized countries may be attributable to other factors, such as earlier menarche, delayed childbearing, or other reproductive factors.
• It has been speculated that mammary neoplasms are controlled by endocrine balance, which in turn is affected by dietary factors, including fat intake.
• Women consuming high-fat diets have been shown to have more circulating estrogen than women on low-fat diets. In postmenopausal women, adipose tissue has been demonstrated to be a contributor to the production of estrogen.
• Dietary fat intake may also have modified DNA synthesis and cell duplication.
• Hormonal carcinogenesis of the breast

So? Do You Have Enough Info To Inform The Patient?

Use A Systematic Review
• A synthesis of the medical research on a particular subject. It uses thorough methods to search for and include all or as much as possible of the research on the topic. Only relevant studies, usually of a certain minimum quality, are included.– NHS

Want To See Some Examples?
• Visit CADTH.CA• Visit COCHRANE.ORG

Systematic review (1)
• ______________ is a type of quantitative systematic review in which the results of multiple studies that are considered combinable are aggregated together to obtain a precise, and hopefully unbiased, estimate of the relationship in question.
• _______________ helps in two specific ways:– 1. By combining a series of smaller studies, each with a
statistically imprecise estimate of effect, a larger sample size is obtained, with a corresponding increase in statistical precision.
– 2. By identifying the differences in findings across different studies, sensitivity analyses can be conducted that may lead to greater insight into the sources of heterogeneity.
Meta-analysis
Um… meta-analysis?

Terminology
• You will find that people use the terms “systematic review” and “meta-analysis” interchangeably and incorrectly
Systematic reviews do not have to have a meta-analysis - there are times when it is not appropriate or possible
A meta-analysis is also possible without doing a systematic review - you could just find a few studies and calculate a result, with no attempt to be systematic about how the particular studies were chosen.
More About Meta-Analysis
• A meta-analysis is a two-stage process.– The first stage is the extraction of data from each
individual study and the calculation of a result for that study (the 'point estimate' or 'summary statistic'), with an estimate of the chance variation we would expect with studies like that (the 'confidence interval').
– The second stage involves deciding whether it is appropriate to calculate a pooled average result across studies and, if so, calculating and presenting such a result.

The “Forest Plot”
• Used in meta-analysis to graphically present the pooled data and the summary conclusion
• Read about it here:– http://www.cochrane-net.org/openlearning/Other/
Forest_plot.pdf


Systematic review (2)
• The steps in a systematic review should follow a clear sequence.
• The first step is to formulate a clear and meaningful question to be addressed. – (1) the type of person(s) involved, – (2) the type of exposure that the person(s) experiences (eg, a risk
factor, a prognostic factor, a diagnostic procedure, or a therapeutic intervention),
– (3) the type of control with which the exposure is compared, and – (4) the outcomes to be addressed. In the context of the patient profile,
we might specify the question in the following way: – For premenopausal women with a family history of breast cancer, is
reduction of dietary fat consumption substantially below levels typical of the American diet likely to reduce the risk of developing breast cancer?

Systematic reviews• The next step is to search for the studies of interest.• Once the articles for potential inclusion are identified, they must be reviewed one
at a time.– Specific eligibility criteria for inclusion must be specified. The included studies should
be directly relevant to the question under consideration. • The actual analysis of the data begins with an estimation of the effect of interest in
each of the included studies. • The results are displayed in terms of estimated relative risk of developing breast
cancer associated with a reduced level of dietary fat intake. • If reducing fat in the diet decreases the risk of developing breast cancer, a relative
risk less than 1 would be expected. • Examination of the corresponding confidence intervals for the individual studies
provides some insight into the statistical precision of the results and whether they are statistically significant. By convention, 95% confidence limits typically are calculated. The odds or risk ratio often is displayed on a logarithmic scale
• Once the individual and combined estimates are obtained, it is useful to consider the level of heterogeneity across the individual results.
• Sensitivity analysis can be performed to identify patterns of results across the individual study results and potentially provide insight into any heterogeneity that exists.

Meta-analysis of dietary fat intake and risk of breast cancer
• A meta-analysis published in 2003 explored the relationship between dietary fat intake and risk of breast cancer.
• This systematic review included 45 studies (31 case–control and 14 cohort), with a combined total of over 25,000 breast cancer patients and 580,000 control or comparison subjects.
• An overall small increase in risk of breast cancer was associated with elevated total fat intake in both the case–control (OR = 1.14) and cohort studies (RR = 1.11).
• The combined association was statistically significant and was higher in the studies judged to be of better quality. Similar findings were observed in analyses of saturated fat and meat intake.

Meta-analysis of five hypothetical epidemiologic studies (A–E) of the relationship between reduced dietary fat intake and the risk of developing breast cancer.

Terms Associated with Meta-Analysis
• Kappa statistic– Measures concordance (agreement) between raters
• Q statistic– Measures homo/heterogeneity
• I2
– describes the percentage of total variation across studies that is due to heterogeneity rather than chance

More on Q
• As we are trying to use the meta-analysis to estimate a combined effect from a group of similar studies, we need to check that the effects found in the individual studies are similar enough that we are confident a combined estimate will be a meaningful description of the set of studies.
• In doing this, we need to remember that the individual estimates of treatment effect will vary by chance, because of randomization. So we expect some variation. What we need to know is whether there is more variation than we'd expect by chance alone. When this excessive variation occurs, we call it heterogeneity.– > Q is a test for heterogeneity

Interpreting Q
• If Q>S-1, then there is significant heterogeneity– If p<0.05 then there is heterogeneity
– If p>0.05 then there is homogeneity

More on I2
• I2, describes the percentage of total variation across studies that is due to heterogeneity rather than chance.
• A value of 0% indicates no observed heterogeneity, and larger values show increasing heterogeneity.

Why Do We Compute Q and I2?
• The degree of heterogeneity will determine what method we use to compute the summary statistics for our meta-analysis– > eg, when heterogeneity is high, we use what’s called a
“random effects model”

Heterogeneity statistics for examples of meta-analyses from the literature. Meta-analyses were conducted using either meta or metan in STATA15
Heterogeneity test
TopicOutcome/analysis
Effect measure
No of studies
Q df PI2(95%
uncertainty interval)*
Tamoxifen for breast cancer16 Mortality Peto odds
ratio 55 55.9 54 0.40 3 (0 to 28)
Streptokinase after myocardial infarction17 Mortality Odds ratio 33 39.5 32 0.17 19 (0 to 48)
Selective serotonin reuptake inhibitors for depression13 Drop-out Odds ratio 135 179.9 134 0.005 26 (7 to 40)
Magnesium for acute myocardial infarction18 Death Odds ratio 16 40.2 15
0.0004
63 (30 to 78)
Magnetic fields and leukaemia19 All studies Odds ratio 6 15.9 5 0.007 69 (26 to 87)
Amantadine11 Prevention of influenza
Odds ratio 8 12.44 7 0.09 44 (0 to 75)

Meta-analyses of six case-control studies relating residential exposure to electromagnetic fields to childhood leukaemia.
Summary odds ratio calculated by random effects method
Eg.