HSBC North America North America . ... credit card loans, ... Pursue opportunities in Trade & Supply...
63
0 Presentation to Investors HSBC North America March 2011 www.hsbc.com
Transcript of HSBC North America North America . ... credit card loans, ... Pursue opportunities in Trade & Supply...

0
Presentation to Investors
HSBC North America March 2011
www.hsbc.com

1
Disclosure statements
This presentation, including the accompanying slides and subsequent discussion, contains certain forward-looking information with respect to the financial condition, results of operations and business of HSBC Holdings plc, HSBC USA Inc. and HSBC Finance Corporation. This forward-looking information represents expectations or beliefs concerning future events and involves known and unknown risks and uncertainties that could cause actual results, performance or events to differ materially from those expressed or implied in such statements. Additional detailed information concerning important factors that could cause actual results to differ materially is available in the HSBC Holdings plc Annual Report as well as the HSBC USA Inc. and HSBC Finance Corporation Annual Report on Form 10-K, each for the year ended December 31, 2010. Please be further advised that Regulation FD prohibits HSBC representatives from answering certain, specific questions during the Q&A session.
HSBC Holdings plc reports financial results in accordance with International Financial Reporting Standards (‘IFRSs’) as issued by the International Accounting Standards Board (“IASB”) and endorsed by the European Union (“EU”). EU-endorsed IFRSs may differ from IFRSs, as issued by the IASB if, at any point in time, new or amended IFRSs have not been endorsed by the EU. At December 31, 2010, there were no unendorsed standards affecting this document and there was no difference between IFRSs endorsed by the EU and IFRSs as issued by the IASB in terms of their application to HSBC.
IFRSs comprise accounting standards issued by the International Accounting Standards Board and its predecessor body and interpretations issued by the International Financial Reporting Interpretations Committee and its predecessor body.
IFRS Management Basis assumes that the mortgages, credit card loans, motor vehicle finance loans and private label customer loans transferred to HSBC’s US banking subsidiary, HSBC Bank USA, National Association (‘HSBC Bank USA’), have not been sold and remain on HSBC Finance Corporation’s balance sheet. IFRS Management Basis also assumes that all purchase accounting fair value adjustments relating to the acquisition of HSBC Finance Corporation by HSBC Holdings plc have been ‘pushed down’ to HSBC Finance Corporation. Operations are monitored and trends are evaluated on an IFRS Management Basis because the loans sold to HSBC Bank USA were conducted primarily to fund prime customer loans more efficiently through bank deposits and such customer loans continue to be managed and serviced by HSBC Finance Corporation without regard to ownership.
All amounts are in US$ unless otherwise stated.

2
Content
Update on HSBC North America Strategy
US Bank Overview
US Bank Strategy
Commercial Banking US
Personal Finance Services US
Global Banking and Markets Americas
Private Banking US
HSBC Finance Overview
Strategy Summary
Cards and Retail Services
Non-Core Consumer and Mortgage Lending
Appendix: HSBC USA Inc. and HSBC Finance Financial Overview

3
This page intentionally left blank
4
Update on HSBC North America Strategy
5
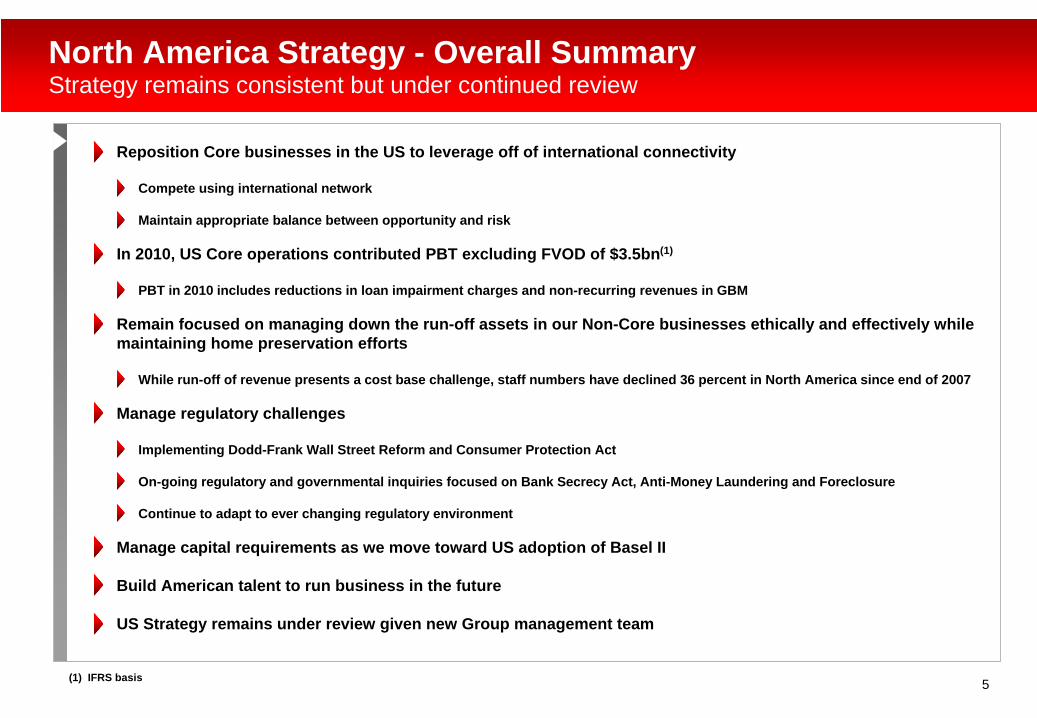
North America Strategy - Overall Summary Strategy remains consistent but under continued review
Reposition Core businesses in the US to leverage off of international connectivity
Compete using international network
Maintain appropriate balance between opportunity and risk
In 2010, US Core operations contributed PBT excluding FVOD of $3.5bn(1)
PBT in 2010 includes reductions in loan impairment charges and non-recurring revenues in GBM
Remain focused on managing down the run-off assets in our Non-Core businesses ethically and effectively while maintaining home preservation efforts
While run-off of revenue presents a cost base challenge, staff numbers have declined 36 percent in North America since end of 2007
Manage regulatory challenges
Implementing Dodd-Frank Wall Street Reform and Consumer Protection Act
On-going regulatory and governmental inquiries focused on Bank Secrecy Act, Anti-Money Laundering and Foreclosure
Continue to adapt to ever changing regulatory environment
Manage capital requirements as we move toward US adoption of Basel II
Build American talent to run business in the future
US Strategy remains under review given new Group management team
(1) IFRS basis

6
North America Strategy - Continuing to Execute Focusing on growing Core and winding down Non-Core
In 2011, HSBC will continue to focus on growing its Core businesses through Global connectivity with strategic market/customers and winding down its Non-Core businesses
PFSCMBGBMCards
PB and Insurance
Core Businesses
Continued strategic expansion of bank branch network consistent with our internationally-led strategy with an additional five branches opened in 2010 and 108 since early 2005
Premier customer base has grown to over 700,000 at December 31, 2010, up 37 percent since year-end 2009. In the US, we have added 55 Premier relationship managers in 2010
PBT of Core operations in 2010 reflects benefit of reductions in loan impairment charges and GBM non-recurring revenues
Commercial Banking reported solid PBT of $939m in 2010 while maintaining focus on connectivity to other HSBC Group businesses and cross-border business referrals which have continued to increase
Global revenues from Corporate and MME clients managed in US of approximately $800m in 2010, with 18 percent booked outside of US
Global Banking and Markets reported strong PBT of $1.6bn in 2010, including the impact of certain non-recurring items, while continuing to focus on global connectivity among emerging and developed markets
Global revenues from clients managed in the US of approximately $2.0bn in 2010, with 61 percent booked outside of US
Cards business continued its strong contribution in 2010, reporting PBT of $2.0bn while successfully implementing the business practices and systems changes required by the Card Act
Continue to invest in Core businesses to preserve/increase value and ensure solid foundation for future growth
Consumer Lending
MortgageServices
VehicleFinance
TaxpayerFinancialServices
Non-Core Run-off Business
Sold vehicle finance servicing platform and remaining US consumer finance vehicle finance loan portfolio in 2010 Completed exit of the Taxpayer Financial Services business in late 2010Although not a significant “run-off” business, the wholesale banknotes business did not fit with our Core strategy in the US, and we substantially completed the exit of this business in 2010Continue to reduce the run-off portfolio:
$58.4bn at December 31, 2010, a 26 percent decline compared to year-end 2009 Fair value as a percentage of book value improved to 68 percent at December 31, 2010 from 59 percent at year-end 2009
Continue to work with our customers who are willing to pay but are having difficulties through the use of modificationModified 42,500 accounts representing $6.0bn of receivables in 2010Since January 2007, we modified and/or re-aged approximately 353,600 accounts representing $41.6bn of receivables at the time of modification/reage
For customers who are unable to pay, we have increased the use of deed-in-lieu and short salesEnsure appropriate work force and operating cost reduction as the run-off book declines

7
Significant North America Entities Ongoing areas of focus in 2011
• Continued focus on expense management and efficient use of capital across all entities• Compliance risk is one of the most significant areas of focus across all entities
HSBC Bank USAAdditional growth efforts in HSBC Premier, Commercial Banking, insurance and wealth management
Leveraging Group relationships and unique global footprint in Global Banking and Markets, Commercial Banking and Private Banking as well as LatAm connections in Global Banking and Markets and Private Banking
Additional focus on CMB especially trade finance
Build on branch expansion efforts by targeting ethnic groups with international connectivity
Regulation and Compliance
Manage cost base
Continue to effectively manage our run-off portfolios to maximize cash collection and capital preservation in an ethical manner
Leading home preservation efforts
Address increase in capital requirements through RWA management and inflow of additional capital
Regulation and Compliance, especially foreclosure oversight
Manage cost base
HSBC Bank Canada Continue to be the leading international bank in Canada
Leverage HSBC’s international capability to continue to be the leading international bank for business in Canada and the best bank for business banking in Canada
Enhance our Premium PFS and Wealth Management proposition
Deliver international markets to Global Banking & Markets clients, enhancing capabilities in the Energy and Mining sector
Manage risk through integrated enterprise-wide risk management
Improve efficiency
HSBC Finance

8
Managing Consumer Finance Risk 2007-2010 Continued progress in managing risk
HSBC begins process to substantially tighten credit in
CL and CRS
Consumer Lending closed
Open to buy exposureIn CRS reduced $65bn in
last 5 quarters
Reduced Private Label Credit Card risk by exiting
47 higher risk or unprofitable partnerships through 4Q 09
Mortgage Services closed
Underwriting risk appetite in UK & Canada
reducedUS Vehicle Finance
closed
Exited all Taxpayer Financial Services relationships except
H&R Block
Canada Vehicle Finance portfolio sold
Decision One closed
HSBC Bank USA broker channel closed
Sale of remaining US consumer finance Vehicle
Finance loans
1Q07 2Q07 3Q07 4Q07 1Q08 2Q08 3Q08 4Q08 1Q09 2Q09 3Q09 4Q09 1Q10 2Q10 3Q10 4Q10
Exit of TFS business
completed
Closed 400 Consumer Lending branches (∼ 30% of
network)
Exit of wholesale Banknotes business
substantially completed

9
HSBC North America Summary Positioning for the future
Reposition our Core businesses in the US to leverage off international connectivity and compete using our international network
Reposition brand to be like rest of HSBC post Household
Remain focused on managing down the run-off assets in our Non-Core business ethically and effectively
Manage regulatory challenges and capital requirements
Build American talent to run businesses in the future
Achieve appropriate cost base
Re-establish reputation with regulators

10
US Bank Overview

11
US Bank Strategy

12
US Bank Businesses Strategy – Summary Focusing on opportunities where we believe we can win
Emerging markets
Cross-border
Wealth
Be the leading international business bank for medium size businessesTarget internationalizing US customersContinue to focus on building our Core proposition to mid-size international companies based on the West Coast and in Texas and Florida
Global Private Banking
Re-positioned as an internationally-led Private Bank in the USDe-emphasize expansion of client base through lending
Global Banking and Markets
Emerging markets-led, financing-focused wholesale bankIntegrated Americas platformCore products for core clientsBe strategic, significant and sustainable
Personal Financial Services
Differentiated premium services to internationally minded customersExpand cross sell opportunities to our Premier customer baseCards and Retail Services
Continue to be profitableContinue to pursue integration of Cards into global business line, leveraging US analytic expertiseExited unprofitable relationships in Retail Services or increased the value of those relationshipsContinue to review risk issues
Commercial Banking
Opportunities

13
US Bank Key Initiatives Initiatives are aligned with our overall strategy
Leverage Miami to help drive growth of our international customer base in Personal Financial Services and Private Bank
United States is the Global Banking and Markets hub for Latin America with focus on cross-regional sales
Align retail branch distribution with internationally led strategy
Engage in more targeted marketing and business development efforts to source new international business with Middle Market clients
Pursue opportunities in Trade & Supply Chain business post-sale of Wells Fargo- HSBC Trade Bank
Increase market share for Wealth and Insurance products
Grow Premier proposition
Key InitiativesOpportunities
Take advantage of emerging markets growth opportunities
Capitalize on expected increase in international and cross-border activities
Capitalize on increasing demand for wealth products

14
US Bank Recent Successes Successes highlight signs of increased traction
Recent SuccessesOpportunities
September 2010
$66.9bn equity follow-on offering
Joint Bookrunner
2010 Rankings
•
#1 in Emerging Markets Bonds Globally
•
#3 in Latin American Local and International Bonds
Source: Bloomberg
•
Best Sovereign Advisory House
•
Best Debt House in Brazil
•
Best Bank for FX for Corporates
•
Best Bank for Emerging LatAm Currencies
•
Best Bank for Forward FX
Insurance
•
Life Insurance application up 14% YoY and commission revenues up 24% YoY
•
Growth in Premier of 135,000 in 2010 of which 41% were new to Bank
Take advantage of emerging markets growth opportunities
Capitalize on expected increase in international and cross-border activities
Capitalize on increasing demand for wealth products
Global Professional Services Firm US$750m annual turnover
Tier 1 and co-arranger role on Secured Credit Facility, in addition to being primary bank for global PCM in a relationship that includes 13 of the 17 countries where the company operates (US, China, HK, UK, Brazil, Russia, the Netherlands, UAE, Egypt, Colombia, India, Poland and Mexico.) Underscores solid reputation in professional services.
Retail US$7+bn annual turnover
Credit facility and offshore LC issuance in Hong Kong to support the company's suppliers in Asia Pacific and the US, managing both sides of the transactions. In addition, serving as primary Asia Pacific bank in China and Hong Kong in support of the company’s global sourcing.
•
Best Emerging Markets Bank
•
Best Emerging Markets Debt House
August 2010
c. $6bn acquisition of Pactiv
Joint Lead Arranger, Joint Bookrunner and Financial Advisor

15
US Bank Strategy Looking forward into 2011
Performance during 2010 reflects signs of increased traction of our strategy
Results in 2010 include reductions to loan impairment charges and non-recurring revenues in GBM
Well-positioned for the future – Continuing to grow and invest in Core businesses that are strategically relevant to HSBC
Market conditions are continuing to improve although overall economic environment remains challenged
Regulatory environment remains uncertain
Ever-changing environment
Regulatory actions and inquiries
Dodd-Frank Wall Street Reform and Consumer Protection Act
Cost management, capital preservation and risk reduction / mitigation efforts will continue

16
Commercial Banking US

17
Commercial Banking US Best International Business Bank
Focus on international client acquisition and increased wallet share
Increase intra-HSBC international and product referrals
Expand regions with strong international connectivity
Growth
Address and resolve Compliance issues with a focus on AML, the Bank Secrecy Act and improved execution across the business
Enhance efficiency through deployment of globally consistent platforms
Operational Excellence
Key differentiator and competitive advantage
Capitalize on increasing international trends in US business
Leverage HSBC’s global scale and connectivity
Invest in brand marketing initiatives and training
Best International Business Bank

18
•
Serving corporates in “Upper MME” ($250m+ annual revenue) and “Core MME” ($30-$250m annual revenue) in a range of industries and specialties.
•
Leveraging global connectivity to grow market share in footprint with US corporates with international needs.
•
Serving businesses with <$30m in annual revenue.•
Repositioning target segment towards international businesses or those owned by internationally-minded individuals, and deposit-rich businesses.
•
Targets institutional and large owners/developers of investment properties. Leverages expertise to increase share of international clients.
•
Relationships are long-term with proven track records and liquidity in stable markets with high barriers to entry.
•
Deals are conservatively structured around qualities such as low LTV, strong debt coverage ratio based on net operating income, personal/institutional guarantees and special purpose entities for institutional ownership.
Middle Market Enterprises (MME)
Business Banking
Commercial Real Estate (CRE)
Key Lines of Business Strategy
Commercial Banking US Key business lines and related strategies
CMB consists of three business lines – Middle Market Enterprises (MME), Business Banking and Commercial Real Estate (CRE); and “joins up” with key product partners including Global Transaction Banking (Payments and Cash Management, Trade and Supply Chain), Global Banking and Markets, Premier/PFS, Private Banking and Insurance.

19
Commercial Banking US MME market opportunity
c. 8,000 international companies (revenues > $30m) in US CMB footprint out of which we bank c. 600
Significant scope for growth in expansion markets
Research demonstrates more companies will need international services in the coming years
HSBC MARKET SHARE*International Companies
NY State Outside NY State
Corporate $250m+ 18% 10%
Core $30 -$250m 8% 2%
** 2010 HSBC International Business Survey, an annual survey of senior financial decision-makers from mid-sized companies (US$20m - US$5bn annual turnover) focusing on the opportunities and challenges when operating in multiple markets worldwide.
US executives planning to increase their overseas sales targets**
20102009
49% 72%
Domestic US businesses planning to engage in cross-border trading for the first time**
2010
23%
* The source of the CMB market data is Dun & Bradstreet
49%

20
Commercial Banking US Grow through differentiated propositions
Diversification from New York State to major financial centers and US export hubs nationwide via ongoing organic expansion.
Increased sales staff 12% YoY.* Training complete for 100% of RMs via suite of international training modules.
2011 expansion in Western US: CMB delivers a full range of international services to MME clients outside the greater New York area.
Business Banking proposition delivered primarily through branch network, supplemented by alternative channels.
Philadelphia Opened in 2005
Boston Opened in 2003
New York – New York City and Downstate
Westchester, Long Island and
New Jersey
Washington, D.C. Opened in 2005
Covering Baltimore
Miami Opened in 2002
New York – Upstate Buffalo, Syracuse, Rochester and Albany, Mid-Hudson
Seattle
Portland
San Francisco Opened in 2004 Covering San Jose
Los Angeles Opened in 2004
Houston Opened in 2008
Chicago Opened in 2006
Notes:* Covers period March 2010 - February 2011

21
Commercial Banking US Increasing momentum and continuing to lead international business
# Successful Cross-Border Referrals*Cross-border business:
Successful cross-border referrals to other HSBC Group offices grew by c. 20% YoY in 2010
0
100
200
300
400
500
600
700
800
900
FY 2008 FY 2009 FY 2010
649
714
855
* Source: HSBC management information

22
Commercial Banking US International banking and building the franchise
High value business wins demonstrate market potential for HSBC:
Lifestyle Company US$5bn annual turnoverAgent role in RCF, bank guarantees, credit and FX lines to support the company’s international expansion in Asia, building on existing payments and cash management business and HSBCnet services for the company in all of their Asia Pacific countries, including China, Hong Kong, Taiwan, South Korea, Singapore and Malaysia.
Retail US$7+bn annual turnoverCredit facility and offshore LC issuance in Hong Kong to support the company's suppliers in Asia Pacific and the US, managing both sides of the transactions. In addition, serving as primary Asia Pacific bank in China and Hong Kong in support of the company’s global sourcing.
Global Professional Services Firm US$750m annual turnoverTier 1 and co-arranger role on Secured Credit Facility, in addition to being primary bank for global PCM in a relationship that includes 13 of the 17 countries where the company operates (US, China, HK, UK, Brazil, Russia, the Netherlands, UAE, Egypt, Colombia, India, Poland and Mexico.) Underscores solid reputation in professional services.
Education Services US$2.5+bn annual turnoverPayments and cash management in Asia Pacific (Australia, New Zealand, China, Hong Kong, Singapore, Korea, India and South Africa) including liquidity services, transactional account services, payables, receivables, client access via HSBCnet and Connect, and 75+ accounts worldwide.
Leveraging our award-winning global franchise:
HSBCnet Best of Breed Leading Online Corporate Banking Platform – Global Study
2010 Online Services Benchmarking Study
Empire Award - #1 504 Lender in New York
2010
5th Consecutive Year
Best Global Emerging Markets BankBest Cash Management House - Middle EastBest Bank - Hong Kong and Bermuda
2010 Awards for Excellence

23
Personal Financial Services US
24
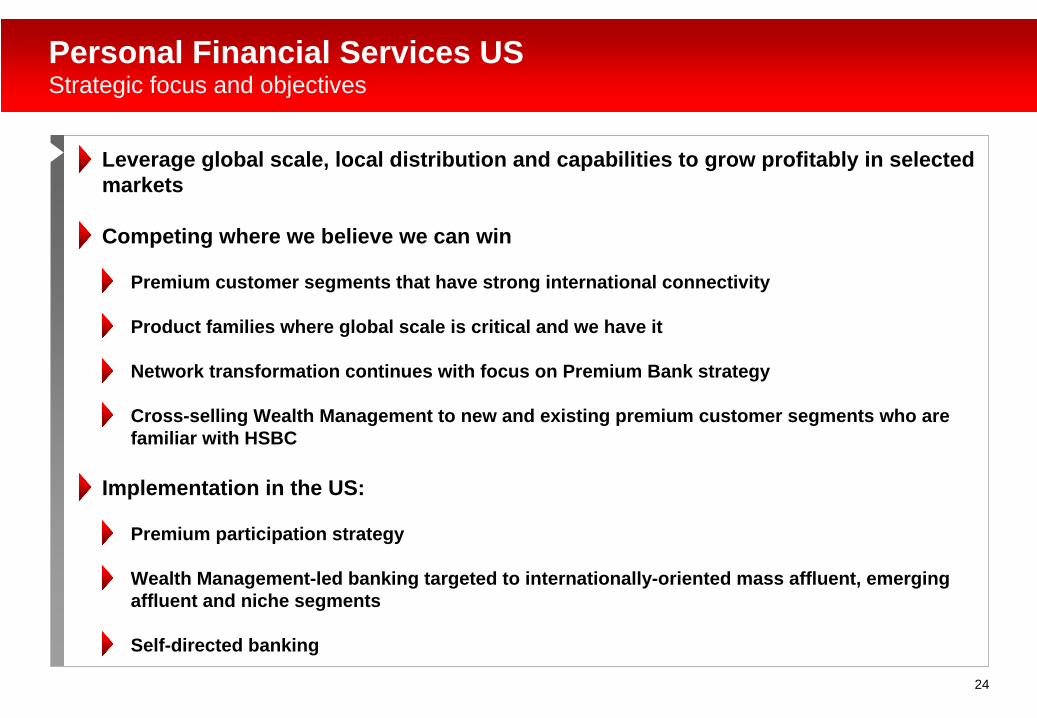
Personal Financial Services US Strategic focus and objectives
Leverage global scale, local distribution and capabilities to grow profitably in selected markets
Competing where we believe we can win
Premium customer segments that have strong international connectivity
Product families where global scale is critical and we have it
Network transformation continues with focus on Premium Bank strategy
Cross-selling Wealth Management to new and existing premium customer segments who are familiar with HSBC
Implementation in the US:
Premium participation strategy
Wealth Management-led banking targeted to internationally-oriented mass affluent, emerging affluent and niche segments
Self-directed banking

25
Personal Financial Services US Disciplined execution with 4 areas of focus
Customer
Drive a relationship banking strategy underpinned by superior service
Customer acquisition focus remains on the fast- growing internationally minded “cosmocrat” customer segments where we believe we can win
Emphasis on cross- selling Wealth Management products (e.g., insurance, investments) to new and existing premium customers
One HSBC
Business transformation enabled by technology – represents a fundamental change in the way we do business (as of December 2010 78% of branches were upgraded to Deposit Automation)
Driven by the business to drive a superior and consistent customer experience at a lower cost of delivery
Simplification
Continuing to pursue a multi- channel strategy
Selective growth – c. 100 net new branches added since early 2005
Shift towards network footprint consistent with our premium strategy
Distribution
Ongoing efforts to optimize and simplify the business
Mortgage business integrated with PFS to leverage resources
Focus shifted from standalone products to products tailored for Premier proposition
Focus on expense reduction to make a material change in cost efficiency ratio for the business

26
Personal Financial Services US Branch network transformation consistent with our premium bank strategy
Aligning retail branch network size and geographic distribution with our internationally-led strategy
Focusing on high density, segment specific prospects in internationally connected cities
Optimizing our US resources and providing the greatest customer reach in support of our global proposition
Network in CA has grown from 8 to 36 since early 2005
22% of the network now resides outside New York State, driving approximately 52% of all New-to- HSBC Premier customers
5 new branches opened in 2010. Additional new branches will be opened as the opportunity arises
Note: As of December 2010
HSBC Branches as of Dec-10

27
Personal Financial Services US Strong momentum in Premier and Insurance
Premier Growth in Premier customers(2) and deposits(3)
Notes:(1) Source: Internal management information(2) Excludes Premier accounts in Global Private Banking (3) IFRS basis
Target internationally minded mass affluent segment
Strong account and balance growth through Dec-10
Premier Customer base has grown to ~490k as of Dec-10, which represents a 6% QoQ increase. US is now #3 globally in total Premier customers(1)
In 2010, there was a net change of 135k in Premier customers, of which 41% (or 55k) were New-to-Bank customers(1)
Wealth Management
AUM (deposits & investment balances) have more than tripled since 2007 and was over $42bn as of Dec-10
HSBC World Selection Funds are distributed in 26 countries and AUM for US was over $1.4bn as of Dec-10
Through Dec-10, mortgage loan originations were 90.9% multi-product relationship or CRA credit, including 6,090 new to Premier relationships acquired
For full year 2010, life insurance applications were up 14% YoY and commission revenues were up 24% YoY(1)
140
190
240
290
340
390
440
490
Jun-07 Dec-07 Jun-08 Dec-08 Jun-09 Dec-09 Jun-10 Dec-10
Customers(000's)
$12$17
$22$27$32$37
$42$47
AUMBalances ($bn)
Total Premier Customers (left hand scale)Premier AUM (deposit + Investment balances) (right hand scale)

28
Personal Financial Services US Positive trend in customer recommendation and brand health
Customer Recommendation Competitive Gap
Source: Synovate
Brand Health Index Competitive Gap
(10)
(8)
(6)
(4)
(2)
-
2
4
1Q08
2Q08
3Q08
4Q08
1Q09
2Q09
3Q09
4Q09
1Q10
2Q10
3Q10
4Q10
Com
petit
ive
Gap
Source: Synovate
0.0
0.5
1.0
1.5
2.0
2.5
3.0
3.5
FY 2008 FY 2009 FY 2010
Com
petit
ive
Gap
Customer Recommendation scores increasingly better than peer group
US achieved a #1 market rank in 1Q10, and #2 for FY 2010
Since 2008, Brand Health Index scores have improved significantly relative to peer group

29
Global Banking and Markets Americas

30
Global Banking and Markets Americas Aim to be strategic, sustainable and significant
Drive connectivity between emerging and developed markets
Focus on delivery of Core HSBC products to core GBM Clients
Continue to manage and run off legacy positions
Strategic alignment to HSBC Group strategy
Achieve returns within HSBC Group’s target range
Support build-out of top 3 Latin American franchise
Leading North American bank for international business
Significant contribution to HSBC Group profits
Leverage HSBC connectivity to develop lower volatility revenue streams
Increase penetration of other HSBC Group customer segments
Foster culture that prioritizes all business risk equally
Sustainable business model and culture

31
Global Banking and Markets Americas Executing our strategy by joining up across the region and customer groups
Integrated approach to client planning & coverage; co-accountability for delivery
Selective investment in talent and new products
Address sub-optimal return, exit Non-Core business lines
Joining up and growing our business
Increase inbound and outbound Multinationals business
Deliver Global Banking and Markets as a “product” into Commercial Banking
Contribute fully to regional Wealth Management strategy
Cross-customer group, cross-regional connectivity
Progress regional operating model with New York as management hub
Recycle balance sheet to support Latin American clients
Encourage intra-regional and global employee mobility
Continue integrating the Americas region
Focusing on sustainable growth across the Americas region

32
Global Banking and Markets Americas results Recovery in results, aligned to global strategy
0.6 0.9 0.9
(2.5)
0.71.6
2.5
(1.9)
1.6
(3.0)
(2.0)
(1.0)
-
1.0
2.0
3.0
2008 2009 2010
Global Banking and Markets Americas Profit before tax, US$bn
North America
64%
Latin America
36%
Global Banking and Markets Americas Profit before tax, 2010 % share
Latin AmericaNorth America

33
34%
16%
28%
7%7%
4%
4%
Global Banking and Markets Americas Trend of significant revenues leveraging global network
61% of US client portfolio revenues were booked outside of the US in 2010
-
500.0
1,000.0
1,500.0
2,000.0
2,500.0
2008 2009 2010
US client portfolio revenues, 2008 - 2010 US client portfolio revenues booked overseas, 2010 % share
Booked outside the USBooked in the US
Other
68%
52%61%
32%
48%39%
US clients drive revenues for Global Banking and Markets in many locations globally

34
Global Banking and Markets Americas Market recognition of our successful strategy
•
Best Emerging Markets Bank•
Best Emerging Markets Debt House•
Best Sovereign Advisory House•
Best Wealth Management House•
Best Debt House in Brazil
#4 in International Bonds Globally
#1 in Emerging Markets Bonds Globally
#3 in Latin American Local and International Bonds
#3 in Brazilian Local and International Bonds
#3 in Mexican Local and International BondsSource: Bloomberg
Recent awards
FY 2010 rankings
Key transactions
Driving Cross-Customer Group Connectivity
October 2010
$350m 10-year senior unsecured notes
Joint Bookrunner
August 2010
c. $6bn acquisition of Pactiv
Joint Lead Arranger, Joint Bookrunner and Financial Advisor
May 2010
Acquisition of Farmacias Ahumada (FASA)
Lead Advisor
Driving Cross-Regional Connectivity
October 2010
$600m acquisition of Eastman’s North American PET, PTA and related businesses
Exclusive Financial Advisor
September 2010
$66.9bn equity follow- on offering
Joint Bookrunner
March 2010
Acquisition of a 31.2% stake in Cimpor
Financial Advisor
•
Emerging Markets Bond House of the Year•
Financial Bond House of the Year•
US Loan of the Year: Kraft•
Leveraged Loan of the Year: Reynolds Group•
LatAm Loan of the Year: Americas Mining Corp•
LatAm Bond of the Year: Odebrecht
•
Best Bank for FX for Corporates•
Best Bank for Emerging Latin American Currencies•
Best Bank for FX Research and Strategy •
Best Bank for Forward FX
•
Most innovative Investment Bank for Bonds •
Most innovative Investment Bank for Corporates
35
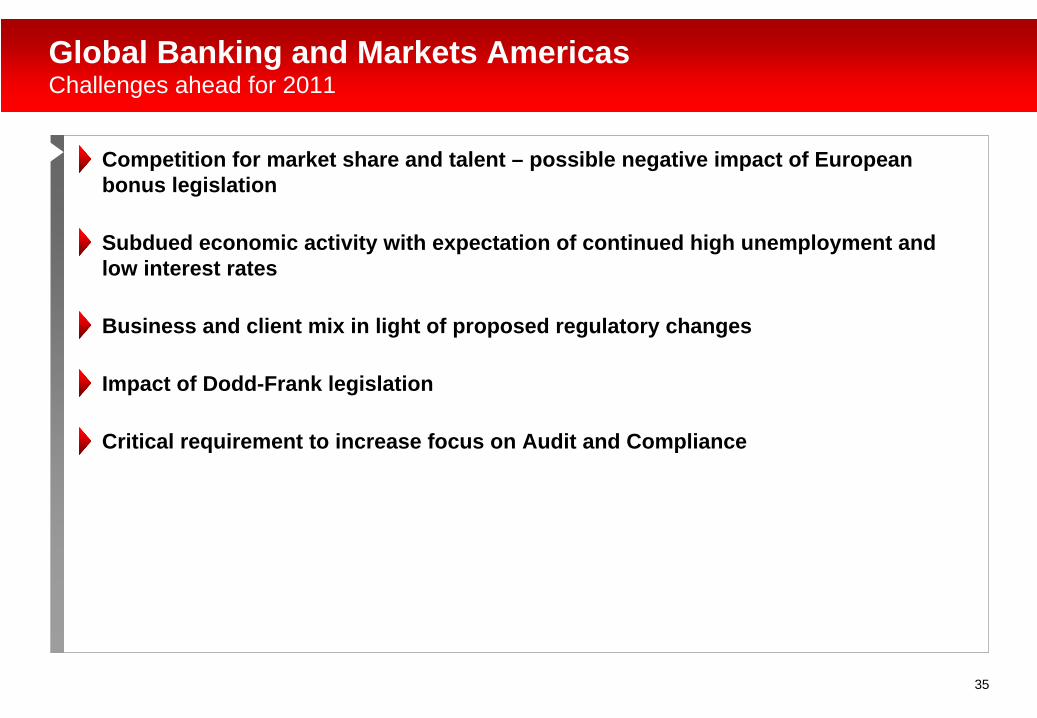
Global Banking and Markets Americas Challenges ahead for 2011
Competition for market share and talent – possible negative impact of European bonus legislation
Subdued economic activity with expectation of continued high unemployment and low interest rates
Business and client mix in light of proposed regulatory changes
Impact of Dodd-Frank legislation
Critical requirement to increase focus on Audit and Compliance

36
Private Banking US

37
Private Banking US Strategic focus and objectives
Internationally-led private bank with a single integrated business model for both domestic and international clients in terms of product and service excellence
Focus on emerging markets – Continue to drive global Latin American strategy out of the US
Capitalize on improved market conditions, economic recovery and client willingness to increase risk profile
Strengthen our relationship management model
Emphasize HSBC’s record of success and stability during difficult economic times, and our long-standing tradition of trust, transparency and performance
Enhance the “One Private Bank” in which the organization structure serves both domestic and international clients
De-emphasize expansion of client base through lending
Investments
•
Provide an international investment offering with recognized expertise in alternative investments, hedge funds and emerging markets
Wealth Planning
•
Offer global wealth planning, trust and insurance solutions delivered through 22 service locations worldwide
Capital Advisory
•
Leverage the HSBC Group Commercial Banking and Global Markets resources on behalf of our clients
Offshore Services
•
Develop the Miami office as the hub of offshore services for the Latin American region (one of the world’s fastest growing wealth markets)

38
International connectivity:
Almost 90% of onshore and offshore clients in the Americas have international connectivity through multi-national residences and business activities
Capability to service clients globally with 90+ locations in 42 countries and territories in the Americas, Europe, Asia-Pacific, Middle East and Africa
Strength in Latin America:
Relationship manager teams in Miami serve five regions: Brazil, Mexico, Andes, Southern Cone and Central America/Caribbean
Largest offshore private banking operation in Miami
Miami hub supported by 14 offices in the region
Capability to coordinate offshore services with onshore services in Brazil, Mexico and Panama
Joined up to HSBC Group:
Strong momentum in cross-referrals with other HSBC businesses
Particular focus on cooperation with Commercial Banking and capital markets
Private Banking US Key strengths
Key Strengths

39
This page intentionally left blank
40
HSBC Finance Overview

41
HSBC Finance Strategy Summary Managing what we can control
Focus on Managing
What We Can Control
RiskUnderwriting changes and reduction in product offeringsClosure of businessesKeeping people in their homes where it makes economic sense to do soCompliance
Addressing deficiencies in foreclosure processes
Balance sheet managementLeveraging bank fundingReducing balance sheet to manage capital needed from GroupManaging cash to repay debt
Cost managementContinuing focus on expenses Strengthening our operations for greater operational efficienciesJoining up support functions to optimize shared services across North AmericaUsing Cards skill set to develop Cards businesses in other parts of the Group
PeopleDeveloping talent and exporting talent across the globe Retaining key people while allowing the work force to shrink as the run-off book declines

42
HSBC Finance Strategy Summary Despite actions we cannot control all factors
Taking Decisive Action
Environmental Factors
Affecting our Business
Which We Cannot Control
Run-off certain Non-Core portfolios and exiting businessesConsumer LendingMortgage ServicesVehicle Finance
Sold our vehicle finance loan servicing operations in March 2010Remaining US consumer finance vehicle loan portfolio sold in Q3 2010
Reduced the scope of the Taxpayer Financial Services business and completed the exit of this business in December 2010Leading Home Preservation EffortsResponded to changes in customer behavior caused by the recent economic turmoil and shortened the write-off period for real estate secured and personal non-credit card receivables to 180 days
Home price depreciation
Unemployment
Legislation/Regulatory LandscapeCARD Act
Dodd-Frank Wall Street Reform and Consumer Protection Act
Recent results while encouraging include the benefit associated with the actions we have taken, future performance is partly dependent upon economic factors we cannot control

43
HSBC Finance Strategy Summary Strategy split between Core business and Run-off businesses
Consumer Lending
MortgageServices
VehicleFinance
TaxpayerFinancialServices
HSBC has focused on managing what we can control and have split our run-off businesses from our continuing businesses… 2 parts of HSBC Finance business, today
• Continue to enhance collection analytics and risk strategies, continued effort to reach out and assist mortgage customers, focus on cost management, deliver high brand value and focus on talent management and career development
• Continued focus and emphasis on compliance risk
Card and Retail
Services
Core Businesses
BusinessesExited orin Run-off
Continues to be profitableContinue to pursue integration of Cards into global business line, leveraging US analytic expertise. Systems platform already globalExited unprofitable relationships in Retail Services or increased the value of those relationshipsContinue to review risk issues – geography, mortgage holders, unemployment, and monitor mix between sub-prime and primeRestarted mailings in sub-prime
Focus on collection and default management strategiesContinue to assist customers utilizing appropriate modification and other account management programs to maximize collection and home preservationEnhance RE loan modifications analyticsCollect effectively but ethicallyRun-off and managed disposition of CL portfolioRun-off and managed disposition of MS portfolioRun-off and managed disposition of VF portfolioTFS business – previously exited all independent relationships, H&R Block exited in December 2010

44
Cards and Retail Services

45
Cards & Retail Services (“CRS”) – Overview Maintained profitability during downturn, expanded profitability in 2010
Note: Card and Retail Services represents a business segment of HSBC Finance Corporation(1) Source: The Nilson Report(2) At December 31, 2010(3) 2009 excludes goodwill write-off of $530m
Credit Card overviewSeventh-largest US MasterCard/Visa issuer(1)
US$19.3bn in managed receivables, approximately 15 million active accounts
Retail Services overviewThird-largest private label issuer(1)
US$13.6bn in managed receivables, approximately 14 million active accountsMore than 20(2) active merchant relationships
2010 vs. 2009: Pre-tax profit higher than prior yearNet interest margin has increased 138bpsLower loan impairment charges on lower loan levels, actions taken by customers to reduce debt levels, actions we have taken to reduce risk, and improvement in the underlying credit quality of portfolioLower fees from reduced receivables, lower delinquency levels, shift in customer behavior and impacts from the CARD Act
Pre-tax Profit (US$m)
$2,259
$837$641
$2,039
0
600
1,200
1,800
2,400
3,000
2007 2008 2009 2010
After-tax – ROA 3.09% 1.15% .96% 4.05%
(3)

46
CRS Open Lines of Credit Were Stable in 2010 After significant reductions in previous years
Note: Data from HSBC Finance Corporation 2010, 2009, 2008 and 2007 Form 10-K
US$bn
$162
$123
$96 $99
0
50
100
150
200
4Q07 4Q08 4Q09 4Q10
Contraction occurred as a result of credit line reductions, restrictive credit line increase criteria, tighter authorizations, inactive account closures and reduced balance transfer activityIn light of improving economic environment, loss mitigation programs have been reducedReducing open lines of credit results in lower capital requirements under Basel II

47
As the Outlook Improves, CRS will Evaluate Growth Opportunities Ensuring a solid foundation for future growth
Marketing
Increasing marketing spend to grow new account bookings where expected to exceed return on risk-adjusted capital and profitability hurdles Incorporated impact of CARD Act – continued testing and roll-out of new price points and product constructs and initiating new product development. Estimated reduction of revenue net of loan impairment charges of approximately $200m during 2010There is the potential for further regulation/legislation in 2011, with impacts including, but not limited to, credit insurance/protection productsConsidering new retail partnerships and card acquisitions as appropriate to preserve/enhance value
Underwriting
Selectively increasing credit line, spend programs and balance transfer activities where prospective views support profitable outlookOngoing efforts to improve customer satisfaction in service operations
PortfolioActions
Economic stress continues to be applied to investment decision modelsImplemented a series of new underwriting models and policies developed with downturn experience Selectively relaxing underwriting criteria where historic performance and prospective views support profitable outlook

48
Group Cards Presence and Global Cards Strategy CRS is a critical component of Group Cards presence and strategy
Group Cards PresenceHSBC has credit cards in 53 countries and territories across six continents, making it one of the few truly global players in the industry
Over 100 million credit cards in force
Global Cards Strategy
Support for PFS Premier strategy
Improve card capabilities by knowledge transfer and establishment of regional centers of excellence
Develop and deploy the Global cards target operating model
Contribution to Group
Contributed to the development of a globally common system infrastructure (over 80% Global Cards on US platform that can be used in other geographies)
Global Analytics – Project to standardize and organize customer, risk and collection analytics on a regional basis under a common infrastructure
CRS supports the Global Center of Excellence for Contact Management, a utility for optimizing dialing, staffing and alternative contacts for collections, which is core to One HSBC Collections
Implementation of One HSBC Cards conversion to create a global platform providing scale and improved customer experience is a key goal for 2011
49
Non-Core Consumer and Mortgage Lending
50
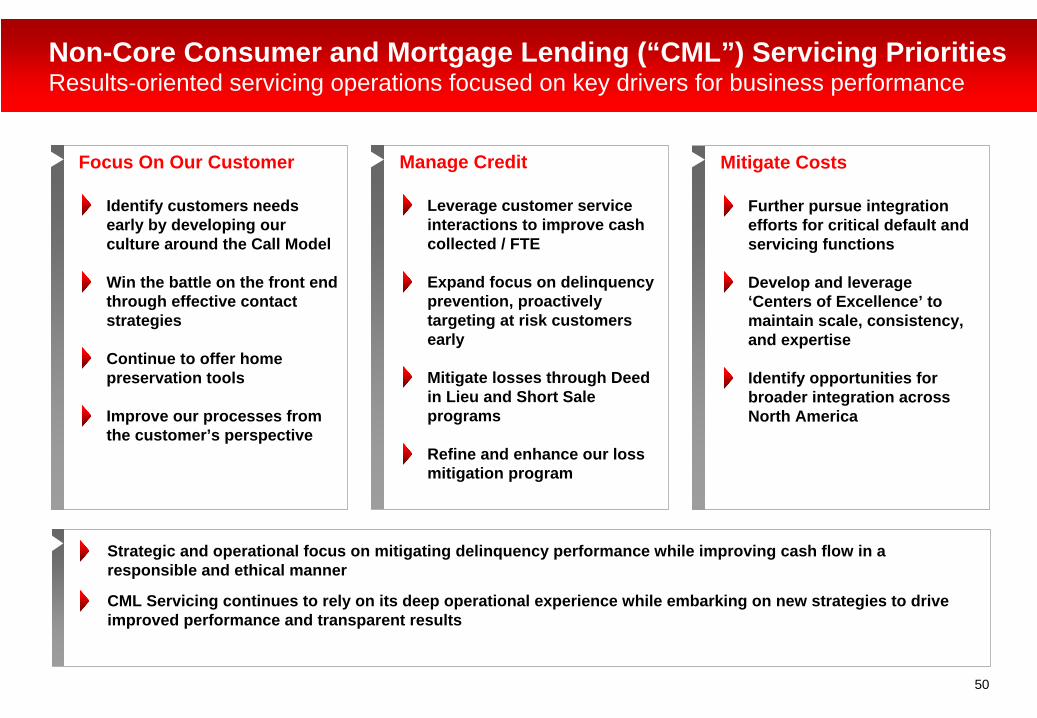
Non-Core Consumer and Mortgage Lending (“CML”) Servicing Priorities Results-oriented servicing operations focused on key drivers for business performance
Focus On Our Customer
Identify customers needs early by developing our culture around the Call Model
Win the battle on the front end through effective contact strategies
Continue to offer home preservation tools
Improve our processes from the customer’s perspective
Mitigate Costs
Further pursue integration efforts for critical default and servicing functions
Develop and leverage ‘Centers of Excellence’ to maintain scale, consistency, and expertise
Identify opportunities for broader integration across North America
Manage Credit
Leverage customer service interactions to improve cash collected / FTE
Expand focus on delinquency prevention, proactively targeting at risk customers early
Mitigate losses through Deed in Lieu and Short Sale programs
Refine and enhance our loss mitigation program
Strategic and operational focus on mitigating delinquency performance while improving cash flow in a responsible and ethical manner
CML Servicing continues to rely on its deep operational experience while embarking on new strategies to drive improved performance and transparent results

51
CML is an Industry Leader in Homeownership Preservation Loan modification is a critical component of our strategy
Culturally, homeownership preservation has been embedded in our operating philosophy for years
In 2009, we completed 104,300 loan modifications totaling approximately US$14.6bn
In 2010, we completed 42,500 loan modifications totaling approximately US$6bn
Volume of modifications and/or reages may have begun to level off as over 50% of the portfolio has already been modified and/or reaged through aggressive outreach in 2008 and 2009
Account modifications in 4Q 2010 provided an average payment relief of 25.4%
As of December 31, 2010, approximately 56 percent of all loans modified and/or re-aged since January 2007 are less than 60 days delinquent or have paid in full
Our recidivism rates compare favorably to market experience in general
Modification when used appropriately improves cash collections and avoids foreclosure where determined to be appropriate
As a result of the higher modification levels, we are also seeing an increase in TDRs
Note: Data from 2008 10-K, 2009 10-K and 2010 10-K, US GAAP legal entity basis
Portfolio Snapshots 12/31/07 12/31/08 12/31/09 12/31/10
Total Real Estate Modifications and/or Reages US$17bn US$26bn US$30bn US$27bn
% of Real Estate Portfolio with modification and/or reages 20% 36% 51% 54%

52
CML Exit Strategies Foreclosure viewed as a last resort
But when home preservation efforts fail…
Short Sale / Deed in LieuProactive exit strategies since Jan 2009, targeting customers who can no longer afford the home
Providing cash relocation assistance and waiving deficiency balances
Reduces loss severity and accelerates resolution of the delinquency
ForeclosureForeclosure viewed as a last resort, only after all other alternatives have been exhausted and when borrower is seriously delinquent
Several key procedural improvements had been taken as a result of our own internal reviews and we will continue to work very closely with our regulators to improve our procedures
REOFocused on maximizing net sales proceeds, minimizing expenses and returning capital to the business as quickly as possible
REO inventory is rising, despite efforts to manage through alternative exit options
REO turn times (Title to Sale) have reduced, indicating some stabilization of the housing market
Note: Data from HSBC Finance Corporation 2010 Form 10-K, and 2009 Form 10-K
100
150
200
250
Q2 2009 Q3 2009 Q4 2009 Q1 2010 Q2 2010 Q3 2010 Q4 2010D
ays
40%
45%
50%
55%
60%
Q2 2009 Q3 2009 Q4 2009 Q1 2010 Q2 2010 Q3 2010 Q4 2010
4k
6k
8k
10k
12k
Q2 2009 Q3 2009 Q4 2009 Q1 2010 Q2 2010 Q3 2010 Q4 2010
REO Turn Times (Title to Sale)
REO Inventory
Foreclosure Severity

53
CML Going Forward Continue to focus on our strategic initiatives
Going forward we will continue to focus on our strategic initiatives
Home Preservation
Continuing to offer home preservation tools, enhancing our programs to maximize the economic benefit for HSBC and our customers, aligning processes across business units to obtain benefits of scale and efficiency
Improving Cash Flows
Where appropriate, focusing on shifting volume from foreclosures to short sale and deed-in-lieu, taking advantage of lower loss severities, and exploring opportunities for loan sales as the economic environment improves and asset prices strengthen
Driving Efficiency
Refine and enhance our customer contact strategies, leveraging all touch points with the customer to launch collections discussions regarding delinquent debt, with the goal of increasing cash collected per FTE and reducing customer handoffs
Reducing Costs / Integration
Continue to focus on integration across the business to maintain scale, consistency, and expertise through consolidation where feasible while ensuring flexibility to adapt to future demands
Capital generation through risk weighted asset reductions
Additionally, we will continue to ensure we maintain adequate credit loss reserves and focus on improving our foreclosure oversight

54
Appendix – HSBC USA Inc. and HSBC Finance Financial Overview

55
HSBC USA Inc. – 2010 Financial Results
(1) Customer loans and advances include reverse repo balances
282,52784,194Customer loans and advances (as at the period end) (1)
100+(899)2,408Profit (loss) before tax from continuing operations
(4)(3,057)(3,192)Total operating expenses
75(3,687)(919)Loan impairment charges and other credit risk provisions
100+(565)162Fair Value Option on own debt
(1)6,4106,357
Net Operating Income before loan impairment charges, excluding changes in FV of own debt
20092010
% Better (Worse)
IFRS, US$m
2010 vs 2009% Better/(Worse)Year Ended December 31

56
HSBC USA Inc. – Profit (Loss) Before Tax by Customer Group
IFRS, US$m
Year Ended December 31, 2010 2009 %Better/(Worse) 2010 vs 2009
Personal Financial Services (excluding Consumer Finance) (187) (693) 73
Consumer Finance 902 293 100+
Commercial Banking 363 135 100+
Global Banking and Markets 1,106 3 100+
Private Banking 112 (52) 100+
Other 112 (585) 100+
Total profit (loss) before tax from continuing operations 2,408 (899) 100+

57
HSBC USA Inc. – Loans Outstanding
US GAAP, US$bn
At December 31 2010 2009% Better/(Worse)
2010 vs 2009
Total commercial loans 30.3 30.3 -
Consumer loans:
Residential mortgages 17.5 17.9 (2)
Private label cards 13.3 15.1 (12)
Credit cards 10.8 13.0 (17)
Other consumer 1.2 3.2 (63)
Total consumer loans 42.8 49.2 (13)
Total loans 73.1 79.5 (8)
Allowance for credit losses (2.2) (3.9) 44
Loans, net 70.9 75.6 (6)
Loans held for sale
Commercial loans held for sale .9 1.4 (36)
Consumer loans held for sale .1 .4 (75)
Total loans held for sale 1.0 1.8 (44)

58
US$m2009 YTD 2010 YTD
Core(1) Non-Core(1) Total Core(1) Non-Core(1) Total
Net operating income before loan impairment charges excluding changes in Fair Value of Own Debt due to credit spreads (FVOD)(2) 7,568 4,623 12,191 6,131 2,681 8,812
Loan impairment charges and other credit risk provisions 5,064 8,017 13,081 2,180 5,709 7,889
Total operating expenses excluding goodwill impairment 1,863 1,498 3,361 1,912 1,083 2,995
Profit/(Loss) from continuing operations before tax excluding goodwill impairment and FVOD(3) 641 (4,892) (4,251) 2,039 (4,111) (2,072)
Profit before tax from discontinued operations(4) - 171 171 - (175) (175)
Profit/(Loss) before tax excluding goodwill impairment and FVOD 641 (4,721) (4,080) 2,039 (4,286) (2,247)
Notes:(1) Card and Retail Services segment represents our Core operations and our Consumer and All Other business segments represents our Non-Core operations. The Consumer segment represents the run-off
businesses of Consumer Lending, Mortgage Services, and through August 2010, our Vehicle Finance business.(2) Net operating income before loan impairment charges includes the effect of non-qualifying hedges (“NQHs”) of $197m income in 2009 and ($394m) loss in 2010. (3) Profit/(loss) from continuing operations before tax excluding goodwill impairment and FVOD can be reconciled to reported IFRS Management Basis results as follows:
See Note 24 ‘Business Segments’ of the HSBC Finance Corporation U.S. SEC filings on Form 10-K for the period ended 31 December 2010 for further information related to business segment results.(4) In August 2010, we sold the remainder of our Vehicle Finance loan portfolio to Santander Consumer, USA Inc. and as a result of this transaction, our Vehicle Finance business is now reported as discontinued
operations within our U.S. SEC filings for HSBC Finance Corporation. In December 2010, we decided to exit the Taxpayer Financial Services (TFS) business and we will not offer any tax refund anticipation loans or related products for the 2011 tax season. As a result of this decision, our TFS business is also reported as discontinued operations within our U.S. SEC filings for HSBC Finance Corporation.
2009 YTD 2010 YTD
Core Non-Core Core Non-Core
Profit/(Loss) from continuing operations before tax excluding goodwill impairment and FVOD as reported above 641 (4,892) 2,039 (4,111)
Adjustments:
Goodwill Impairment (530) (2,385) – –
Changes in FVOD – (3,334) – 120
Profit/(Loss) before tax as reported 111 (10,611) 2,039 (3,991)
HSBC Finance Corporation 2010 Financial Results

59
US$m
2009 YTD 2010 YTD
Card and Retail
Services
HUSI excl Consumer
FinanceTotal
Card and Retail
Services
HUSI excl Consumer
FinanceTotal
Net operating income before loan impairment charges excluding changes in Fair Value of Own Debt due to credit spreads (FVOD) 7,568 3,719 11,287 6,131 4,421 10,552
Loan impairment charges and other credit risk provisions 5,064 1,614 6,678 2,180 (53) 2,127
Total operating expenses excluding goodwill impairment 1,863 2,969 4,832 1,912 3,030 4,942
Profit/(Loss) from continuing operations before tax excluding goodwill impairment and FVOD(1) 641 (864) (223) 2,039 1,444 3,483
Profit before tax from discontinued operations(2) - 73 73 - 28 28
Profit/(Loss) before tax excluding goodwill impairment and FVOD 641 (791) (150) 2,039 1,472 3,511
Notes:(1) US Core Operations is comprised of the US Bank holding company, HSBC USA Inc. and the Card and Retail Services Segment of HSBC Finance Corporation. Card and Retail Services is presented on an IFRS
management basis, which includes assets from both HSBC Finance Corporation and HSBC USA Inc. Profit (Loss) before tax excluding FVO can be reconciled to IFRS results as follows:
See Note 24 ‘Business Segments’ of the HSBC Finance Corporation and the HSBC USA Inc. Form 10-K within our US SEC filings for the period ended 31 December 2010 for further information related to business segment results.
(2) In June 2010 we decided to exit our wholesale Banknotes business. As a result of this decision, our Banknotes business is reported as discontinued operations in our Form 10-K within our US SEC filings.
2009 YTD 2010 YTD
Card and Retail Services HUSI Card and Retail
Services HUSI
Profit/(Loss) from continuing operations before tax excluding goodwill impairment and FVOD as reported above 641 (864) 2,039 1,444
Adjustments:
Goodwill Impairment (530) – – –
Changes in FVOD – (328) – 62
HUSI Consumer Finance profit – 293 – 902Profit/(Loss) before tax as reported 111 (899) 2,039 2,408
US Core Operations – HSBC Finance Corporation and HSBC USA Inc. 2010 Financial Results

60
Customer loans(1), (3), US$bn
2+ Delinquency (1), (2), (3), US$bn
11.011.112.113.6
17.116.816.316.616.510.4
11.2% 12.0% 12.4% 13.5% 14.3%11.7% 11.2% 10.9% 11.8% 11.4%
0
5
10
15
20
4Q08 1Q09 2Q09 3Q09 4Q09 Pre180 day
4Q09 1Q10 2Q10 3Q10 4Q100%
5%
10%
15%
20%
25%
Notes:(1) Excludes reverse repo balances for all periods presented and vehicle finance loans held for sale in 2Q09 through 1Q10.(2) 2+ Delinquency ratio as a percentage of end-of-period customer loans.(3) During 3Q10, we sold the remainder of our Vehicle Finance loan portfolio to a third party.
147.0 138.6 131.3 124.8 120.0 116.7 108.2 102.0 93.5 91.3
4Q08 1Q09 2Q09 3Q09 4Q09 Pre180 day
4Q09 1Q10 2Q10 3Q10 4Q10
HSBC Finance Corporation Continued reduction of balance sheet in the US

61
27.6 26.3
46.2 45.1 43.7 42.3 40.9 39.5 37.9 36.2 34.7 33.3
100.4 95.9 91.2 86.6 82.2 78.9 73.3 68.8 61.3 58.4
18.5 17.619.520.721.822.823.825.04.34.95.85.86.67.79.510.7
8.1 7.58.89.810.811.712.914.015.015.9 0.8( 2 ) 1.0( 2 )
1.0( 2 )1.0( 2 )
4Q08 1Q09 2Q09 3Q09 4Q09 Pre180 day
4Q09 1Q10 2Q10 3Q10 4Q10
Mortgage Services Vehicle Finance Secured Consumer LendingUnsecured Personal Credit and Other Vehicle Finance Held for Sale²
Customer loans(1), (3)
Run-off portfolio, US$bn
Customer loans (1)
Core portfolio, US$bn
28.6 26.3 25.1 23.9 23.2 20.9 20.0 19.3 19.3
18.0 16.4 15.8 15.3 15.6 14.0 13.2 12.9 13.6
46.642.7 40.9 39.2 38.8
34.9 33.2 32.2 32.9
4Q08 1Q09 2Q09 3Q09 4Q09 1Q10 2Q10 3Q10 4Q10
Credit Cards Private Label
HSBC Finance Corporation US customer loans – Run-off portfolio and Core portfolio
Notes:(1) Excludes reverse repo balances. (2) Vehicle finance loans held for sale.(3) During 3Q10, we sold the remainder of our Vehicle Finance loan portfolio to a third party.
62
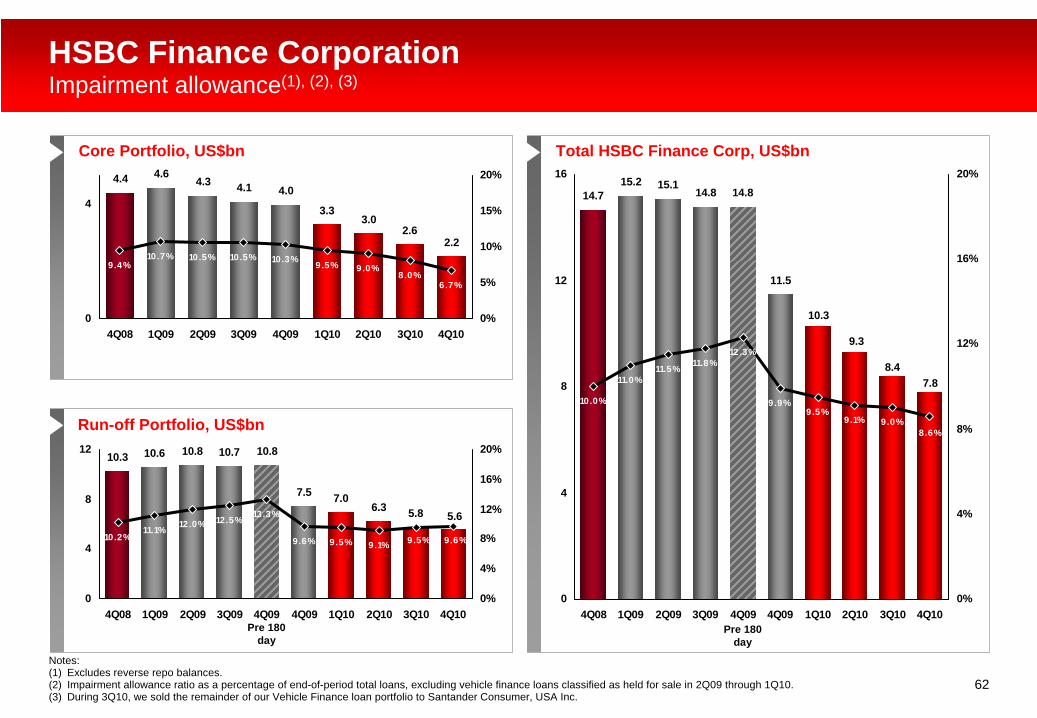
Core Portfolio, US$bn Total HSBC Finance Corp, US$bn
HSBC Finance Corporation Impairment allowance(1), (2), (3)
7.5 7.06.3 5.8
10.710.3 10.6 10.8
5.6
10.8
12.0% 12.5% 13.3%
9.6% 9.6%9.5%9.1%9.5%10.2%11.1%
0
4
8
12
4Q08 1Q09 2Q09 3Q09 4Q09 4Q09 1Q10 2Q10 3Q10 4Q100%
4%
8%
12%
16%
20%
11.5
8.4
10.3
9.3
14.814.715.2
14.8
7.8
15.1
10.0%
11.0%11.5% 11.8%
12.3%
9.9%
8.6%9.0%9.1%
9.5%
0
4
8
12
16
4Q08 1Q09 2Q09 3Q09 4Q09 4Q09 1Q10 2Q10 3Q10 4Q100%
4%
8%
12%
16%
20%
Pre 180 day
Pre 180 day
3.33.0
2.62.2
4.14.4 4.6
4.04.3
10.5% 10.5% 10.3% 9.5%
6.7%8.0%
9.0%9.4%10.7%
0
4
4Q08 1Q09 2Q09 3Q09 4Q09 1Q10 2Q10 3Q10 4Q100%
5%
10%
15%
20%
Run-off Portfolio, US$bn
Notes:(1) Excludes reverse repo balances. (2) Impairment allowance ratio as a percentage of end-of-period total loans, excluding vehicle finance loans classified as held for sale in 2Q09 through 1Q10.(3) During 3Q10, we sold the remainder of our Vehicle Finance loan portfolio to Santander Consumer, USA Inc.