HSBC Investor Meeting 6th Sept'04 - HUL
22
6th September, 2004 6th September, 2004 HSBC - Investor Meeting Mumbai, 6th September, 2004 6th September, 2004 6th September, 2004 Current Market Context Current Market Context Contents Contents Overview Overview Growth Agenda Growth Agenda The India Opportunity The India Opportunity Strategy Recap Strategy Recap
Transcript of HSBC Investor Meeting 6th Sept'04 - HUL
1
6th September, 20046th September, 2004
HSBC - Investor Meeting
Mumbai, 6th September, 2004
6th September, 20046th September, 2004
Current Market ContextCurrent Market Context
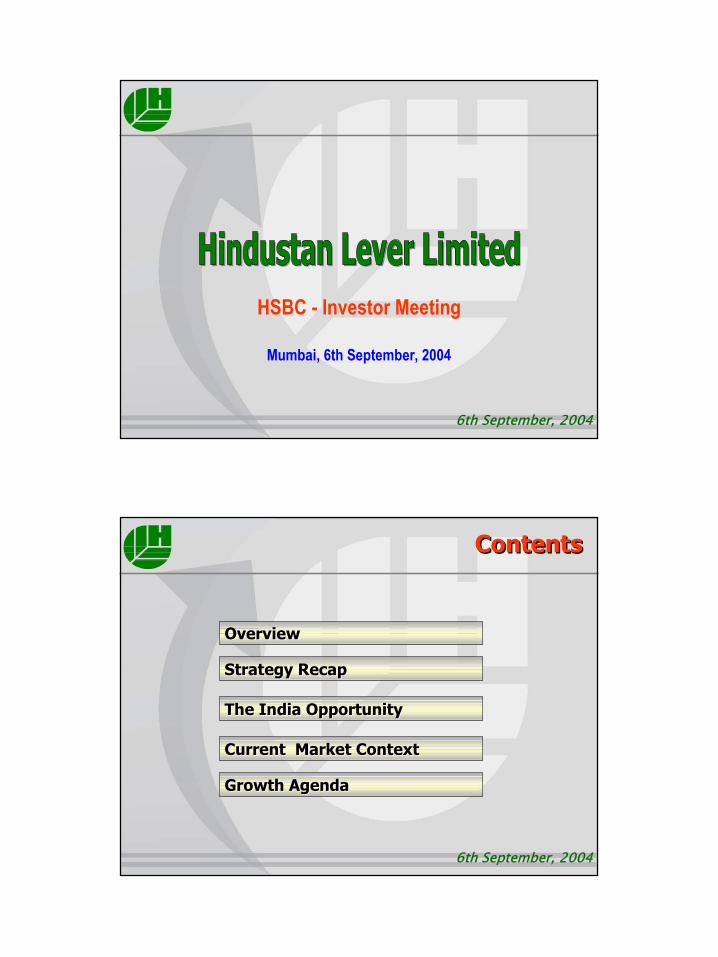
ContentsContents
OverviewOverview
Growth AgendaGrowth Agenda
The India OpportunityThe India Opportunity
Strategy RecapStrategy Recap
2
6th September, 20046th September, 2004
Current Market ContextCurrent Market Context
OverviewOverview
Growth AgendaGrowth Agenda
The India OpportunityThe India Opportunity
Strategy RecapStrategy Recap
6th September, 20046th September, 2004
• 36,300 employees
• 1,350 managers
• 2,000+ suppliers & associates
• 80 company factories
• 45 C&FAs
• 7,000 Stockists
• Direct Coverage - 1 Mn outlets
�
� � �
�
� �
�
�
� �
� �
� � � � �
�
�
� �
� �
�
� �
� �
� � � �
� �
� � �
�
�
HLL - India’s Largest FMCG CompanyHLL - India’s Largest FMCG Company
3
6th September, 20046th September, 2004
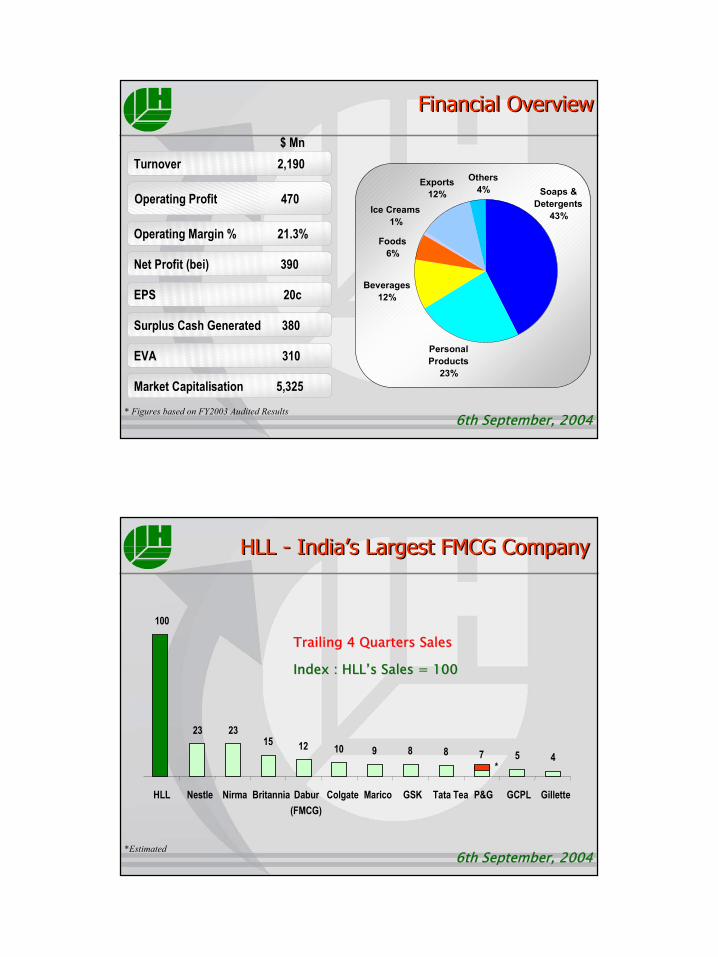
Financial OverviewFinancial Overview
* Figures based on FY2003 Audited Results
Turnover 2,190
Operating Profit 470
Net Profit (bei) 390
EPS 20c
Market Capitalisation 5,325
$ Mn
Operating Margin % 21.3%
EVA 310
Surplus Cash Generated 380 Personal
Products23%
Beverages12%
Foods6%
Ice Creams1%
Exports12%
Others4% Soaps &
Detergents43%
6th September, 20046th September, 2004
HLL - India’s Largest FMCG Company HLL - India’s Largest FMCG Company
100
23 2315 12 10 9 8 8 7 5 4
HLL Nestle Nirma Britannia Dabur(FMCG)
Colgate Marico GSK Tata Tea P&G
GCPL Gillette
Trailing 4 Quarters SalesTrailing 4 Quarters Sales
Index : HLL’s Sales = 100Index : HLL’s Sales = 100
*
*Estimated
4
6th September, 20046th September, 2004
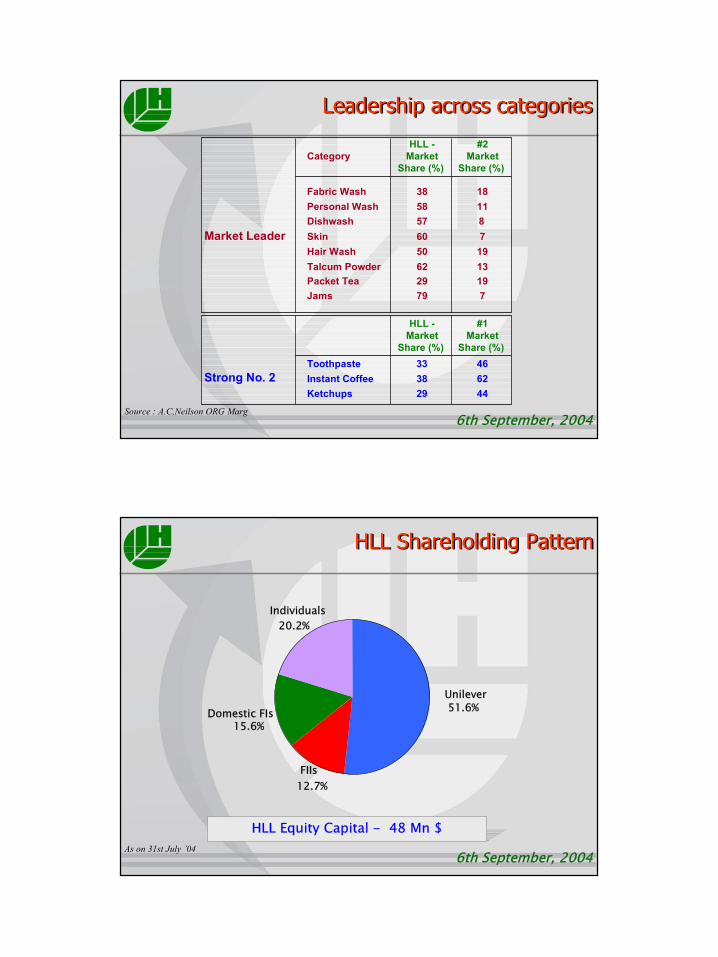
CategoryHLL -
MarketShare (%)
Fabric Wash 38Personal Wash 58
Packet Tea 29
Skin 60Hair Wash 50Talcum Powder 62
Dishwash 57
Jams 79
Market Leader
#2Market
Share (%)
1811
19
71913
8
7
Source : A.C,Neilson ORG Marg
Leadership across categoriesLeadership across categories
Toothpaste 33Instant Coffee 38Ketchups 29
Strong No. 2466244
HLL -Market
Share (%)
#1Market
Share (%)
6th September, 20046th September, 2004
HLL Equity Capital - 48 Mn $
HLL Shareholding PatternHLL Shareholding Pattern
As on 31st July ’04
FIIs12.7%
Individuals20.2%
Domestic FIs15.6%
Unilever51.6%
5
6th September, 20046th September, 2004
Current Market ContextCurrent Market Context
OverviewOverview
Growth AgendaGrowth Agenda
The India OpportunityThe India Opportunity
Strategy RecapStrategy Recap
6th September, 20046th September, 2004
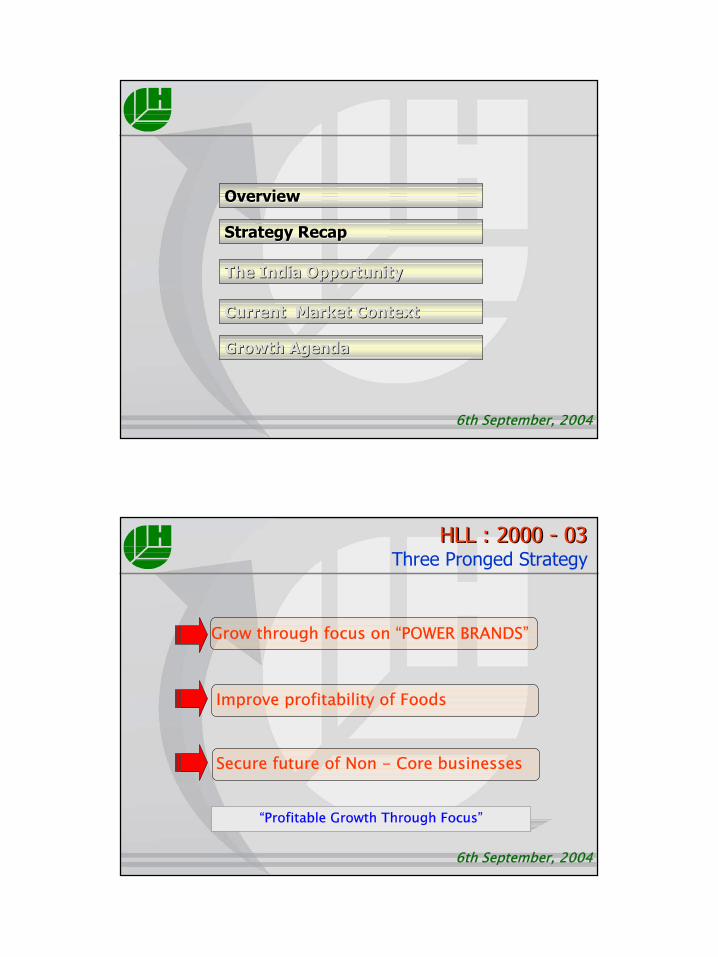
HLL : 2000 - 03HLL : 2000 - 03Three Pronged Strategy
“Profitable Growth Through Focus”
Grow through focus on “POWER BRANDS”
Improve profitability of Foods
Secure future of Non - Core businesses
6
6th September, 20046th September, 2004
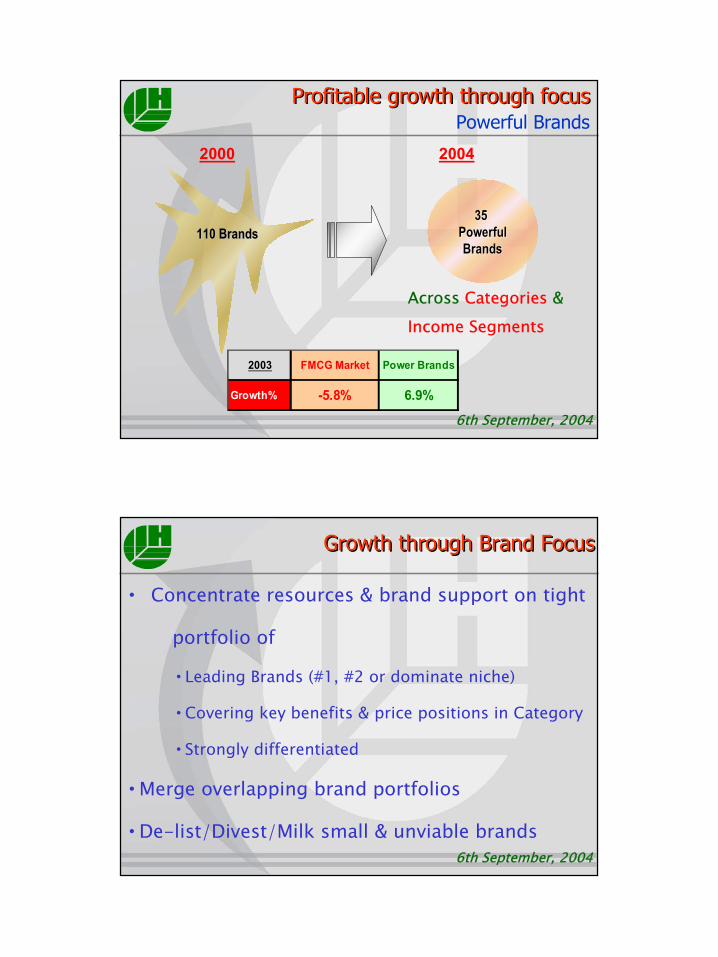
35 35 PowerfulPowerfulBrandsBrands
2000 2004
110 Brands110 Brands
Across Categories &
Income Segments
Profitable growth through focusProfitable growth through focus
2003 FMCG Market Power Brands
Growth% -5.8% 6.9%
Powerful Brands
6th September, 20046th September, 2004
Growth through Brand FocusGrowth through Brand Focus
• Concentrate resources & brand support on tight
portfolio of
•Leading Brands (#1, #2 or dominate niche)
•Covering key benefits & price positions in Category
•Strongly differentiated
•Merge overlapping brand portfolios
•De-list/Divest/Milk small & unviable brands
7
6th September, 20046th September, 2004
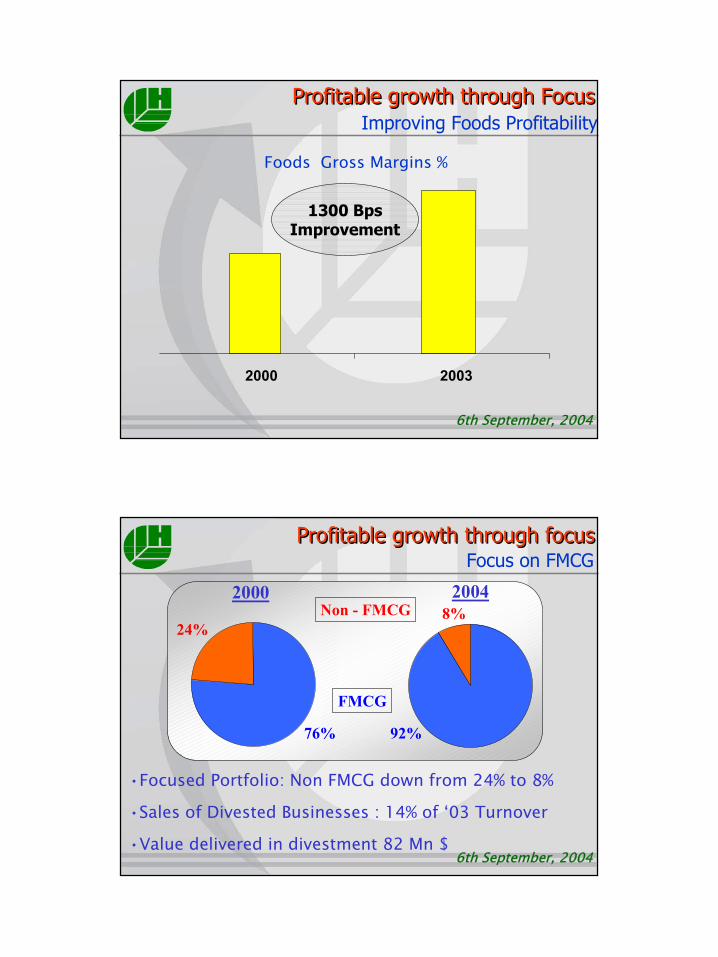
2000 2003
1300 BpsImprovement
Foods Gross Margins %
Profitable growth through FocusProfitable growth through FocusImproving Foods Profitability
6th September, 20046th September, 2004
2000 2004
•Focused Portfolio: Non FMCG down from 24% to 8%
•Sales of Divested Businesses : 14% of ‘03 Turnover
•Value delivered in divestment 82 Mn $
92%76%
24%8%
FMCG
Non - FMCG
Profitable growth through focusProfitable growth through focusFocus on FMCG
8
6th September, 20046th September, 2004
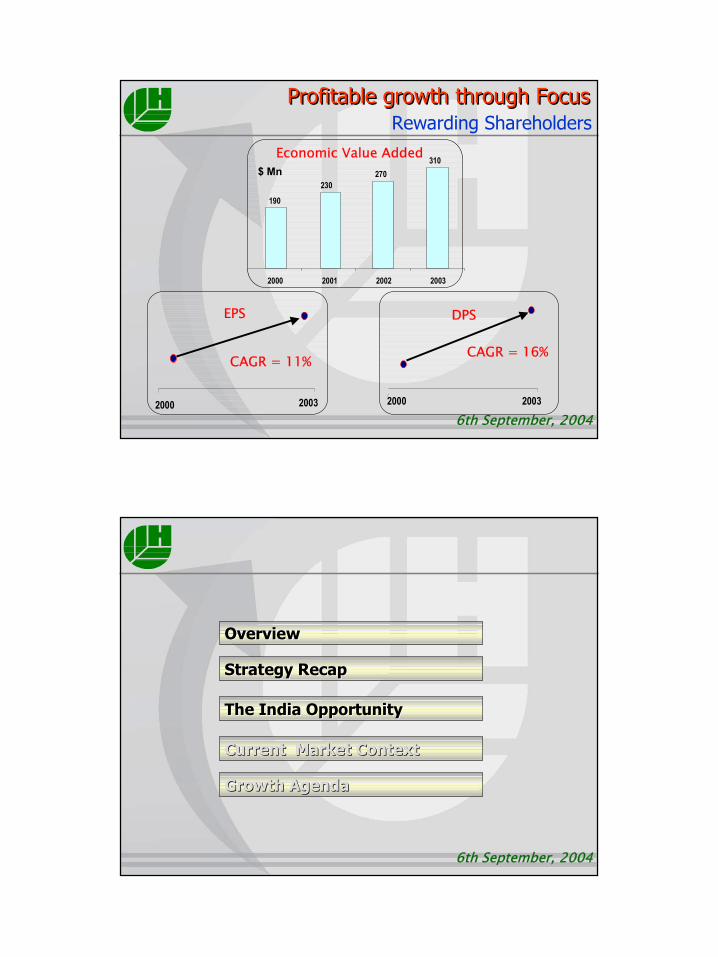
Economic Value Added
190
230270
310
2000 2001 2002 2003
$ Mn
Profitable growth through FocusProfitable growth through Focus
EPS
2003
DPS
CAGR = 16%
2000 20032000
CAGR = 11%
Rewarding Shareholders
6th September, 20046th September, 2004
Current Market ContextCurrent Market Context
OverviewOverview
Growth AgendaGrowth Agenda
The India OpportunityThe India Opportunity
Strategy RecapStrategy Recap
9
6th September, 20046th September, 2004
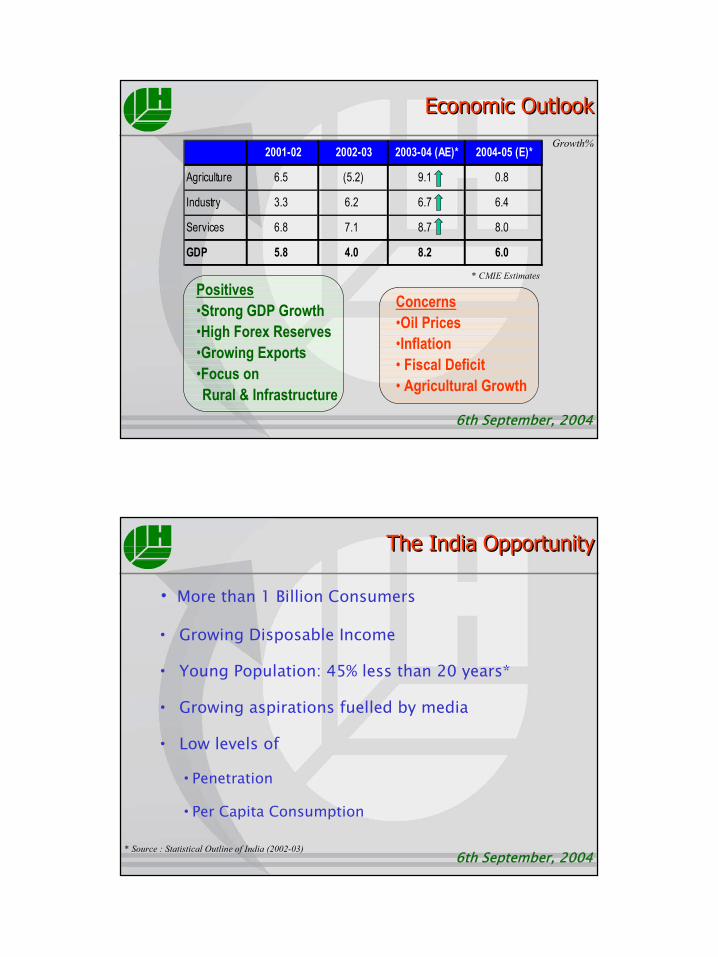
Economic OutlookEconomic Outlook
Positives•Strong GDP Growth•High Forex Reserves•Growing Exports•Focus on Rural & Infrastructure
Growth%
* CMIE Estimates
2001-02 2002-03 2003-04 (AE)* 2004-05 (E)*
Agriculture 6.5 (5.2) 9.1 0.8
Industry 3.3 6.2 6.7 6.4
Services 6.8 7.1 8.7 8.0
GDP 5.8 4.0 8.2 6.0
Concerns•Oil Prices•Inflation• Fiscal Deficit• Agricultural Growth
6th September, 20046th September, 2004
The India OpportunityThe India Opportunity
• More than 1 Billion Consumers
• Growing Disposable Income
• Young Population: 45% less than 20 years*
• Growing aspirations fuelled by media
• Low levels of
•Penetration
•Per Capita Consumption
* Source : Statistical Outline of India (2002-03)
10
6th September, 20046th September, 2004
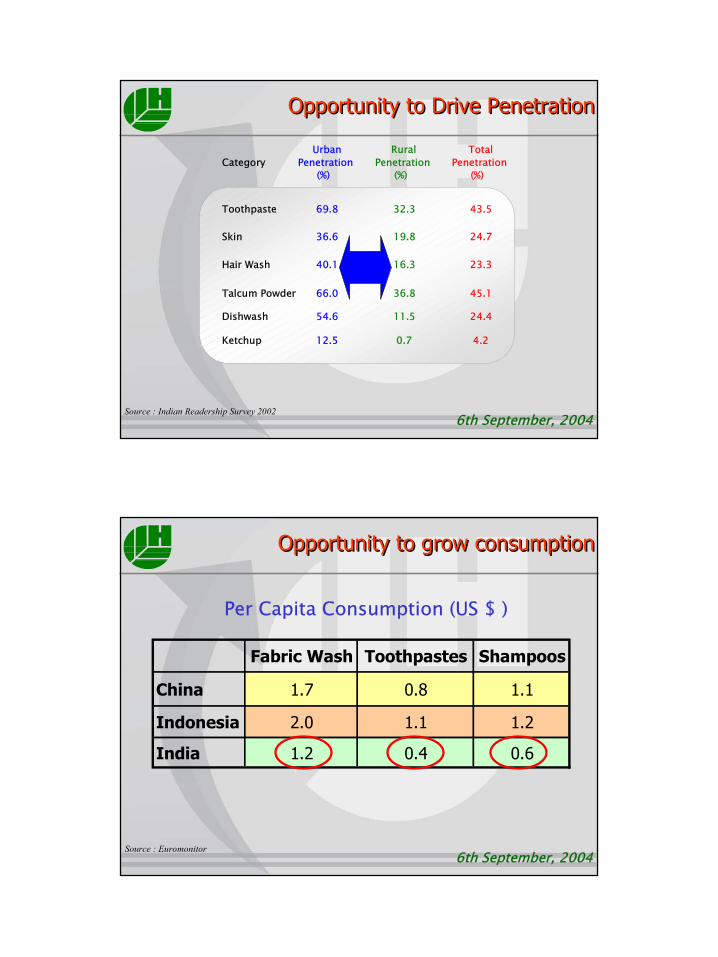
Opportunity to Drive PenetrationOpportunity to Drive Penetration
CategoryUrban
Penetration (%)
Rural Penetration
(%)
Total Penetration
(%)
Toothpaste 69.8 32.3 43.5
Skin 36.6 19.8 24.7
Hair Wash 40.1 16.3 23.3
Talcum Powder 66.0 36.8 45.1
Dishwash 54.6 11.5 24.4
Ketchup 12.5 0.7 4.2
Source : Indian Readership Survey 2002
6th September, 20046th September, 2004
Per Capita Consumption (US $ )
Fabric Wash Toothpastes Shampoos
China 1.7 0.8 1.1
Indonesia 2.0 1.1 1.2
India 1.2 0.4 0.6
Source : Euromonitor
Opportunity to grow consumptionOpportunity to grow consumption
11
6th September, 20046th September, 2004
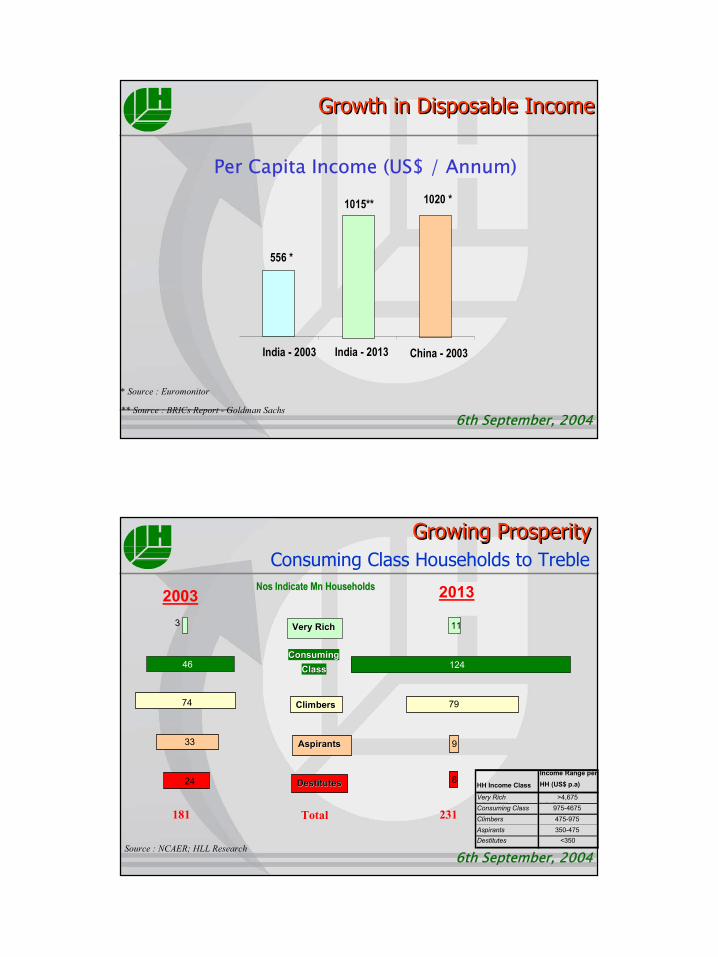
Per Capita Income (US$ / Annum)
* Source : Euromonitor
** Source : BRICs Report - Goldman Sachs
556 *
1020 *1015**
India - 2003 China - 2003India - 2013
Growth in Disposable IncomeGrowth in Disposable Income
6th September, 20046th September, 2004
Growing ProsperityGrowing Prosperity
HH Income Class
Income Range perHH (US$ p.a)
Very Rich >4,675Consuming Class 975-4675Climbers 475-975Aspirants 350-475Destitutes <350
2003 2013
24
33
74
46
3
DestitutesDestitutes
AspirantsAspirants
ClimbersClimbers
ConsumingConsumingClassClass
Very RichVery Rich
8
9
79
124
11
Nos Nos Indicate Indicate Mn Mn HouseholdsHouseholds
Total181 231
Source : NCAER; HLL Research
Consuming Class Households to Treble
12
6th September, 20046th September, 2004
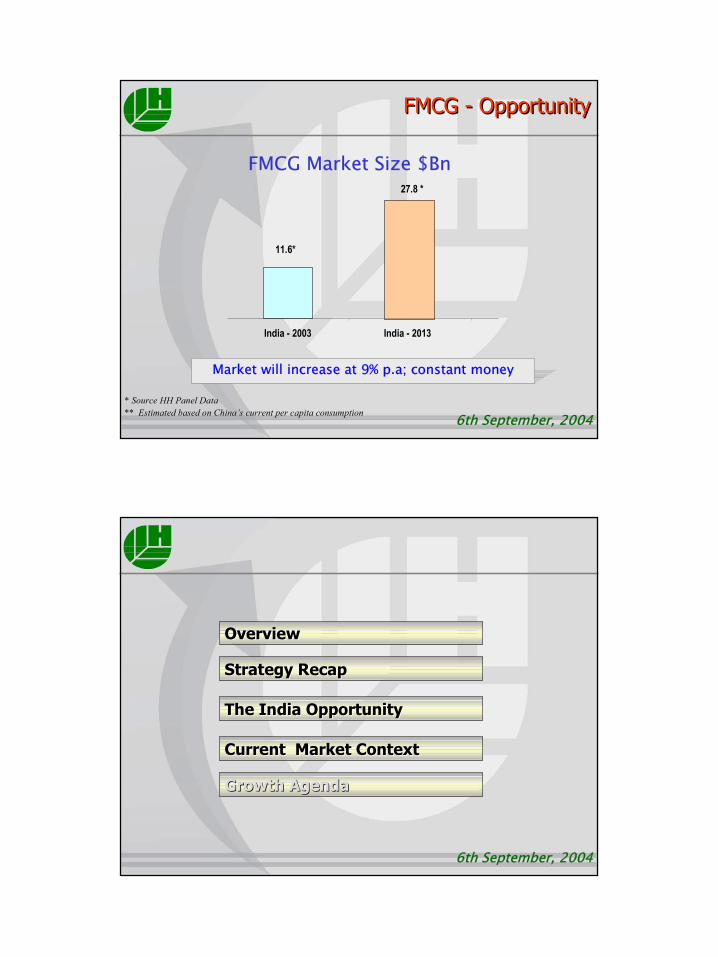
FMCG Market Size $Bn
11.6*
27.8 *
India - 2003 India - 2013
* Source HH Panel Data** Estimated based on China’s current per capita consumption
FMCG - OpportunityFMCG - Opportunity
Market will increase at 9% p.a; constant money
6th September, 20046th September, 2004
Current Market ContextCurrent Market Context
OverviewOverview
Growth AgendaGrowth Agenda
The India OpportunityThe India Opportunity
Strategy RecapStrategy Recap
13
6th September, 20046th September, 2004
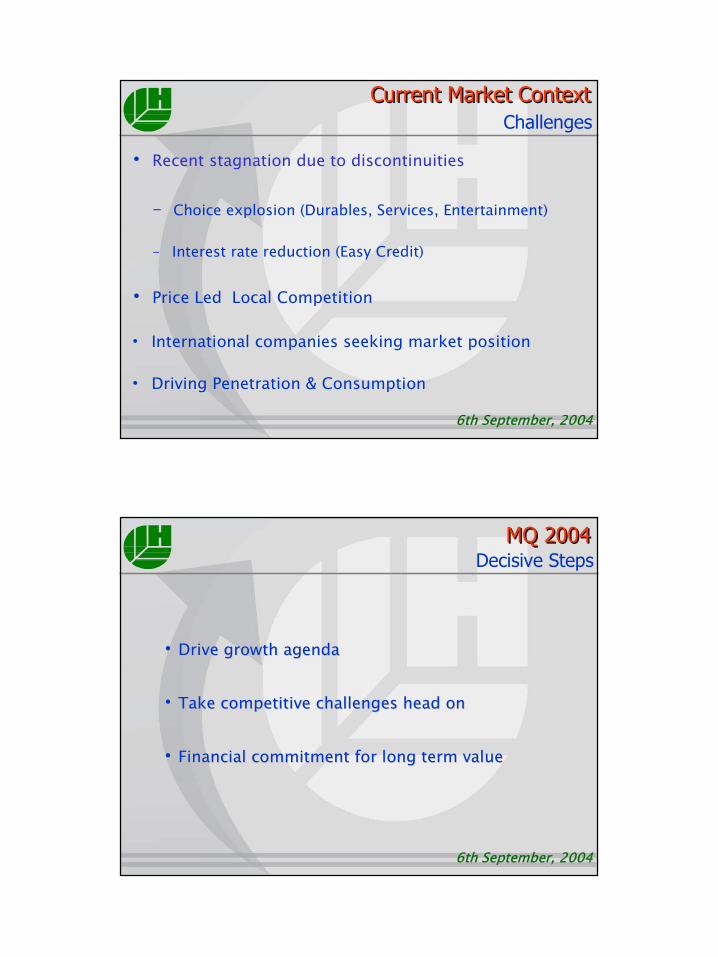
• Recent stagnation due to discontinuities
– Choice explosion (Durables, Services, Entertainment)
– Interest rate reduction (Easy Credit)
• Price Led Local Competition
• International companies seeking market position
• Driving Penetration & Consumption
Current Market ContextCurrent Market ContextChallenges
6th September, 20046th September, 2004
•• Drive growth agendaDrive growth agenda
•• Take competitive challenges head onTake competitive challenges head on
•• Financial commitment for long term valueFinancial commitment for long term value
MQ 2004MQ 2004Decisive Steps
14
6th September, 20046th September, 2004
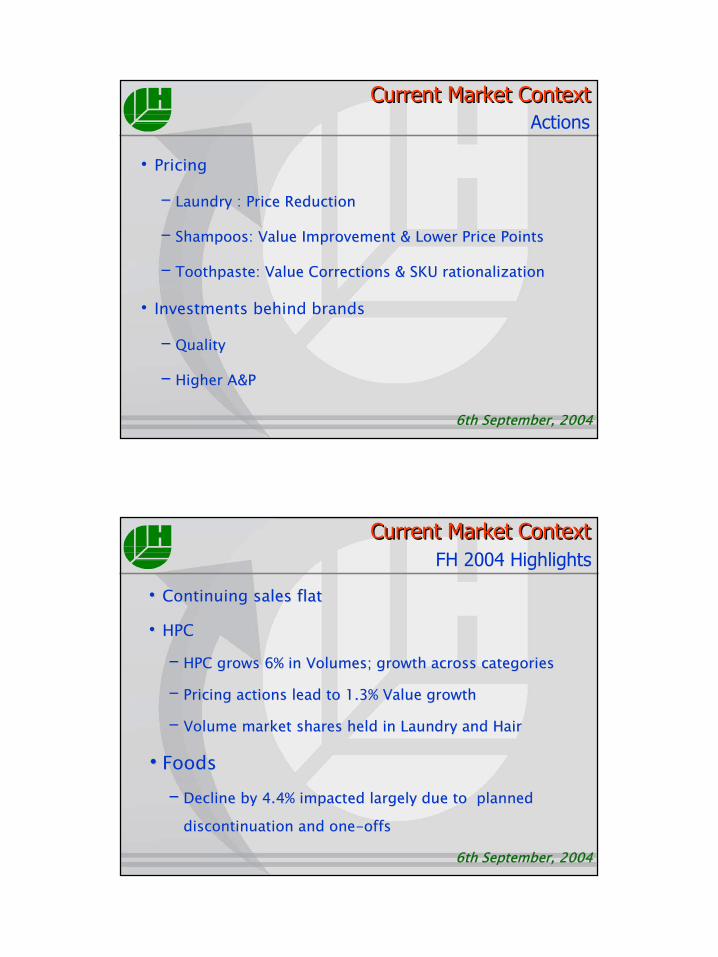
•Pricing
–– Laundry : Price ReductionLaundry : Price Reduction
–– Shampoos: Value Improvement & Lower Price PointsShampoos: Value Improvement & Lower Price Points
–– Toothpaste: Value Corrections & SKU rationalizationToothpaste: Value Corrections & SKU rationalization
• Investments behind brands
–– QualityQuality
–– Higher A&PHigher A&P
Current Market ContextCurrent Market ContextActions
6th September, 20046th September, 2004
•• Continuing sales flatContinuing sales flat
•• HPCHPC
–– HPC grows 6% in Volumes; growth across categoriesHPC grows 6% in Volumes; growth across categories
–– Pricing actions lead to 1.3% Value growthPricing actions lead to 1.3% Value growth
–– Volume market shares held in Laundry and HairVolume market shares held in Laundry and Hair
••FoodsFoods
–– Decline by 4.4% impacted largely due to plannedDecline by 4.4% impacted largely due to planned
discontinuation and one-discontinuation and one-offsoffs
Current Market ContextCurrent Market ContextFH 2004 Highlights
15
6th September, 20046th September, 2004
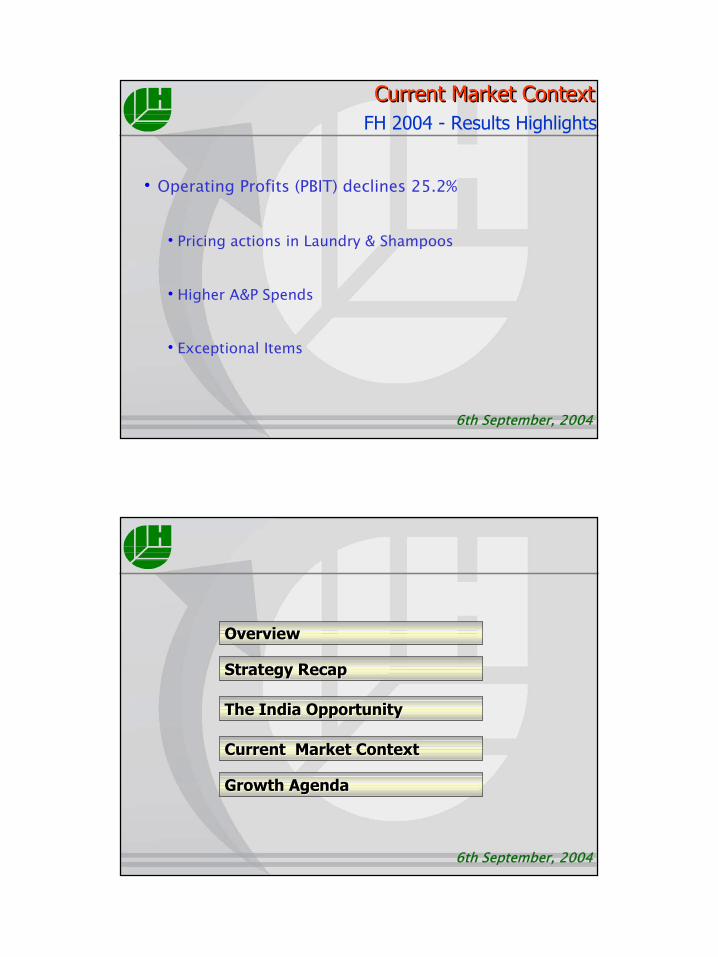
•Operating Profits (PBIT) declines 25.2%
•Pricing actions in Laundry & Shampoos
•Higher A&P Spends
•Exceptional Items
Current Market ContextCurrent Market ContextFH 2004 - Results Highlights
6th September, 20046th September, 2004
Current Market ContextCurrent Market Context
OverviewOverview
Growth AgendaGrowth Agenda
The India OpportunityThe India Opportunity
Strategy RecapStrategy Recap
16
6th September, 20046th September, 2004
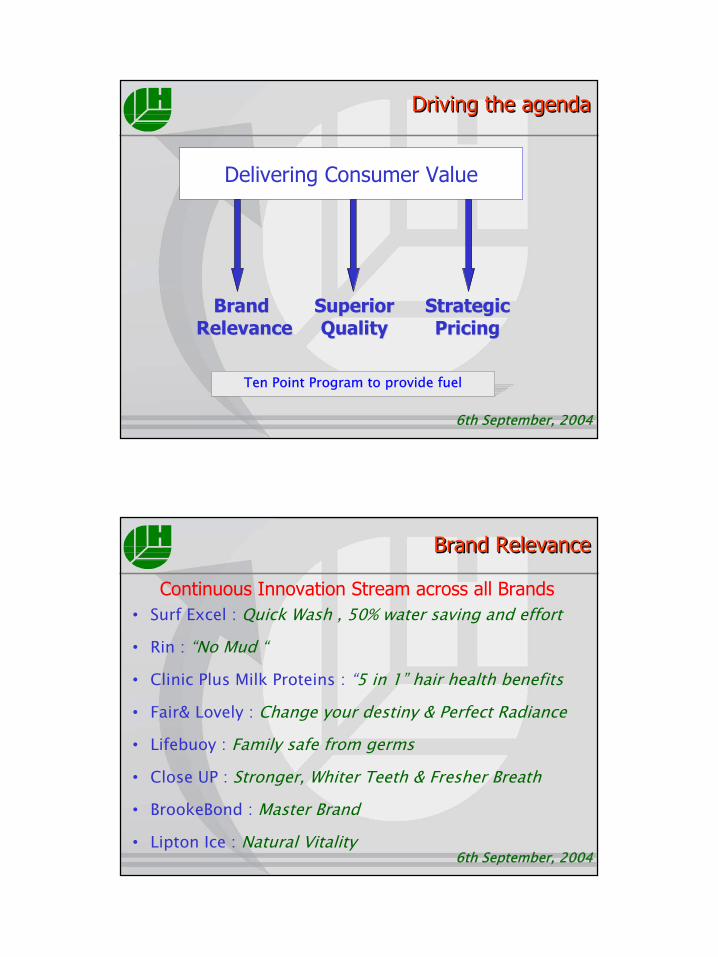
Delivering Consumer Value
Brand Brand RelevanceRelevance
SuperiorSuperiorQualityQuality
StrategicStrategicPricingPricing
Ten Point Program to provide fuel
Driving the agendaDriving the agenda
6th September, 20046th September, 2004
• Surf Excel : Quick Wash , 50% water saving and effort
• Rin : “No Mud “
• Clinic Plus Milk Proteins : “5 in 1” hair health benefits
• Fair& Lovely : Change your destiny & Perfect Radiance
• Lifebuoy : Family safe from germs
• Close UP : Stronger, Whiter Teeth & Fresher Breath
• BrookeBond : Master Brand
• Lipton Ice : Natural Vitality
Continuous Innovation Stream across all Brands
Brand RelevanceBrand Relevance
17
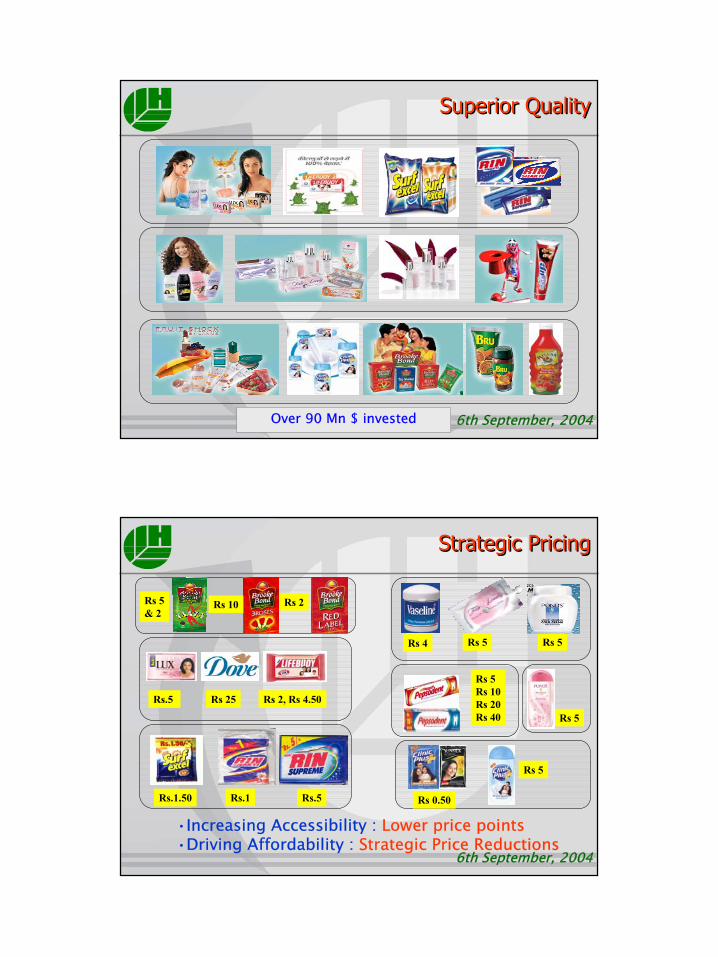
6th September, 20046th September, 2004Over 90 Mn $ invested
Superior QualitySuperior Quality
6th September, 20046th September, 2004
Rs 5
Rs 5Rs 10Rs 20Rs 40
Rs 4 Rs 5 Rs 5
Rs 0.50
Rs 5
Rs.5 Rs 25 Rs 2, Rs 4.50
Rs.1.50 Rs.1 Rs.5
Rs 5& 2
Strategic PricingStrategic Pricing
Rs 10 Rs 2
•Increasing Accessibility : Lower price points•Driving Affordability : Strategic Price Reductions
18
6th September, 20046th September, 2004
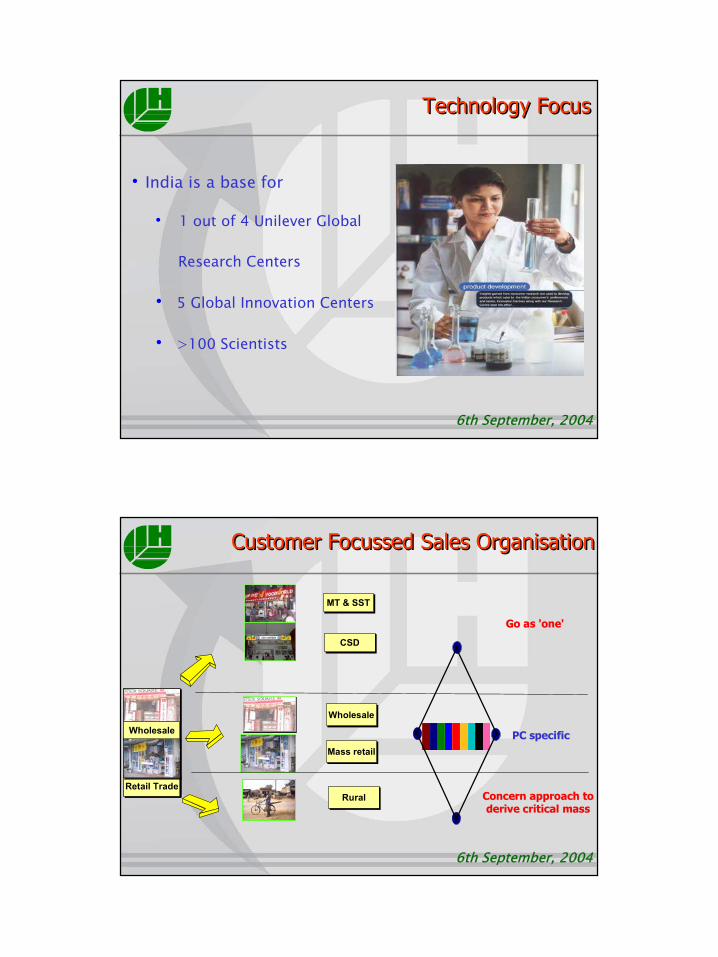
• India is a base for
• 1 out of 4 Unilever Global
Research Centers
• 5 Global Innovation Centers
• >100 Scientists
Technology FocusTechnology Focus
6th September, 20046th September, 2004
WholesaleWholesale
Retail TradeRetail Trade
MT & SSTMT & SST
Mass retailMass retail
WholesaleWholesale
CSDCSD
RuralRural
Go as 'one'Go as 'one'
PC specificPC specific
Concern approach toConcern approach toderive critical massderive critical mass
Customer Focussed Sales OrganisationCustomer Focussed Sales Organisation
19
6th September, 20046th September, 2004
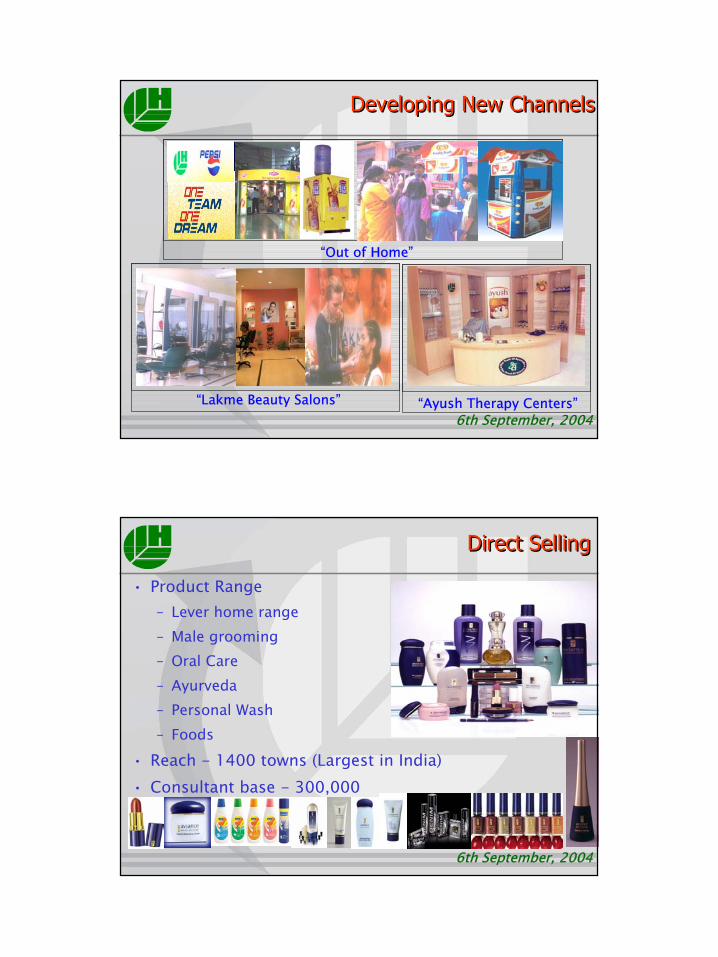
Developing New ChannelsDeveloping New Channels
“Out of Home”
“Ayush Therapy Centers”“Lakme Beauty Salons”
6th September, 20046th September, 2004
• Product Range– Lever home range– Male grooming– Oral Care– Ayurveda– Personal Wash– Foods
• Reach - 1400 towns (Largest in India)• Consultant base - 300,000
Direct SellingDirect Selling

20
6th September, 20046th September, 2004
•Challenges in Rural Markets– Accessibility– Viability– Media Dark
•Rural selling through SHG’s– Benefits
– Improving product reach– Facilitating Brand-Communication
– Extended into 12 major states– Over 30,000 villages covered– Touching 30 mn rural lives– Plans to cover 1,00,000 villages
– Touching 100 mn rural lives.
Rural Marketing - Project ShaktiRural Marketing - Project Shakti
6th September, 20046th September, 2004
• Simpler Organisation
•Empowered , simpler , quicker
•New structure to benefit from Unilever
• Fostering Enterprise Culture
•Building Leadership
•Increased Diversity
•Performance Culture
Simpler Organisation & Enterprise CultureSimpler Organisation & Enterprise Culture
21
6th September, 20046th September, 2004
Management Talent Management Talent
• Preferred employer across functions and levels.
• Day 1 - Slot 1, Employer on all campuses
• Focus : Key Skills & Competencies
• Building effective teams
• Developing inspirational leaders
Excellent Talent Pool with a passion for winning
6th September, 20046th September, 2004
In SummaryIn Summary
•Big Opportunity to grow Penetration & Consumption
• Strong Capabilities of HLL
• Powerful Brands
• Robust Business Capabilities
• Management Talent
22
6th September, 20046th September, 2004
HSBC Investor Meeting
Mumbai, 6th September, 2004
6th September, 20046th September, 2004
HSBC Investor Meeting
Mumbai, 6th September, 2004