HSBC Bank USA, N.A. - Amazon S3s3.amazonaws.com/zanran_storage/ · The Annual Income Opportunity...
40
HSBC Bank USA, N.A. Annual Income Opportunity CD TM with “Auto Cap” Feature “Global Industry Titans” Series 9 INDICATIVE TERMS Issuer HSBC Bank USA, N.A. Issue 6 Year Annual Income Opportunity CD Series 9 Issuer Rating AA (S&P), Aa3 (Moody’s) Denomination US Dollars (USD) Trade Date November 23, 2010 Settlement Date November 29, 2010 Maturity Date November 29, 2016 Issue Price 100.00% Redemption Proceeds At Maturity Principal Amount plus any Coupon due on the Maturity Date Coupon The Principal Amount multiplied by the Coupon Rate Coupon Rate The Coupon Rate on each Coupon Payment Date will be variable and will equal the greater of (A) the arithmetic average of the Reference Security Returns related to that Coupon Payment Date, and (B) zero Reference Security Return For each Reference Security and with respect to each Coupon Valuation Date: If the Valuation Share Price is greater than or equal to the Initial Share Price, an amount equal to the Auto Cap Rate; or If the Valuation Share Price is less than the Initial Share Price, an amount equal to the greater of A) the quotient of 1) the Valuation Share Price minus the Initial Share Price, divided by 2) the Initial Share Price., and B) the Floor Rate. Floor -30.00% (per Reference Security) Auto Cap Rate [6%-9%], per Reference Security as determined on the Initial Fixing Date, which will, in effect, make the maximum Coupon Rate for the Basket [6%-9%]. Coupon Payment Date Annually, as described herein Early Redemption As described more fully herein, when early redemption is available, depositors redeeming prior to maturity will receive the current market value of their CDs minus any early redemption fees. Minimum Denomination $1,000 and increments of $1,000 thereafter subject to a minimum issuance amount of $1 million CUSIP 40431GHD4 CD DESCRIPTION The Annual Income Opportunity CDs (“Global Industry Titans”) provide exposure to the potential price appreciation in a geographically diverse basket of twelve publicly traded securities and if held to maturity 100% principal protection. The CDs offer an opportunity to receive an annual coupon based upon the arithmetic average of the Reference Securities Returns. HIGHLIGHTS ► Annual Income Potential: Depositors may receive a coupon annually based upon the Reference Securities’ average performance, always vs. their initial levels, subject to the cap and floor level on each individual stock within the basket ► FDIC Insurance: This deposit qualifies for FDIC coverage generally up to $250,000 in aggregate for all deposits per institution for individual depositors and up to $250,000 in aggregate for all deposits per institution held in certain retirement plans and accounts, including IRAs. ► Diversification by Geography/Industry: The Reference Securities represent several different industry groups and geographies. Please see the table on the following page for more information ► “Auto Cap” Feature: If on any Valuation Date, the share price of any Reference Security is greater than or equal to the Initial Share Price, the Reference Security Return will be equal to the Auto Cap Rate. If not, the Reference Security Return will be equal to the share price on that Valuation Date divided by the Initial Share Price, subject to the Floor Rate. ► IRA Eligible China Mobile Ltd-SPON ADR Hong Kong Brazil Duke Energy Corp. USA Home Depot Inc. USA Lorillard Inc. USA Encana Corp. Canada Toronto-Dominion Bank Canada Honda Motor Co Ltd-SPONS ADR Japan Goldcorp Inc Canada Unilever NV-NY Shares Netherlands Novartis AG-ADR France Total SA-SPON ADR France China Mobile Ltd-SPON ADR Hong Kong Brazil Duke Energy Corp. USA Home Depot Inc. USA Lorillard Inc. USA Encana Corp. Canada Toronto-Dominion Bank Canada Honda Motor Co Ltd-SPONS ADR Japan Goldcorp Inc Canada Unilever NV-NY Shares Netherlands Novartis AG-ADR France Total SA-SPON ADR France Banco Bradesco SA
Transcript of HSBC Bank USA, N.A. - Amazon S3s3.amazonaws.com/zanran_storage/ · The Annual Income Opportunity...

HSBC Bank USA, N.A. Annual Income Opportunity CDTM with “Auto Cap” Feature “Global Industry Titans” Series 9
INDICATIVE TERMS
Issuer HSBC Bank USA, N.A.
Issue 6 Year Annual Income Opportunity CD Series 9
Issuer Rating AA (S&P), Aa3 (Moody’s)
Denomination US Dollars (USD)
Trade Date November 23, 2010
Settlement Date
November 29, 2010
Maturity Date November 29, 2016
Issue Price 100.00%
Redemption Proceeds At Maturity
Principal Amount plus any Coupon due on the Maturity Date
Coupon The Principal Amount multiplied by the Coupon Rate
Coupon Rate The Coupon Rate on each Coupon Payment Date will be variable and will equal the greater of (A) the arithmetic average of the Reference Security Returns related to that Coupon Payment Date, and (B) zero
Reference Security Return
For each Reference Security and with respect to each Coupon Valuation Date: If the Valuation Share Price is greater than or equal to the Initial Share Price, an amount equal to the Auto Cap Rate; or If the Valuation Share Price is less than the Initial Share Price, an amount equal to the greater of A) the quotient of 1) the Valuation Share Price minus the Initial Share Price, divided by 2) the Initial Share Price., and B) the Floor Rate.
Floor -30.00% (per Reference Security)
Auto Cap Rate [6%-9%], per Reference Security as determined on the Initial Fixing Date, which will, in effect, make the maximum Coupon Rate for the Basket [6%-9%].
Coupon Payment Date
Annually, as described herein
Early Redemption
As described more fully herein, when early redemption is available, depositors redeeming prior to maturity will receive the current market value of their CDs minus any early redemption fees.
Minimum Denomination
$1,000 and increments of $1,000 thereafter subject to a minimum issuance amount of $1 million
CUSIP 40431GHD4
CD DESCRIPTION
The Annual Income Opportunity CDs (“Global Industry Titans”) provide exposure to the potential price appreciation in a geographically diverse basket of twelve publicly traded securities and if held to maturity 100% principal protection. The CDs offer an opportunity to receive an annual coupon based upon the arithmetic average of the Reference Securities Returns.
HIGHLIGHTS
► Annual Income Potential: Depositors may receive a coupon annually based upon the Reference Securities’ average performance, always vs. their initial levels, subject to the cap and floor level on each individual stock within the basket
► FDIC Insurance: This deposit qualifies for FDIC coverage generally up to $250,000 in aggregate for all deposits per institution for individual depositors and up to $250,000 in aggregate for all deposits per institution held in certain retirement plans and accounts, including IRAs.
► Diversification by Geography/Industry: The Reference Securities represent several different industry groups and geographies. Please see the table on the following page for more information
► “Auto Cap” Feature: If on any Valuation Date, the share price of any Reference Security is greater than or equal to the Initial Share Price, the Reference Security Return will be equal to the Auto Cap Rate. If not, the Reference Security Return will be equal to the share price on that Valuation Date divided by the Initial Share Price, subject to the Floor Rate.
► IRA Eligible
China Mobile Ltd-SPON ADR
Hong Kong
CIA SiderurgicaNACL-SP ADR
Brazil
Duke Energy Corp.USA
Home Depot Inc.USA
Lorillard Inc.USA
Encana Corp.Canada
Toronto-Dominion Bank
Canada
Honda Motor Co Ltd-SPONS ADR
Japan
Goldcorp IncCanada
UnileverNV-NY SharesNetherlands
Novartis AG-ADRFrance
Total SA-SPON ADR
France
Banco BradescoSA

THE REFERENCE SECURITIES
Reference Issuer
Ticker
Symbol
Domicile
Country Industry Company Description
Banco Bradesco S.A. BBD Brazil Commercial Banking Banco Bradesco S.A. offers commercial banking services and operates in Brazil, Argentina, the United States andthe Cayman Islands.
China Mobile Ltd. CHL Hong Kong Telecommunications China Mobile Limited, through its subsidiaries, provides cellular telecommunications and related services in the People's Republic of China and Hong Kong SAR.
Duke Energy Corporation DUK USA Electric- Integrated
Duke Energy Corporation is an energy company located primarily in the Americas that owns an integrated network of energy assets. The Company manages a portfolio of natural gas and electric supply, delivery, and tradingbusinesses in the United States and Latin America.
Encana Corporation ECA Canada Oil Encana Corporation explores for, develops, produces, and markets natural gas, crude oil, and natural gas liquids. The Company operates in North and South America.
Goldcorp Inc. GG Canada Mining Goldcorp Inc. is a North American gold producer. The company has gold mining operations in the Unites States, Canada, Mexico, Brazil, Argentina, and Australia. Goldcorp was the largest producer of Canadian Gold during 2009.
The Home Depot, Inc. HD USA Retail-Building Supplies The Home Depot, Inc. is a home improvement retailer that sells building materials and home improvement products.
Honda Motor Co. Ltd. HMC Japan Auto Manufacturer
Honda is a multi-national corporation which manufactures automobiles, motorcycles, and power products. It is the world’s largest manufacturer of motorcycles as well as the world’s largest manufacturer. It was the first Japanese auto manufacturer to release a dedicated luxury brand (Acura).
Lorillard, Inc. LO USA Tobacco Lorillard, Inc. manufactures and sells cigarettes. The Company produces cigarettes for both the premium and discount segments of the domestic cigarette market for sale to distributors and retailers in the United States.
Novartis AG NVS Switzerland Pharmaceuticals
A multi-national pharmaceutical company producing consumer healthcare products. Focused solely on healthcare, Novartis offers a diversified portfolio to best meet these needs: innovative medicines, cost-saving generic pharmaceuticals, preventive vaccines, diagnostic tools and consumer health products.
Toronto-Dominion Bank TD Canada Commercial Banks The Toronto-Dominion Bank conducts a general banking business through banking branches and offices located throughout Canada and overseas.
Total SA TOT France Oil
Total SA is the fifth largest publicly-traded international oil and gas company. With operations in more than 130 countries, Total engages in all aspects of the petroleum industry, including Upstream operations (oil and gasexploration, development and production) and Downstream operations (refining, marketing and the trading and shipping of crude oil and petroleum products).
Unilever NV UN Netherlands Food-Misc. Unilever NV manufactures branded and packaged consumer goods, including food, detergents, fragrances, home and personal care products.
POTENTIAL PURCHASERS
Potential purchasers may include:
► Those who desire principal protection (at maturity), but also seek equity market return potential
► Depositors seeking international equity exposure
► Those demanding FDIC-insured instruments
► Those seeking broad based global geographical equity diversification
► Long-term investors who desire to participate in the potential growth of various industry groups
► Those seeking the potential to earn an annual contingent and variable coupon
► Those willing to accept that the CDs may pay no coupon in some or all periods, in exchange for the potential for above market coupons
CERTAIN RISKS AND CONSIDERATIONS
Purchasing the CDs involves a number of risks. It is suggested that prospective depositors reach a purchase decision only after careful consideration with their financial, legal, accounting, tax and other advisors regarding the suitability of the CDs in light of their particular circumstances. See “Risk Factors” on page 9 herein for a discussion of risks, which include:
► The principal amount is not guaranteed if the CDs are not held to maturity.
► Payment of the principal amount, and any annual coupons is the obligation of the issuer and subject to the issuers ability to pay from its assets and earnings
► There may not be an active secondary trading market in the CDs and CDs should be viewed as long term investments.
► Return on the CDs does not necessarily reflect the full performance of the Reference Securities and movements in the level of the Reference Securities may affect whether or not depositors receive a return.
► Depositors’ yield may be less than that of a standard debt security of comparable maturity.
► The underlying basket may include American Depository Receipts (“ADRs”), which may subject depositors to additional risk factors including, but not limited to, i) fluctuating exchange rate risk, and ii) foreign investment risk.
► Market conditions and events affecting the Reference Securities may negatively impact the coupons received by depositors. Upon the occurrence of a delisting or similar event, a depositor will likely receive no Coupon in the year of the event and for the remainder of the CD term.
In the event one or more of the Reference Securities is subject to an adjustment event (as described herein), the Calculation Agent may adjust the terms of the CDs to reflect the economic impact of such event, as more fully described on page 11 herein.
Important information regarding the CDs is also contained in the Base Disclosure Statement for Certificates of Deposit dated January 1, 2010 which forms a part of, and is incorporated by reference into, these Terms and Conditions. Therefore, these Terms and Conditions should be read in conjunction with the Base Disclosure Statement. A copy of the Base Disclosure Statement is available at www.us.hsbc.com/structuredcd or can be obtained from the Agent offering the CDs.

HSBC Bank USA, N.A. 6 Year Annual Income Opportunity CDTM With “Auto Cap” Feature “Global Industry Titans” Series 9
Indicative Terms and Conditions Deposit Highlights November 29, 2016
General
• Certificates of Deposit (the “CDs”) issued by HSBC Bank USA, National Association (the “Issuer”)
• Full principal protection payable by the Issuer if the CDs are held to maturity
• CDs are obligations of the Issuer and not its affiliates or agents
• CDs are FDIC insured within the limits and to the extent described herein and in the Base Disclosure Statement dated January 1, 2010 under the section entitled “ FDIC Insurance”
• As described more fully herein, early withdrawals are permitted at par in the event of death of the beneficial owner of the CDs
Key Terms
• Basket: An equally weighted basket comprised of the common stock and/or ADRs (each a “Reference Security” and together, the “Reference Securities”) of the following 12 public companies (each, a “Reference Issuer” and together, the “Reference Issuers”):
Reference Issuer Ticker
Symbol Relevant
Exchange
Initial Share Price Reference Issuer
Ticker Symbol
Relevant Exchange
Initial Share Price
Banco Bradesco S.A. BBD NYSE TBD Honda Motor Co. Ltd. HMC NYSE TBD
China Mobile Ltd. CHL NYSE TBD Lorillard Inc. LO NYSE TBD
Duke Energy Corp. DUK NYSE TBD Novartis AG NVS NYSE TBD
Encana Corp ECA NYSE TBD Toronto-Dominion Bank TD NYSE TBD
Goldcorp Inc. GG NYSE TBD Total SA TOT NYSE TBD
Home Depot Inc HD NYSE TBD Unilever NV - NY Shares UN NYSE TBD
• Principal Amount: $1,000 for each CD. Minimum deposit amount of $1,000 per depositor (except that each Agent may, in its discretion, impose a higher minimum deposit amount with respect to the CD sales to its customers) and then in additional increments of $1,000. CDs will be issued in denominations of $1,000.
• Pricing Date: November 23, 2010 • Trade Date: November 23, 2010 • Settlement Date: November 29, 2010
• Maturity Date: November 29, 2016, subject to adjustment as described herein
• Coupon Payment Amount: The Principal Amount multiplied by the Coupon Rate.
• Coupon Rate: The Coupon Rate on each Coupon Payment Date will be variable and will be equal to the greater of A) the arithmetic average of the Reference Security Returns for the Reference Securities, and B) zero.
• Reference Security Return: For each Reference Security and with respect to each Coupon Valuation Date:
If the Valuation Share Price is greater than or equal to the Initial Share Price, an amount equal to the Auto Cap Rate; or
If the Valuation Share Price is less than the Initial Share Price, an amount equal to the greater of A) the Reference Security Performance, and B) the Floor Rate.
• Reference Security Performance: For each Reference Security as of each Coupon Valuation Date, the quotient of A) the Valuation Share Price minus the Initial Share Price, divided by B) the Initial Share Price.
• Auto Cap Rate: [6%-9%], per Reference Security as determined on the Initial Fixing Date, which will, in effect, make the maximum Coupon Rate for the Basket [6%-9%].
• Floor Rate: -30.00%, per Reference Security.
• Valuation Share Price: With respect to a Reference Security and as of each Coupon Payment Date, the Closing Price of that Reference Security on the related Coupon Valuation Date.
• Initial Share Price: With respect to each Reference Security, the Closing Price of that Reference Security on the Initial Fixing Date, as listed in the table above.
• Payment at Maturity: For each CD, the Maturity Redemption Amount.
• Maturity Redemption Amount: the Principal Amount plus any Coupon Payment Amount due on the Maturity Date.

• Closing Price: For any Scheduled Trading Day with respect to each Reference Security, the official closing price of that Reference Security on the Relevant Exchange as of the close of the regular trading session on the Relevant Exchange and as reported in the official price determination mechanism for the Relevant Exchange.
• Early Redemption Dates: December 30, 2011, December 31, 2012, December 31, 2013, December 31, 2014, and December 31, 2015 subject to adjustment as described herein
• Early Redemption Charge: A depositor electing to redeem his or her CDs prior to maturity will be subject to an Early Redemption Charge as described herein.
• Form of CD: Book-entry
• Listing: The CDs will not be listed on any U.S. securities exchange or quotation system
• CUSIP : 40431GHD4
• OID Tax Rate: [1.90]%
Purchasing the CDs involves a number of risks. See “Risk Factors” beginning on page 9.
The CDs offered hereby are time deposit obligations of HSBC Bank USA, National Association, a national banking association organized under the laws of the United States, the deposits of which are insured by the Federal Deposit Insurance Corporation (the “FDIC”) within the limits and to the extent described in the section entitled “FDIC Insurance” herein and in the Base Disclosure Statement. Since December 20, 2008, the Issuer’s designated main office is located in McLean, VA.
Our affiliate, HSBC Securities (USA) Inc. and other unaffiliated distributors of the CDs may use these terms and conditions and the accompanying Base Disclosure Statement in connection with offers and sales of the CDs after the date hereof. HSBC Securities (USA) Inc. may act as principal or agent in those transactions. As used herein, references to the “Issuer”, “we”, “us” and “our” are to HSBC Bank USA, National Association.

1
HSBC BANK USA, NATIONAL ASSOCIATION
Member FDIC
These Terms and Conditions were not intended or written to be used, and cannot be used, for the purpose of avoiding U.S. federal,
state, or local tax penalties. These Terms and Conditions were written and provided by the Issuer in connection with the promotion or
marketing by the Issuer and/or distributors of the CDs. Each depositor should seek advice based on its particular circumstances from an
independent tax advisor.
Important information regarding the CDs is also contained in the Base Disclosure Statement for Certificates of Deposit, which
forms a part of, and is incorporated by reference into, these Terms and Conditions. Therefore, these Terms and Conditions
should be read in conjunction with the Base Disclosure Statement. A copy of the Base Disclosure Statement is available at
www.us.hsbc.com/structuredcd or can be obtained from the Agent offering the CDs.

HSBC Bank USA, National Association Trading & Sales Desk: (212) 525-8010
452 Fifth Ave., New York, NY 10018
2
TABLE OF CONTENTS
SUMMARY OF TERMS 3
QUESTIONS AND ANSWERS 7
RISK FACTORS 9
DESCRIPTION OF THE CERTIFICATES OF DEPOSIT 13
THE DISTRIBUTION 19
FDIC INSURANCE 19
CERTAIN ERISA CONSIDERATIONS 19
CERTAIN U.S. FEDERAL INCOME TAX CONSIDERATIONS 19
ANNEX A: DESCRIPTION OF THE REFERENCE SECURITIES 23

3
SUMMARY OF TERMS
Set forth in these Terms and Conditions is a summary of certain terms and conditions of the 6 Year Annual Income Opportunity CD
With “Auto Cap” Feature maturing November 29, 2016. The following summary of certain terms of the CDs is subject to the more
detailed terms of the CDs included elsewhere in these Terms and Conditions and should be read in conjunction with the Base
Disclosure Statement.
Issuer: HSBC BANK USA, NATIONAL ASSOCIATION, acting through its New York Branch
Issuer Rating: The Issuer is currently rated Aa3 by Moody’s Investors Service, Inc. and AA by Standard & Poor’s
Financial Services LLC, a subsidiary of the McGraw-Hill Companies, Inc. The credit ratings pertain
only to the creditworthiness of the Issuer and are not indicative of the market risk associated with the
CDs.
CDs: 6 Year Annual Income Opportunity CD with “Auto Cap” Feature maturing November 29, 2016
Book-Entry Form: The CDs will be represented by one or more master CDs held by and registered in the name
of Depository Trust Company (“DTC”). Beneficial interests in the CDs will be shown on,
and transfers thereof will be effected only through, records maintained by DTC and its direct and
indirect participants.
Aggregate Principal Amount: $TBD
Minimum Deposit Amount: $1,000 Principal Amount (except that each Agent may, in its discretion, impose a higher
minimum deposit amount with respect to the CD sales to its customers) and multiples of $1,000
Principal Amount thereafter.
Principal Amount: $1,000 for each CD
Pricing Date: November 23, 2010
Trade Date: November 23, 2010
Settlement Date: November 29, 2010
Maturity Date: November 29, 2016, subject to adjustment as described herein
Issue Price: 100% of Principal Amount.
Basket: An equally weighted basket constituted of the common stock and/or ADRs (each a “Reference
Security” and together, the “Reference Securities”) of the following 12 public companies (each, a
“Reference Issuer” and together, the “Reference Issuers”).
REFERENCE ISSUER BLOOMBERG TICKER
SYMBOL
RELEVANT EXCHANGE
Banco Bradesco S.A. BBD NYSE China Mobile LTD-Spon ADR CHL NYSE
Duke Energy Corp. DUK NYSE Encana Corp ECA NYSE Goldcorp Inc. GG NYSE
Home Depot Inc HD NYSE Honda Motor Co. Ltd.- Spons ADR HMC NYSE
Lorillard Inc LO NYSE Novartis AG- Spons ADR NVS NYSE Toronto-Dominion Bank TD NYSE
Total SA-Spons ADR TOT NYSE Unilever NV - NY Shares UN NYSE

4
For summary descriptions of the Reference Securities, please refer to the Questions and Answers
hereto.
Maturity Redemption Amount: The Maturity Redemption Amount is the total amount due and payable on each CD on the Maturity
Date. On the Maturity Date, the depositor of each CD will receive an amount equal to the Principal
Amount plus any additional Coupon Payment Amount due on the Maturity Date.
Coupon Payment Amount: The Principal Amount multiplied by the Coupon Rate.
Coupon Rate: The Coupon Rate on each Coupon Payment Date will be variable and will be equal to the greater of
A) the arithmetic average of the Reference Security Returns for the Reference Securities, and B)
zero.
Reference Security
Return: For each Reference Security and with respect to each Coupon Valuation Date:
If the Valuation Share Price is greater than or equal to the Initial Share Price, an amount equal to
the Auto Cap Rate; or
If the Valuation Share Price is less than the Initial Share Price, an amount equal to the greater of A)
the Reference Security Performance, and B) the Floor Rate.
Reference Security
Performance: For each Reference Security as of each Coupon Valuation Date, the quotient of A) the Valuation
Share Price minus the Initial Share Price, divided by B) the Initial Share Price.
Valuation Share Price: With respect to a Reference Security and as of each Coupon Payment Date, the Closing Price of
that Reference Security on the related Coupon Valuation Date.
Initial Share Price: With respect to each Reference Security, the Closing Price of that Reference Security on the Initial
Fixing Date, as listed on the cover page.
Auto Cap Rate: [6-9]% per Reference Security as determined on the Initial Fixing Date, which will, in effect, make
the maximum Coupon Rate for the Basket [6-9]%
Floor Rate: -30.00%, per Reference Security.
Coupon Payment Dates and
Coupon Valuation Dates:
Coupon Valuation Date (subject to adjustment as described herein)
Coupon Payment Date (subject to adjustment as described herein)
November 23, 2011 November 29, 2011
November 23, 2012 November 28, 2012
November 25, 2013 November 29, 2013
November 24, 2014 November 28, 2014
November 23, 2015 November 27, 2015
November 23, 2016 November 29, 2016
On each Coupon Payment Date, the Issuer will pay a Coupon Payment Amount equal to the
Principal Amount multiplied by the applicable Coupon Rate determined on the Coupon Valuation
Date related to that Coupon Payment Date.
Closing Price: For any Scheduled Trading Day with respect to each Reference Security, the official closing price of
that Reference Security on the Relevant Exchange as of the close of the regular trading session on
the Relevant Exchange and as reported in the official price determination mechanism for the
Relevant Exchange.

5
Scheduled Trading Day: Any day on which all of the Relevant Exchanges and Related Exchanges are scheduled to be open
for trading for each Reference Security.
Relevant Exchange: The primary exchange for each Reference Security, as set forth in the table above.
Related Exchange: The exchanges or quotation systems, if any, on which options or futures contracts on the Reference
Securities are traded or quoted, and as may be selected from time to time by the Calculation Agent.
Early Redemption at Current
Market Value: Each depositor will be entitled to redeem his or her CDs in whole, but not in part, on any Early
Redemption Date (as defined on the front cover), subject to an Early Redemption Charge. No fewer
than ten Business Days prior to an Early Redemption Date, a depositor, through the Agent from
whom he or she bought the CDs, may obtain from the Calculation Agent an estimate of the Early
Redemption Amount (as defined below) applicable to that Early Redemption Date. This estimate is
provided for informational purposes only, and neither the Bank nor the Calculation Agent will be
bound by the estimate. If a depositor redeems his or her CDs on any Early Redemption Date, he or
she will be entitled solely to the actual Early Redemption Amount calculated by the Calculation
Agent and will not be entitled to an amount in respect of any further Coupon Payment Amount or
any other return on his or her CDs. Further, the Early Redemption Amount will be subject to an Early
Redemption Charge and may be less (and may be substantially less) than the Principal Amount paid
for the CDs. A depositor may request early redemption of the CDs in whole, but not in part, on an
Early Redemption Date by notifying the Agent from whom he or she bought the CDs (who must then
notify the Bank) no later than 3:00 p.m. EST/EDT on the fifth Business Day before the Early
Redemption Date. All early redemption requests (whether written or oral) are irrevocable. The
Calculation Agent will determine the Early Redemption Amount on the third Business Day prior to
the related Early Redemption Date (the “Early Redemption Valuation Date”), and the depositor will
receive the Early Redemption Amount for each CD so redeemed on the related Early Redemption
Date.
Early Redemption Amount: For any Early Redemption Date, the Current Market Value, where “Current Market Value” means the
bid price for the CDs as of the related Early Redemption Valuation Date as determined by the
Calculation Agent based on its financial models and objective market factors less an Early
Redemption Charge. If the Early Redemption Valuation Date is not a Scheduled Trading Day for
any Reference Security, then the Early Redemption Valuation Date will be the next Exchange
Business Day that is a Scheduled Trading Day for each of the Reference Securities. If a Market
Disruption Event exists on the Early Redemption Valuation Date, then the Early Redemption
Valuation Date will be postponed for up to five Scheduled Trading Days. If the Early Redemption
Valuation Date is so postponed, then the related Early Redemption Date will also be postponed until
the third Business Day following the date to which the Early Redemption Valuation Date is
postponed and no interest will be payable in respect of any such postponement. A depositor will
not be entitled to any return on his or her CD if that depositor elects to redeem his or her CD
on any Early Redemption Date. Further, the Early Redemption Amount may be less (and may
be substantially less) than the Principal Amount of the CD.
Early Redemption Charge: For each CD redeemed on an Early Redemption Date, an amount equal to the Principal Amount
multiplied by the applicable Early Redemption Charge as set forth in the table below:
Year 1 2 3 4 5 6
Early Redemption Charge 3.50% 2.50% 1.50% 0.50% 0.00% 0.00%
For purposes of the Early Redemption Charges:
Year 1 is defined as: from and including the Trade Date to (but excluding) the first anniversary
of the Trade Date;

6
Year 2 is defined as: from and including the first anniversary of the Trade Date to (but
excluding) the second anniversary of the Trade Date;
Year 3 is defined as: from and including the second anniversary of the Trade Date to (but
excluding) the third anniversary of the Trade Date;
Year 4 is defined as: from and including the third anniversary of the Trade Date to (but
excluding) the fourth anniversary of the Trade Date;
Year 5 is defined as the date from and including the fourth anniversary of the Trade Date to (but
excluding) the fifth anniversary of the Trade Date; and
Year 6 is defined as the date from and including the fifth anniversary of the Trade Date to (but
excluding) the sixth anniversary of the Trade Date.
Early Redemption upon the
Death of a Depositor: In the event of the death of any depositor of CDs, the full withdrawal of the Principal Amount of the
CDs of that depositor will be permitted. In that event, the successor of that depositor shall give prior
written notice of the proposed withdrawal to the Issuer, together with appropriate documentation to
support the request, within 180 days of the death of such depositor. In that event, only a full
withdrawal of the Principal Amount of the CDs will be permitted. CDs so redeemed will not be
entitled to any return on the Principal Amount in respect of interest or the Coupon Payment Amount.
Market Disruption Event: As described in the Base Disclosure Statement.
Calculation Agent: HSBC Bank USA, National Association
All determinations and calculations made by the Calculation Agent will be at the sole discretion of
the Calculation Agent and will, in the absence of manifest error, be conclusive for all purposes and
binding on the depositors of the CDs.
Listing: None. See “Risk Factors” herein.
FDIC Insurance: See “FDIC Insurance” herein and in the Base Disclosure Statement for details.
ERISA Plans: See “Certain ERISA Considerations” in the Base Disclosure Statement for details.
Risk Factors: The purchase of the CDs involves certain risks. See “Risk Factors” herein for a discussion of some
of the factors which should be considered by prospective purchasers of the CDs.
Tax: See “Certain U.S. Federal Income Tax Considerations” herein for a description of the tax treatment
applicable to this instrument.
Governing Law: New York

7
QUESTIONS AND ANSWERS
What Are the CDs?
The CDs are certificates of deposit issued by the Issuer. The CDs mature on the Maturity Date. Depositors of the CDs also have the
right to cause the Issuer to redeem their CDs in whole, but not in part, as described below. Redemptions may occur optionally upon the
death of a depositor. See “Redemption upon the Death of a Depositor” in the Base Disclosure Statement.
Each CD represents an initial deposit by a depositor to the Issuer of $1,000 Principal Amount (except that each Agent may, in its
discretion, impose a higher minimum deposit amount with respect to the CD sales to its customers), and the CDs will be issued in
integral multiples of $1,000 Principal Amount in excess thereof. Depositors will not have the right to receive physical certificates
evidencing their ownership of the CDs except under limited circumstances; instead the Issuer will issue the CDs in book-entry form.
Persons acquiring beneficial ownership interests in the CDs will hold the CDs through DTC in the United States, if they are participants
of DTC, or indirectly through organizations which are participants in DTC.
What Amount Will Depositors Receive at Maturity in Respect of the CDs?
At the scheduled maturity (and not upon an Early Redemption by the depositor), the amount depositors will receive for each CD will be
equal to the Maturity Redemption Amount, which will equal A) the Principal Amount of the CD plus B) any Coupon Payment Amount due
on the Maturity Date, as described in the Summary of Terms above and the “Payment at Maturity” section in the Base Disclosure
Statement. The annual percentage yield on the CD is only determinable at maturity.
The Maturity Redemption Amount and the Coupon Payment Amounts, if any, will not include dividends paid on the Reference
Securities. Apart from the Coupon Payment Amounts, if any, no interest will be paid, either for periods prior to the Settlement
Date, during the term of the CDs or at or after maturity.
For more information, see “Summary of Terms” above, together with the Base Disclosure Statement.
What Coupon Payment Amount will be paid on the CDs?
On each Coupon Payment Date, the Coupon Payment Amount will equal the Principal Amount multiplied by the Coupon Rate. The
Coupon Rate on each such Coupon Payment Date will be variable and will be equal to the greater of the A) the arithmetic average of
the Reference Security Returns for the Reference Securities, and B) zero. With respect to any Reference Security, the Reference
Security Return as of any Coupon Valuation Date will be:
If the Valuation Share Price is greater than or equal to the Initial Share Price, an amount equal to the Auto Cap Rate; or
If the Valuation Share Price is less than the Initial Share Price, an amount equal to the greater of A) the Reference Security
Performance, and (B) the Floor Rate.
What Amount Will Depositors Receive if They Exercise Their Early Redemption Right?
The redemption proceeds paid by the Issuer upon an Early Redemption will be the Early Redemption Amount, which will equal the
Current Market Value of the CD as determined by the Calculation Agent in good faith based on its financial models and objective market
factors less an Early Redemption Charge. There is no guarantee that a depositor who redeems a CD on any Early Redemption Date will
receive his or her full Principal Amount or any return on his or her CD. See “Early Redemptions” above in the Summary of Terms.
Are the CDs FDIC Insured?
The payment of principal at maturity of this CD is insured by the FDIC up to the standard maximum deposit insurance amount in effect.
In general, deposits held by an individual depositor in the same ownership capacity at the same depository institution are insured by the
FDIC up to $250,000. Please see “FDIC Insurance” in the Base Disclosure Statement for more details.

8
What Are the U.S. Federal Income Tax Consequences of Purchasing the CDs?
The Issuer intends to treat the CDs as “contingent payment debt instruments” for U.S. federal income tax purposes. U.S. Holders (as
defined under “Certain U.S. Federal Income Tax Considerations”) will be required to include in their taxable income for each year an
amount of ordinary income equal to the “original issue discount” (“OID”) on the CDs for that year. The OID is included in income and
taxable at ordinary income rates. As a result, U.S. Holders may be required to include OID with respect to their CDs in income in the
first year in excess of actual payments received on their CDs. However, based on the projected payment tables included in the "Certain
U.S. Federal Income Tax Considerations" section below, for subsequent years prior to the maturity date of the instrument, your taxable
income will likely equal that of any actual coupon payments received as a result of the performance of the CD. Please review the
section below entitled "Adjustments for Differences between Projected Coupon Payment Amount and Actual Coupon Payment Amount"
for more information
The amount of the OID that must be taken into income in each year will be calculated on the basis of the “comparable yield” of the CDs,
which is the yield at which the Issuer would issue a non-contingent fixed-rate debt instrument having terms and conditions similar to
those of the CDs. The comparable yield is determined by the Issuer as of the issuance date solely for U.S. federal income tax purposes
and is neither a prediction nor a guarantee of what the actual yield will be on the CDs.
The Issuer will prepare a “projected payment schedule” that produces the comparable yield. If the actual Coupon Payment Amount on
any Coupon Payment Date or the Maturity Redemption Amount exceeds the corresponding amount on the projected payment schedule,
the excess will be taxes as additional OID income to the U.S. Holder. Any gain recognized by a U.S. Holder on the sale, exchange or
other disposition of a CD will constitute ordinary interest income.
Prospective depositors should see “Certain U.S. Federal Income Tax Considerations” below and consult their tax advisors regarding the
tax consequences to them of a purchase of the CDs.
What about Liquidity?
There is currently no established secondary trading market for the CDs. There is no assurance that a secondary market for the CDs will
develop, or if it develops, that it will continue. In the event that a depositor could find a buyer of his or her CD, it is likely that the price a
buyer would be willing to pay would be net of the commissions paid or discount allowed to the Agents on the initial placement of the
CDs. Prospective depositors should carefully consider all of the information set forth in these Terms and Conditions and the Base
Disclosure Statement and, in particular, should evaluate the specific risk factors set forth under “Risk Factors”.
What about Fees?
The CDs will initially be distributed through an affiliate of the Issuer, HSBC Securities (USA) Inc. and certain other unaffiliated third party
distributors (the “Agents”). Agents may receive a commission or be allowed a discount as compensation for their services. See “The
Distribution” in the Base Disclosure Statement and below. The actual compensation paid may vary depending upon various factors
including market conditions and the duration of the CD.
What about ERISA Eligibility?
The CDs are not eligible for purchase by, on behalf of or with the assets of, Plans (as defined in the Base Disclosure Statement) unless
the purchase and holding of the CDs does not and will not constitute a non-exempt prohibited transaction under Section 406 of ERISA,
Section 4975 of the Code or Similar Law. In view of the fact that the CDs represent deposits with the Issuer, fiduciaries should take into
account the prohibited transaction exemption described in ERISA Section 408(b)(4), relating to the investment of plan assets in deposits
bearing a reasonable rate of interest in a financial institution supervised by the United States or a state, and/or Part IV of PTCE 81-8,
relating to transactions involving short-term investments, specifically certificates of deposit. (See “Certain ERISA Considerations” in the
Base Disclosure Statement.) Each initial purchaser of a CD and each transferee thereof shall be deemed to represent and covenant
that, throughout the period that it holds CDs, either A) it is not, and is not acquiring CDs with the assets of, a Plan, or B) that its
purchase, holding and disposition of the CDs will not constitute a non-exempt prohibited transaction under Section 406 of ERISA,
section 4975 of the Code, or Similar Law.

9
RISK FACTORS
Purchasing the CDs is not equivalent to investing directly in the Reference Securities. It is suggested that prospective depositors
considering purchasing CDs reach a decision to purchase only after carefully considering, with their financial, legal, tax, accounting and
other advisors, the suitability of the CDs in light of their particular circumstances and the risk factors set forth below and other information
set forth in these Terms and Conditions and the accompanying Base Disclosure Statement.
As you review the “Risk Factors” in the accompanying Base Disclosure Statement, you should pay particular attention to the following
sections:
• “— Risks Relating to All CD Issuances”;
• “— Additional Risks Relating to CDs with an Equity Security or Equity Index as the Reference Asset”; and
• “— Additional Risks Relating to CDs with More than One Instrument Comprising the Reference Asset.”
You will be subject to certain risks not associated with conventional fixed-rate or floating-rate CDs or debt securities.
The CDs are not suitable for purchase by all people. No person should purchase the CDs unless he or she understands and is able to bear the associated market, liquidity and yield risks.
Because of the numerous factors that may affect the value of the Reference Securities, no assurance can be given that depositors of the
CDs will receive any Coupon Payment Amount during the term of the CDs. Depositors must understand that they have no interest in the
Reference Securities or other asset and neither they, nor the Issuer on their behalf nor any Agent on their behalf, will have any recourse
against any Reference Issuer (as defined herein) or rights in the Reference Securities either contractually or statutorily. Depositors in the
CDs will not receive any payments in respect of dividends or other distributions that may be payable on the Reference Securities, nor will
depositors be entitled to any voting rights or other control rights that holders of the Reference Securities may have with respect to the
Reference Issuers. None of the Reference Issuers are affiliates of the Issuer, and none are involved in the CDs in any way. The
obligations represented by the CDs are obligations of the Issuer and are not obligations of the Reference Issuers.
Depositors Are Not Guaranteed the Receipt of the Principal Amount of their CDs, and will be subject to an Early Redemption
Charge, if they Redeem the CDs Early.
The CDs are designed so that if, and only if, they are held to maturity, the depositor will receive no less than the Principal Amount of his
or her CDs. If a depositor redeems the CDs early at his or her option, the depositor will not be entitled to any further Coupon Payment
Amount or any other return on his or her CDs. In addition, the proceeds received by such a depositor will be net of an Early Redemption
Charge. As a result, the proceeds payable upon an Early Redemption may be less (and may be substantially less) than the Principal
Amount of the CDs. See “Summary of Terms—Early Redemption” sections in these Terms and Conditions.
Depositors will have no protection against events affecting the Reference Issuers.
A depositor of the CDs will be subjected to the same events affecting the Reference Issuers and the price of the Reference Securities to
which shareholders of the Reference Issuers are subjected, but will not have direct rights against either the Reference Issuers or us.
Prospective purchasers of the CDs should review the various risk factors contained in the reports and other information which have been
filed with the Securities and Exchange Commission (the “Commission”), posted on websites or otherwise made publicly available by the
Reference Issuers with respect to themselves and the Reference Securities.
Changes in the price of one or more of the Reference Securities may wholly or partially offset each other.
Price movements in the Reference Securities may not correlate with each other. At a time when the price of one or more of the
Reference Securities increases, the price of one or more of the other Reference Securities may not increase as much, or may even
decrease. Therefore, in calculating the Coupon Rate, increases in the price of one or more of the Reference Securities may be
moderated, or wholly offset, by lesser increases or decreases in the price of one or more of the other Reference Securities.
You cannot predict the future performance of any of the Reference Securities or of the Basket as a whole, or whether increases in the
price of any of the Reference Securities will be offset by decreases in the price of other Reference Securities, based on their historical

10
performance. In addition, there can be no assurance that the Reference Security Return in the aggregate for the Reference Securities
will be positive on any given Coupon Valuation Date such that you will receive any Coupon Payment Amount on the corresponding
Coupon Payment Date.
Investing in the CDs is not equivalent to investing in the Basket or the individual Reference Securities.
Because the Reference Security Return of each of the Reference Securities is limited to the Auto Cap Rate of [6-9]% per Reference
Security when each annual Coupon Payment Amount is calculated, it is possible for the Coupon Rate on the CDs for any given Coupon
Payment Date to be substantially less than the simple price return of the Basket as measured from the Initial Fixing Date to the
applicable Coupon Valuation Date.
In addition, while the Auto Cap Rate will operate to limit your participation in the increase in the price of any Reference Security on a
given annual Coupon Valuation Date to [6-9]% per Reference Security, you will be exposed to any decline in the price of any other
Reference Security down to the Floor Rate -30.00%.
Because the Floor Rate -30.00% is larger than the Auto Cap Rate of [6-9]% in respect to each Reference Security, the negative
performance of one Reference Security may more that offset the positive performance of one or more of the other Reference Securities.
Consequently, it is possible that declines in one or a few of the Reference Securities could offset any increases in the price of one or
more Reference Securities that are limited by the Auto Cap Rate and that you could earn no Coupon Payment Amount even though the
simple price return of the basket would have been positive on the applicable Coupon Valuation Date.
There are additional risks relating to CDs with an American depositary share (“ADR”) as a Reference Security.
You will have limited antidilution protection. The Calculation Agent may adjust the Maturity Redemption Amount by adjusting the terms
of the CDs for certain actions taken by the depository for any Reference Security that is an ADR, which action affect any such Reference
Security. However, the Calculation Agent is not required to make an adjustment for actions taken by the depository that can affect such
Reference Security. If an action is taken by the depository that is perceived by the market to have a diluting or concentrative effect on
such Reference Security but that does not require the Calculation Agent to adjust the terms of the CDs, you may be materially and
adversely affected.
Securities linked to the value of foreign equity securities involve additional risks. You should be aware that investments in CDs linked to
the value of foreign equity securities such as any Reference Security that is an ADR might involve particular risks. Direct or indirect
government intervention to stabilize the foreign securities markets may affect trading prices and volumes in those markets where any
such Reference Security trades. In addition other special risks associated with investment in emerging markets may include, but are not
necessarily limited to: difficulties in enforcing contracts; less liquidity and smaller market capitalizations; lesser regulation of securities
markets; different accounting and disclosure standards; governmental interference; higher inflation and social, economic and political
uncertainties. These risks may affect the trading value of any Reference Security linked to a foreign equity security and a such the
Coupon Rate on the CDs.
You are subject to the risk of fluctuating foreign exchange rates. Reference Securities are quoted and traded in U.S. Dollars and, to the
extent that any such Reference Securities are ADRs, may trade at different prices from the relevant underlying foreign equity securities,
which are quoted and traded in their respective local currency. Fluctuations in the exchange rate between the relevant local currency of
the foreign equity securities and the U.S. Dollar may affect the U.S. Dollar equivalent of the local currency price of the relevant
underlying foreign equity securities on the respective foreign stock exchange(s) on which they trade. These fluctuations may affect the
market price of the Reference Security and, consequently, affect the value of the CDs.
An Investor in the CDs is Subject to Risks Associated with Foreign Securities Markets.
Because Reference Securities that are ADRs are publicly traded in their respective foreign countries, investments in the CDs involve
particular risks. For example, the foreign securities markets may be more volatile than the United States securities markets, and market
developments may affect these markets differently from the United States or other securities markets. Direct or indirect government
intervention to stabilize the securities markets outside the United States, as well as cross-shareholdings in certain companies, may affect
trading prices and trading volumes in those markets. Also, the public availability of information concerning foreign issuers may vary
depending on their home jurisdiction and the reporting requirements imposed by their respective regulators. In addition, the foreign

11
issuers may be subject to accounting, auditing and financial reporting standards and requirements that differ from those applicable to
United States reporting companies.
Securities prices generally are subject to political, economic, financial and social factors that apply to the markets in which they trade
and, to a lesser extent, foreign markets. Securities prices outside the United States are subject to political, economic, financial and
social factors that apply in foreign countries. These factors, which could negatively affect foreign securities markets, include the
possibility of changes in a foreign government’s economic and fiscal policies, the possible imposition of, or changes in, currency
exchange laws or other laws or restrictions applicable to foreign companies or investments in foreign equity securities and the possibility
of fluctuations in the rate of exchange between currencies. Moreover, foreign economies may differ favorably or unfavorably from the
United States economy in important respects such as growth of gross national product, rate of inflation, capital reinvestment, resources
and self-sufficiency.
Original Issue Discount Consequences of the CDs; U.S. Federal Income Tax Consequences.
The Issuer intends to treat the CDs as “contingent payment debt instruments” for U.S. federal income tax purposes. U.S. Holders (as
defined under “Certain U.S. Federal Income Tax Considerations”) will be required to include in their taxable income for each year an
amount of ordinary income equal to the “original issue discount” (“OID”) on the CDs for that year. The OID is included in income and
taxable at ordinary income rates. As a result, U.S. Holders may be required to include OID with respect to their CDs in income in the
first year in excess of actual payments received on their CDs. However, based on the projected payment tables included in the "Certain
U.S. Federal Income Tax Considerations" section below, for subsequent years prior to the maturity date of the instrument, your taxable
income will likely equal that of any actual coupon payments received as a result of the performance of the CD. Please review the
section below entitled "Adjustments for Differences between Projected Coupon Payment Amount and Actual Coupon Payment Amount"
for more information.
The amount of the OID that must be taken into income in each year will be calculated on the basis of the “comparable yield” of the CDs,
which is the yield at which the Issuer would issue a non-contingent fixed-rate debt instrument having terms and conditions similar to
those of the CDs. The comparable yield is determined by the Issuer as of the issuance date solely for U.S. federal income tax purposes
and is neither a prediction nor a guarantee of what the actual yield will be on the CDs.
The Issuer will prepare a “projected payment schedule” that produces the comparable yield. If the actual Coupon Payment Amount on
any Coupon Payment Date or the Maturity Redemption Amount exceeds the corresponding amount on the projected payment schedule,
the excess will be taxes as additional OID income to the U.S. Holder. Any gain recognized by a U.S. Holder on the sale, exchange or
other disposition of a CD will constitute ordinary interest income.
Prospective depositors should see “Certain U.S. Federal Income Tax Considerations” below and consult their tax advisors regarding the
tax consequences to them of a purchase of the CDs.
No Secondary Market for the CDs Exists. Depositors May Require the Issuer to Redeem the CDs Prior to Maturity Pursuant to
the Early Redemption Provisions, but Depositors May Suffer Losses.
There is currently no secondary market for the CDs. The Issuer does not intend to apply for listing of the CDs on any securities
exchange, quotation of the CDs through the Nasdaq National Market System or designation for trading in the PORTAL market. There is
no assurance that a secondary market for these CDs will develop, or if it develops, that it will continue. Even if a secondary market
develops, there can be no assurance that it will provide significant liquidity. The Issuer intends to quote bid prices periodically upon
depositor request, but is under no obligation to do so. In the event that the Issuer no longer provides such quotes, it may be difficult to
obtain reliable information about the value of the CDs. The CDs are most suitable for purchasing and holding to maturity.
Adverse Economic Interests to Depositors.
HSBC Bank USA, National Association is the Calculation Agent and will be solely responsible for the determination and calculation of
the Maturity Redemption Amount (including the components thereof in connection with the Coupon Payment Amount) and any other
determinations and calculations in connection with the CDs. Because the Issuer is the Calculation Agent, it may have economic interests
adverse to those of the depositors, including with respect to certain determinations and judgments that the Calculation Agent must make
in determining, for example, the Coupon Payment Amount, if any, on any Coupon Payment Date or if a Market Disruption Event has

12
occurred. However, the Calculation Agent is obligated to carry out its duties and functions as calculation agent in good faith and using its
reasonable judgment.
Market conditions and events affecting the Reference Securities may negatively impact the Coupon Payment Amounts
received by depositors.
Depositors should be aware that a considerable decrease in the price of any particular Reference Security in any year (whether due to
general economic conditions or an extraordinary event affecting such Reference Security) may materially limit the likelihood of a
depositor receiving any Coupon Payment Amount in that year and potentially subsequent years for the remainder of the CD term. For
example, upon an event such as a delisting of a Reference Security, the likelihood of a depositor receiving a Coupon Payment Amount
in the year of the event and for the remainder of the CD term, notwithstanding the positive performance of other Reference Securities,
may be materially limited. Such an event would also negatively impact the value of the CD in the secondary market, if any.

13
DESCRIPTION OF THE CERTIFICATES OF DEPOSIT
The following information is a summary of the CD itself and the Reference Securities to which the CD is linked. Prospective depositors
should also carefully review the “Description of the CDs” section in the Base Disclosure Statement. All disclosures contained in these
Terms and Conditions regarding the Reference Securities are derived from publicly available information prepared by the Reference
Issuer.
Information with Respect to the Reference Securities
Each potential depositor of a CD should review the reports and other information which have been filed with the Commission, posted on
websites or otherwise made publicly available by the Reference Issuers with respect to the Reference Securities. Depositors of the CDs
are hereby informed that the reports and other information on file with the Commission or that is otherwise publicly available to which
depositors are referred are not and will not be “incorporated by reference” herein. Neither the Issuer of the CDs nor any of its affiliates
will undertake to review the financial condition or affairs of the Reference Issuers during the life of the CDs or to advise any depositor or
potential depositor in the CDs of any information coming to the attention of the Issuer of the CDs or any affiliate thereof. Additional
information with respect to the Reference Securities is set forth in Annex A.
Adjustments to Coupon Valuation Dates
If a Coupon Valuation Date with respect to any Reference Security is not a Scheduled Trading Day, then the Coupon Valuation Date for
such Reference Security will be the next day that is a Scheduled Trading Day. If a Market Disruption Event with respect to any
Reference Security exists on a Coupon Valuation Date, then that Coupon Valuation Date for such Reference Security will be the next
Scheduled Trading Day on which a Market Disruption Event does not exist with respect to such Reference Security. If a Market
Disruption Event with respect to a Reference Security exists on five consecutive Scheduled Trading Days, then that fifth Scheduled
Trading Day will be the Coupon Valuation Date with respect to such Reference Security, and the Calculation Agent will determine the
Closing Price on that date in good faith and in its sole discretion.. For the avoidance of doubt, if no Market Disruption Event exists with
respect to a Reference Security in the Basket, the determination of such Reference Security’s value will be made on the originally
scheduled Observation Date, irrespective of the existence of a Market Disruption Event with respect to one or more of the other
Reference Securities. If a Coupon Valuation Date with respect to a Reference Security is postponed, then the related Coupon Payment
Date and, if the Coupon Payment Date coincides with the Maturity Date, the Maturity Date will also be postponed until the third business
day following the postponed Coupon Valuation Date and no interest will be payable in respect of such postponement.
Maturity Redemption Amount and Coupon Payment Amount
At maturity, the amount depositors will receive for each CD will be equal to the Maturity Redemption Amount, which will equal A) the
Principal Amount of the CD plus B) any additional Coupon Payment Amount due on the Maturity Date, as described in the Summary of
Terms above and the “Payment at Maturity” section in the Base Disclosure Statement. On each Coupon Payment Date, the Coupon
Rate will be variable and will equal the greater of A) the arithmetic average of the Reference Security Returns for the Reference
Securities, and B) zero. For each Reference Security and with respect to any Coupon Valuation Date, will be:
If the Valuation Share Price is greater than or equal to the Initial Share Price, an amount equal to the Auto Cap Rate; or
If the Valuation Share Price is less than the Initial Share Price, an amount equal to the greater of A) the Reference Security
Performance, which, for each Reference Security as of each Coupon Valuation Date, is the quotient of 1) the Valuation Share Price
minus the Initial Share Price, divided by 2) the Initial Share Price, and B) the Floor Rate. The payment of the Coupon Payment
Amount, if any, will be made on scheduled Coupon Payment Dates, as set forth in the “Summary of Terms – Coupon Valuation Dates
and Coupon Payment Dates” above.
The Maturity Redemption Amount and the Coupon Payment Amount, if any, will not include dividends paid on the Reference
Securities. Apart from the Coupon Payment Amount, if any, no interest will be paid, either for periods prior to the Settlement
Date, during the term of the CDs or at or after maturity.
For more information, see “Summary of Terms” above and “Sensitivity Analysis” below, together with the Base Disclosure Statement.

14
Market Disruption Events
If a Market Disruption Event occurs on a Coupon Valuation Date with respect to a Reference Security, then that Coupon Valuation Date
with respect to such Reference Security shall be postponed as described in “Adjustments to Coupon Valuation Dates” above and the
“Market Disruption Events” section of the Base Disclosure Statement.
Merger Event, Tender Offer, Delisting, Nationalization, Insolvency or Potential Adjustment Event
If a Merger Event, Tender Offer, Delisting, Nationalization, Insolvency, or declaration of a Potential Adjustment Event (each as described
in the Base Disclosure Statement) occurs with respect to a Reference Security or Reference Issuer, the Calculation Agent may, in its
reasonable discretion, adjust the terms of the CDs to reflect the economic impact of such event on the value of the CDs, though is not
required to follow any specific course of action to effect this result, as described in the “Merger Event and Tender Offer,” “Share
Delisting, Nationalization, Insolvency,” “Adjustments” or “Extraordinary Events Related to Fund Shares” section of the Base Disclosure
Statement.
In the event of a Delisting, Nationalization, Insolvency or similar Potential Adjustment Event such adjustments to the terms of the CDs,
the likelihood of a depositor receiving a Coupon Payment Amount in the year of the event and for the remainder of the CD term may be
materially limited.
Early Redemptions
The Issuer will permit early Redemption of the CDs on the Early Redemption Dates as described in the “Summary of Terms—Early
Redemption at Current Market Value” section above and the “Early Redemptions” section of the Base Disclosure Statement.
Redemption upon the Death of a Depositor
Please refer to the section herein entitled “Summary of Terms – Early Redemption Upon the Death of a Depositor” and the section
entitled “Redemption upon the Death of a Depositor” in the Base Disclosure Statement.
Ratings
The CDs will not be rated by any rating agency.
The Calculation Agent
The Issuer is the Calculation Agent with regard to the CDs and is solely responsible for the determination and calculation of the Maturity
Redemption Amount (including the components thereof), the Coupon Payment Amounts, if any, payable on corresponding Coupon
Payment Dates, and any other determinations and calculations with respect to any distributions of cash in connection with the CDs, as
well as for determining whether a Market Disruption Event has occurred and for making certain other determinations with regard to a
Reference Security. All determinations and calculations made by the Calculation Agent will be at the sole discretion of the Calculation
Agent and will be conclusive for all purposes and binding on the Issuer and depositors of the CDs, absent manifest error and provided
that the Calculation Agent shall be required to act in good faith in making any determination or calculation. If the Calculation Agent uses
discretion to make a determination or calculation, the Calculation Agent will notify the Issuer, who will provide notice to DTC in respect of
the CDs. The Calculation Agent may have economic interests adverse to those of the depositors of the CDs, including with respect to
certain determinations and judgments that the Calculation Agent must make in determining the Closing Prices, the Initial Share Prices,
the Maturity Redemption Amount and any Coupon Payment Amount payable on corresponding Coupon Payment Dates, in determining
whether a Market Disruption Event has occurred, and in making certain other determinations with regard to any Reference Security. The
Calculation Agent is obligated to carry out its duties and functions in good faith and using its reasonable judgment. The Calculation
Agent will not be liable for any loss, liability, cost, claim, action, demand or expense (including, without limitation, all costs, charges and
expenses paid or incurred in disputing or defending any of the foregoing) arising out of or in relation to or in connection with its
appointment or the exercise of its functions, except such as may result from its own willful default or gross negligence or that of its
officers or agents. Nothing shall prevent the Calculation Agent or its affiliates from dealing in the CDs or from entering into any related
transactions, including any swap or hedging transactions, with any depositor of CDs. The Calculation Agent may resign at any time;
however, resignation will not take effect until a successor Calculation Agent has been appointed.

15
Illustrative Examples
The following examples are provided for illustration purposes only and are hypothetical; they do not purport to be representative of every
possible scenario concerning increases or decreases in the return of the CDs. We cannot predict the Closing Prices of the Reference
Securities on the Coupon Valuation Dates. The assumptions we have made in connection with the illustrations set forth below may not
reflect actual events, and the hypothetical initial share prices of the Reference Securities used in the illustrations below are not the actual
Initial Share Prices of the Reference Securities. You should not take these examples as an indication or assurance of the expected
performance of the Reference Securities or the CDs.
The following examples indicate how changes in the performance of the Reference Securities over the term of the CDs will affect the
Coupon Payment Amount payable on the CDs for any Coupon Payment Date. These examples assume the Auto Cap Rate is [7%], a
Floor Rate of -30% and the initial investment is $1,000.
Example 1: The securities generally rise over the term of the CDs.
Closing Price per Reference Security on the Applicable Valuation Dates
Securities Initial Share Price Year 1 Year 2 Year 3 Year 4 Year 5 Year 6Reference Security 1 100.00 127.00 123.00 120.00 118.00 116.00 114.00Reference Security 2 100.00 98.00 101.00 101.00 113.00 115.00 125.00Reference Security 3 100.00 90.00 96.00 110.00 118.00 130.00 137.00Reference Security 4 100.00 101.00 102.00 103.00 106.00 113.00 119.00Reference Security 5 100.00 105.00 113.00 109.00 110.00 132.00 139.00Reference Security 6 100.00 108.00 108.00 108.00 108.00 114.00 125.00Reference Security 7 100.00 104.00 121.00 143.00 173.00 197.00 208.00Reference Security 8 100.00 115.00 105.00 115.00 109.00 113.00 118.00Reference Security 9 100.00 110.00 97.00 106.00 103.00 117.00 124.00Reference Security 10 100.00 93.00 107.00 116.00 122.00 132.00 139.00Reference Security 11 100.00 126.00 122.00 118.00 116.00 114.00 113.00Reference Security 12 100.00 98.00 100.00 100.00 112.00 114.00 124.00
Reference Security Returns from Initial Level, capped at 7.00% and floored at -30%Securities Year 1 Year 2 Year 3 Year 4 Year 5 Year 6Reference Security 1 7.00% 7.00% 7.00% 7.00% 7.00% 7.00%Reference Security 2 -2.00% 7.00% 7.00% 7.00% 7.00% 7.00%Reference Security 3 -10.00% -4.00% 7.00% 7.00% 7.00% 7.00%Reference Security 4 7.00% 7.00% 7.00% 7.00% 7.00% 7.00%Reference Security 5 7.00% 7.00% 7.00% 7.00% 7.00% 7.00%Reference Security 6 7.00% 7.00% 7.00% 7.00% 7.00% 7.00%Reference Security 7 7.00% 7.00% 7.00% 7.00% 7.00% 7.00%Reference Security 8 7.00% 7.00% 7.00% 7.00% 7.00% 7.00%Reference Security 9 7.00% -3.00% 7.00% 7.00% 7.00% 7.00%Reference Security 10 -7.00% 7.00% 7.00% 7.00% 7.00% 7.00%Reference Security 11 7.00% 7.00% 7.00% 7.00% 7.00% 7.00%Reference Security 12 -2.00% 7.00% 7.00% 7.00% 7.00% 7.00%
2.92% 5.25% 7.00% 7.00% 7.00% 7.00%
Coupon Rate for the Applicable Period: 2.92% 5.25% 7.00% 7.00% 7.00% 7.00%
Average of the Reference Security Returns
In this example, as of each Coupon Valuation Date, the Valuation Share Price of each of the Reference Securities has generally increased from the Initial Share Price for that Reference Security. On each Coupon Payment Date, therefore, the CDs will pay a Coupon Payment Amount equal to the Principal Amount multiplied by the Coupon Rate for that Coupon Payment Date. Furthermore, for certain of the Reference Securities and with respect to certain Coupon Payment Dates, the Reference Security Return as of such Coupon Payment Dates is greater than the Auto Cap Rate. The Reference Security Return for those Reference Securities that will contribute to the calculation of the Coupon Rate with respect to those Coupon Payment Dates is therefore limited by the Auto Cap Rate.

16
Example 2: The securities’ performance are mixed over the term of the CDs.
Closing Price per Reference Security on the Applicable Valuation DatesSecurities Initial Share Price Year 1 Year 2 Year 3 Year 4 Year 5 Year 6Reference Security 1 100.00 99.00 90.00 106.00 121.00 102.00 140.00Reference Security 2 100.00 95.00 90.00 103.00 105.00 100.00 127.00Reference Security 3 100.00 108.00 109.00 125.00 143.00 105.00 159.00Reference Security 4 100.00 89.00 57.00 84.00 107.00 123.00 130.00Reference Security 5 100.00 108.00 103.00 118.00 126.00 101.00 102.00Reference Security 6 100.00 105.00 89.00 108.00 109.00 97.00 120.00Reference Security 7 100.00 97.00 89.00 107.00 117.00 114.00 106.00Reference Security 8 100.00 95.00 96.00 116.00 127.00 108.00 152.00Reference Security 9 100.00 103.00 98.00 115.00 129.00 105.00 149.00Reference Security 10 100.00 89.00 95.00 105.00 111.00 103.00 107.00Reference Security 11 100.00 98.00 89.00 104.00 119.00 104.00 113.00Reference Security 12 100.00 98.00 89.00 102.00 104.00 99.00 106.00
Reference Security Returns from Initial Level, capped at 7.00% and floored at -30%Securities Year 1 Year 2 Year 3 Year 4 Year 5 Year 6Reference Security 1 -1.00% -10.00% 7.00% 7.00% 7.00% 7.00%Reference Security 2 -5.00% -10.00% 7.00% 7.00% 7.00% 7.00%Reference Security 3 7.00% 7.00% 7.00% 7.00% 7.00% 7.00%Reference Security 4 -11.00% -30.00% -16.00% 7.00% 7.00% 7.00%Reference Security 5 7.00% 7.00% 7.00% 7.00% 7.00% 7.00%Reference Security 6 7.00% -11.00% 7.00% 7.00% -3.00% 7.00%Reference Security 7 -3.00% -11.00% 7.00% 7.00% 7.00% 7.00%Reference Security 8 -5.00% -4.00% 7.00% 7.00% 7.00% 7.00%Reference Security 9 7.00% -2.00% 7.00% 7.00% 7.00% 7.00%Reference Security 10 -11.00% -5.00% 7.00% 7.00% 7.00% 7.00%Reference Security 11 -2.00% -11.00% 7.00% 7.00% 7.00% 7.00%Reference Security 12 -2.00% -11.00% 7.00% 7.00% -1.00% 7.00%
-1.00% -7.58% 5.08% 7.00% 5.50% 7.00%
Coupon Rate for the Applicable Period: 0.00% 0.00% 5.08% 7.00% 5.50% 7.00%
Average of the Reference Security Returns
*Reference Security Returns highlighted in bold would otherwise be below the Floor Rate.
In this example, on any Coupon Valuation Date, the Valuation Share Price of some of the Reference Securities has declined with respect to the Initial Share Price for that Reference Security, while the Valuation Share Price of other Reference Securities has increased. On the Coupon Payment Date in years one and two the Coupon Rate is zero (the average of the Reference Security Returns for the Reference Securities is negative), while in years three, four, five and six the Coupon Rate is positive. Therefore, in years one and two the CDs will pay a Coupon Payment Amount equal to zero, whereas in years three, four, five and six, the CDs will pay a Coupon Payment Amount equal to the Principal Amount multiplied by the Coupon Rate as of each Coupon Payment Date.

17
Example 3: The securities performance generally declines over the term of the CDs.
Closing Price per Reference Security on the Applicable Valuation Dates
Securities Initial Share Price Year 1 Year 2 Year 3 Year 4 Year 5 Year 6Reference Security 1 100.00 104.00 113.00 101.00 101.00 87.00 113.00Reference Security 2 100.00 95.00 90.00 93.00 94.00 95.00 94.00Reference Security 3 100.00 102.00 115.00 113.00 108.00 96.00 110.00Reference Security 4 100.00 90.00 85.00 87.00 78.00 72.00 86.00Reference Security 5 100.00 88.00 84.00 65.00 88.00 89.00 88.00Reference Security 6 100.00 105.00 89.00 90.00 96.00 95.00 94.00Reference Security 7 100.00 88.00 65.00 84.00 75.00 76.00 69.00Reference Security 8 100.00 95.00 96.00 96.00 97.00 91.00 99.00Reference Security 9 100.00 99.00 98.00 99.00 100.00 97.00 99.00Reference Security 10 100.00 96.00 97.00 99.00 100.00 92.00 99.00Reference Security 11 100.00 103.00 112.00 99.00 99.00 91.00 112.00Reference Security 12 100.00 94.00 69.00 92.00 93.00 94.00 93.00
Reference Security Returns from Initial Level, capped at 7.00% and floored at -30%Securities Year 1 Year 2 Year 3 Year 4 Year 5 Year 6Reference Security 1 7.00% 7.00% 7.00% 7.00% -13.00% 7.00%Reference Security 2 -5.00% -10.00% -7.00% -6.00% -5.00% -6.00%Reference Security 3 7.00% 7.00% 7.00% 7.00% -4.00% 7.00%Reference Security 4 -10.00% -15.00% -13.00% -22.00% -28.00% -14.00%Reference Security 5 -12.00% -16.00% -30.00% -12.00% -11.00% -12.00%Reference Security 6 7.00% -11.00% -10.00% -4.00% -5.00% -6.00%Reference Security 7 -12.00% -30.00% -16.00% -25.00% -24.00% -30.00%Reference Security 8 -5.00% -4.00% -4.00% -3.00% -9.00% -1.00%Reference Security 9 -1.00% -2.00% -1.00% 7.00% -3.00% -1.00%Reference Security 10 -4.00% -3.00% -1.00% 7.00% -8.00% -1.00%Reference Security 11 7.00% 7.00% -1.00% -1.00% -9.00% 7.00%Reference Security 12 -6.00% -30.00% -8.00% -7.00% -6.00% -7.00%
-2.25% -8.33% -6.42% -4.33% -10.42% -4.75%
Coupon Rate for the Applicable Period: 0.00% 0.00% 0.00% 0.00% 0.00% 0.00%
Average of the Reference Security Returns
*Reference Security Returns highlighted in bold would otherwise be below the Floor Rate.
In this example, on any Coupon Valuation Date, the average of the Reference Security Returns on each Coupon Payment Date is
negative. Therefore, the Coupon Rate for those Coupon Payment Dates will be equal to zero, and on the Maturity Date, the depositor
will receive only the Principal Amount.

18
Example 4: One of the securities is delisted in Year 2.
Closing Price per Reference Security on the Applicable Valuation Dates
Securities Initial Share Price Year 1 Year 2 Year 3 Year 4 Year 5 Year 6Reference Security 1 100.00 80.00 0.00 0.00 0.00 0.00 0.00Reference Security 2 100.00 105.00 111.00 113.00 113.00 113.00 126.00Reference Security 3 100.00 108.00 113.00 115.00 116.00 116.00 114.00Reference Security 4 100.00 110.00 104.00 87.00 95.00 110.00 110.00Reference Security 5 100.00 108.00 112.00 114.00 118.00 122.00 147.00Reference Security 6 100.00 105.00 108.00 92.00 94.00 100.00 132.00Reference Security 7 100.00 109.00 111.00 112.00 115.00 112.00 128.00Reference Security 8 100.00 107.00 110.00 111.00 99.00 105.00 102.00Reference Security 9 100.00 110.00 117.00 118.00 120.00 117.00 117.00Reference Security 10 100.00 107.00 115.00 81.00 92.00 110.00 91.50Reference Security 11 100.00 99.00 94.00 87.00 90.00 102.00 112.00Reference Security 12 100.00 104.00 110.00 114.00 112.00 112.00 125.00
Reference Security Returns from Initial Level, capped at 7.00% and floored at -30%Securities Year 1 Year 2 Year 3 Year 4 Year 5 Year 6Reference Security 1 -20.00% -30.00% -30.00% -30.00% -30.00% -30.00%Reference Security 2 7.00% 7.00% 7.00% 7.00% 7.00% 7.00%Reference Security 3 7.00% 7.00% 7.00% 7.00% 7.00% 7.00%Reference Security 4 7.00% 7.00% -13.00% -5.00% 7.00% 7.00%Reference Security 5 7.00% 7.00% 7.00% 7.00% 7.00% 7.00%Reference Security 6 7.00% 7.00% -8.00% -6.00% 7.00% 7.00%Reference Security 7 7.00% 7.00% 7.00% 7.00% 7.00% 7.00%Reference Security 8 7.00% 7.00% 7.00% -1.00% 7.00% 7.00%Reference Security 9 7.00% 7.00% 7.00% 7.00% 7.00% 7.00%Reference Security 10 7.00% 7.00% -19.00% -8.00% 7.00% -8.50%Reference Security 11 -1.00% -6.00% -13.00% -10.00% 7.00% 7.00%Reference Security 12 7.00% 7.00% 7.00% 7.00% 7.00% 7.00%
4.08% 2.83% -2.83% -1.50% 3.92% 2.63%
Coupon Rate for the Applicable Period: 4.08% 2.83% 0.00% 0.00% 3.92% 2.63%
Average of the Reference Security Returns
*Reference Security Returns highlighted in bold would otherwise be below the Floor Rate.
In this example, one of the Reference Securities is delisted in Year 2. In this case, the Calculation Agent may deem a zero value for such Reference Security during Year 2 and for the remainder of the CD terms, in which case the Reference Security Return of such Reference Security would be the Floor Rate of -30.00% for each of these years. If such a determination is made the by Calculation Agent, the likelihood of a depositor receiving a Coupon Payment Amount for such years following any such delisting may be materially limited, despite the generally positive performance of the remaining Reference Securities. However, such treatment of the Reference Security in the event of a delisting represents only one such potential treatment of a delisting by the Calculation Agent. The Calculation Agent, in its reasonable discretion, may also use other methodologies to adjust the terms of the CDs to reflect the economic impact of such delisting on the value of the CDs and is not required to follow any specific course of action to effect this result.

19
THE DISTRIBUTION
Please refer to the section entitled “The Distribution” in the Base Disclosure Statement.
FDIC INSURANCE
The payment of principal at maturity of this CD is insured by the FDIC up to the standard maximum deposit insurance amount in effect.
In general, deposits held by an individual depositor in the same ownership capacity at the same depository institution are insured by the
FDIC up to $250,000. Please see “FDIC Insurance” in the Base Disclosure Statement for more details.
CERTAIN ERISA CONSIDERATIONS
Please refer to the section entitled “Certain ERISA Consideration” in the Base Disclosure Statement.
CERTAIN U.S. FEDERAL INCOME TAX CONSIDERATIONS
Set forth below is a summary of certain U.S. federal income tax considerations relevant to the purchase, beneficial ownership, and
disposition of a CD.
For purposes of this summary, a “U.S. Holder” is a beneficial owner of a CD that is:
• an individual who is a citizen or a resident of the United States for U.S. federal income tax purposes;
• a corporation (or other entity that is treated as a corporation for U.S. federal tax purposes) that is created or organized in or under the
laws of the United States or any State thereof (including the District of Columbia);
• an estate whose income is subject to U.S. federal income taxation regardless of its source; or
• a trust if a court within the United States is able to exercise primary supervision over its administration, and one or more United
States persons, as defined for U.S. federal income tax purposes, have the authority to control all of its substantial decisions.
For purposes of this summary, a “Non-U.S. Holder” is a beneficial owner of a CD that is:
• a nonresident alien individual for U.S. federal income tax purposes;
• a foreign corporation for U.S. federal income tax purposes;
• an estate whose income is not subject to U.S. federal income tax on a net income basis; or
• a trust if no court within the United States is able to exercise primary jurisdiction over its administration or if no United States persons,
as defined for U.S. federal income tax purposes, have the authority to control all of its substantial decisions.
An individual may, subject to certain exceptions, be deemed to be a resident of the United States by reason of being present in the
United States for at least 31 days in the calendar year and for an aggregate of at least 183 days during a three-year period ending in the
current calendar year (counting for such purposes all of the days present in the current year, one-third of the days present in the
immediately preceding year, and one-sixth of the days present in the second preceding year).
This summary is based on interpretations of the Internal Revenue Code of 1986, as amended (the “Code”), regulations issued there
under, and rulings and decisions currently in effect (or in some cases proposed), all of which are subject to change. Any such change
may be applied retroactively and may adversely affect the U.S. federal income tax consequences described herein. This summary
addresses only holders that purchase CDs at initial issuance and beneficially own such CDs as capital assets and not as part of a
“straddle,” “hedge,” “synthetic security” or a “conversion transaction” for U.S. federal income tax purposes, or as part of some other
integrated investment. This summary does not discuss all of the tax consequences that may be relevant to particular depositors or to
depositors subject to special treatment under the U.S. federal income tax laws (such as banks, thrifts, or other financial institutions;
insurance companies; securities dealers or brokers, or traders in securities electing mark-to-market treatment; mutual funds or real
estate investment trusts; small business investment companies; S corporations; depositors that hold their CDs through a partnership or
other entity treated as a partnership for U.S. federal tax purposes; depositors whose functional currency is not the U.S. dollar; certain

20
former citizens or residents of the United States; persons subject to the alternative minimum tax; retirement plans or other tax-exempt
entities, or persons holding the CDs in tax-deferred or tax-advantaged accounts; or “controlled foreign corporations” or “passive foreign
investment companies” for U.S. federal income tax purposes). This summary also does not address the tax consequences to
shareholders, or other equity holders in, or beneficiaries of, a holder of CDs, or any state, local or foreign tax consequences of the
purchase, ownership or disposition of the CDs.
The following summary was not intended or written to be used, and cannot be used, for the purpose of avoiding U.S. federal, state, or
local tax penalties. The following summary was written in connection with the promotion or marketing by the Issuer, HSBC Securities
(USA) Inc. and/or other distributors of the CDs. Each holder should seek advice based on its particular circumstances from an
independent tax advisor.
PROSPECTIVE PURCHASERS OF CDS SHOULD CONSULT THEIR TAX ADVISORS AS TO THE FEDERAL, STATE, LOCAL, AND
OTHER TAX CONSEQUENCES TO THEM OF THE PURCHASE, OWNERSHIP AND DISPOSITION OF CDs.
In General
For U.S. federal income tax purposes, the Issuer intends to treat the CDs as contingent payment debt instruments (“CPDIs”) subject to
taxation under the “noncontingent bond method” provided in the Treasury regulations. The remainder of this discussion assumes that
the CDs will be subject to the noncontingent bond method, and the holders of the CDs will agree to treat the CDs in accordance with this
treatment. Depositors should be aware, however, that the IRS is not bound by the Issuer’s characterization of the CDs, and the Internal
Revenue Service (the “IRS”) could possibly take a different position as to the proper characterization of the CDs for U.S. federal income
tax purposes. If the CDs are not in fact treated as CPDIs for U.S. federal income tax purposes, then the U.S. federal income tax
treatment of owning and disposing of the CDs could differ from the treatment discussed below with the result that the timing and
character of income, gain or loss recognized in respect of a CD could differ from the timing and character of income, gain or loss
recognized in respect of the CD had the CD in fact been treated as CPDIs for U.S. federal income tax purposes.
Tax Treatment of U.S. Holders
Accruals of Original Issue Discount
Under the noncontingent bond method, U.S. Holders of the CDs will accrue original issue discount (“OID”) over the term of the CDs
based on the CDs’ comparable yield. As a result, U.S. Holders may be required to include OID with respect to their CDs in income in
each year in excess of any Coupon Payment Amount received on any Coupon Payment Date or any actual payments received on their
CDs in such year.
In general, the comparable yield of the CDs is equal to the yield at which the Issuer would issue a fixed rate debt instrument with terms
and conditions similar to those of the CDs, including level of subordination, term, timing of payments, and general market conditions.
Based on these factors, the Issuer estimates that the comparable yield on the CDs, solely for U.S. federal income tax purposes, is
[1.90%] per annum (compounded annually). The comparable yield is determined by the Issuer as of the issuance date solely for U.S.
federal income tax purposes and is neither a prediction nor a guarantee of what the actual yield will be on the CDs.
Accordingly, U.S. Holders will generally accrue OID in respect of the CDs at a rate equal to the comparable yield. The amount of OID
allocable to each annual accrual period will be the product of the “adjusted issue price” of the CDs at the beginning of each such accrual
period and the comparable yield. If the CD provides for a noncontingent payment for any period in excess of the comparable yield, the
Issuer intends to treat the excess amount as a nontaxable return of principal. The “adjusted issue price” of the CDs at the beginning of
an accrual period will equal the issue price of the CDs plus the amount of OID previously includible in the gross income of the U.S.
Holder determined without regard to any positive or negative adjustments (described below), less the projected amount of interest
previously made on the CDs, without regard to actual interest paid, and less any amount previously received that was treated as a return
on principal. The issue price of the CDs will be the first price at which a substantial amount of the CDs are sold. The balance of this
summary assumes that the issue price of each CD is equal to the principal amount. The amount of OID includible in the income of each
U.S. Holder for each taxable year will generally equal the sum of the “daily portions” of the total OID on the CDs allocable to each day
during the taxable year on which a U.S. Holder held the CDs. Generally, the daily portion of the OID is determined by allocating to each
day in any accrual period a ratable portion of the OID allocable to such accrual period. Such OID is included in income and taxed as
ordinary income. Information returns indicating the amount of OID accrued on CDs held by persons of record other than corporations
and certain other “exempt recipients” will be filed with the IRS and sent to such record holder.

21
Under the noncontingent bond method, the comparable yield of the CD is used to construct a projected payment schedule for the CDs
(the “projected payment schedule”) based on estimates of the Coupon Rate and on the expected principal payment at maturity, that
produces the comparable yield. Under the noncontingent bond method, the projected payment schedule is not revised to account for
changes in circumstances that occur while the CDs are outstanding.
Based upon the estimates of the comparable yield and the projected payment schedule for the CDs, a U.S. Holder that pays taxes on a
calendar year basis, buys a CD for $1,000, and holds the CD until maturity, will be required to pay taxes on the following amounts of
ordinary income in respect of the CDs in each year:
YEAR PROJECTED PAYMENTS OID INCOME
2010 NA $1.67
2011 $19.00 $19.00
2012 $19.05 $19.05
2013 $19.00 $19.00
2014 $19.00 $19.00
2015 $19.00 $19.00
2016 $1,019.05 $17.39
However, as described below in “—Adjustments for Differences between the Projected Coupon Payments and the Actual Coupon
Payments,” for any year, the amount of ordinary income that a U.S. Holder will be required to pay taxes on from owning a CD may be
greater or less than the amount specified in the projected payment schedule, depending upon the amount of the actual Coupon Payment
Amount paid and, if the Coupon Payment Amount is less than the amount in the projected payment schedule for any year, a U.S. Holder
could recognize a loss for that year.
A U.S. Holder is generally bound by the comparable yield and the projected payment schedule established by the Issuer for the CDs.
However, if a U.S. Holder believes that the projected payment schedule is unreasonable, a U.S. Holder must set its own projected
payment schedule and explicitly disclose the use of such schedule and the reason therefore on its timely filed U.S. federal income tax
return for the taxable year in which it acquires the CDs.
The comparable yield and projected payment schedule are provided solely to comply with the applicable U.S. federal income tax
regulations in order to determine the amount of OID to be accrued by U.S. Holders of the CDs solely for U.S. federal income tax
purposes and do not constitute our assurances, representations, or expectations as to the actual yield or the Coupon Rate.
Adjustments for Differences between the Projected Coupon Payment Amount and the Actual Coupon Payment Amounts.
If the actual amount of coupon payment amount paid in any taxable year (including upon maturity) differs from the corresponding amount
in the projected payment schedule, adjustments to the U.S. Holder’s OID inclusions in respect of the CDs will be made for the difference.
If the Coupon Payment Amount paid in any taxable year exceeds the corresponding amount in the projected payment schedule, the
excess will be a “positive adjustment,” which is treated as additional OID income. If the actual amount of Coupon Payment Amount paid
in any taxable year is less than the corresponding amount in the projected payment schedule, the deficiency will be a “negative
adjustment” and will be applied first to reduce the OID accrued on the CD for the taxable year in which the Coupon Payment Amount is
paid, and any excess will be treated as an ordinary loss to the extent of the prior net OID inclusions of the U.S. Holder on the CD. Any
such loss will not be subject to the limitations on the deductibility of miscellaneous deductions. Any remaining losses will be carried
forward to future taxable years. Any negative adjustment carryforward on a CD for the taxable year in which the CD is sold, exchanged
or retired will reduce the U.S. Holder's amount realized on the sale, exchange or retirement.
Sale, Exchange, Retirement, Redemption, or Other Disposition of the CDs.
A U.S. Holder of a CD will recognize gain or loss on the sale, exchange, retirement, redemption or other disposition of the CD, to the
extent that the amount realized is more or less than its purchase price, increased by the OID previously accrued by the owner on the CD
determined without regard to any positive or negative adjustments, less the projected amount of any Coupon Payment Amount
previously made on the CDs as reflected in the projected payment schedule, without regard to the actual Coupon Payment Amount paid.
In general, any gain realized by a U.S. Holder on the sale, exchange, retirement, redemption or other disposition of a CD will be treated

22
as ordinary interest income. Any loss recognized on the sale, exchange, retirement, redemption or other disposition of a CD will
generally first offset any OID inclusion for the year of the disposition and thereafter treated as an ordinary loss to the extent of the OID
previously accrued by such U.S. Holder on the CD (taking into account the adjustments described above) that would not be subject to
the limitations on the deductibility of miscellaneous deductions. Any loss in excess of such accrued OID would be treated as a capital
loss. The deductibility of capital losses by U.S. Holders is subject to limitations.
Tax Treatment of Non-U.S. Holders
Taxation of Interest and Disposition of the CDs
In general, Non-U.S. Holders will not be subject to any U.S. federal income or withholding tax on any interest income from a CD so long
as the income or gain is not effectively connected with the conduct by such Non-U.S. Holder of a trade or business within the United
States. Additionally, Non-U.S. Holders will not be subject to any U.S. federal income or withholding tax on any gain on the sale, early
withdrawal, maturity or other dispositions of a CD so long as the income or gain is not effectively connected with the conduct by such
Non-U.S. Holder of a trade or business within the United States and the Non-U.S. Holder is not an individual present in the United States
for 183 days or more in the taxable year in which the gain is recognized.
U.S. Federal Estate Tax Treatment of Non-U.S. Holders
CDs held (or treated as held) by an individual who is a Non-U.S. Holder at the time of his or her death will not be subject to U.S. federal
estate tax, provided that the individual would not be subject to any U.S. federal income or withholding tax with respect to income or gain
on the CDs.
Information Reporting and Backup Withholding
Under certain circumstances, the Code requires “information reporting” annually to the IRS and to each holder of the CDs, and “backup
withholding” with respect to certain payments made on or with respect to the CDs. Information reporting and backup withholding
generally will not apply to U.S. Holders that are corporations or certain other “exempt recipients” if the U.S. Holder provides the Issuer
with a properly completed IRS Form W-9, and will not apply to a Non-U.S. Holder if the Non-U.S. Holder provides the Issuer with a
properly completed Form W-8BEN. Interest paid to a Non-U.S. Holder who is an individual who resides in Canada will be reported on
IRS Form 1042S that is filed with the IRS and sent to the Non-U.S. Holder.
Backup withholding is not an additional tax and may be refunded (or credited against a depositor’s U.S. federal income tax liability, if
any), if certain required information is furnished.
The preceding discussion is only a summary of certain of the tax implications of purchasing the CDs. Prospective depositors
are urged to consult with their own tax advisors prior to purchasing to determine the tax implications of a purchase in light of
that depositor’s particular circumstances.

HSBC Bank USA, National Association Trading & Sales Desk: (212) 525-8010
452 Fifth Ave., New York, NY 10018
23
ANNEX A: DESCRIPTION OF THE REFERENCE SECURITIES
General
These Terms and Conditions are not an offer to sell and it is not an offer to buy interests in the Reference Securities. All disclosures
contained in these Terms and Conditions regarding the Reference Securities are derived from publicly available information. We take no
responsibility for the accuracy or completeness of any information relating to the Reference Securities contained in these Terms and
Conditions.
Below is the quarterly performance of each Reference Security. The Reference Security information contained herein is from Bloomberg
Financial Markets, and we believe such information to be accurate. In addition, information regarding the Reference Issuers may have
been obtained from other sources, including, but not limited to, press releases, newspaper articles and other publicly disseminated
documents. The information contained herein is furnished as a matter of information only. Fluctuations in or levels of the Reference
Securities that have occurred in the past are not necessarily indicative of fluctuations in or closing share prices of the Reference
Securities that may occur over the term of the CDs. Neither the Issuer nor any of its affiliates makes any representation as to the
performance of the Reference Securities.
We urge you to read the section “Information with Respect to the Indices and Shares” on page 4 of the related Base Disclosure
Statement.

24
Banco Bradesco S.A.
Banco Bradesco S.A. attracts deposits and offers commercial banking services. The Bank offers business loans, personal credit,
mortgages, lease financing, mutual funds, securities brokerage, and Internet banking services. Bradesco operates in Brazil and
Argentina, the United States, the Cayman Islands, and the United Kingdom. Bradesco offers credit cards, insurance, and pension funds.
The following table sets forth the quarterly high and low intraday levels, as well as end-of-quarter closing levels, of Banco Bradesco S.A.
for each of the quarters indicated below. We obtained the data in the following table from Bloomberg, LP, without independent
verification by us.
Historical levels of Banco Bradesco S.A. should not be taken as an indication of future performance.
The following graph sets forth the historical levels of Banco Bradesco S.A. using monthly data obtained from Bloomberg, LP.
Historical levels of Banco Bradesco S.A. should not be taken as an indication of future performance.
0
5
10
15
20
25
Oct-04 Oct-05 Oct-06 Oct-07 Oct-08 Oct-09 Oct-10
QUARTER ENDING QUARTERLY
HIGH QUARTERLY
LOW QUARTERLY
CLOSE
September 30, 2004 2.42 1.97 2.42
December 31, 2004 3.49 2.43 3.45
March 31, 2005 4.64 3.01 3.99
June 30, 2005 5.03 3.93 4.87
September 30, 2005 6.79 4.39 6.74
December 30, 2005 9.75 6.35 8.03
March 31, 2006 12.06 8.09 9.89
June 30, 2006 11.08 6.80 8.56
September 29, 2006 9.57 7.69 9.19
December 29, 2006 11.19 9.02 11.12
March 30, 2007 11.69 9.48 11.14
June 29, 2007 14.60 10.86 13.28
September 28, 2007 16.34 10.98 16.18
December 31, 2007 19.62 14.91 17.63
March 31, 2008 18.11 13.09 15.29
June 30, 2008 20.86 15.50 16.91
September 30, 2008 18.17 10.99 13.31
December 31, 2008 13.45 6.12 8.16
March 31, 2009 9.70 6.45 8.18
June 30, 2009 13.32 8.18 12.21
September 30, 2009 16.69 10.88 16.44
December 31, 2009 18.76 15.84 18.07
March 31, 2010 18.50 14.22 16.75
June 30, 2010 17.56 13.79 14.42
September 30, 2010 20.40 14.34 20.38
September 30, 2004 through September 30, 2010 20.86 1.97 20.38
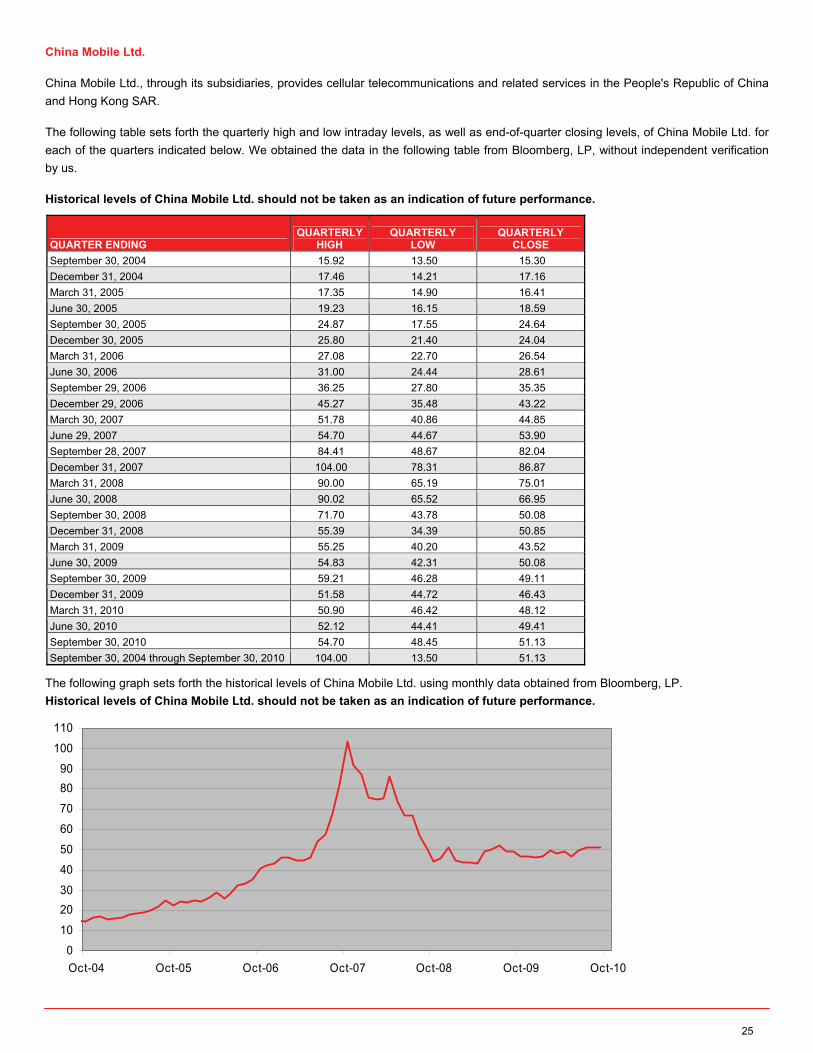
25
China Mobile Ltd.
China Mobile Ltd., through its subsidiaries, provides cellular telecommunications and related services in the People's Republic of China
and Hong Kong SAR.
The following table sets forth the quarterly high and low intraday levels, as well as end-of-quarter closing levels, of China Mobile Ltd. for
each of the quarters indicated below. We obtained the data in the following table from Bloomberg, LP, without independent verification
by us.
Historical levels of China Mobile Ltd. should not be taken as an indication of future performance.
The following graph sets forth the historical levels of China Mobile Ltd. using monthly data obtained from Bloomberg, LP.
Historical levels of China Mobile Ltd. should not be taken as an indication of future performance.
0
10
20
30
40
50
60
70
80
90
100
110
Oct-04 Oct-05 Oct-06 Oct-07 Oct-08 Oct-09 Oct-10
QUARTER ENDING QUARTERLY
HIGH QUARTERLY
LOW QUARTERLY
CLOSE
September 30, 2004 15.92 13.50 15.30
December 31, 2004 17.46 14.21 17.16
March 31, 2005 17.35 14.90 16.41
June 30, 2005 19.23 16.15 18.59
September 30, 2005 24.87 17.55 24.64
December 30, 2005 25.80 21.40 24.04
March 31, 2006 27.08 22.70 26.54
June 30, 2006 31.00 24.44 28.61
September 29, 2006 36.25 27.80 35.35
December 29, 2006 45.27 35.48 43.22
March 30, 2007 51.78 40.86 44.85
June 29, 2007 54.70 44.67 53.90
September 28, 2007 84.41 48.67 82.04
December 31, 2007 104.00 78.31 86.87
March 31, 2008 90.00 65.19 75.01
June 30, 2008 90.02 65.52 66.95
September 30, 2008 71.70 43.78 50.08
December 31, 2008 55.39 34.39 50.85
March 31, 2009 55.25 40.20 43.52
June 30, 2009 54.83 42.31 50.08
September 30, 2009 59.21 46.28 49.11
December 31, 2009 51.58 44.72 46.43
March 31, 2010 50.90 46.42 48.12
June 30, 2010 52.12 44.41 49.41
September 30, 2010 54.70 48.45 51.13
September 30, 2004 through September 30, 2010 104.00 13.50 51.13

26
Duke Energy Corp.
Duke Energy Corp. is an energy company located primarily in the Americas that owns an integrated network of energy assets. The
Company manages a portfolio of natural gas and electric supply, delivery, and trading businesses in the United States and Latin
America.
The following table sets forth the quarterly high and low intraday levels, as well as end-of-quarter closing levels, of Duke Energy Corp.
for each of the quarters indicated below. We obtained the data in the following table from Bloomberg, LP, without independent
verification by us.
Historical levels of Duke Energy Corp. should not be taken as an indication of future performance.
The following graph sets forth the historical levels of Duke Energy Corp. using monthly data obtained from Bloomberg, LP.
Historical levels of Duke Energy Corp. should not be taken as an indication of future performance.
12
14
16
18
20
22
Oct-04 Oct-05 Oct-06 Oct-07 Oct-08 Oct-09 Oct-10
QUARTER ENDING QUARTERLY
HIGH QUARTERLY
LOW QUARTERLY
CLOSE
September 30, 2004 13.39 11.55 13.33
December 31, 2004 15.23 13.30 14.75
March 31, 2005 16.42 14.19 16.31
June 30, 2005 17.45 15.92 17.31
September 30, 2005 17.79 16.21 16.98
December 30, 2005 17.09 14.59 15.98
March 31, 2006 17.33 15.94 16.97
June 30, 2006 17.38 15.68 17.10
September 29, 2006 18.04 16.79 17.58
December 29, 2006 19.99 17.62 19.34
March 30, 2007 20.62 18.40 20.29
June 29, 2007 21.23 18.06 18.30
September 28, 2007 19.90 16.91 18.69
December 31, 2007 20.78 18.25 20.17
March 31, 2008 20.59 17.00 17.85
June 30, 2008 19.20 17.02 17.38
September 30, 2008 19.10 16.77 17.43
December 31, 2008 17.99 13.50 15.01
March 31, 2009 15.96 11.72 14.32
June 30, 2009 14.76 13.31 14.59
September 30, 2009 16.01 14.10 15.74
December 31, 2009 17.93 15.33 17.21
March 31, 2010 17.28 16.02 16.32
June 30, 2010 17.14 15.47 16.00
September 30, 2010 18.07 15.87 17.71
September 30, 2004 through September 30, 2010 21.23 11.55 17.71

27
Encana Corp.
Encana Corp. explores for, develops, produces, and markets natural gas, crude oil, and natural gas liquids. The Company operates in
North and South America.
The following table sets forth the quarterly high and low intraday levels, as well as end-of-quarter closing levels, Encana Corp. for each
of the quarters indicated below. We obtained the data in the following table from Bloomberg, LP, without independent verification by us.
Historical levels of Encana Corp. should not be taken as an indication of future performance.
The following graph sets forth the historical levels of Encana Corp. since inception with data obtained from Bloomberg, LP.
Historical levels of Encana Corp. should not be taken as an indication of future performance.
10
20
30
40
50
Oct-04 Oct-05 Oct-06 Oct-07 Oct-08 Oct-09 Oct-10
QUARTER ENDING QUARTERLY
HIGH QUARTERLY
LOW QUARTERLY
CLOSE
September 30, 2004 12.55 10.69 12.39
December 31, 2004 15.36 12.33 15.27
March 31, 2005 19.50 14.15 18.84
June 30, 2005 22.23 16.76 21.19
September 30, 2005 31.30 21.02 31.20
December 30, 2005 32.00 22.48 24.17
March 31, 2006 26.78 21.17 25.01
June 30, 2006 28.74 23.56 28.17
September 29, 2006 29.93 23.18 24.99
December 29, 2006 28.84 22.88 24.59
March 30, 2007 27.55 23.44 27.09
June 29, 2007 35.78 27.10 32.88
September 28, 2007 34.88 29.50 33.10
December 31, 2007 40.59 32.57 36.37
March 31, 2008 42.67 31.11 40.54
June 30, 2008 53.16 39.69 48.66
September 30, 2008 50.52 32.82 35.17
December 31, 2008 34.20 18.19 24.87
March 31, 2009 28.79 18.98 21.73
June 30, 2009 31.22 21.28 26.47
September 30, 2009 32.08 23.55 30.83
December 31, 2009 33.82 27.20 32.39
March 31, 2010 35.63 29.31 31.03
June 30, 2010 35.25 28.28 30.34
September 30, 2010 34.03 26.02 30.23
September 30, 2004 through September 30, 2010 53.16 10.69 30.23

28
Goldcorp Inc.
Goldcorp Inc. is a North American gold producer. The Company has gold mining operations in the United States, Canada, Mexico,
Brazil, Argentina, and Australia. Goldcorp owns the Red Lake mine in Ontario.
The following table sets forth the quarterly high and low intraday levels, as well as end-of-quarter closing levels, Goldcorp Inc. for each of
the quarters indicated below. We obtained the data in the following table from Bloomberg, LP, without independent verification by us.
Historical levels of Goldcorp Inc. should not be taken as an indication of future performance.
The following graph sets forth the historical levels of Goldcorp Inc. since inception with data obtained from Bloomberg, LP.
Historical levels of Goldcorp Inc. should not be taken as an indication of future performance.
10
20
30
40
50
Oct-04 Oct-05 Oct-06 Oct-07 Oct-08 Oct-09 Oct-10
QUARTER ENDING QUARTERLY
HIGH QUARTERLY
LOW QUARTERLY
CLOSE
September 30, 2004 13.94 10.93 13.86
December 31, 2004 15.79 13.02 15.04
March 31, 2005 15.51 12.90 14.21
June 30, 2005 16.09 12.04 15.78
September 30, 2005 21.06 15.01 20.04
December 30, 2005 22.78 17.49 22.28
March 31, 2006 30.24 23.06 29.25
June 30, 2006 41.66 24.07 30.22
September 29, 2006 31.59 21.64 23.60
December 29, 2006 31.47 20.35 28.44
March 30, 2007 29.20 23.01 24.02
June 29, 2007 26.93 22.36 23.69
September 28, 2007 30.99 21.00 30.56
December 31, 2007 37.70 29.25 33.93
March 31, 2008 46.30 31.86 38.75
June 30, 2008 47.75 33.83 46.17
September 30, 2008 52.60 24.73 31.63
December 31, 2008 33.84 13.99 31.53
March 31, 2009 35.47 23.03 33.32
June 30, 2009 40.75 26.72 34.75
September 30, 2009 43.32 31.84 40.37
December 31, 2009 46.23 35.47 39.34
March 31, 2010 43.55 32.85 37.22
June 30, 2010 47.40 37.71 43.85
September 30, 2010 45.22 38.07 43.52
September 30, 2004 through September 30, 2010 52.60 10.93 43.52

29
Home Depot Inc.
Home Depot Inc. is a home improvement retailer that sells building materials and home improvement products. The Company's sell a
wide assortment of building materials, home improvement and lawn and garden products and provide a number of services. Home
Depot Inc. operates throughout the U.S. (including Puerto Rico, the Virgin Islands and Guam), Canada, China, and Mexico.
The following table sets forth the quarterly high and low intraday levels, as well as end-of-quarter closing levels, of Home Depot Inc. for
each of the quarters indicated below. We obtained the data in the following table from Bloomberg, LP, without independent verification
by us.
Historical levels of Home Depot Inc. should not be taken as an indication of future performance.
The following graph sets forth the historical levels of Home Depot Inc. using monthly data obtained from Bloomberg, LP.
Historical levels of Home Depot Inc. should not be taken as an indication of future performance.
20
25
30
35
40
45
Oct-04 Oct-05 Oct-06 Oct-07 Oct-08 Oct-09 Oct-10
QUARTER ENDING QUARTERLY
HIGH QUARTERLY
LOW QUARTERLY
CLOSE
September 30, 2004 39.72 32.40 39.20
December 31, 2004 44.30 38.31 42.74
March 31, 2005 43.26 37.44 38.24
June 30, 2005 40.80 34.56 38.90
September 30, 2005 43.97 37.20 38.14
December 30, 2005 43.25 37.52 40.48
March 31, 2006 43.94 38.50 42.30
June 30, 2006 42.91 35.63 35.79
September 29, 2006 37.63 32.85 36.27
December 29, 2006 40.37 35.55 40.16
March 30, 2007 42.01 36.35 36.74
June 29, 2007 41.19 36.60 39.35
September 28, 2007 41.01 31.85 32.44
December 31, 2007 34.55 25.57 26.94
March 31, 2008 31.08 23.77 27.97
June 30, 2008 30.50 23.32 23.42
September 30, 2008 30.74 20.76 25.89
December 31, 2008 26.08 17.05 23.02
March 31, 2009 25.49 17.52 23.56
June 30, 2009 27.07 22.33 23.63
September 30, 2009 28.44 22.29 26.64
December 31, 2009 29.44 24.47 28.93
March 31, 2010 32.98 27.19 32.35
June 30, 2010 37.02 27.99 28.07
September 30, 2010 32.22 26.62 31.68
September 30, 2004 through September 30, 2010 44.30 17.05 31.68

30
Honda Motor Co. Ltd.
Honda Motor Co. Ltd. develops, manufactures, and distributes motorcycles, automobiles, and power products such as generators and
farm machinery. The Company also operates a financial credit business. Honda Motor Co. Ltd. has manufacturing facilities in the US,
Canada, the UK, France, Italy, Spain, Brazil, Mexico, India, and Thailand.
The following table sets forth the quarterly high and low intraday levels, as well as end-of-quarter closing levels, of Honda Motor Co. Ltd.
for each of the quarters indicated below. We obtained the data in the following table from Bloomberg, LP, without independent
verification by us.
Historical levels of Honda Motor Co. Ltd. should not be taken as an indication of future performance.
The following graph sets forth the historical levels of Honda Motor Co. Ltd. using monthly data obtained from Bloomberg, LP.
Historical levels of Honda Motor Co. Ltd. should not be taken as an indication of future performance.
20
25
30
35
40
Oct-04 Oct-05 Oct-06 Oct-07 Oct-08 Oct-09 Oct-10
QUARTER ENDING QUARTERLY
HIGH QUARTERLY
LOW QUARTERLY
CLOSE
September 30, 2004 25.40 22.56 24.36
December 31, 2004 26.10 23.55 26.06
March 31, 2005 27.30 24.92 25.04
June 30, 2005 26.00 23.75 24.61
September 30, 2005 29.08 24.06 28.40
December 30, 2005 29.70 26.50 28.97
March 31, 2006 31.74 27.10 30.96
June 30, 2006 37.95 29.13 31.82
September 29, 2006 34.31 29.43 33.63
December 29, 2006 39.87 34.01 39.54
March 30, 2007 40.82 34.64 34.87
June 29, 2007 36.59 33.30 36.29
September 28, 2007 37.80 31.30 33.36
December 31, 2007 37.64 32.15 33.14
March 31, 2008 33.61 27.01 28.81
June 30, 2008 36.29 27.69 34.03
September 30, 2008 35.60 28.22 30.11
December 31, 2008 30.06 17.35 21.34
March 31, 2009 25.58 20.28 23.70
June 30, 2009 30.96 24.84 27.37
September 30, 2009 32.93 25.00 30.31
December 31, 2009 34.52 28.82 33.90
March 31, 2010 37.23 33.27 35.29
June 30, 2010 36.16 28.33 28.75
September 30, 2010 35.87 28.43 35.59
September 30, 2004 through September 30, 2010 40.82 17.35 35.59
31
Lorillard Inc.
Lorillard Inc. manufactures and sells cigarettes. The Company produces cigarettes for both the premium and discount segments of the
domestic cigarette market for sale to distributors and retailers in the United States.
The following table sets forth the quarterly high and low intraday levels, as well as end-of-quarter closing levels, of Lorillard Inc. for each
of the quarters indicated below. We obtained the data in the following table from Bloomberg, LP, without independent verification by us.
Historical levels of Lorillard Inc. should not be taken as an indication of future performance.
The following graph sets forth the historical levels of Lorillard Inc. using quarterly data obtained from Bloomberg, LP.
Historical levels of Lorillard Inc. should not be taken as an indication of future performance.
55
60
65
70
75
80
85
Jun-08 Oct-08 Feb-09 Jun-09 Oct-09 Feb-10 Jun-10 Oct-10
QUARTER ENDING QUARTERLY
HIGH QUARTERLY
LOW QUARTERLY
CLOSE
June 30, 2008 79.00 66.77 69.16
September 30, 2008 77.14 62.76 71.15
December 31, 2008 71.91 53.30 56.35
March 31, 2009 67.00 52.51 61.74
June 30, 2009 69.94 58.73 67.77
September 30, 2009 78.57 66.46 74.30
December 31, 2009 81.76 73.61 80.23
March 31, 2010 81.74 72.09 75.24
June 30, 2010 82.06 70.80 71.98
September 30, 2010 83.02 70.87 80.31
June 30, 2008 through September 30, 2010 83.02 52.51 80.31

32
Novartis AG
Novartis AG manufactures pharmaceutical and consumer healthcare products. The Company produces pharmaceuticals for
cardiovascular, respiratory and infectious diseases; oncology, neuroscience, transplantation, dermatology, gastrointestinal and urinary
conditions, and arthritis; vaccines and diagnostics; vision, and animal health products.
The following table sets forth the quarterly high and low intraday levels, as well as end-of-quarter closing levels, of Novartis AG for each
of the quarters indicated below. We obtained the data in the following table from Bloomberg, LP, without independent verification by us.
Historical levels of Novartis AG should not be taken as an indication of future performance.
The following graph sets forth the historical levels of Novartis AG using monthly data obtained from Bloomberg, LP.
Historical levels of Novartis AG should not be taken as an indication of future performance.
35
40
45
50
55
60
65
Oct-05 Oct-06 Oct-07 Oct-08 Oct-09 Oct-10
QUARTER ENDING QUARTERLY
HIGH QUARTERLY
LOW QUARTERLY
CLOSE
September 30, 2004 47.82 43.21 46.67
December 31, 2004 50.77 45.26 50.54
March 31, 2005 50.99 46.69 46.78
June 30, 2005 50.00 45.64 47.44
September 30, 2005 51.10 46.67 51.00
December 30, 2005 54.71 50.69 52.48
March 31, 2006 56.90 52.49 55.44
June 30, 2006 58.57 51.72 53.92
September 29, 2006 58.98 53.27 58.44
December 29, 2006 61.60 56.96 57.44
March 30, 2007 60.36 54.33 54.63
June 29, 2007 59.15 54.34 56.07
September 28, 2007 56.69 51.19 54.96
December 31, 2007 57.90 51.40 54.31
March 31, 2008 59.16 46.69 51.23
June 30, 2008 55.46 46.20 55.04
September 30, 2008 61.30 51.62 52.84
December 31, 2008 54.35 41.81 49.76
March 31, 2009 49.82 33.35 37.83
June 30, 2009 42.43 35.21 40.79
September 30, 2004 through September 30, 2010 61.60 33.35 57.67

33
Toronto-Dominion Bank Toronto-Dominion Bank conducts a general banking business through banking branches and offices located throughout Canada and
overseas. The Bank and other subsidiaries offer a broad range of banking, advisory services, and discount brokerage to individuals,
businesses, financial institutions, governments, and multinational corporations.
The following table sets forth the quarterly high and low intraday levels, as well as end-of-quarter closing levels, of Toronto-Dominion
Bank for each of the quarters indicated below. We obtained the data in the following table from Bloomberg, LP, without independent
verification by us.
Historical levels Toronto-Dominion Bank should not be taken as an indication of future performance.
The following graph sets forth the historical levels of Toronto-Dominion Bank using monthly data obtained from Bloomberg, LP.
Historical levels of Toronto-Dominion Bank should not be taken as an indication of future performance.
25
35
45
55
65
75
Oct-04 Oct-05 Oct-06 Oct-07 Oct-08 Oct-09 Oct-10
QUARTER ENDING QUARTERLY
HIGH QUARTERLY
LOW QUARTERLY
CLOSE
September 30, 2004 36.76 31.94 36.29
December 31, 2004 41.69 36.50 41.68
March 31, 2005 41.93 38.74 41.35
June 30, 2005 45.58 39.57 44.61
September 30, 2005 50.12 43.75 49.32
December 30, 2005 53.15 46.50 52.70
March 31, 2006 58.05 51.49 55.70
June 30, 2006 57.42 49.84 50.77
September 29, 2006 60.26 49.52 59.14
December 29, 2006 60.57 55.31 59.87
March 30, 2007 61.45 57.14 60.41
June 29, 2007 70.26 59.43 68.49
September 28, 2007 77.45 59.43 76.68
December 31, 2007 77.08 64.87 69.95
March 31, 2008 69.94 59.04 61.35
June 30, 2008 72.50 60.78 62.27
September 30, 2008 64.51 52.52 60.99
December 31, 2008 60.10 30.43 35.87
March 31, 2009 39.61 25.86 34.58
June 30, 2009 53.75 33.34 51.71
September 30, 2009 65.29 47.52 64.45
December 31, 2009 64.92 56.60 62.72
March 31, 2010 75.45 57.80 74.58
June 30, 2010 77.57 64.40 64.91
September 30, 2010 74.84 62.92 72.26
September 30, 2004 through September 30, 2010 77.57 25.86 72.26

34
Total SA Total SA explores for, produces, refines, transports, and markets oil and natural gas. The Company also operates a chemical division
which produces polypropylene, polyethylene, polystyrene, rubber, paint, ink, adhesives, and resins. Total SA operates gasoline filling
stations in Europe, the United States, and Africa.
The following table sets forth the quarterly high and low intraday levels, as well as end-of-quarter closing levels, of Total SA for each of
the quarters indicated below. We obtained the data in the following table from Bloomberg, LP, without independent verification by us.
Historical levels Total SA should not be taken as an indication of future performance.
The following graph sets forth the historical levels of Total SA using monthly data obtained from Bloomberg, LP.
Historical levels of Total SA should not be taken as an indication of future performance.
40
50
60
70
80
90
Oct-04 Oct-05 Oct-06 Oct-07 Oct-08 Oct-09 Oct-10
QUARTER ENDING QUARTERLY
HIGH QUARTERLY
LOW QUARTERLY
CLOSE
September 30, 2004 51.93 46.02 50.26
December 31, 2004 54.39 49.88 54.03
March 31, 2005 60.38 51.03 57.67
June 30, 2005 59.01 53.33 57.48
September 30, 2005 67.86 57.66 66.81
December 30, 2005 66.49 58.79 62.18
March 31, 2006 68.63 60.53 64.80
June 30, 2006 71.10 58.06 65.52
September 29, 2006 69.73 62.23 65.94
December 29, 2006 73.46 63.71 71.92
March 30, 2007 72.54 63.89 69.78
June 29, 2007 81.55 69.57 80.98
September 28, 2007 87.34 68.02 81.03
December 31, 2007 84.46 76.66 82.60
March 31, 2008 86.90 67.14 74.01
June 30, 2008 91.34 73.11 85.27
September 30, 2008 83.99 57.22 60.68
December 31, 2008 60.90 42.67 55.30
March 31, 2009 57.85 42.88 49.06
June 30, 2009 59.92 45.03 54.23
September 30, 2009 62.43 49.78 59.26
December 31, 2009 65.98 57.06 64.04
March 31, 2010 67.52 54.02 58.02
June 30, 2010 60.24 43.20 44.64
September 30, 2010 54.10 44.44 51.60
September 30, 2004 through September 30, 2010 91.34 42.67 51.60

35
Unilever NV
Unilever NV manufactures branded and packaged consumer goods, including food, detergents, fragrances, home and personal care
products.
The following table sets forth the quarterly high and low intraday levels, as well as end-of-quarter closing levels, of Unilever NV for each
of the quarters indicated below. We obtained the data in the following table from Bloomberg, LP, without independent verification by us.
Historical levels of Unilever NV should not be taken as an indication of future performance.
The following graph sets forth the historical levels of Unilever NV using monthly data obtained from Bloomberg, LP.
Historical levels of Unilever NV should not be taken as an indication of future performance.
10
15
20
25
30
35
40
Oct-04 Oct-05 Oct-06 Oct-07 Oct-08 Oct-09 Oct-10
QUARTER ENDING QUARTERLY
HIGH QUARTERLY
LOW QUARTERLY
CLOSE
September 30, 2004 22.83 19.00 19.27
December 31, 2004 22.39 18.79 22.24
March 31, 2005 22.97 20.77 22.81
June 30, 2005 23.00 21.33 21.61
September 30, 2005 24.16 21.14 23.82
December 30, 2005 24.23 22.13 22.88
March 31, 2006 23.86 22.64 23.07
June 30, 2006 24.46 20.65 22.55
September 29, 2006 24.92 21.71 24.54
December 29, 2006 27.49 24.08 27.25
March 30, 2007 29.33 24.94 29.22
June 29, 2007 32.39 28.63 31.02
September 28, 2007 33.73 28.11 30.85
December 31, 2007 37.21 30.09 36.46
March 31, 2008 37.18 30.07 33.73
June 30, 2008 34.53 27.90 28.40
September 30, 2008 30.36 26.81 28.16
December 31, 2008 28.76 21.27 24.55
March 31, 2009 25.25 16.91 19.60
June 30, 2009 25.48 18.47 24.18
September 30, 2009 28.97 23.77 28.86
December 31, 2009 33.01 28.00 32.33
March 31, 2010 33.09 28.35 30.16
June 30, 2010 31.32 26.03 27.32
September 30, 2010 31.03 26.23 29.88
September 30, 2004 through September 30, 2010 37.21 16.91 29.88

36