HSBC Bank Egypt S.A - about.hsbc.com.eg · HSBC Bank Egypt S.A.E. Annual Report and Accounts 2016....
64
HSBC Bank Egypt S.A.E. Annual Report and Accounts 2016
Transcript of HSBC Bank Egypt S.A - about.hsbc.com.eg · HSBC Bank Egypt S.A.E. Annual Report and Accounts 2016....

HSBC Bank Egypt S.A.E.Annual Report and Accounts 2016

HSBC Bank Egypt SAE’s ultimate parent company is HSBC Holdings plc. Headquartered in London, the HSBC Group is one of the world’s largest banking and financial services organisations and one of the world’s most valuable brands.
The HSBC Group has an international network of over 4,000 offices in 70 countries and territories around the world with listings on the London, Hong Kong, New York, Paris and Bermuda stock exchanges.
HSBC provides a comprehensive range of banking products and services to meet the financial needs of over 37 million customers through its global businesses: Retail Banking and Wealth Management, Commercial Banking, Global Banking and Markets, and Global Private Banking.
Annual Report and Accounts 2016

Jacques-Emmanuel Blanchet, Deputy Chairman and CEO
Abdel-Halim Assem
Dr Ziad Bahaa-Eldin
Sir Sherard Cowper-Coles
Georges Elhedery
Neveen El-Shafei
Hisham Mohsen
Hania Sadek
Nevine Taher
Board of DirectorsThe Shareholders of HSBC Bank Egypt SAE

Report of the Directors 3
Board of Directors 9
Auditors’ Report 13
Balance Sheet 14
Income Statement 15
Cash Flow Statement 16
Changes in the Shareholders' Equity Statement 18
Appropriation Account 19
Notes on the Accounts 20
HSBC Bank Egypt Head Office and Branches 60
HSBC Bank Egypt SAE 306 Corniche El Nil, Maadi, Cairo, Egypt Telephone: +20(2) 2529 8000 Facsimile: +20(2) 2529 8080 Website: www.hsbc.com.eg
Contents

Report of the DirectorsThe Board of Directors has the pleasure of presenting the Annual Report of HSBC Bank Egypt SAE for the year ended 31 December 2016
Economic review and future outlookThe Egyptian economy experienced a markedly difficult year in 2016, weighed down by sharp foreign exchange (FX) shortages, weak trade and tourism flows. However, a broad-range of economic reforms – including FX liberalisation– which were undertaken towards the end of the year with the support of the IMF point to a more positive, yet difficult, road ahead.
Despite a Cabinet reshuffle early in the year and stated commitments towards reform, Egypt experienced a policy stasis through the bulk of the year.
During the first ten months of 2016, the Central Bank of Egypt (CBE) maintained heavy controls on access to foreign currency, allowing the Egyptian pound to fall against the USD only once in March 2016. As a consequence, foreign currency remained in acutely short supply weighing heavily on growth. Egypt’s Purchasing Manager Index held sub-50 through this period, indicating continuous contraction in economic activity. The FX shortage also led to further EGP weakness on the illegal parallel market. This in turn fed through into higher inflation, which climbed from 11 per cent to 14 per cent during the first six months of the year. To combat the inflationary pressures, the Central Bank maintained tight monetary policy despite the weak growth outlook, hiking interest rates 150bps in March and 100bps again in June.
The overvalued currency also added further strain on the external position, discouraging foreign inflows and inflating the trade imbalance. Egypt’s current account deficit widened to a record high of USD5.7 billion in March as exports remained subdued and tourism receipts continued to contract. FX reserves meanwhile edged down to a 16-month low of USD15.5 billion in July, covering less than 3 months of imports as support from the Gulf Corporation Council (GCC) dwindled.
However, from August 2016, economic policy and outlook experienced a positive shift when the Egyptian government announced a staff level agreement with the IMF for a three-year USD12 billion Extended Fund Facility, which was then ratified in November.
The agreement brought in much needed financial support from the IMF as well as other multilateral agencies and allies, leading FX reserves to rise to almost USD25 billion by the end of 2016 –their highest level in five years. It also prodded long-anticipated FX liberalisation in November, when the Central Bank allowed the exchange rate to fall by 40 per cent in one day while reducing its control
over the currency. The reform drive has also included steps to curb the fiscal deficit –such as cuts to electricity subsidies in August and the passing of the much-awaited Value-Added Tax (VAT) law in September– in addition to structural changes to boost the role of the private sector, overhaul the labour market, and encourage exports and investment.
While the policy mix laid out by authorities opens the way for economic stabilisation and eventual recovery, the economic turnaround is unlikely to be quick or painless in the near term. The large FX adjustment and fiscal reforms pushed inflation above 23 per cent by the end of 2016, which should keep monetary policy tight, and along with still weak trade and tourism, dampen the growth outlook for 2017.
Business and operational activitiesFor the financial year ending 31 December 2016, the Bank reported profit before tax of EGP4,494.7 million, which is a 35 per cent increase over 2015. Profit after tax rose by 37 per cent, reaching EGP3,478.2 million.
Between 31 December 2015 and 31 December 2016, the Bank’s total deposits increased by 37 per cent, while the total advances to clients increased by 40 per cent – derived from local currency devaluation.
The Board of Directors proposed a ‘full year’ distribution to shareholders, of EGP2,080 million (60 per cent of the profits available for distribution for 2016) representing a coupon for 2016 of EGP62.50 per share.
In line with legal requirements, the Board of Directors also proposed a ‘full year’ distribution of EGP339 million (9.78 per cent of the profits available for distribution for 2016) to the bank employees as a performance-linked variable payment, which includes profit sharing.
The balance of the remaining profits, amounting to EGP1,047.9 million, will be transferred to support the Bank’s reserves and retained earnings, allocating EGP173.4 million for the legal reserve, EGP181.1 million for the general reserve and EGP693.4 will remain as retained earnings.
3
4
Global Banking and Markets (GBM)GBM provides tailored financial solutions to major government, corporate and institutional clients worldwide. The business is managed as three principal business lines: banking, capital financing and markets. This structure allows the HSBC Group to focus on relationships and sectors that best fit the Group’s footprint and facilitates seamless delivery of HSBC’s products and services to clients.
GBM continues to pursue its well-established ‘emerging markets-led and financing-focused’ strategy in Egypt. This strategy has evolved to include a greater emphasis on connectivity, leveraging the Group’s extensive distribution network. The business focuses on four strategic imperatives:
• Reinforcing client coverage and client-led solutions for major government, corporate and institutional clients
• Continuing to invest selectively in the business to support the delivery of an integrated suite of products and services
• Enhancing collaboration with other global businesses, particularly Commercial Banking (CMB), to appropriately service the needs of the international client base
• Focusing on business re-engineering to optimise operational efficiency and reduce costs
As a universal bank with a distinctive international network and business model, we have provided innovative solutions to multinational corporates operating in Egypt. Global Banking’s product expertise supports our clients in the growth of their business activities, especially through our leadership in Payments and Cash Management.
We also delivered a broad range of products in several transactions relating to resource and energy companies. During the past 12-month period, the Bank led some of the Egyptian market’s landmark transactions in the power, oil and gas, and telecom sectors.
We remain focused on opportunities in the Project and Export Finance space, which will benefit as Egypt pursues economic growth through infrastructure investment.
Implementing Global Standards, enhancing risk management controls and simplifying processes also remain top priorities for GBM.
The Global Market structure; which consists of Corporate Sales, Balance Sheet and Fixed Income; aims to leverage our relationship, brand and expertise to become the most active player in providing treasury products and solutions to corporate clients in the Egyptian market. The bank is also considered as one of the main primary dealers, servicing a wide range of customers through secondary and primary sovereign debt market.
HSBC Securities Egypt (HCES)HCES’ core business is trading cash equities listed on the Egyptian stock exchange on behalf of HSBC’s international investors and asset management firms. HCES is focused on the foreign institutional investor segment in the market and was able to be within the top five brokerage firms in the market serving foreign institutional investors. The past couple of years were tough years for financial markets in Egypt and in particular for foreign institutional interest given the foreign currency challenges that persisted. However with the FX regime change introduced in early November 2016, market volumes more than doubled and the EGX30 index increased by 45 per cent reaching record highs. In 2016, the split between institutional
and retail investors within the market was 60 per cent and 40 per cent respectively and the share of foreign institutional investors reached 17.5 per cent.
HCES underwent a restructure in order to reduce costs and to create an economically viable model that suits the challenging conditions within the Egyptian equity capital markets. The restructure was complete in December 2016 and operating costs were reduced by approximately 30 per cent.
Looking ahead to 2017, with the improved market conditions and the lighter cost structure in place, HCES is now well positioned to return to profit generation.
Commercial Banking (CMB)In 2016, while striving to lead the International Commercial Banking franchise in the Egyptian market, CMB has undergone fundamental changes in its business model to:
• Enable Relationship Managers to maximize revenues while embedding Global Standard to become a second nature
• Restructure balance sheet and revenues to a reduce vulnerability to eco-political conditions, by focusing on Long term, LCY based assets that enhance product revenue and Non-Funded Income (NFI)
• Promote risk management controls and simplify procedures and processes
• Provide customers with the appropriate channels to voice their complaints, feedback and contact us with any queries; ultimately leading to strengthen our relationship with our clients.
Commercial Banking’s portfolio has been restructured with Middle Markets, large Corporates and International Subsidiary Business operating under the umbrella of Client Coverage Team, whilst the remaining portfolio which aims at supporting the Small and Medium Enterprises (SME) and IRM falls under the Business Banking portfolio.
The two segments aim to:
• Attract ‘new-to-bank’ customers as we strengthen our service proposition
• Grow portfolio with a focus of growing Risk Weighted Assets (RWA) of customers outside the top 50 Master group list
• Support our existing customers in their domestic and overseas business by connecting to colleagues within the wider HSBC Group
• Support our customers with our industry-leading capabilities in Global Trade and Receivables Finance (GTRF) to help finance their trade requirements and capitalize on our international network
• Provide unique solutions, through our award-winning Global Liquidity and Cash Management (GLCM) business, to the market to assist our customers in streamlining their operations through the use of electronic banking platform
• Reinforce the bank’s position with the customers as a strategic partner by providing the appropriate products and services to assist our customers in meeting their aspirations.
To assist in realizing the CMB strategy, we have revised and simplified our business by making our teams more accessible for our customers through:
• Launching new support functions to assist in handling all types of customers’ requirements, whether for the day-to-day queries (Client Service Team – CST), assisting in fulfilling

5
‘Know Your Customers’ (KYC) requirements (Client Due Diligence Team – CDD) and/or managing credit aspect of the relationship as handled by the Client Support Team- CSU
• Focusing on branch rationalization driven by automation, migration and streamlining of processes
• Re-engineering and streamlining of processes to enhance servicing capabilities and facilitate business
• Re-structuring of GTRF which will result in feeding into improved customer experience and efficiency, being a vital.
With our unique product offering, strong local and international presence and resilient Relationship Managers and Client Management Office; we believe we are well positioned to realize our 2017 ambitions in terms of strategically partnering with our customers, while promoting the right means of doing so.
Retail Banking and Wealth Management (RBWM)HSBC Retail Banking and Wealth Management continues to focus on enriching customers’ lives by providing premium quality banking services to enable our clients manage their day-to-day finances and savings with a comprehensive range of services worldwide. In Egypt, we are proud to offer a wide range of financial services to our customers through our network of 58 branches, our state of the art internet and mobile banking platforms and call center; in addition to our fleet of 216 Automatic Teller Machines (ATMs).
Despite the material challenges and the dynamic market changes, 2016 was a prosperous year for Retail Banking and Wealth Management. HSBC was able to grow its liabilities portfolio and position itself as one of best banks, offering rewards on customer investment on most of the products offered. The pricing adjustments carried out this year ensured we provided our customers with a fair value on their savings and adjusted to market conditions.
To meet our customers’ needs, we offer credit facilities to assist them in their short and longer-term borrowing requirements. Our products are closely reviewed and continuously modified to best meet our customers’ needs, while complying with Central Bank of Egypt and our internal standards.
Several initiatives were rolled out aiming at better serving our customers. Offers were launched to partner companies’ employees, enabling them to switch their payroll from other Banks to HSBC and enjoy a wide range of benefits. HSBC also participated in a Master Card National Spend initiative, among 8 other banks sponsoring the campaign, supported by an attractive activation plan at major shopping malls and hypermarkets.
Building up on HSBC’s position in Wealth Management - where the Bank delivers full financial planning review for high net worth clients in their retirement, protection, management or growth needs - we proudly announced in December 2016 the extension of this proposition to all our customers’ segments.
To retain its leading position in the market, HSBC continues to invest in its digital platform. A new online banking service has been launched, enabling a consistent experience worldwide for our customers. This also sets the base for simplification of our processes at the back-end for the Bank.
One of the main pillars for supporting our growth strategy is streamlining our systems and processes by removing inefficiencies, reducing turn-around time and reducing overall costs. Several projects were initiated to eliminate some administrative tasks undertaken by frontline staff and free them to better focus on satisfying clients’ needs.
In line with our strategy, we have continued to invest in our network to ensure full utilisation of our resources. In line with this, Hacienda branch has been reopened as a seasonal branch. This is in addition to the branches’ renovation project carried out in 2016 to maintain our high quality standards.
In all our initiatives, customer experience has been at the forefront; and we are aiming at delivering a premium service. In 2016, we continued to deliver on “Project Promise”, focusing on some defined products/services. Under this program, we commit to delivering our customers with the requested product in 48 hours.
HSBC Egypt Facebook page has been launched in 2016 and is following our ‘Supporting Human Ambition’ communication plan.
HSBC aims to set the industry standard for knowing our customers and detecting, deterring and protecting against financial crime. Safeguarding the business is a prime area of focus through, effectively, managing financial crime risk and protecting our customers. We progressed in 2016 by introducing new systems and processes, complying with the local regulation and also fulfilling HSBC’s Global Standards.
People management and developmentThe Human Resources (HR) agenda for HSBC Bank Egypt is at the centre of our priorities. Our strategy focuses on revitalizing our workforce while supporting the up-skilling of people capabilities within an overarching employee engagement strategy and a commercial proposition that supports our business objectives, values and growth.
2016 training agenda was mainly driven by profound focus on financial crime compliance learning tailored per business and function to drive the required mindset and support organization-wide objectives. The training agenda also included the deployment of the largest most impactful training event which covered circa 1600 employees constituting 85 per cent of the bank’s overall population. The objective of this training was to instill the right culture, behaviors and values’ mindset across the entire organization; and to strike the required balance of enhancing employees’ soft skills.
HR commerciality agenda in 2016 aimed to bring HR closer to employees and to create various feedback forums. This included roadshows covering various premises. The branch network, as well, is designed to provide required support and guidance on People’s Agenda in the context of the available tools and under guidance and support of their line managers; while establishing further HR communication channels in the form of direct periodic connectivity with the different businesses through such roadshows.
Employee wellbeing continues to be a global priority for Human Resources. Accordingly, 2016 witnessed the launch of wellbeing sessions that hosted specialized health and medical practitioners to raise employee awareness on predominant health matters.
The employee engagement agenda has been rebranded to capitalize on engaging employees through networking and supporting work/life balance.
Furthermore, a wide spectrum of career opportunities has been made available internally and globally through mobility initiatives within a cohort of over 400 employees who have experienced career development moves into new roles.

6
In our pursuit to attract, retain and motivate the very best caliber and in response to recent market movements in Egypt, our reward strategy continues to ensure fair compensation while aligning with our values-based performance, risk framework and risk outcomes linking it to the HSBC core values.
Operations, Services and Technology During 2016, we continued to transform HSBC Bank Egypt to create the simpler, better and faster bank that will make it easier for our customers to do business with us, and easier for us to serve their needs. We delivered a number of initiatives to grow our digital capabilities and enhance our revenues, costs and customer experience. We continued our efforts to realize efficiency gains, eliminate waste and reduce the complexity of our processes through automation and re-engineering. Several customer operations were offshored to the Group Service Centers (GSC) to standardize and streamline processes, apply best practices and leverage economies of scale.
Over the past 12 months, Corporate Real Estate (CRE) focus was directed towards implementing optimization strategies to right-size the property portfolio, increase flexibility and support business growth strategies.
We embarked on a journey to transform our supplier management, contract management and travel facilities to enhance the services provided to the businesses and functions and also reduce the Bank’s third party cost.
A number of IT solutions were delivered to improve systems stability, resiliency and availability, support regulatory requirements and simplify workflows between business and Group Service Centers.
Global Standards During 2016, we continued to make good progress to transform our financial crime controls and the way we manage financial crime risk across the bank. We advanced our transaction monitoring capabilities by migrating alerts investigations to the Group Services Center to ensure standardization and consistency in implementing our global standards policies and procedures.
We increased our sanctions screening capability and effectiveness with the roll-out of Oracle Watch list Screening (OWS) - the global standard screening Tool.
We implemented the operating model and supporting infrastructure for Customer Due Diligence (CDD). Robust controls, procedures and system enhancements were put in place to enable us understand more about our customers, manage the risks and growth opportunities associated with every client; and to detect, deter, and prevent financial crime.
We materially mitigated key legacy risks across our business, particularly those which are relating to correspondent banking and sanctions exposure.
Global standards learning has also taken center stage for all businesses and functions across the Bank by continually strengthening financial crime compliance culture, capability, and awareness. This is about equipping our people with the right tools and training to build the required knowledge, skills and capabilities.
We also established governance committees that focus on financial crime risk, thereby strengthening our governance and oversight.
ComplianceIn light of the implementation of Global Standards, a new Compliance structure was introduced with a considerable increase in the total Compliance headcount. Dedicated Compliance staff on Financial Crime Compliance (FCC) and Regulatory Compliance (RC) now support all business lines to cater for the increased FCC and RC requirements and to ensure full abidance to both Group and local regulations.
The Compliance team worked to fully satisfy the requirements of HSBC Global Standards Programme by implementing a more consistent and comprehensive approach to assessing FCC. This has included working on enhancing the controls governing the KYC, suspicious transactions reporting, sanctions and anti-bribery and corruption policies and procedures. The Global Standards Programme is an integral part of our goal to transform HSBC into the industry leader for knowing our customers and detecting, deterring and protecting against financial crime.
Corporate Sustainability• Community Investment Projects 2016
At HSBC, the way how we do business is as important as what we do. For us, sustainability means building our business for the long term by balancing social, environmental and economic considerations in the decisions we make. Sustainability underpins our strategic priorities. It enables us to fulfil our purpose as an international bank, help businesses thrive and contribute to the health and growth of communities. We work with leading charities to support community projects, with a focus on education and the environment. We aim to help young people reaching their potential through access to education and entrepreneurship. Our HSBC Water Programme focuses on water education, provision and protection.
In 2016, and in collaboration with Misr El Kheir NGO, the bank managed to build and equip a total of 50 community schools in remotely located villages in Egypt; availing proper education to more than 1,500 students through phase 1 of the 3-year signed protocol to build a total of 350 community schools.
With 50 per cent of the budget directed to education, the Bank partnered with Alwan and Awtar NGO to assist them in the expansion of their Montessori school, establishing 10 new classrooms and upgrading the Montessori curriculum to accommodate elementary students, and targeting a total of 150 underprivileged children living in El Hadaba El Wosta in the Mokattam Hills.
The Bank honored its commitment to the Public School Scholarship Fund at the American University in Cairo, whereby the bank fully supported the education of 2 visually impaired students.
Through the Association of Upper Egypt, the Bank helped 300 students continue their education and provided the school with the required resources to start implementing active learning techniques.
In partnership with Wataneya Society NGO, HSBC Bank Egypt (HBEG) continued the sponsorship of FORSA programme, which is a youth development programme specially tailored for youth orphans, to help them develop the required skills and knowledge that employers look for. The programme also aims at raising the self-esteem of young orphans living in orphanages to be able to positively integrate into the society. In 2016, the programme has impacted around 120 youth orphans and their caregivers.

7
With the establishment of NIDA, a specialized nursery and rehabilitation center in Alexandria, HBEG assisted a total of 140 underprivileged children with hearing disabilities in their education and integration into society.
Continuing with the Educational projects, HBEG staff volunteers assisted in delivering “JA - More than Money”, a financial literacy programme, to a total of 3,900 students in public schools with the help of INJAZ NGO. The programme is specially tailored to HSBC through a global partnership to raise the awareness of public school students on earning, spending and saving money.
On a regional level, HSBC partnered with the British Council to create “Taqqaddam” programme to give young people the courage and skills to navigate through the real world. Taqaddam was developed by HSBC and the British Council in collaboration with the Ministry of Education. The programme targets students from ages 15-16 years from across Egypt to help acquire the soft skills they need to get the jobs they aspire to. The programme was delivered with the help of HBEG staff volunteers.
HBEG also supported various environmental initiatives, including the installation of a complete waste management system in three villages; provided access to water for irrigation in five villages, implemented green school curriculums in five nurseries and schools; installed seven water filtration stations in the Western desert and Southern Red Sea; in addition to introducing the concept of rooftop and vertical gardens in six nurseries and schools.
On a Group level, HBEG won a Group funding opportunity and was able to partner with the Research Institute for Sustainable Environment to implement a water management project. Through this project, HBEG helped more than 12,000 people living in the Western Desert and the Southern Red Sea coast. The project included providing access to clean drinking water, the implementation of various water management techniques (canal lining, fish ponds, drip irrigation, grey water community garden), construction of a Water Education Center to raise awareness in local communities about the importance of water management and addressing various water scarcity issues.
On a regional level, HSBC partnered with the Research Institute for Sustainable Environment at the American University in Cairo to launch the “Food for the Future” programme, tackling the issue of food scarcity and water management. “Food for the Future” will establish best practice solutions for integrated, sustainable agriculture, increasing yields, efficiently using all resources and by-products, adding value by reusing water, producing energy and fertilizer from waste in an effort to identify ways to improve food security through enhancing urban agriculture and community gardening.
On a community level, HBEG partnered with HEYA NGO to implement a community flagship project to support the locals living in the Eastern Desert and Red Sea mountains (Ababda tribe). During the first phase of the project, a water distribution network was connected to 44 houses in Abu Ghosun village, finished the design of Qulaan houses, distributed a total of 150 water tanks to the locals in Wadi El Gemal, purchased 10 fishing boats and installed 6 solar cooling units in popular fishing spots serving as storage to the fishermen’s daily catch.
Through the yearly Ramadan Initiative community project, HBEG organized its annual Ramadan Food packing activity where staff volunteer with their families to pack a total of 1,500 food pack reaching 1,500 needy families; in addition to
distributing food supplies to 2,000 families from the Ababda tribe living in the Eastern Desert and Red Sea mountains along with the distribution of 350 solar lanterns and 100 water barrels to assist them given the harsh conditions they live in.
AcknowledgementBased on the financial results of 2016, the Board would like to extend their congratulations and thanks to the HSBC employees for their efforts and achievements.
Shareholding HSBC Bank Egypt SAE is a 94.5 per cent owned subsidiary of HSBC Holdings plc through HSBC Holdings BV. The shareholding structure is as follows:
HSBC Holdings BV 94.5%
Misr Insurance Company 3.4%
Misr Life Insurance Company 1.7%
Others 0.4%
Equity investmentsHSBC Securities Egypt SAE
HSBC Securities Egypt offers a full brokerage service for major foreign institutional investors and fund management companies. Besides offering brokerage services, HSBC Securities Egypt also provides quality equity research and distribution through dedicated equity analysts and salespersons based in Cairo, the MENA desk in HSBC Bank Middle East in Dubai and the Europe, Middle East and Africa desks in HSBC’s operations in London and New York.
HSBC Investment Company (Egypt) SAE
HSBC Investment Company, which is now under liquidation, offered origination, advisory and execution services for corporations in Egypt.
HSBC Bank Egypt also holds minority interests in the following companies:
• Egyptian Mortgage Refinance Company (EMRC)
• I-Score
• Misr Company for Clearing, Settlement and Depository (MCDR)
• Egyptian Banks Company for Technological Advancements (EBC)
Corporate GovernanceHSBC Bank Egypt is committed to complying with the highest standards of corporate governance principles, which is reflected in the relationships and responsibilities of the management, the Board and the shareholders in line with local regulatory requirements and the global requirements of the HSBC Group. HBEG’s governance policies and practices cover all aspects of the Bank’s daily operations, including the creation and execution of strategies, the definition and application of risk appetite parameters and setting the balance between shareholders’ obligations and depositors’ interests. HBEG Management ensures that the daily activities of the Bank’s operations are executed in a secure manner and in compliance with the prevailing laws and regulations.

8
HBEG’s commitment to organisational governance is evidenced by:
• The composition of the HBEG Board of Directors and the inclusion of independent Directors
• The definition of directors’ duties
• The operation and composition of Board’s Sub-committees including the Audit Committee, the Risk Committee, the Governance and Nominations Committee and the Salaries and Remuneration Committee
• The frequency of meetings of the Board and of the Board’s committees in line with local regulatory requirements
• The internal control framework, reflected in the structure and operation of the Bank
• The adoption and implementation of internal policies and manuals covering all business aspects
• The existence of transparent communication and disclosure channels

9
The following changes took place to the HBEG Board of Directors in 2016:
Retirement/Resignation• Retirement of Dr. Ibrahim Fawzy as independent, non-executive Director on 18 February 2016
• Resignation of Mr. Mohammad Al Tuwaijri as non-executive Chairman on 8 May 2016
Appointments• Appointment of Mr. Abdel Halim Assem as Independent, Non-Executive Director, effective 2 March 2016
• Appointment of Mr. Hisham Mohsen as Non-Executive Director (representing Misr Insurance Company), effective 27 April 2016
Mr Jacques-Emmanuel BlanchetDeputy Chairman and CEO
Jacques-Emmanuel is the Deputy Chairman and CEO of HSBC Bank Egypt SAE. He was appointed to the role effective March 1st, 2014. Before assuming his current position, Jacques-Emmanuel Blanchet was the Head of Commercial Banking in the UK and Co-Head Europe at HSBC. Based in London, he was responsible for managing the bank’s growing commercial banking division, which supports businesses of all sizes.
Before taking up this role in March 2011, Jacques-Emmanuel held a three-year tenure as Head of Commercial Banking at HSBC France, where he reorganised the division, bringing in additional expertise and a more proactive approach to customer relationships.
A graduate of ICSG Business School in Paris, Jacques-Emmanuel brings over 30 years banking experience to his new role. Since joining HSBC France in 1998, Jacques-Emmanuel has held several senior roles, including Head of Global Transactional Banking, CEO of HSBC Hervet and UBP and Head of Change and Service Delivery HSBC France.
Mr. Abdel Halim Assem Independent, non-executive Director
Mr. Assem is a senior consultant with extensive experience of the Telecom, Transport and Defense sectors in Egypt and the Middle East.
As the General Delegate for Egypt at Thales International ME from 1992 to 2012, he held responsibilities for design, conduct and implementation of the Group strategy in Egypt for the entire Thales portfolio and became the Special Advisor to the Chairman of Thales International ME. Before that, Mr. Assem had a long career with Thomson-CSF in Egypt before becoming the Country Delegate for Thomson-CSF Egypt.
Mr. Assem has a B.Sc. in Electronic, Engineering studies in Professional electronics and IT from the Polytechnic Faculty of Cairo University.
Mr. Assem holds the distinctions of Chevalier of the French National Order of the Legion of Honor and Conseiller du Commerce exterieur de la France CNCCEF.
Dr Ziad Ahmed Bahaa-EldinIndependent, Non-Executive Director
Dr Ziad Ahmed Bahaa-Eldin is an Egyptian Attorney-at-Law and expert on financial law, governance, compliance and economic legislation, Senior Partner in Thebes Consultancy and Of-Counsel with Zaki Hashem and Partners. He is currently a non-executive member on several companies’ board of directors, including HSBC Bank Egypt, the National Bank of Egypt UK, Arabian Cement Company, Emaar Egypt, and Samcrete Group. He was the Deputy Prime Minister for Economic Development and Minister of International Cooperation (2013-14), Member of Parliament representing Assiut (2012), Executive Chairman of the Egyptian Financial Supervisory Authority (EFSA) (2009-11) and the Executive Chairman of the Egyptian General Authority for Investment and Free Zones (2004-07). He is also a former non-executive member of the Board of Directors of the Central Bank of Egypt (2004-11), of the National Bank of Egypt (2005-10), and a former Senior Legal Advisor to the Central Bank of Egypt (2011). From 2000 to 2004, Dr Bahaa-Eldin was a practising lawyer in Egypt, and from 1997 to 2000 the senior legal advisor to the Minister of Economy. Prior to this, he was in private practice in Cairo and Washington, DC. Dr Bahaa-Eldin was also an adjunct lecturer at the Faculty of Law at the Cairo University (1998-2004). He is the founder and member of the Board of Directors of the Ahmed
The Board of Directors

10
Bahaa-Eldin Cultural Foundation, a charity promoting education, training, and creative thinking among Egyptian youth in Upper Egypt, and is a member of the Board of Trustees of the American University in Cairo. Dr Bahaa-Eldin received his PhD in Financial Law from the London School of Economics (1997), an LLM in International Business Law from King’s College London (1989), a BA in Economics from the American University in Cairo (1987) and a Bachelor of Law degree from Cairo University (1986).
Sir Sherard Cowper-Cowles KCMG LVONon-Executive Director
Sir Sherard joined HSBC Holdings in October 2013 as Senior Adviser to the Group Chairman and Group Chief Executive. In May 2015, he was appointed in a new post as Group Head of Government Affairs. He is also Chairman of HSBC Bank Oman SAOG, and a Director of HSBC Bank Egypt SAE.
Before HSBC, Sir Sherard worked for two-and-a-half years as Business Development Director, International, at BAE Systems plc. Earlier, he spent over 30 years in the British Diplomatic Service, which he joined straight from reading classics at Oxford. He served in Cairo, Washington and Paris. He was also Principal Private Secretary to the UK Foreign Secretary, the late Robin Cook, and was Head of the Foreign Office Hong Kong Department from 1994 up to the handover to China in 1997. His final diplomatic jobs were as Ambassador to Israel (2001–2003), Ambassador to Saudi Arabia (2003–2007), Ambassador to Afghanistan (2007-2009), and the UK Special Representative for Afghanistan and Pakistan (2009–2010).
Sir Sherard is also Chairman of the UK Financial Inclusion Commission; an Ambassador for the Money Advice Trust, and for the Winston Churchill Memorial Trust; member of the Board of the China-Britain Business Council, the Egyptian British Business Council, and the Saudi British Joint Business Council; UK Chairman of the Omani-British Friendship Association (business council); a Committee Member of The Hong Kong Association; and a Board Member of Asia House. He is President of the Algeria British Business Council, Chairman of the UK Advisory Council, LSE Confucius Institute for Business London, and of Pitzhanger Manor and Gallery Trust. He sits on the International Engagement Committee of the British Academy. He is an Honorary Fellow of Hertford College, Oxford, and President of the Jane Austen Society. He has an honorary D Litt from the University of Westminster, and is a Liveryman of The Skinners’ Company.
Sir Sherard is the author of two books about his diplomatic experiences: Cables from Kabul and Ever the Diplomat. He speaks French, Arabic, some Hebrew and rudimentary Pashtu.
Mr Georges ElhederyNon-Executive Director
Georges Elhedery is HSBC Group’s Chief Executive of Middle East and North Africa (MENA) region. He is also Deputy Chairman of HSBC Bank Middle East Limited.
Mr. Elhedery joined HSBC in 2005 and has held a number of key roles in the Group’s Global Banking and Markets (GBM) operations, including Global Head of Structured Rates, Global Deputy Head of Rates, Head of Global Markets, MENA and Head of Markets and Capital Financing, MENA. Prior to joining HSBC, he has held various senior Global Markets roles in London and Tokyo.
Before his appointment as Chief Executive, MENA in July 2016, he was Head of Global Banking and Markets, MENA. He also serves as a Board Director of HSBC Saudi Arabia Limited and HSBC Bank Egypt.
Mr. Elhedery holds a master’s degree in Statistics and Economics from ENSAE University and a bachelor’s degree in Engineering from Ecole Polytechnique in Paris.
Mrs Neveen El-ShafeiIndependent, Non-Executive Director
Neveen El-Shafei was appointed Assistant Minister of Investment in August 2013 until August 2014. Before her appointment, her responsibilities as Vice Chairman at the GAFI included supervision of the promotion and policy advocacy activities since 2008-09. Before that, she had acted as Adviser to the Chairman of GAFI since 2005.
In addition to her experience in the public domain since 2005, Ms El-Shafei brings nearly twenty years of investment and commercial banking experience to her role as Assistant Minister. Before joining GAFI, Ms El-Shafei was Executive Director of Corporate Finance at Fleming CIIC, a joint venture investment bank with CIIC, CIB’s Investment Banking arm. Operating within the newly formed investment banking joint venture between CIIC and Flemings, UK, Ms El-Shafei headed the Corporate Finance private sector team.
She previously spent ten years as an investment/corporate banker at Commercial International Bank (CIB), where, among other responsibilities, she took an active role in participating in Egypt’s privatisation programme. This covered valuation assignments on behalf of corporate clients in various industries, in addition to several proposals for CIB equity investments in local companies. In 1996, she acted as key coordinator in CIB’s Global Depository Receipt (GDR) offer of USD120 million, representing 20 per cent of CIB equity. The GDR represented the first GDR transaction in Egypt and was completed in July 1995. She also played an instrumental role in stabilising and sustaining investments in Egypt following the political changes that took place as of 25 January 2011.
Since joining the GAFI and more specifically since overseeing the promotion activities since 2009, Ms El-Shafei has actively taken part in several overseas ministerial missions and conferences in many countries.
Born in New York, 1964, Ms El-Shafei is a graduate of the American University in Cairo (Economics, 1985) and has been trained in the Chase Manhattan Credit Training Programme.

11
Mr. Hisham Mohsen Non-executive Director, Representative of Misr Insurance Company
Mr. Mohsen is the General Manager of the Non-Arab Business Inward Reinsurance Division at Misr Insurance. Mr. Mohsen joined Misr Insurance Company as Aviation Underwriter In July 1990 and was promoted to Aviation General Manager in 2012. In 2015, he moved to the Inward Reinsurance Sector with responsibility to accept foreign business for branches like engineering, marine, property and accident.
Mr. Mohsen was a former member of the Board of Directors of Nilesat, Flora, Arcosteel and Misr Asset Management Company. He is a member of the Board of HSBC Bank Egypt, since April 2016.
Mr. Mohsen holds a Bachelors of Commerce from Cairo University in addition to a High Diploma in Insurance.
Mrs Hania SadekExecutive Director
Hania Sadek is the Chief Operating Officer of HSBC Bank Egypt. She joined HSBC Bank Egypt in 1983 as a fresh graduate from the American University in Cairo, and completed her Master’s Degree in Economics during her term with the bank. She has extensive experience in branches, trade services and information technology, where she had extended roles for 15 years which qualified her to set up the Audit unit in HBEG. In conjunction with Group Audit Middle East, a Group Audit function within HSBC Bank Egypt was established in 2001 and took over the Group’s responsibility for branch audits starting from 2004. She has also been responsible for the Audit Committee for the past decade.
In 2010, Mrs Sadek took over the position of Chief Operating Officer for HBEG, where she is responsible for the overall Operations’ functions, including Information Technology, and professional services like Corporate Real Estate and Procurement. Her current role as HBEG Chief Operating Officer and Executive Director entails a wide diversified range of technology and operations activities and building relations with various bodies from the Group on regional and global levels. In addition, the job requires interaction with senior executives in authorities within Egypt, such as the regulators and large governmental and private institutions.
In 2016, Mrs Sadek had overseen Regional Operations, MENA alongside current responsibilities for an interim period of six months.
In a context of female accomplishments across the Middle East, Mrs Sadek has been ranked 37th in the 200 Most Powerful Arab Women – 2014 by Forbes Middle East, 42nd in the 100 Most Powerful Arab Women – 2016 as well and in Amwal El Ghad’s Most Powerful Women in the Egyptian Banking Sector. The lists include inspirational and accomplished top executive women from the corporate and banking spheres, with criteria that take into account the degree of power associated with ranked women’s positions, years of experience and number of years in operation.
Mrs Nevine TaherExecutive Director
B.A. in Economics, American University in Cairo, Egypt, 1980 - Minor in Business Management. Trained by the HSBC Group in Marketing, Management, Lending and Finance of International Trade, Product Development and Project Management and Executive Leadership, HR Insights by Ashridge Consulting - London.
Over 25 years in banking with HSBC Group, Credit and Investment in Egypt. Wide exposure in diversified industries.
Country Head of External Relations and HR (2012 till present): Drives, directs and shapes HSBC Egypt’s Human Resources mission, strategic objectives, vision, policies, processes as well as establishes the controls and regulatory procedural framework for HSBC Bank Egypt’s HR Function. Provides highly specialized and professional HR support in the determination of remuneration strategies. Ensures the achievement of the business growth imperatives, whilst maintaining compliance, operational risk and ethical standards. Interpret Group/Regional strategy, translating it into local HR actions flowing from Regional/Group Strategy in designing and implementing commercial, compliant and business-relevant practices. Additionally, Nevine has also been appointed Chairman of HSBC Securities, HSBC Bank Egypt’s Broking subsidiary. Taking an expanded role, in addition to her continued responsibility for the HR function, which includes responsibility for building wider and deeper relationships into the community, not just with clients, for whom the Global Businesses remain responsible, but also with Regulators, the Government and others. HBEG board member and also a board member at INJAZ Egypt.
Previously, Mrs Nevine was Head of Retail Banking and Wealth Management: Setting of RBWM Strategies and expansion plans, Managed Revenues growth throughout all HSBC Bank Egypt branches, enhanced proper procedures and proper customers handling systems and propositions. Expanded ATM network, direct sales team, call center and direct sales products. Introduced a financial planning team to sell and give advisory services for different type of investment products.
Also previously, Mrs Nevine was Head of Corporate Banking: Guided the development and implementation of Corporate Banking strategies to grow the business, market share, drive and expand most profitable relationships. Drive change in market strategy and product development and ensure portfolio quality to minimize losses and contribute to maximized operating economic profit.

12
The Board CommitteesThe purpose of HSBC Bank Egypt’s corporate structure, headed by the Board of Directors and led by the Chairman, is to deliver sustainable value to our shareholders. The Board sets the strategy for the Bank and approves the risk appetite and capital and operating plans presented by management for the achievement of the strategic objectives it has set. Implementation of the strategy set by the Board is delegated to the Executive Committee, led by the Chief Executive Officer. To achieve its strategic objectives, the Board has appointed a number of Directors and Executive Management to serve on Board Committees. The responsibilities of these committees and its membership are as following:
Executive Committee The Executive Committee is an executive management committee that meets monthly and operates as a general management committee with regards to the day-to-day management of the bank under the direct authority of the Board. The purpose of the Executive Committee is to maintain a reporting and control structure whereby all lines of business and functions are accountable to the individual members of the Committee who report to the Chief Executive Officer who chairs the Executive Committee.
Audit Committee The Audit Committee is responsible for reviewing and monitoring financial and internal audit matters, and for ensuring that effective systems of internal control (including financial control) are in place. The members of the Audit Committee are Dr. Ziad Bahaa Eldin (Chairman), Mrs. Neveen El-Shafei and Mr. Hisham Mohsen.
Risk CommitteeThe Risk Committee has responsibilities to oversee and advise the Board on all high-level risk related matters in relation to risk governance; and to review the effectiveness of the bank’s risk management framework and internal control systems. The members of the Risk Committee are Sir Sherard Cowper-Coles (Chairman), Mr. Georges Elhedery, Mrs. Neveen El-Shafei, Mr. Abdel Halim Assem and Mr. Jacques-Emmanuel Blanchet.
Governance and Nomination Committee The Governance and Nomination Committee is responsible for leading the process for Board appointments and for identifying and nominating, for approval by the Board, candidates for appointment to the Board in addition to evaluating the bank’s governance system. The members of the Governance and Nominations Committee are Dr. Ziad Bahaa Eldin (Chairman), Sir Sherard Cowper-Coles and Mr. Abdel Halim Assem
Salaries and Remuneration Committee The Salaries and Remuneration Committee considers remuneration matters for the bank in the context of the Group’s remuneration policy, proposes the fees for directors for approval by the Board and the shareholders and reviews performance-based remuneration with reference to corporate goals and objectives The members of the Salaries and Remunerations Committee are Sir Sherard Cowper-Coles (Chairman), Dr. Ziad Bahaa Eldin and Mr. Abdel Halim Assem.

13
Auditors’ report
To: The shareholders of HSBC Bank, Egypt (SAE)
Report on the separate financial statementsWe have audited the accompanying separate financial statements of HSBC Bank, Egypt (SAE), which comprise the separate balance sheet as of 31 December 2016 and the separate statements of income, changes in equity and cash flow for the year then ended and a summary of significant accounting policies and other explanatory notes.
Management’s responsibility for the separate financial statementsThese separate financial statements are the responsibility of the Bank’s management. Management is responsible for the preparation and fair presentation of these separate financial statements in accordance with the rules of preparation and presentation of the Bank’s separate financial statements issued by the Central Bank of Egypt on 16 December 2008 and with the requirements of applicable Egyptian laws and regulations. This responsibility includes: designing, implementing and maintaining internal control relevant to the preparation and fair presentation of financial statements that are free from material misstatement, whether due to fraud or error. Management responsibility also includes selecting and applying the appropriate accounting policies; and making accounting estimates that are reasonable in the circumstances.
Auditors’ responsibilityOur responsibility is to express an opinion on these separate financial statements based on our audit. We conducted our audit in accordance with Egyptian Standards on Auditing in the light of the prevailing Egyptian laws. Those standards require that we comply with ethical requirements and plan and perform the audit to obtain reasonable assurance whether the separate financial statements are free from material misstatement.
An audit involves performing procedures to obtain audit evidence about the amounts and disclosures in the separate financial statements. The procedures selected depend on the auditors’ judgement, including the assessment of the risks of material misstatement of the separate financial statements, whether due to fraud or error. In making those risk assessments, the auditors consider internal control relevant to the Bank’s preparation and fair presentation of the separate financial statements in order to design audit procedures that are appropriate in the circumstances, but not for the purpose of expressing an opinion on the effectiveness of the Bank’s internal control. An audit also includes evaluating the appropriateness of accounting policies used and the reasonableness of accounting estimates made by management, as well as evaluating the overall presentation of the separate financial statements.
We believe that the audit evidence we have obtained is sufficient and appropriate to provide a basis for our audit opinion.
OpinionIn our opinion, the accompanying separate financial statements present fairly, in all material respects, the financial position of HSBC Bank, Egypt (SAE) as of 31 December 2016, and of its financial performance and its cash flows for the year then ended, in accordance with the Central Bank of Egypt’s rules, pertaining to the preparation and presentation of these separate financial statements and measurement and recognition basis approved by its Board of Directors on 16 December 2008 and Egyptian laws and regulations relating to the preparation of these separate financial statements.
Report on other legal and regulatory requirementsAccording to the information and explanations obtained from management, nothing has come to our attention that the Bank had significantly violated the provisions of Law No. 88 of 2003 during the year ended 31 December 2016 or its article of incorporation.
The Bank keeps proper financial records, which include all that is required by the law and the Bank’s article of incorporation and the accompanying separate financial statements are in agreement therewith.
The financial information included in the Board of Directors’ report is in agreement with the Bank’s records within the limit that such information is recorded therein.
Cairo: February 15, 2017
AuditorsMohamed Ahmed Fouad, CPAEgyptian Financial Supervisory Authority No.(235) R.A.A. 11595 Mansour and Co. PricewaterhouseCoopers Public Accountants and Consultants
Farid Samir Farid, CPAEgyptian Financial Supervisory Authority No.(210) R.A.A. 8739 Deloitte Saleh, Barsoum and AbdelAziz Accountants and Auditors

14
Separate balance sheet as at 31 December 2016(All amounts in EGP 000)
Note 2016 2015
Assets
Cash and balances with Central Bank of Egypt 15 8,011,696 5,925,859
Due from banks 16 23,801,877 12,672,599
Treasury bills 17 22,694,942 18,568,859
Financial assets held for trading 18 8,773 10,267
Loans and advances to banks 19 1,285,805 556,702
Loans and advances to customers 20 28,332,228 20,236,741
Financial derivatives 21 - 13,657
Financial investments
Available for sale 22 2,465,087 4,526,217
Held to maturity 22 21,292 32,143
Investments in subsidiaries 23 21,800 35,517
Intangible assets 24 7,015 8,029
Other assets 25 497,846 391,890
Deferred tax assets 32 52,654 48,010
Investment property 27 83,850 93,368
Fixed assets 26 349,965 394,578
Total assets 87,634,830 63,514,436
Liabilities and shareholders' equity
Liabilities
Due to banks 28 5,772,249 2,998,173
Customers' deposits 29 70,556,190 51,376,570
Financial derivatives 21 - 13,706
Subordinated loans 40 272,000 272,000
Other liabilities 30 1,089,598 903,991
Other provisions 31 229,149 138,307
Current income tax 557,921 426,073
Defined benefits obligations 33 264,177 255,232
Total liabilities 78,741,284 56,384,052
Shareholders' equity
Paid-up capital 34 2,795,567 2,795,567
Reserves 35 1,859,949 1,802,059
Retained earnings 35 4,238,030 2,532,758
Total shareholders' equity 8,893,546 7,130,384
Total liabilities and shareholders' equity 87,634,830 63,514,436
The accompanying notes from 1 to 43 form an integral part of these financial statements and are to be read therewith.
Balance Sheet

15
Separate income statement for the year ended 31 December 2016(All amounts in EGP 000)
Note 2016 2015
Interest income from loans and similar income 6 6,136,315 4,664,512
Interest expense on deposits and similar expense 6 (1,212,600) (1,047,574)
Net interest income 4,923,715 3,616,938
Fees and commissions income 7 873,075 762,781
Fees and commissions expense 7 (124,182) (93,811)
Net fees and commissions income 748,893 668,970
Dividends income 8 3,973 3,597
Net trading income 9 150,002 194,462
Financial investment gain 22 10,429 4,941
Credit impairment (charged) 12 (156,610) (63,510)
Administrative expenses 10 (1,295,181) (1,221,200)
Other operating income 11 109,495 127,049
Profit before income tax 4,494,716 3,331,247
Income tax expenses 13 (1,016,513) (798,442)
Net profit for the year 3,478,203 2,532,805
Earnings per share (EGP/share)
Basic 14 93.98 68.49
The accompanying notes from 1 to 43 form an integral part of these financial statements and are to be read therewith.
Income Statement

16
Separate cash flows statement for the year ended 31 December 2016(All amounts in EGP 000)
Note 2016 2015
Cash Flows from operating activities
Net profit before income tax 4,494,716 3,331,247
Adjustments to reconcile net profit to net cash flows from operating activities
Depreciation and amortisation 58,494 63,612
Impairment of assets 170,327 63,510
Other provisions formed (no longer required) 33,262 (7,230)
Revaluation differences for provisions other than loans provision
89,418 1,878
(Gain) from sale of property and equipment (11,336) (1,958)
Profits from sale of investments (24,146) (4,941)
Revaluation differences for available-for-sale investment
(475,036) (21,700)
Dividends received (3,973) (3,597)
Transferred from general bank risk reserve (282) -
Operating income before changes in assets and liabilities from operating activities
4,331,444 3,420,821
Net decrease (increase) in assets and liabilities
Due from banks (2,038,714) (932,303)
Treasury bills 549,549 (6,079,529)
Financial investments held for trading 1,494 11,306
Loans and advances to customers (8,252,098) (694,116)
Loans and advances to banks (729,103) (484,965)
Financial derivatives (net) (49) 2,065
Other assets (105,956) 34,307
Due to banks 2,774,076 1,454,909
Customers' deposits 19,179,620 (3,159,237)
Other liabilities 185,607 197,982
End of service compensation benefits 8,945 -
Other provision used (31,838) (63,113)
Income tax paid (889,308) (909,098)
Net cash flows provided from (used in) operating activities
14,983,669 (7,200,971)
Cash flows from investing activities
Payments to purchase fixed assets and branches preparation
(15,742) (46,388)
Proceeds from sale of fixed assets 25,372 2,542
Payments to purchase intangible assets (1,643) (8,409)
Proceeds from disposals of intangible assets - 1,852
Cash Flow Statement

17
Payments for acquisition of available-for-sale investments
(408,881) (1,432,824)
Proceeds from sale (redemption) of available-for-sale investments
2,767,243 2,927,572
Proceeds from sale of held-to-maturity financial investments
17,697 11,695
Dividends received 3,973 3,597
Net cash flows provided from investing activities 2,388,019 1,459,637
Cash flows from financing activities
Dividends paid (1,519,655) (1,587,827)
Net cash flows (used in) financing activities (1,519,655) (1,587,827)
Net change in cash and cash equivalents during the year
15,852,033 (7,329,161)
Cash and cash equivalents at the beginning of the year
17,781,264 25,110,425
Cash and cash equivalents at the end of the year 33,633,297 17,781,264
Cash and cash equivalents are represented in:
Cash and balances with Central Bank of Egypt 8,011,696 5,925,859
Due from banks 23,801,877 12,672,599
Treasury bills 22,694,942 18,568,859
Balance with Central Bank of Egypt within the limit of statutory reserve
(7,211,801) (5,173,087)
Treasury bills of maturity more than 3 months from date of acquisition
(13,663,417) (14,212,966)
Cash and cash equivalents 37 33,633,297 17,781,264
The accompanying notes from 1 to 43 form an integral part of these financial statements and are to be read therewith.

18
Separate statement of changes in shareholders’ equity for the year ended 31 December 2016(All amounts in EGP 000)
Note Paid-up capital
Paid under capital
increase
Reserves Retained earnings
Total
Balances as at 31 December 2014 2,078,500 717,067 1,591,126 1,766,981 6,153,674
Capital increase 717,067 (717,067) - - -
Dividends paid for year 2014 36 - - - (1,587,827) (1,587,827)
Transferred to legal reserve 35 - - 88,215 (88,215) -
Transferred to general reserve 35 - - 88,218 (88,218) -
Transferred to capital reserve 35 - - 2,721 (2,721) -
Net change in available-for-sale investments
35 - - 31,732 - 31,732
Net profit for the year ended 31 December 2015
- - - 2,532,805 2,532,805
Transferred from general risk reserve 35 - - 47 (47) -
Balances as at 31 December 2015 2,795,567 - 1,802,059 2,532,758 7,130,384
Balances as at 31 December 2015 2,795,567 - 1,802,059 2,532,758 7,130,384
Dividends paid for year 2015 36 - - - (1,519,655) (1,519,655)
Transferred to legal reserve 35 - - 126,640 (126,640) -
Transferred to general reserve 35 - - 126,636 (126,636) -
Net change in available-for-sale investments
35 - - (195,104) - (195,104)
Transferred to capital reserve 35 - - (282) - (282)
Net profit for the year ended 31 December 2016
- - - 3,478,203 3,478,203
Balances as at 31 December 2016 2,795,567 - 1,859,949 4,238,030 8,893,546
The accompanying notes from 1 to 43 form an integral part of these financial statements and are to be read therewith.
Changes in the Shareholders' Equity Statement

19
Separate proposed profit of appropriation statement for the year ended 31 December 2016(All amounts in EGP 000)
Note 2016 2015
Net profit for the year 3,478,203 2,532,805
Less: Gain from sale of fixed assets transferred to capital reserve according to law
(11,336) -
General banking reserve 35 - (47)
Net profit for the year available for appropriation 3,466,867 2,532,758
Appropriation:
Legal reserve 35 173,343 126,640
General reserve 35 181,129 126,636
Shareholders’ dividends 36 2,080,036 1,266,379
Employees’ profit share 36 338,986 253,276
Retained earnings 693,373 759,827
3,466,867 2,532,758
The accompanying notes from 1 to 43 form an integral part of these financial statements and are to be read therewith.
Appropriation Account

20
1. Background HSBC Bank Egypt SAE provides retail, corporate and investment banking services in the Arab Republic of Egypt through 60 branches and 7 small units served by more than 1,826 employees at the date of the balance sheet.
HSBC Bank Egypt SAE is established according to the Investment Law, in accordance with the decision no.60 for year 1982 taken by the minister of investment and international cooperation and published in El Waqaa El Masria newspaper on 17 May 1982 in the Arab Republic of Egypt. The head office is located in Cairo. The Bank started its operation on15 December 1982. The Bank’s shares have been delisted from the Egyptian stock exchange market on 31 December 2009.
On 9 February 2017, the board approved the financial statements for the year ended 31 December 2016.
2. Summary of significant accounting policiesThe principal accounting policies applied in the preparation of these financial statements are set out below. These policies have been consistently applied to all the years presented, unless otherwise stated.
A. Basis of preparationThe financial statements are prepared in accordance with the Central Bank of Egypt’s (CBE) instructions approved by its Board of Directors on 16 December 2008.
B. Subsidiaries • Subsidiaries are all companies (including special purpose entities) over which the Bank has owned directly or
indirectly the power to govern the financial and operational policies. Generally, the bank own more than one half of the voting rights. The existence and effect of potential voting rights that are currently exercisable or convertible are considered when assessing whether the Bank has the ability to control the entity
• The purchase method is used to account for the acquisition of subsidiaries by the Bank. The cost of an acquisition is measured as the fair value of the assets, or/and asset given or/and equity instruments issued and loans assumed at the date of exchange, plus costs directly attributable to the acquisition. Net assets, including contingent liabilities assumed in a business combination, are measured initially at their fair values at the acquisition date, irrespective of the minority interest. The excess of acquisition cost over the Bank’s share fair value in the net assets acquired is recorded as goodwill. If the acquisition cost is less than the fair value of the net assets, the difference is recognised directly in the income statement under the item ‘Other operating income/(expenses)’
• Investments in subsidiaries in the separate financial statements are accounted for using the cost method. According to this method, investments recorded at cost of acquisition including goodwill and less any impairment losses. Dividends are recorded in the income statement when adoption of the distribution has been authorised and affirming the Bank’s right in collecting them has been recognised
C. Segment reporting A business segment is a group of assets and operations engaged in providing products or services that are subject to risks and returns that are different from those of other business segments. A geographical segment is a segment which provides products or services within a particular economic environment that are subject to risks and returns different from those of segments operating in other economic environments.
D. Foreign currency transactions and balancesThe Bank keeps its accounting records in Egyptian pound. Foreign currency transactions are translated into Egyptian pound using the exchange rates prevailing at the date of the transaction. Monetary assets and liabilities in foreign currencies are retranslated at the end of each period at the exchange rates then prevailing. Foreign exchange gains and losses resulting from settlement of such transactions and valuation differences are recognised in the income statement under the following items:
• Net trading income for the assets/liabilities held for trading
• Owner’s equity for the financial derivatives in the form of eligible hedge for cash flows or net investment
• Other operating income (expenses) for the other items
Notes on the AccountsNotes to the separate financial statements for the year ended 31 December 2016(In the notes, all amounts are shown in thousands of Egyptian pounds unless otherwise stated)

21
Changes in the fair value of monetary financial instruments in foreign currencies classified as investments available for sale (debt instruments) are classified as valuation differences resulting from changes in amortised cost of the instrument and differences resulted from changes in applicable exchange rates and differences resulted from changes in the instrument fair value. Valuation differences relating to changes in amortised cost are recognised in income statement under ‘Interest and similar income’, while differences relating to changes in exchange rates are recognised under item ‘Other operating income (expenses)’. Differences resulting from changes in fair value are recognised under ‘Fair value reserve – available-for-sale investments’ in the equity caption.
Valuation differences resulting from non-monetary items include profits and losses resulting from changes in fair value, such as equity instruments held at fair value through profits and losses, while valuation differences resulting from equity instruments classified as financial investments available for sale are recognised as ‘Fair value reserve – available-for-sale investments’ under the equity caption.
E. Financial assetsThe Bank classifies its financial assets in the following categories: financial assets at fair value through profit or loss; loans and receivables; held-to-maturity investments; and available-for-sale investments. Management determines the classification of its investments at initial recognition.
E.1. Financial assets at fair value through profit or loss:This category consists of financial assets held for trading and financial assets designated at fair value through profit or loss at inception.
• Financial assets are classified as held for trading if they are acquired or incurred principally for the purpose of selling in the near-term or if they are part of the financial instruments portfolio that is managed together and there is evidence resulting from recent actual transactions that profit can be recognised. Derivatives can be classified as held for trading unless they are identified as hedging instruments
• Financial assets designated at fair value through profit or loss are recognised when: – doing so significantly reduces measurement inconstancies that would arise if the related derivatives were treated
as held for trading and the underlying financial instruments were carried at amortised cost for loans and advances to customers or banks and issued debt securities;
– equity investments that are managed and evaluated at a fair-value basis, in accordance with risk management or investment strategy and preparing reports to top management on that basis, are classified as fair value through profit and loss; and
– financial instruments, such as debt instrument which contain one or more embedded derivatives that may significantly affect the cash flows, are classified at fair value through profit and loss.
• Gains and losses arising from changes in the fair value of derivatives managed in conjunction with designated financial assets or financial liabilities are recorded in the ‘Net income from financial instruments classified at fair value through profit and loss’
• It is not permitted to reclassify any derivative out of the financial instrument valued at fair value through profit or loss category during its holding period. Also, it is not permitted to reclassify any financial instrument valued at fair value through profit or loss category if it is initially recorded by the Bank at fair value through profit or loss
• In all cases, the Bank should not reclassify any financial instrument into financial instruments measured at fair value through profit and loss or held-for-trading investments
E.2. Loans and receivables Loans and receivables are non-derivative financial assets with fixed or determinable payments that are not quoted in an active market, other than those that:
• the Bank intends to sell immediately or in the short-term, which are classified as held for trading, or those that the Bank, upon initial recognition, recorded as at fair value through profit or loss;
• the Bank, upon initial recognition, designates as available for sale; and• for which the holder may not recover substantially all of its initial investment, other than because of
credit deterioration.E.3. Financial investments held to maturity
Held-to-maturity financial investments are non-derivative assets that carry fixed or determinable payments and where the Bank has the intention and ability to hold to maturity. Any sale of a significant amount not close to the date of its maturity would result in the reclassification of all held-to-maturity investments as available for sale, except in the emergency cases.
E.4. Financial investments available for saleAvailable-for-sale financial investments are non-derivative financial assets that are intended to be held for an unspecified year and may be sold to provide liquidity or due to changes in shares prices, foreign exchange currencies or interest rates.
The following applies to financial assets:• Purchases or sales of financial assets at fair value through profit and loss, held-to-maturity financial investments and
available-for-sale financial investments are recognised at the trade date, which is the date the Bank is committed to purchase or sell the financial assets
• Financial assets that are not classified at fair value through profit and loss at initial recognition are recognised at fair

22
value plus transaction cost, while the financial assets classified as at fair value through profit and loss are initially recognised at fair value only, and the transaction cost is recognised in the profit and loss under ‘Net trading income’
• Financial assets are derecognised when the rights to receive cash flows have expired or when the Bank transfers all asset risks and rewards to another party, while a financial liability is derecognised when the obligation under the liability is discharged or cancelled or expired
• Available-for-sale financial investments and financial assets designated at fair value through profit and loss are subsequently measured at fair value, while loans and advances and held-to-maturity investments are measured subsequently at amortised cost
• Gains and losses arising from changes in the fair value of financial assets designated at fair value through profit and loss are recorded in the income statement during the year it occurred, while gains and losses arising from changes in the fair value of available-for-sale financial investments are recognised in the ‘Fair value reserve for available-for-sale investments’ in equity until the financial asset is sold or impaired. At which time, the cumulative gain or loss previously recognised in equity should be recognised in profit or loss
• Interest income related to monetary assets classified as available-for-sale is recognised based on the amortised cost method in profit and loss. The foreign currency revaluation differences related to available-for-sale investments are recognised in the profit and loss. Dividends related to available-for-sale equity instruments are recognised in the profit and loss when they are declared
• The fair values of quoted investments in active markets are based on current bid prices. If there is no active market for a financial asset, the Bank establishes fair value using valuation techniques. These include the use of recent arm’s-length transactions, discounted cash flow analysis, option pricing models and other valuation techniques commonly used by market participants if the Bank could not assess the value of the equity classified as available for sale. These instruments should be valued at cost and will be subject to impairment test
• Debt instruments can be reclassified from available-for-sale investments to ‘loans and receivables’ or ‘financial assets held to maturity’ using fair value when the Bank has the intention and ability to hold the instrument on the future or until maturity. Any related profits or losses that have been previously recognised in equity are treated as follows: – Profits and losses related to reclassified financial assets, with fixed or determinable maturity, are amortised using the
effective interest method over the remaining life of the held-to-maturity investment. The difference between the amortised cost and the redemption value is amortised using the effective interest rate method over the remaining life of the financial asset. In case of financial asset’s impairment, any profits or losses previously recognised in equity are to be recognised in profit and loss.
– Profits and losses related to the financial assets without fixed or determinable maturity are recorded in equity until selling or disposing of it. In case of impairment, profit and losses that have been previously recognised directly in equity are recognised in the profit and loss
• If the Bank changes its estimates regarding payments or proceeds, the book value of a financial asset (or group of financial assets) has to be adjusted to reflect the actual cash inflows and the change in this estimate through calculating the present value of estimated future cash flows using the effective interest rate for the financial instrument. This adjustment is recognised as either income or expense in the profit and loss
• In all cases, if the Bank re-classified financial assets in accordance with what is referred to above, and the Bank subsequently increase its future cash proceeds estimates resulted from an increase in the recoverable amount from its cash receipts, this increase is recognised as an adjustment to the effective interest rate, not as an adjustment in the book value of the asset at the date of change in the estimate
F. Netting between financial instrumentsFinancial assets and liabilities are offset when there is a legally enforceable right to offset the recognised amounts and there is an intention to settle on a net basis or realise the asset and settle the liability simultaneously.
Treasury bills, repos and reverse repos agreements are netted on the balance sheet and disclosed under Treasury bills.

23
G. Derivative financial instrumentsDerivatives are recognised at fair value at the date of the derivative contract and are subsequently revaluated at fair value. Fair values are obtained from quoted market prices in active markets, or according to the recent market deals, or the revaluation methods as the discounted cash flow modules and the pricing lists modules, as appropriate. Derivatives are carried as financial assets when the fair value is positive and as financial liabilities when the fair value is negative.
• Derivatives that do not qualify for hedge accounting Derivative instruments that do not qualify for hedge accounting and changes in the fair value of any derivative instrument that does not qualify for hedge accounting are recognised immediately in the profit and loss under ‘Net trading income’. However, gains and losses arising from changes in the fair value of derivatives that are managed in conjunction with financial assets or liabilities are included in ‘Net income from financial instruments at fair value through profit or loss’.
H. Interest income and expenseInterest income and expense related to financial instruments, except for held-for-trading investments or recorded at fair value through profit and loss, are recognised under ‘Interest and similar income’ or ‘Interest and similar charges’.
The effective interest method is a method of calculating the amortised cost of a financial asset or liability and of allocating the interest income or interest expense over the life of the financial instrument. The effective interest rate is the rate that discounts estimated future cash payments or receipts over the expected life of the financial instrument or a shorter year when it is appropriate to reach the net carrying amount of the financial asset or liability. When calculating the effective interest rate, the Bank estimates cash flows, considering all contractual terms of the financial instrument (for example, prepayment options) but does not consider future credit losses.
The calculation includes all fees and points paid or received between parties of the contract that are considered part of the effective interest rate. Transaction costs include all other premiums or discounts.
When loans or debts are classified as non-performing or impaired, related interest income is not recognised but is rather carried off-balance sheet in statistical records and is recognised under revenues according to cash basis as per the following:
H.1. When collected and after recovery of all arrears for retail loans, personal loans, small and medium business loans, mortgage loans for personal housing and small loans for businesses
H.2. For loans granted to corporate, interest income is recognised on a cash basis after the Bank collects 25 per cent of the scheduling instalments and after the instalments continued to be regular for at least one year. Interest income will not be recognised as revenue until full payment of the loan balance before the rescheduling and client is considered to be performing
I. Fees and commission incomeFees and commissions related to loan and advances are recognised as income when the service is rendered. Fees and commissions income related to non-performing or impaired loans or debts are suspended and are carried off-balance sheet and are recognised under income according to the cash basis when interest income is recognised in accordance with note (H/2) above. Fees and commissions that represent part of the financial asset effective rate are recognised as adjustment to the effective interest rate.
Commitment fees are deferred when there is probability that this loan will be used by the customer as commitment fees represent compensation for the continuing interfere to own the financial asset. Subsequently, it is recognised as adjustment to the effective interest rate of the loan. If the commitment period passed without issuing the loan, commitment fees are recognised as income at the end of the commitment year.
Fees and commissions related to debt instruments measured by fair value are recognised as income at initial recognition. Fees and commissions related to marketing of a syndicated loan are recognised as income when the marketing is completed and the loan is fully used or the Bank kept its share of the syndicated loan using the effective interest rate as used by the other participants.
Commissions and fees arising from negotiation or participating in a negotiation to the favour of a third party as in share acquisition arrangements or purchase of securities or purchase or sale of businesses are recognised as income when the transaction is completed. Commissions and fees related to management advisory and other services are recognised as income based on the contract terms, usually on a time-appropriation basis. Asset management fees are recognised over the year in which the service is provided.
J. Dividends incomeDividends are recognised in the profit and loss when the Bank’s right to receive those dividends is established.
K. Agreement for purchase and resale, and agreement for selling and repurchaseFinancial instruments sold under repurchase agreements are not derecognised from the books. These are shown in the assets side as an addition to the ‘Treasury bills and other governmental notes’ line item in the balance sheet. On the other hand, the Bank’s obligation arising from financial instruments acquired under purchase and resale agreements is shown as a deduction from the ‘Treasury bills and other governmental notes’ line item in the balance sheet. Differences between the sale and repurchase price or between the purchase and resale price are recognised as interest expense or income throughout the period of agreements using the effective interest rate method.

24
L. Impairment of financial assets
Financial assets at amortised cost:At each balance sheet date, the Bank assesses whether there is objective evidence that any financial asset or group of financial assets has been impaired as a result of one or more events occurring since they were initially recognised (a ‘loss event’) and whether that loss event has impacted the future cash flows of the financial asset or group of financial assets that can be reliably estimated.
The Bank considers the following indicators to determine the existence of substantive evidence for impairment losses:
• Cash flow difficulties experienced by the borrower
• Breach of the loan agreement, eg default
• Expected bankruptcy of the borrower or subject to liquidation lawsuit or restructuring the finance granted to it
• Deterioration of competitive position of borrower
• Granting privileges or assignments by the Bank to the borrower due to economic or legal reasons, which are not granted by the Bank in the normal course of business
• Impairment of guarantee
• Deterioration of creditworthiness
A substantive proof for impairment loss of the financial assets is the existence of clear information indicating a measurable decline in the expected future cash flows of such category since initial recognition, although such decline is not identifiable for each individual asset.
The Bank estimates the period between a losses occurring and its identification for each specific portfolio. In general, the periods used vary between three months to twelve months.
The Bank first assesses whether objective evidence of impairment exists individually for financial assets that are individually significant and individually or collectively for financial assets that are not individually significant, taking into consideration the following:
• In case there is no objective evidence that an impairment loss has been incurred on a financial instrument considered individually, be it significant or not, the Bank includes that financial asset in a group of financial assets having similar characteristics in terms of credit risk and tests the whole group for impairment
• An individually impairment test is made for a financial asset if there is objective evidence that this asset is impaired. If the impairment occurred, this asset will be separated from group of financial assets that are collectively evaluated for impairment
• If the result of the previous test did not recognise impairment loss, this asset will be added to the group of financial assets that are collectively evaluated for impairment. Impairment loss is calculated by the difference between the carrying amount and the present value of estimated future recoverable cash flows, excluding future expected credit loss not charged yet, discounted at the financial assets’ original effective interest rate. This impairment is booked in the income statement as ‘Impairment loss’, and the book value of the financial asset is reduced by the impairment amount using the ‘impairment loss provision’
If there is evidence that loans or other receivables or financial assets classified as held-to-maturity carry variable rate, the discount rate will be the contract effective interest rate when there is objective evidence that an impairment loss has been incurred. For practical purposes, the Bank may measure the impairment loss using the fair value of the instrument through its market rate.
For guaranteed financial assets, the present value for expected future cash flows has to be considered in addition to the proceeds from sale of guarantee after deducting selling cost.
For the purposes of a collective evaluation of impairment, financial assets are grouped on the basis of similar credit risk characteristics according to the Bank classification, taking into consideration the type of asset, industry, geographical location, collateral, past dues and other relevant factors. Those characteristics are relevant to the estimation of future cash flows for those groups of assets as they are indicators of the debtors’ ability to pay all amounts due according to its contract terms for assets under study.
If historical impairment losses rates method is used for a group of financial assets that are collectively evaluated for impairment, future contractual cash flow will be used by the Bank in future, and the historical loss for a group of assets with similar credit risk characteristics are considered. Historical impairment loss rates are adjusted to reflect the effects of current circumstances that did not affect the year on which the historical impairment loss rates is based and to remove the effects of circumstances in the historical year that do not currently exist.
The Bank has to ensure that the estimates of changes in future cash flows for groups of assets are in consistence with changes in relative data from year to year, such as changes in unemployment rates, real estate prices, settlement status, or other factors that may affect the probability and magnitude of losses. The Bank reviews the basis and methods of estimation regularly.
Available-for-sale investments:At each balance sheet date, the Bank estimates if there is objective evidence that impairment loss for an asset or a group of assets classified as available-for-sale occurred. For listed equity instruments classified as available-for-sale investments, impairment is recognised if the decline is significant and a prolonged decline on its price below its acquisition cost is observed.
The decline in value is considered significant for the equity instruments if it reaches 10 per cent of the financial instrument’s cost, and it is considered prolonged if it extends for more than 9 months. When a decline in the fair value of an available-for-sale financial asset has been recognised directly in equity under fair value reserve, and subsequent objective evidence of impairment
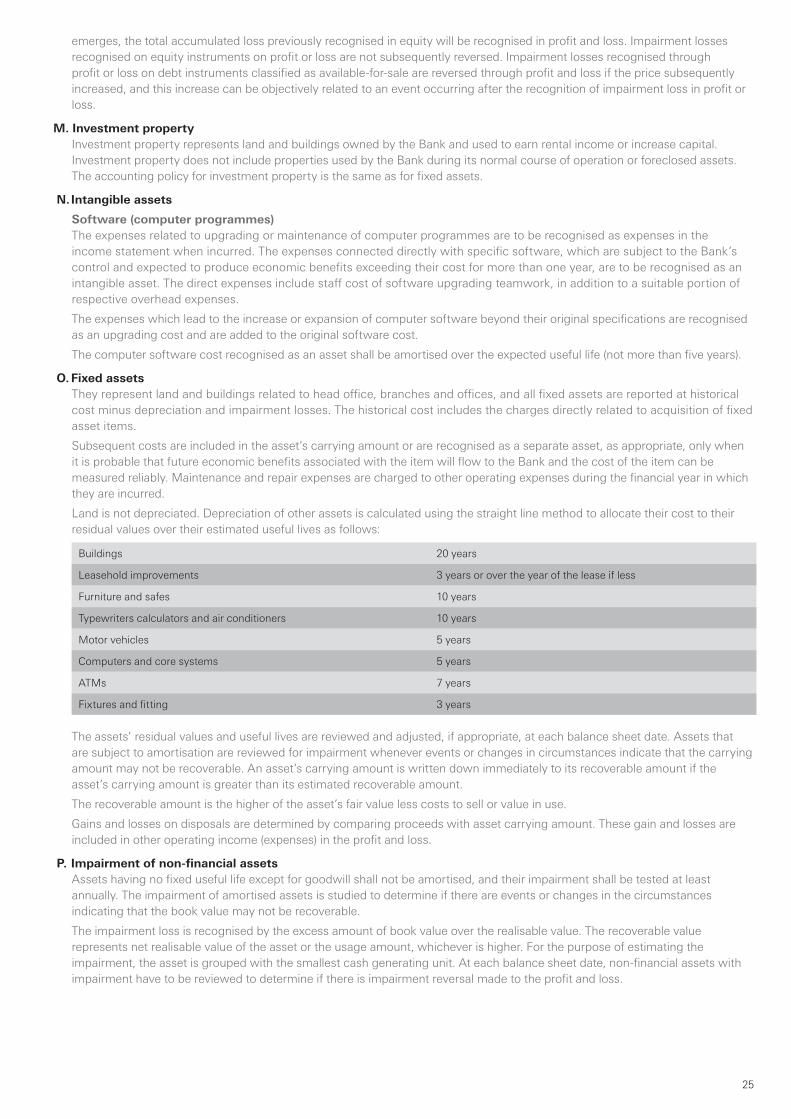
25
emerges, the total accumulated loss previously recognised in equity will be recognised in profit and loss. Impairment losses recognised on equity instruments on profit or loss are not subsequently reversed. Impairment losses recognised through profit or loss on debt instruments classified as available-for-sale are reversed through profit and loss if the price subsequently increased, and this increase can be objectively related to an event occurring after the recognition of impairment loss in profit or loss.
M. Investment propertyInvestment property represents land and buildings owned by the Bank and used to earn rental income or increase capital. Investment property does not include properties used by the Bank during its normal course of operation or foreclosed assets. The accounting policy for investment property is the same as for fixed assets.
N. Intangible assets
Software (computer programmes)The expenses related to upgrading or maintenance of computer programmes are to be recognised as expenses in the income statement when incurred. The expenses connected directly with specific software, which are subject to the Bank’s control and expected to produce economic benefits exceeding their cost for more than one year, are to be recognised as an intangible asset. The direct expenses include staff cost of software upgrading teamwork, in addition to a suitable portion of respective overhead expenses.
The expenses which lead to the increase or expansion of computer software beyond their original specifications are recognised as an upgrading cost and are added to the original software cost.
The computer software cost recognised as an asset shall be amortised over the expected useful life (not more than five years).
O. Fixed assets They represent land and buildings related to head office, branches and offices, and all fixed assets are reported at historical cost minus depreciation and impairment losses. The historical cost includes the charges directly related to acquisition of fixed asset items.
Subsequent costs are included in the asset’s carrying amount or are recognised as a separate asset, as appropriate, only when it is probable that future economic benefits associated with the item will flow to the Bank and the cost of the item can be measured reliably. Maintenance and repair expenses are charged to other operating expenses during the financial year in which they are incurred.
Land is not depreciated. Depreciation of other assets is calculated using the straight line method to allocate their cost to their residual values over their estimated useful lives as follows:
Buildings 20 years
Leasehold improvements 3 years or over the year of the lease if less
Furniture and safes 10 years
Typewriters calculators and air conditioners 10 years
Motor vehicles 5 years
Computers and core systems 5 years
ATMs 7 years
Fixtures and fitting 3 years
The assets’ residual values and useful lives are reviewed and adjusted, if appropriate, at each balance sheet date. Assets that are subject to amortisation are reviewed for impairment whenever events or changes in circumstances indicate that the carrying amount may not be recoverable. An asset’s carrying amount is written down immediately to its recoverable amount if the asset’s carrying amount is greater than its estimated recoverable amount.
The recoverable amount is the higher of the asset’s fair value less costs to sell or value in use.
Gains and losses on disposals are determined by comparing proceeds with asset carrying amount. These gain and losses are included in other operating income (expenses) in the profit and loss.
P. Impairment of non-financial assetsAssets having no fixed useful life except for goodwill shall not be amortised, and their impairment shall be tested at least annually. The impairment of amortised assets is studied to determine if there are events or changes in the circumstances indicating that the book value may not be recoverable.
The impairment loss is recognised by the excess amount of book value over the realisable value. The recoverable value represents net realisable value of the asset or the usage amount, whichever is higher. For the purpose of estimating the impairment, the asset is grouped with the smallest cash generating unit. At each balance sheet date, non-financial assets with impairment have to be reviewed to determine if there is impairment reversal made to the profit and loss.

26
Q. LeasesThe accounting treatment for the finance lease is in accordance with law 95 of year 1995. If the contract entitles the lessee to purchase the asset at a specified date and amount, and the contract term is more than 75 per cent of the asset’s expected useful life, or the current value of the total lease payments represents at least 90 per cent of the value of the asset, then this lease is considered finance lease. Other than that, the lease has to be considered operating lease.
Q.1. LeasingFinance lease contracts recognise rent as expense in the year it occurred in profit and loss, including maintenance cost related to the leased assets.
If the Bank decides to exercise the rights to purchase the leased assets, the cost of this right will be capitalised over the fixed asset and depreciated over the assets’ expected remaining useful life in accordance with similar assets.
Operating lease payments less any discounts granted to lessee are recognised as expenses in the profit and loss using the straight line method over the contract time.
Q.2. Leasing outOperating lease assets are accounted for at the fixed assets caption in the balance sheet and depreciated over the asset expected useful life using the same method applicable to similar assets. The lease rent income less any discount granted to the lessee will be recognised in the profit and loss using the straight line method over the contract term.
R. Cash and cash equivalentsFor the purposes of the cash flows statement, cash and cash equivalents include balances due within three months from the date of acquisition, cash and balances due from the CBE other than the mandatory reserve, and current accounts with banks and Treasury bills.
S. Other provisionsProvisions for restructuring costs and legal claims are recognised when the Bank has a present legal or constructive obligation as a result of past events; it is more likely than not that an outflow of resources will be required to settle the obligation and the amount has been reliably estimated.
Where there are a number of similar obligations, the likelihood that an outflow is required to settle an obligation is determined, taking into consideration the group of obligations as a whole. A provision is recognised even if the likelihood of an outflow with respect to any obligation in the group is minimal.
Provisions no longer required are reversed in other operating income (expense). Provisions are measured at the present value of the best estimate of the consideration required to settle the obligations after one year from the financial statement date using the appropriate rate in accordance with the terms of settlement ignoring the tax effect which reflects the time value of money. If the settlement term is less than one year, the provision is booked using the present value unless time consideration has a significant effect.
T. Financial guarantees contractsThe financial guarantees contracts are contracts issued by the Bank as security for loans or overdrafts due from its customers to other entities, which require the Bank to make certain payments to compensate the beneficiary for a loss incurred due to default of the debtor on maturity date and in accordance with debt instrument conditions. These financial guarantees are given to banks, corporations and other entities on behalf of the Bank’s customers.
It is initially recognised at fair value, including guarantee fees at the date of granting. Subsequently, the Bank’s obligation shall be measured by the value initially recognised, less guarantee fees amortisation, which is recognised in the profit and loss on a straight-line basis over the higher of the guarantee life term or over the best payment estimates required to settle the financial obligation resulting from the financial guarantee at the balance sheet date. These estimates are mainly based on management experience with similar transactions and historical losses.
Any increase in the obligations resulting from the financial guarantee is recognised in ‘other operating income (expenses)’ caption.
U. Employees’ benefits
End of service benefitsThe Bank contributes to the social insurance scheme related to the social insurance authority for the benefit of its employees according to the social insurance law number 79 of 1975 and its amendments. The income statement is charged with these contributions on an accrual basis.
Based on the Bank’s internal scheme, employees are granted end of service bonus according to the service year. Provision is provided based on the present value in light of the actuarial assumptions determined at balance sheet date and is recognised in the consolidated profit or loss under the caption of general and administrative expenses. This provision is presented in the balance sheet under ‘other provisions caption’.
Share-based paymentsHSBC Holding plc grants shares to eligible employees under a share-based payment scheme, ‘equity settled’. HSBC Egypt bears the cost of these shares which are amortised in the profit and loss on a straight-line basis.
V. Income taxThe income tax on the Bank’s income or loss at the end of year includes both the current and deferred taxes. Income tax is recognised in the income statement, except income taxes related to shareholders’ equity items that are recognised directly in the shareholders’ equity.

27
The income tax is calculated on the net taxable income using the effective tax rate at the balance sheet date in addition to prior year tax adjustments.
Deferred tax is recognised due to the temporary differences resulting from reporting the value of assets and liabilities in one year for tax purpose and in another year for financial accounting purpose. Deferred tax is determined based on the method used to realise or settle the current values of these assets and liabilities using the tax rates prevailing at the balance sheet date.
The deferred tax assets shall be recognised if it is probable that sufficient taxable profits shall be realised in the future whereby the asset can be utilised, and the value of deferred tax assets shall be reduced by the value of portion not yielding the expected tax benefit. However, in case tax benefit is highly expected, the deferred tax assets shall increase to the extent of previous reduction.
W. CapitalW.1. Capital cost
Issuance cost directly related to issuing new shares or issuing shares related to acquisition or share options is charged to shareholders’ equity of total proceeds net of tax.
W.2. DividendsDividends are recognised when declared by the General Assembly of shareholders. Those dividends include employees’ share in the profits and the Board of Directors’ remuneration as prescribed by the articles of association and law.
X. Custody activitiesThe Bank practises the custody activities that result in ownerships or management of assets on behalf of individuals, trusts, and retirement benefit plans. These assets and related income are excluded from the Bank’s financial statements as they are assets not owned by the Bank.
Y. Comparative figures The comparative figures shall be reclassified, when necessary, to be in conformity with the changes to presentation used in the current year.
3. Financial risk managementThe Bank, as a result of the activities it exercises, is exposed to various financial risks. Since the basis of financial activity is to accept risks, some risks or group of risks are analysed, evaluated and managed altogether. The Bank intends to strike a balance between the risk and return and to reduce the probable adverse effects on the Bank’s financial performance.
The most important types of risks are credit risk, market risk, liquidity risk and other operating risks. Market risk comprises foreign currency exchange rates, interest rate risk and other pricing risks.
The risk management policies have been laid down to determine and analyse the risks, set limits to the risk and control them through reliable methods and updated systems.
The Bank regularly reviews the risk management policies and systems and amends them to reflect the changes in market, products and services, and the best updated applications.
Those risks are managed by the Risk department in the light of policies approved by Board of Directors. The Risk department determines, evaluates and covers the financial risks, in collaboration with the Bank’s various operating units, and the Board of Directors provides written policies for management of risks as a whole, in addition to written policies covering specific risk areas like credit risk, foreign exchange rate risk, interest rate risk and using the financial derivative and non-derivative instruments. Moreover, the Risk department is independently responsible for annual review of risk management and control environment.
A. Credit risk The Bank is exposed to the credit risk, which is the risk resulting from failure of one party to meet its contractual obligations towards the Bank. The credit risk is considered to be the most significant risk for the Bank. The Bank sets specific procedures to manage that risk. The credit risk in the lending and investments activities that are representing the Bank’s assets contains debt instruments. The credit risk is also found in off-balance sheet financial instruments, like loan commitment. The managing and monitoring process on credit risk is centralised at credit risk team management at the Risk department, which prepares reports for the Board of Directors and heads of units on a regular basis.
A.1. Credit risk measurement
Loans and advances to banks and customersLoans to customers and banks, financial investments debt securities, current accounts and deposits at banks, rights and obligations from others are considered financial assets exposed to credit risk represented in the inability of those parties to settle part or whole of their indebtedness on the date of maturity. The Bank minimises the effect of this risk by the following:
• Preparing detailed credit studies about customers and banks before dealing with them to assess and determine the rates of the credit risk rates related to these
• Obtaining adequate guarantees to reduce the possibility of loss in case of a customer or bank default
• Monitoring and preparing regular studies on customers in order to evaluate their financial and credit position and estimate the required provisions for non-performing balances
• Diversifying loans portfolio among various sectors to minimise the concentration of credit risk
Note No. (A/8) shows the sector diversification of the loans and advances portfolio.

28
The Bank evaluates the customer risk using internal policies for different customer categories. These policies are updated taking into consideration financial analysis and statistical analysis for each customer category in addition to the personal judgement of the credit officer to reach the appropriate grading. The customers are classified into 10 grading, which are divided into four ratings.
The following table shows the rating scale which reflects the range of default probabilities or payment delays by each credit rating category, which means that credit position may transfer from one rating to other depending on the change in the expected degree of risk. The customer’s rating and the rating process are reviewed when necessary. The Bank evaluates the rating process and its expectations regarding the customers’ defaults.
Bank’s internal ratings scale
Rating description Rating
Performing loans 1-6
Regular watching 7
Watch list 8
Non-performing loans 9-10
The amount of default represents the outstanding balances at the time when a late settlement occurred, for example the loans expected amount of default represents its book value. For commitments, the default amount represents all actual withdrawals in addition to any withdrawals occurred until the date of the late payment, if any.
The expected losses or specific losses represent the Bank’s loss expectation of when the settlement is due, which is loan loss percentage that differs according to the type of facility, the availability of guarantees and any other credit cover.
Debt instruments and Treasury bills The same methods used for credit customers are used for debt instruments and Treasury bills. They represent better credit method and a readily available source to meet the funding requirements bills. The Bank uses external ratings, such as Standard and Poor’s rating, MERIS MODES rating and Fitch rating to manage its credit risk.
A.2. Limiting and preventing risks policiesThe Bank manages and controls credit concentrations at the borrowers’ level, groups of borrowers’ level, industries level and countries level.
The Bank manages the credit risk it undertakes by placing limits on the amount of risk accepted in relation to a single borrower or groups of borrowers and to the geographical and industry segments. Such risks are monitored on a regular basis and subject to an annual or more frequent review when considered necessary. The top management reviews on regular basis the sectoral and country credit concentration.
Exposure to credit risk is also managed through regular analysis of the existing and potential borrowers’ ability to meet their obligations and through changing the lending limits where appropriate.
The following are other controls used by the Bank to limit the credit risk:
Collaterals The Bank uses different methods to limit its credit risk. One of these methods is accepting collaterals against loans and advances granted by the Bank. The Bank implements guidelines for collaterals to be accepted. The major types of collateral against loans and advances are:
• real estate mortgage;
• business assets mortgage, such as machines and goods; and
• financial instruments mortgage, such as debt and equity instruments.
The Bank is keen to obtain the appropriate guarantees against corporate entities of long-term finance while individual credit facilities are generally unsecured.
In addition, to minimise the credit loss, the Bank will seek additional collaterals from all counterparties as soon as impairment indicators are noticed for a loan or advance.
The Bank determines type of collaterals held to secure financial assets other than loans and advances according to the nature of the instrument. Generally, debt securities and Treasury bills are unsecured, except for asset-backed securities and similar instruments that are secured by a financial instrument portfolio.
DerivativesThe Bank maintains strict control limits over amounts and terms for the net value of opened derivative positions, ie the difference between purchase and sale contracts. In all cases, the amount subject to credit risk is limited to the current fair value of instruments in which the Bank could gain a benefit from it (ie assets that have positive fair value), which represents a small value of the contract or the notional value. The Bank manages this credit risk, which is considered part of the total customer limit with market changes risk all together. Generally, no collateral is obtained for credit risk related to these instruments, except for marginal deposits required by the Bank from other parties.

29
Settlement risk arises when cash, equity instruments or other financial papers are used in the settlement process or if there is expectation to receive cash, equity instruments or other financial papers. Daily settlement limits are established for each counterparty to cover the aggregate settlement risk arising from the daily Bank transactions.
Master netting arrangementsThe Bank further restricts its exposure to credit losses by entering into master netting arrangements with counterparties of significant volume of transactions. Generally, no netting is made between assets and liabilities at the balance sheet date relating to the master netting arrangements as aggregate settlements are made. However, the credit risk related to contracts to the favour of the Bank is reduced by a master netting arrangement as netting will be made with the counterparty to settle all transactions. The value of the credit risk faced by the Bank changes substantially within a short year of time as it is affected by each transaction occurring in the arrangement.
Credit-related commitmentThe primary purpose of these commitments is to ensure that funds are available to customers when required. Guarantees and standby letters of credit are of the same credit risks as loans.
Documentary and commercial letters of credit, which are issued by the Bank on behalf of customers, by which authorising a third-party to draw within a certain limit in accordance to specific terms and conditions and guaranteed by the goods under shipment, are of lower risk than a direct loan.
Credit-related commitment represents the unused portion of credit limit of loans, guarantees or letters of credit. With respect to credit risk related to credit-related commitments, the Bank is exposed to probable loss of amount equal to the total unused limit. However, the probable amount of loss is less than the unused limit commitments as most commitments represent commitments to customers maintaining certain credit standards. The Bank monitors the maturity term of the credit commitments because long-term commitments are of higher credit risk than short-term commitments.
A.3. Impairment and provisioning policiesThe internal rating systems described in note (A-1) focus more on credit quality at the inception of lending and investment activities. Otherwise, impairment provisions recognised at the balance sheet date for financial reporting purposes are losses that have been incurred and based on objective evidence of impairment, as will be mentioned below. Due to the different methodologies applied, the amounts of incurred credit losses charged to the financial statements are usually lower than the expected amount determined from the expected loss models used.
The impairment provision appeared in the balance sheet at the end of the year is derived from the four internal rating grades. However, the majority of the impairment provision comes from the last two ratings. The table below shows the percentage of on-balance sheet items relating to loans and advances and the related impairment provision for each rating:
2016 2015
Bank’s rating Loans and
advances
Impairment
provision
Loans and
advances
Impairment
provision
Performing loans 78.36% 50% 87.29% 49%
Regular watching 9.40% 9% 3.84% 2%
Watch list 7.08% 8% 5.76% 7%
Non-performing loans 5.16% 33% 3.11% 42%
100% 100% 100% 100%
The Bank’s internal rating assists management to determine whether objective evidence of impairment exists under EAS 26, based on the following criteria set out by the Bank:
• Payment delinquency of principal or interest
• Breach of loan conditions
• Initiation of bankruptcy or entering a liquidation or finance restructures
• Deterioration of the borrower’s competitive position
• For economical or legal reasons, the Bank granted the borrower additional benefits that will not be done in normal circumstances
• Deterioration in the value of collateral
• Deterioration of customer credit status
The Bank policies require review of all financial assets (that exceed specific materiality) at least once a year or more, when required. The impairment loss is determined on an individual basis by determining case-by-case actual losses. These policies applied on all accounts have specific materiality on an individual basis. Valuation usually includes the existing collateral, the related enforcements on these collaterals and the expected collections from those accounts.
Impairment loss provision is formed based on group of similar assets using the historical experience available, personal judgement and statistical methods.

30
A.4. Measurement module banking general riskIn addition to the four categories of credit rating indicated in note (A/1), the management makes more detailed groups in accordance with the CBE requirements. Assets exposed to credit risk in these categories are classified according to detailed conditions and terms depending on the information related to the customer, their activities, financial position and payment schedules.
The Bank calculates the provisions required for impairment of assets exposed to credit risk, including commitments relating to credit on the basis of rates determined by CBE. In case, the provision for impairment losses as per CBE regulations exceeds the provision required for financial statements preparation purposes according to the Egyptian Accounting Standards, this increase shall be debited from the retained earnings and credited to the ‘general banking risk reserve’ under the equity caption. This reserve is regularly adjusted with this increase and decrease, to equal the amount of increase and decrease in the two provisions. This reserve is not distributable. Note 35 shows the ‘general banking risk reserve’ movement during the year.
A.5. Maximum limits for credit risk before collaterals
2016 2015
Balance sheet items exposed to credit risks
Due from banks 23,801,877 12,672,599
Treasury bills 22,694,942 18,568,859
Financial asset held for trading:
Debt instrument 8,773 10,267
Loans to banks 1,285,805 556,702
Loans and advances to customers:
Retail loans:
Overdrafts 99,637 123,098
Credit cards 964,924 888,549
Personal loans 3,906,214 3,216,016
Mortgage loans 5,249 5,818
Corporate loans:
Overdrafts 3,942,899 2,494,626
Direct loans 15,203,577 9,374,055
Syndicated loans 6,103,016 5,138,041
Financial derivative instruments - 13,657
Financial investments:
Debt instruments 2,442,242 4,501,264
Other assets 341,289 255,609
Total 80,800,444 57,819,160
Off-balance sheet items exposed to credit risk
Loan commitments and other irrevocable commitments
related to credit
5,543,596 3,293,941
Letters of credit 1,554,258 1,018,940
Letters of guarantee 19,342,786 10,849,519
Cash covers (2,704,779) (1,223,692)
Total 23,735,861 13,938,708
The above table represents the maximum limit for credit risk as of 31 December 2016 and 31 December 2015, without taking into consideration any collateral. For on-balance-sheet items, amounts stated depend on net carrying amounts shown in the balance sheet.
As shown in the preceding table, 37.41 per cent of the total maximum limit exposed to credit risk resulted from loans and advances to customers against 37.05 per cent as at 31 December 2015 while 3.03 per cent represents investments in debt instruments against 7.87 per cent as at 31 December 2015.

31
The management is confident of its ability to maintain control on an ongoing basis and maintain the minimum credit risk resulting from loan and advances, and debt instruments as follows:
• 87.76 per cent of the loans and advances portfolio is classified at the highest two ratings in the internal rating against 91.13 per cent as at 31 December 2015
• 89.30 per cent of the loans and advances portfolio having no past due or impairment indicators against 94.26 per cent as at 31 December 2015
• Loans and advances that have been evaluated on an individual basis of total amount EGP1,576,218 thousand against EGP675,694 thousand as at 31 December 2015
• Investments in debt instruments and Treasury bills contain more than 85.5 per cent against 99.99 per cent as at 31 December 2015 due from the Egyptian government
A.6. Loans and advances
Loans and advances are summarised as follows:
2016 2015
Neither having past dues nor impaired 26,990,453 20,021,097
Having past due but not impaired 1,658,845 543,412
Subject to impairment 1,576,218 675,694
Total 30,225,516 21,240,203
Less:
Interest in suspense (177,783) (94,306)
Loan loss impairment (1,715,505) (909,156)
Net 28,332,228 20,236,741
The Bank’s total impairment loss for loans and advances amounted to EGP1,715,505 thousand against EGP909,156 thousand as at 31 December 2015, of which EGP579,192 thousand against EGP381,877 thousand as at 31 December 2015 represent impairment of individual loans and the remainder amounting to EGP1,136,313 thousand against EGP527,279 thousand as at 31 December 2015 represent impairment loss for the credit portfolio as a group.
Note 20 includes additional information regarding impairment loss on loans and advances to customers.
The Bank’s portfolio increased by 42.30 per cent during the year. The Bank concentrates on dealing with large institutions or banks or individuals of credit worthiness.
Loans and advances neither having past due nor subject to impairmentThe credit quality of the loans and advances portfolio that are neither having past due nor subject to impairment is determined by the internal rating of the Bank.
2016
Retail Corporate
Rating Rating Overdrafts Credit cards
Personal loans
Mortgage loans
Overdrafts Direct loans Syndicated loans
Total loans and advances to customers
Performing loans 87,288 916,749 3,729,057 4,196 3,473,021 8,660,398 5,225,894 22,096,603
Regular follow-up - - - - 197,051 2,247,373 325,442 2,769,866
Special follow-up - - - - 145,317 1,426,987 551,680 2,123,984
Total 87,288 916,749 3,729,057 4,196 3,815,389 12,334,758 6,103,016 26,990,453
Guaranteed loans are not considered subject to impairment for the non-performing category after taking into consideration the collectability of the guarantees.
2015
Retail Corporate
Rating Rating Overdrafts Credit cards
Personal loans
Mortgage loans
Overdrafts Direct loans Syndicated loans
Total loans and advances to customers
Performing loans 107,943 840,455 3,055,224 5,610 2,348,151 6,960,083 4,749,738 18,067,204
Regular follow-up - - - - 12,989 468,501 264,852 746,342
Special follow-up - - - - 69,244 1,014,856 123,451 1,207,551
Total 107,943 840,455 3,055,224 5,610 2,430,384 8,443,440 5,138,041 20,021,097

32
Loans and advances having past dues and not impairedLoans and advances having past due until 90 days and not considered impaired unless there is information to the contrary. Loans and advances having past but not impaired are as follows:
2016
Retail
Overdrafts Credit cards Personal loans Mortgage loans Total
Past due up to 30 days 9,192 25,360 100,472 1,054 136,078
Past due 30-60 days 1,396 9,498 29,382 - 40,276
Past due 60-90 days 788 6,569 22,536 - 29,893
Total 11,376 41,427 152,390 1,054 206,247
2016
Corporate
Overdrafts Direct loans Syndicated loans Total
Past due up to 30 days - 461,658 - 461,658
Past due 30-60 days - 289,671 - 289,671
Past due 60-90 days - 701,269 - 701,269
Total - 1,452,598 - 1,452,598
In the initial recognition of loans and advances, the fair value of guarantees is assessed based on valuation methods commonly used for similar assets. In subsequent periods, fair value is updated to reflect its market price or price of similar assets.
2015
Retail
Overdrafts Credit cards Personal loans Mortgage loans Total
Past due up to 30 days 12,693 25,361 87,583 207 125,844
Past due 30-60 days 1,395 9,498 30,827 - 41,720
Past due 60-90 days 300 6,569 20,992 - 27,861
Total 14,388 41,428 139,402 207 195,425
2015
Corporate
Overdrafts Direct loans Syndicated loans Total
Past due up to 30 days - 253,382 - 253,382
Past due 30-60 days - 61,566 - 61,566
Past due 60-90 days - 33,039 - 33,039
Total - 347,987 - 347,987
Loans and advances subject to individual impairment
*Loans and advances to customersLoans and advances are subject to individual impairment before taking into consideration cash flows from guarantees amounting to EGP1,576,218 thousand against EGP675,694 thousand as at 31 December 2015.
The breakdown of the total loans and advances subject to individual impairment, including fair value of collateral obtained by the Bank, is as follows:

33
2016
Retail Corporate
Overdrafts Credit
cards
Personal
loans
Mortgage
loans
Overdrafts Direct
loans
Syndicated
loans
Total
Individual loans subject
to impairment972 6,747 24,767 - 127,510 1,416,222 - 1,576,218
Fair value of collateral - - - - - 499,056 - 499,056
2015
Retail Corporate
Overdrafts Credit
cards
Personal
loans
Mortgage
loans
Overdrafts Direct
loans
Syndicated
loans
Total
Individual loans subject
to impairment767 6,666 21,390 - 64,242 582,629 - 675,694
Fair value of collateral - - - - - 304,592 - 304,592
Restructured loans and advances Restructuring activities include extension of payment terms, execution of mandatory management programs, and repayment modification agreements. Application of restructuring policies depend on indicators or standards referring to high probabilities of payment continuation based on management judgment. These policies are reviewed regularly. Restructuring is usually applied to Term loans.
2016 2015
Loans and advances to customers
Corporate
Direct loans 554,084 376,085
Syndicated loans - 457,268
Retail
Personal loans 631 1,250
Total 554,715 834,603
A.7. Debt instruments and Treasury billsThe table below shows an analysis of debt instruments and Treasury bills according to the rating agencies at the end of the financial year (MERIS-Reuters).
Treasury bills Investments in securities Total
AAA - 25,917 25,917
AA- to AA+ - 2,219 2,219
Less than A- 22,694,942 2,422,879 * 25,117,821
Total 22,694,942 2,451,015 25,145,957
* Represented in Egyptian government bonds.

34
A.8. Concentration of risks of financial assets exposed to credit risk
Geographical sectorsThe following table represents a breakdown of the Bank’s significant credit risk limits at their carrying amounts distributed by geographical sector.
Arab Republic of Egypt
Cairo Alexandria and Delta Upper Egypt, Sinai
and Red sea
Total
EGP (000)
Due from banks 23,801,877 - - 23,801,877
Treasury bills 22,694,942 - - 22,694,942
Financial assets held for trading
Debt instruments 8,773 - - 8,773
Loans and advances to banks 1,285,805 - - 1,285,805
Loans and advances to customers
Retail:
Overdrafts 75,943 17,558 6,136 99,637
Credit cards 964,924 - - 964,924
Personal loans 3,509,230 296,340 100,644 3,906,214
Mortgage loans 4,944 - 305 5,249
Corporate:
Overdrafts 3,663,517 259,972 19,410 3,942,899
Direct loans 12,819,622 2,172,468 211,487 15,203,577
Syndicated loans 5,616,442 220,322 266,252 6,103,016
Derivative financial instruments - - - -
Financial investment:
Debt instruments 2,442,242 - - 2,442,242
Other assets 326,126 10,104 5,059 341,289
Total as at 31 December 2016 77,214,387 2,976,764 609,293 80,800,444
Total as at 31 December 2015 55,498,223 1,676,231 402,343 57,576,797

35
Business sectorsThe following table represents breakdown of the most significant credit risk limits at their carrying amounts distributed according to the business of the Bank’s customers:
Industrial
sector
Commercial
sector
Service
sector
Governmental
sector
Other
activities
Individuals Total
Due from banks - - - 23,801,877 - - 23,801,877
Treasury bills - - - 22,694,942 - - 22,694,942
Financial assets held for
trading
Debt instruments - - - 8,773 - - 8,773
Loans and advances to
banks- - - 1,285,805 - - 1,285,805
Loans and advances to
customers
Retail:
Overdrafts - - - - - 99,637 99,637
Credit cards - - - - - 964,924 964,924
Personal loans - - - - - 3,906,214 3,906,214
Mortgage loans - - - - - 5,249 5,249
Corporate:
Overdrafts 1,174,953 444,103 1,857,587 50,224 416,032 - 3,942,899
Direct loans 9,629,071 1,160,710 4,413,796 - - - 15,203,577
Syndicated loans 2,093,397 - 1,996,660 1,442,791 570,168 - 6,103,016
Financial investment:
Debt instruments - - - 2,442,242 - - 2,442,242
Other assets - - - - 341,289 - 341,289
Total as at 31 December
201612,897,421 1,604,813 8,268,043 51,726,654 1,327,489 4,976,024 80,800,444
Total as at 31 December
20158,200,360 1,608,302 5,107,265 35,948,319 2,479,070 4,233,481 57,576,797
B. Market riskThe Bank is exposed to market risk, which is the risk of fair value or future cash flow fluctuations from changes in open market price changes. Market risks arise from open market related to interest rate, currency, and equity products of which each is exposed to general and specific market movements and changes in sensitivity levels of market rates or prices, such as interest rates, foreign exchange rates and equity instrument prices. The Bank divides its exposure to market risk into trading and non-trading portfolios.
The Bank Treasury is responsible for managing the market risks arising from trading and non-trading activities which are monitored by two separate teams. Regular reports about market risk are submitted to the Board of Directors and each business unit head periodically.
Trading portfolios include transactions where the Bank deals direct with clients or with the market; non-trading portfolios primarily arise from managing assets and liabilities interest rate price relating to retail transactions. Non-trading portfolios also include foreign exchange risk and equity instruments risks arising from the Bank’s held-to-maturity and available-for-sale investments portfolios.

36
B.1. Market risk measurement techniquesAs part of market risk management the Bank undertakes various hedging strategies and enters into swaps to match the interest rate risk associated with the fixed-rate long-term loans if the fair value option has been applied. The major measurement techniques used to measure and control market risk are outlined below:
Value at riskThe Bank applies a ‘value-at-risk’ methodology (VAR) for trading and non-trading portfolios to estimate the market risk of positions held and the maximum expected losses based on several assumptions for various changes in market conditions. The Board sets separate limits for the value of risk that may be accepted by the Bank for trading and non-trading portfolios and monitored by the ALCO committee.
VAR is a statistical estimation of the expected losses on the current portfolio from adverse market movements in which it represents the ‘maximum’ amount the Bank expects to lose using confidence level of 98 per cent. Therefore, there is a statistical probability of 2 per cent that actual losses could be greater than the VAR estimation. The VAR module assumes that the holding period is 10 days before closing the opening position. It also assumes that market movements during the holding period will be the same as 10 days before. The Bank’s assessment of past movements is based on data for the current year. The Bank applies these historical changes in rates, prices, indicators etc directly to its current positions. This approach is called historical simulation. Actual outcomes are monitored regularly to test the validity of the assumptions and factors used in the VAR calculation.
The use of this approach does not prevent losses from exceeding these limits if there are significant market movements.
As VAR is considered a primary part of the Bank’s market risk control technique, VAR limits are established by the Board annually for all trading and non-trading transactions and allocated to business units. Actual values exposed to market risk are compared to the limits established by the Bank and reviewed by the ALCO committee.
The average daily VAR for the Bank during the current year was EGP43,332 thousand, against EGP11,775 thousand for 2015.
The quality of the VAR model is continuously monitored through examining the VAR results for the trading portfolio, and results are reported to the top management and Board of Directors.
Stress testingStress testing provides an indicator of the expected losses that may arise from sharp adverse circumstances. It is designed to match business using standard analysis for specific scenarios. It is carried out by the Bank Treasury. It includes risk factor stress testing where sharp movements are applied to each risk category and tests emerging market stress as emerging market portfolios are subject to sharp movements and special stress, including possible stress events to specific positions or regions, for example, the stress outcome to a region applying a free currency rate.
The results of the stress testing are reviewed by top management and Board of directors.
B.2. VAR summary
According to risk type
2016 2015
Average High Low Average High Low
Foreign exchange risk 41,518 339,106 2,542 11,127 44,104 2,271
Interest rate risk 1,814 2,369 1,241 648 1,449 342
Total VAR 43,332 341,475 3,783 11,775 45,553 2,613
Trading portfolio VAR by risk type
2016 2015
Average High Low Average High Low
Foreign exchange risk 41,518 339,106 2,542 11,127 44,104 2,271
Interest rate risk 35 113 2 35 62 10
Total VAR 41,553 339,219 2,544 11,162 44,166 2,281
Non-trading portfolio VAR by risk type
2016 2015
Average High Low Average High Low
Interest rate risk 1,849 2,391 1,243 679 1,458 386
Total VAR 1,849 2,391 1,243 679 1,458 386

37
The increase in VAR, especially interest rate risk, is mainly in proportion to the increase in market interest rates volatility in the global financial markets.
The above three VAR results are calculated independently from the underlying positions and historical market movements. The aggregate of the trading and non-trading VAR results does not represent the Bank’s VAR due to correlations of risk types and portfolio types and their effect. The above three VAR results are before stress testing.
B.3. Foreign exchange volatility riskThe Bank is exposed to foreign exchange rate volatility risk in terms of the financial position and cash flows. The Board of Directors sets aggregate limits for foreign exchange in the total value (summation value) for each position at the end of the day and during the day that is controlled on a timely basis. The following table summarises the Bank’s exposure to foreign exchange volatility risk at the end of the year. The following table includes the carrying amounts of the financial instruments in their currencies:
2016 EGP USD EUR GBP Other Total
Financial assets:
Cash and balances with Central bank
(3,402,123) (4,498,332) (67,707) (25,785) (17,749) (8,011,696)
Due from banks (9,576,757) (11,387,151) (779,016) (1,574,408) (484,545) (23,801,877)
Treasury bills (17,268,236) (5,426,706) - - - (22,694,942)
Financial assets held for trading (8,773) - - - - (8,773)
Loans and advances to banks (160,588) (1,125,217) - - - (1,285,805)
Loans and advances to customers (13,002,059) (12,123,431) (3,032,836) (150,864) (23,038) (28,332,228)
Financial investments:
Available-for-sale (2,465,087) - - - - (2,465,087)
Held-to-maturity (21,292) - - - - (21,292)
Other financial assets (238,817) (100,765) (19,644) (3,863) - (363,089)
Total financial assets (46,143,732) (34,661,602) (3,899,203) (1,754,920) (525,332) (86,984,789)
Financial liabilities
Due to banks 4,606,191 896,541 200,413 69,104 - 5,772,249
Customer deposits 31,355,887 33,408,441 3,703,430 1,613,845 474,587 70,556,190
Other financial liabilities 460,171 23,983 534 316 - 485,004
Total financial liabilities 36,422,249 34,328,965 3,904,377 1,683,265 474,587 76,813,443
Net financial position (9,721,483) (332,637) 5,174 (71,655) (50,745) (10,171,346)
Commitments related to credit and contingent liabilities
6,383,272 12,273,564 2,574,962 31,937 2,472,126 23,735,861
2015
Total financial assets (42,797,336) (17,069,168) (2,063,136) (932,343) (108,468) (62,970,451)
Total financial liabilities 36,203,142 17,014,476 2,016,236 960,158 190,040 56,384,052
Net financial position – balance sheet
(6,594,194) (54,692) (46,900) 27,815 81,572 (6,586,399)
Commitments related to credit and contingent liabilities
4,685,377 5,970,088 2,186,712 20,976 1,075,555 13,938,708

38
B.4. Interest rate riskCash flow interest rate risk is the risk that the future cash flows of a financial instrument will fluctuate because of changes in market interest rates. Fair value interest rate risk is the risk that the value of a financial instrument will fluctuate because of changes in market interest rates. The Bank is exposed to the effect of fluctuations in the prevailing levels of market interest rates on both its fair value and cash flow risks. Interest margins may increase as a result of such changes but profit may decrease in the event that unexpected movements arise. The Board sets limits on the level of mismatch of interest rate repricing that may be undertaken, which are monitored daily by Bank Treasury.
The table below summarises the Bank’s exposure to interest rate risks. It includes the Bank’s financial instruments at carrying amounts categorised by the earlier repricing or maturity dates:
2016 Up to one month
1-3 Months 3-12 Months 1-5 years Without Interest
Total
Financial assets:
Cash and balances with Central bank
- (4,215,780) - - (3,795,916) (8,011,696)
Due from banks (20,970,295) (1,899,662) - - (931,920) (23,801,877)
Treasury bills - (9,031,525) (13,663,417) - - (22,694,942)
Financial assets held for trading (8,773) - - - - (8,773)
Loans and advances to banks - - - (1,285,805) - (1,285,805)
Loans and advances to customers (12,021,549) (2,453,760) (2,182,865) (11,674,054) - (28,332,228)
Financial investments:
Available-for-sale - - (1,422,984) (1,019,258) (22,845) (2,465,087)
Held-to-maturity - - - - (21,292) (21,292)
Other financial assets - - - - (363,089) (363,089)
Total financial assets (33,000,617) (17,600,727) (17,269,266) (13,979,117) (5,135,062) (86,984,789)
Financial liabilities
Due to banks - - 2,800,000 - 2,972,249 5,772,249
Customer deposits 26,537,291 3,083,879 3,063,026 6,548,303 31,323,691 70,556,190
Other financial liabilities - 272,000 - - 213,004 485,004
Total financial liabilities 26,537,291 3,355,879 5,863,026 6,548,303 34,508,944 76,813,443
Interest repricing gap (6,463,326) (14,244,848) (11,406,240) (7,430,814) 29,373,882 (10,171,346)
2015
Total financial assets (19,711,411) (7,522,060) (17,962,659) (13,049,265) (4,725,056) (62,970,451)
Total financial liabilities 22,869,535 1,768,228 1,976,774 4,447,881 25,321,634 56,384,052
Interest repricing gap 3,158,124 (5,753,832) (15,985,885) (8,601,384) 20,596,578 (6,586,399)
C. Liquidity risk Liquidity risk represents the Bank’s difficulty in meeting its financial commitments when they fall due and replacing funds when they are withdrawn. This may result in failure in fulfilling the Bank’s obligation to repay depositors and fulfilling lending commitments.
Liquidity risk management process
The Bank’s liquidity management process carried out by the Bank Treasury department includes the following:
• Daily funding managed by monitoring future cash flows to ensure that all requirements can be met when due. This includes availability of liquidity as they due or to be borrowed to customers. To ensure that the Bank reaches its objective, the Bank maintains an active presence in global money markets
• The Bank maintains a portfolio of highly marketable and diverse assets that are assumed to be easily liquidated in the event of an unforeseen interruption of cash flow
• Monitoring liquidity ratios in relation with internal requirements and CBE requirements
• Managing loans’ concentration and dues
• Monitoring and reporting takes the form of cash flow measurement and projections for the next working day, week and month respectively, as these are key periods for liquidity management.
The starting point of calculating these expectations is analysing the financial liabilities dues and expected financial assets collections.
The Credit Risk department monitors the mismatch between medium-term assets, the level and nature of unused loans limits, overdraft utilisations, and the effect of contingent liabilities such as letters of guarantees and letters of credit.

39
Non-derivative cash flows
The below table represents the undiscounted contractual cash flows listed according to the remaining period of the contractual maturities.
2016
Financial liabilities Up to1 month
Over than 1 month to
3 months
Over than 3 months to
1 year
Over than 1 year to
5 years
More than 5 years
Total
Demand deposits 28,548,697 - - - - 28,548,697
Saving deposits 19,903,807 - - - - 19,903,807
Accrued interest on saving deposits 74,992 - - - - 74,992
Time deposits and Saving certificates 5,760,796 3,139,840 3,104,478 9,012,376 3,820 21,021,310
Other deposits 3,669,213 - - - - 3,669,213
Due to banks 4,490,474 - 1,353,681 - - 5,844,155
Other loans 4,447 8,464 39,449 209,583 638,520 900,463
Total of financial liabilities according to maturity date
62,452,426 3,148,304 4,497,608 9,221,959 642,340 79,962,637
2015
Financial liabilities Up to1 month
Over than 1 month to
3 months
Over than 3 months to
1 year
Over than 1 year to
5 years
More than 5 years
Total
Demand deposits 23,534,159 - - - - 23,534,159
Term deposits 356,107 - - - - 356,107
Saving deposits 15,184,192 - - - - 15,184,192
Accrued interest on saving deposits 63,923 - - - - 63,923
Saving certificates 4,979,726 1,786,184 2,010,061 4,015,700 106,969 12,898,640
Other deposits 1,774,482 - - - - 1,774,482
Due to banks 1,598,173 - 1,400,000 - - 2,998,173
Other loans 3,523 6,819 31,252 166,034 603,840 811,468
Total of financial liabilities according to maturity date
47,494,285 1,793,003 3,441,313 4,181,734 710,809 57,621,144
Funding approach
Sources of liquidity are regularly reviewed by managing the Bank Treasury to maintain a wide diversification by currency, geography region, source, products and terms.
Off-balance sheet items
According to the table below and note 38
2016
Up to 1 year
Over 1 year and less
than 5 years
More than 5 years Total
Letter of credit commitments 1,554,258 - - 1,554,258
Loans commitments 5,047,568 - - 5,047,568
Letter of guarantees 17,134,035 - - 17,134,035
Operating lease commitments 10,455 25,948 11,667 48,070
Total 23,746,316 25,948 11,667 23,783,931
2015
Up to 1 year
Over 1 year and less
than 5 years
More than 5 years Total
Letter of credit commitments 1,018,940 - - 1,018,940
Loans commitments 2,884,369 - - 2,884,369
Letter of guarantees 10,035,399 - - 10,035,399
Operating lease commitments 18,430 21,219 19,167 58,816
Total 13,957,138 21,219 19,167 13,997,524
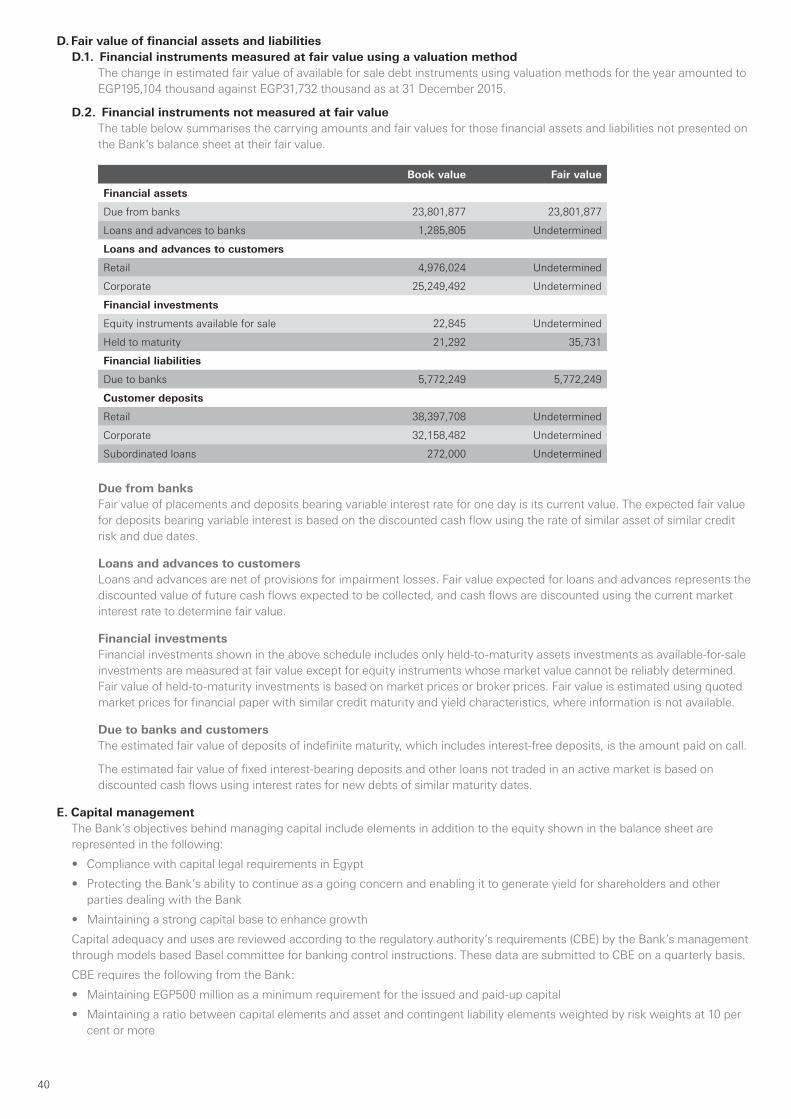
40
D. Fair value of financial assets and liabilitiesD.1. Financial instruments measured at fair value using a valuation method
The change in estimated fair value of available for sale debt instruments using valuation methods for the year amounted to EGP195,104 thousand against EGP31,732 thousand as at 31 December 2015.
D.2. Financial instruments not measured at fair value The table below summarises the carrying amounts and fair values for those financial assets and liabilities not presented on the Bank’s balance sheet at their fair value.
Book value Fair value
Financial assets
Due from banks 23,801,877 23,801,877
Loans and advances to banks 1,285,805 Undetermined
Loans and advances to customers
Retail 4,976,024 Undetermined
Corporate 25,249,492 Undetermined
Financial investments
Equity instruments available for sale 22,845 Undetermined
Held to maturity 21,292 35,731
Financial liabilities
Due to banks 5,772,249 5,772,249
Customer deposits
Retail 38,397,708 Undetermined
Corporate 32,158,482 Undetermined
Subordinated loans 272,000 Undetermined
Due from banksFair value of placements and deposits bearing variable interest rate for one day is its current value. The expected fair value for deposits bearing variable interest is based on the discounted cash flow using the rate of similar asset of similar credit risk and due dates.
Loans and advances to customers Loans and advances are net of provisions for impairment losses. Fair value expected for loans and advances represents the discounted value of future cash flows expected to be collected, and cash flows are discounted using the current market interest rate to determine fair value.
Financial investments Financial investments shown in the above schedule includes only held-to-maturity assets investments as available-for-sale investments are measured at fair value except for equity instruments whose market value cannot be reliably determined. Fair value of held-to-maturity investments is based on market prices or broker prices. Fair value is estimated using quoted market prices for financial paper with similar credit maturity and yield characteristics, where information is not available.
Due to banks and customers The estimated fair value of deposits of indefinite maturity, which includes interest-free deposits, is the amount paid on call.
The estimated fair value of fixed interest-bearing deposits and other loans not traded in an active market is based on discounted cash flows using interest rates for new debts of similar maturity dates.
E. Capital management The Bank’s objectives behind managing capital include elements in addition to the equity shown in the balance sheet are represented in the following:
• Compliance with capital legal requirements in Egypt
• Protecting the Bank’s ability to continue as a going concern and enabling it to generate yield for shareholders and other parties dealing with the Bank
• Maintaining a strong capital base to enhance growth
Capital adequacy and uses are reviewed according to the regulatory authority’s requirements (CBE) by the Bank’s management through models based Basel committee for banking control instructions. These data are submitted to CBE on a quarterly basis.
CBE requires the following from the Bank:
• Maintaining EGP500 million as a minimum requirement for the issued and paid-up capital
• Maintaining a ratio between capital elements and asset and contingent liability elements weighted by risk weights at 10 per cent or more

41
The numerator in capital adequacy comprises the following two tiers:
• Tier 1: It is the basic capital comprising of (going concern capital and additional going concern capital)
• Tier 2: It is the gone concern capital comprising:
– 45 per cent of the increase between the fair value and carrying amount for (fair value reserve if positive, available-for-sale investments, held-to-maturity investments, investments in subsidiaries)
– 45 per cent of the special reserves
– 45 per cent of positive foreign currency reserves
– Embedded derivatives
– Loans (deposits) subordinated
– Provision for impairment losses for loans and contingent liabilities (not exceeding 1.25 per cent of total assets and contingent liabilities applying the risk weights, the provision for the non-performing loans, contingent liabilities) must be enough to face any liabilities it formed for.
The denominator of the capital adequacy comprises:
1. Credit risk
2. Market risk
3. Operational risk
Assets are weighted by risk in a range from 0 per cent to 100 per cent. Classification is made according to the debit party for each asset to reflect the related credit risk, taking into consideration cash guarantees. The same treatment is used for the off-balance sheet amounts after making relevant adjustments to reflect the contingent nature and the potential loss for these amounts.
The Bank complied with all internal requirements during the last years. The schedule below shows the calculation of the capital adequacy ratio for the year according to Basel II:
2016 2015
Capital
Tier 1 after disposals (going concern capital)
Share capital 2,795,568 2,795,568
Reserves 1,936,176 1,682,901
Retained earnings 742,300 (11,093)
Additional going concern capital 459 498
Total disposals from going concern capital (353,712) (144,106)
Total going concern capital after disposals (common equity) 5,120,791 4,323,768
Tier 2 (gone concern capital)
45 per cent of fair value of available-for-sale investments - 24,934
45 per cent of fair value of held-to-maturity investments 6,497 7,596
Subordinated (deposits) loans 272,000 272,000
Performing impairment losses provision for loans and advances contingent liabilities
517,336 359,363
Total tier 2 after disposals (gone concern capital) 795,833 663,893
Total capital adequacy after disposals (1+2) 5,916,624 4,987,661
Risk (credit, market and operational)
Credit risk 41,386,966 28,998,307
Market risk 1,237 -
operational risk 712,143 567,483
Total credit, market and operational risks 48,520,766 34,673,142
Capital adequacy ratio (%) 12.19% 14.38%
F. Leverage financial ratioCentral Bank of Egypt Board of Directors had approved in its meeting held on July 7, 2015 the special supervisory instructions related to leverage ratio while ensuring maintaining a minimum level of leverage ratio of 3 per cent to be reported on a quarterly basis as follows:
• As guidance ratio started from reporting period September 2015 till December 2017.
• As obligatory ratio started from year 2018.
This ratio will be included in Basel requirement tier 1 in order to maintain Egyptian Banking system strong and safe, as long to keep up with best international regulatory treatments.

42
Leverage ratio reflects relationship between tier 1 for capital that is used in capital adequacy ratio (after disposals) and other assets (on-balance sheet and off-balance sheet) that are not risk weighted assets.
Ratio elements
a. The numerator elements The numerator consists of tier 1 capital that is used in capital adequacy ratio (after disposals) in accordance with the requirements of the regulatory authority represented by the Central Bank of Egypt (CBE).
b. The dominator elementsThe dominator consists of all bank assets (on-balance sheet and off-balance sheet) according to the financial statements, called “Bank exposures” which includes the following:
1. On-balance sheet items after deducting some of tier 1 exclusions for capital base
2. Derivatives contracts exposures
3. Financing financial papers operations exposures
4. Off-balance sheet items (weighted by credit conversion factor)
The table below summarizes the leverage financial ratio:
2016 2015
Tier 1 after disposals (going concern capital) 5,120,790 4,323,768
Total on-balance sheet exposures, derivatives contracts and financial papers operations
88,711,638 63,197,320
Total off- balance sheet exposures 14,922,262 8,682,699
Total exposures on-balance sheet and off-balance sheet 103,633,900 71,880,019
Leverage financial ratio (%) 4.94% 6.02%
4. Significant accounting estimates and assumptionsThe Bank makes subjective estimates and judgements that affect the reported amounts of assets and liabilities in the next financial year. Consistent estimations and judgements are continually evaluated and are based on historical experience and other factors, including the expectations of future events that are believed to be reasonable through the available information and circumstances.
A. Impairment losses for loans and advances The Bank reviews the portfolio of loans and advances at least quarterly. The Bank uses discretionary judgement on determining whether it is necessary to record impairment loss in the income statement. The Bank has to identify if there is objective evidence indicating a decline in the expected future cash flows from loan portfolio before identifying any decline on an individual basis. This evidence includes data indicating negative changes in a borrower’s portfolio ability to repay the Bank, or local or economic circumstances related to default. On scheduling future cash flows, the management uses past experience to determine the credit impairment loss for assets when there is objective evidence of impairment similar to that of the portfolio in question. The methods and assumptions used in estimating both the amount and timing of the future cash flows are reviewed on a regular basis to minimise any discrepancy between the estimated loss and actual loss based on experience.
B. Impairment of available-for-sale equity investmentsThe Bank recognises impairment loss relating to available-for-sale equity investments when there is a significant or prolonged decline in the fair value below its cost. A judgement is required to determine that the decline is significant or prolonged. In making this judgement, the Bank evaluates among other factors the volatility in share price. In addition, impairment loss is recognised when there is evidence of deterioration in the investee’s financial position or operating/finance cash flow industry and sector performance technology changes.
C. Fair value of derivativesFair value of financial instruments not quoted in an active market is determined using valuation techniques. These techniques (as models) are tested and reviewed yearly using qualified independently personnel other than those who prepared the techniques. All the models were prepared before and after using them to ensure that their results reflect accurate data and prices comparable to the market. These models are used to the extent it is practical actual data; however, some areas such as credit risk related to the Bank and counterparty volatility and correlations require management estimations. Changes in these estimation factors can affect the financial instrument’s fair value disclosure. For example, to the extent that management uses credit marginal less than 20 points, the estimated net fair value of derivatives amounted to EGP Nil thousand in assets against EGP Nil thousand in liabilities that represent its fair value as shown in note 21.

43
D. Held-to-maturity investmentsNon-derivatives financial assets with fixed or determinable payments and fixed maturity are classified as held-to-maturity. This classification requires a high degree of judgement; in return, the Bank tests the intent and ability to hold such investments to maturity. If the Bank fails to hold such investments until maturity except for certain circumstances (selling an insignificant amount of held-to-maturity investments near to maturity date), then all held-to-maturity investment portfolio should be reclassified as available-for-sale, which will be measured at fair value instead of amortised cost. In addition, the Bank should suspend classifying investments as held-to-maturity caption.
If classification of investments as held-to-maturity is suspended, the carrying amount shall increase by EGP14,439 thousand to reach its fair value by increasing the valuation reserve available for sale within the equity caption.
E. Income taxThe Bank is subject to income tax which requires the use of estimates to calculate the income tax provision. There are several complicated processes and calculations to determine the final income tax. The Bank records a liability related to the tax inspection estimated results. When there is a difference between the final result of the actual tax inspection and the amounts previously recorded by the Bank, such differences will be recorded in the year where differences are noted. Income tax and deferred tax will be recorded in that year.
5. Segment analysis
A. By activity segment Activity segment includes operations and assets used in providing banking services and managing related risks and yields which may differ from other activities. The segmentation analyses of operations according to the Banking activities are as follows:
• Large enterprises medium and small Activities include current accounts deposits, overdraft loans credit facilities and financial derivatives.
• Investment Includes merging of the company’s purchase of investments, financing company’s restructure and financial instruments.
• Individuals Activities include current account savings deposits, credit cards, personal loans and mortgage loans.
• Other activities
– Includes other banking activities such as fund management
– Inter-segment transactions occur in the normal course of the Bank’s business. Assets and liabilities at the balance sheet include operating assets and liabilities.
31 December 2016
Corporate Medium and small
enterprises
Global Markets
RBWM Other activities
Total
Income and expenses according to activity segment
Income activity segment 3,220,853 258,344 1,023,292 1,347,413 97,968 5,947,870
Expenses activity segment (660,051) (30,342) (35,783) (671,286) (55,692) (1,453,154)
Profit before tax 2,560,802 228,002 987,509 676,127 42,276 4,494,716
Tax (627,746) (56,642) (196,912) (135,210) (3) (1,016,513)
Profit for the year 1,933,056 171,360 790,597 540,917 42,273 3,478,203
Assets and liabilities according to activity segment
Assets activity segment (80,510,625) (1,555,132) - (4,011,133) (1,557,940) (87,634,830)
Total assets (80,510,625) (1,555,132) - (4,011,133) (1,557,940) (87,634,830)
Liabilities activity segment 41,671,996 3,949,557 96,365 38,569,757 3,347,155 87,634,830
Total liabilities and equity 41,671,996 3,949,557 96,365 38,569,757 3,347,155 87,634,830

44
31 December 2015
Corporate Medium and small
enterprises
Global Markets
RBWM Other activities
Total
Income and expenses according to activity segment
Income activity segment 2,273,924 213,907 796,603 1,223,638 84,818 4,592,890
Expenses activity segment (446,782) (70,584) (30,257) (714,020) - (1,261,643)
Profit before tax 1,827,142 143,323 766,346 509,618 84,818 3,331,247
Tax (465,880) (33,445) (194,797) (104,261) (59) (798,442)
Profit for the year 1,361,262 109,878 571,549 405,357 84,759 2,532,805
Assets and liabilities according to activity segment
Assets activity segment (54,218,769) (996,311) - (3,345,011) (4,954,345) (63,514,436)
Total assets (54,218,769) (996,311) - (3,345,011) (4,954,345) (63,514,436)
Liabilities activity segment 29,220,395 2,817,822 58,383 26,711,982 4,705,854 63,514,436
Total liabilities and equity 29,220,395 2,817,822 58,383 26,711,982 4,705,854 63,514,436
B. Analysis according to the geographical segment
31 December 2016
Arab Republic of Egypt
Cairo Alexandria and Delta
Upper Egypt, Sinai and Red sea
Total
Income and expenses according to geographical segment
Income geographical segment 5,613,781 362,920 41,051 6,017,752
Expenses geographical segment (1,486,893) (24,947) (11,196) (1,523,036)
Profit before tax 4,126,888 337,973 29,855 4,494,716
Tax (1,016,513) - - (1,016,513)
Profit for the year 3,110,375 337,973 29,855 3,478,203
Assets and liabilities according to geographical segment
Assets geographical segment (83,805,274) (3,172,610) (656,946) (87,634,830)
Total assets (83,805,274) (3,172,610) (656,946) (87,634,830)
Liabilities geographical segment 79,778,185 6,592,778 1,263,867 87,634,830
Total liabilities and equity 79,778,185 6,592,778 1,263,867 87,634,830
31 December 2015
Arab Republic of Egypt
Cairo Alexandria and Delta
Upper Egypt, Sinai and Red sea
Total
Income and expenses according to geographical segment
Income geographical segment 4,308,148 225,318 43,454 4,576,920
Expenses geographical segment (1,202,278) (25,593) (17,802) (1,245,673)
Profit before tax 3,105,870 199,725 25,652 3,331,247
Tax (798,442) - - (798,442)
Profit for the year 2,307,428 199,725 25,652 2,532,805
Assets and liabilities according to geographical segment
Assets geographical segment (61,147,708) (1,930,670) (436,058) (63,514,436)
Total assets (61,147,708) (1,930,670) (436,058) (63,514,436)
Liabilities geographical segment 57,812,952 4,703,706 997,778 63,514,436
Total liabilities and equity 57,812,952 4,703,706 997,778 63,514,436

45
6. Net interest income
2016 2015
Interest from loans and similar income:
Loans and advances to customers 2,290,344 1,779,138
Loans and advances to banks 24,729 8,194
Treasury bills and Treasury bonds 2,519,773 1,884,449
Deposits and current accounts 797,010 374,135
Investments in debt instruments available-for-sale 504,459 618,596
6,136,315 4,664,512
Interest on deposits and similar expenses:
Deposits and current accounts:
Banks (571) (290)
Customers (1,170,040) (1,010,909)
Other loans (41,989) (36,375)
(1,212,600) (1,047,574)
Net 4,923,715 3,616,938
7. Net fees and commissions income
2016 2015
Fees and commissions income:
Fees and commissions related to credit 847,381 712,327
Custody fees 16,718 38,562
Other fees 8,976 11,892
873,075 762,781
Fees and commissions expenses:
Brokerage fees paid (2,412) (4,795)
Other fees paid (121,770) (89,016)
(124,182) (93,811)
Net 748,893 668,970
8. Dividends income
2016 2015
Available-for-sale investments 3,973 3,597
Net 3,973 3,597
9. Net trading income
2016 2015
Foreign exchange operations:
Gain from foreign currency transactions 139,987 190,734
Gain from debt instruments held for trading 10,383 3,400
(Loss)/gain from forward deals revaluation (368) 328
Net 150,002 194,462
10. Administrative expenses
2016 2015
Staff costs
Wages and salaries 310,771 348,727
Social insurance 18,190 17,153
End of Service Compensation 54,651 51,210
383,612 417,090
Other administrative expenses 911,569 804,110
1,295,181 1,221,200

46
11. Other operating income
2016 2015
Profit from revaluation of monetary assets and liabilities determined in foreign currency other than those classified for trading or originally classified at fair value through profit and loss
220,991 12,092
Gain/(Loss) from sale of property and equipment 11,336 (1,958)
Operating lease 34,763 41,459
Amortization of investments in property (6,718) (7,335)
Accruals no longer required 6,243 10,601
Losses from selling of financial assets (155,948) -
Other provision (loss) (33,262) 7,230
Gain from services provided to operation lease user 2,463 2,797
Head office services revenue 27,664 25,415
Customer settlements - 34,516
Other 1,963 2,232
Net 109,495 127,049
12. Credit impairment (charged)
2016 2015
Loans and advances to customers
Impairment losses (173,136) (143,385)
Impairment recovery 16,526 79,875
Net (156,610) (63,510)
13. Income tax expenses
2016 2015
Current taxes (1,060,880) (787,006)
Prior year adjustments 39,723 4,412
Deferred tax (note 32) 4,644 (15,848)
Net (1,016,513) (798,442)
Note 32 shows additional information about deferred income tax. Income taxes differ when current applicable tax rates are used, as follows:
2016 2015
Income tax calculated on accounting profit 4,494,716 3,331,247
Tax rate 22.50% 22.50%
Add (less) 1,011,311 749,531
Non-deductible expenses 9,811 31,523
Prior year adjustments (39,721) (4,412)
Tax exemptions (894) -
Provisions 16,777 -
Interest in suspense 19,229 -
Deferred tax impact - 21,800
Total differences 5,202 48,911
Income tax according to the tax return 1,016,513 798,442
Net income tax 1,016,513 798,442
Effective tax rate 22.62% 23.97%

47
Taxation position
A summary of HSBC Bank Egypt’s tax position is as follows:
A. Corporate tax
Years since inception until 2004These years were inspected and disputes were settled in the Internal Committee.
From 2005 to 2011 These years were inspected and disputes are currently being discussed with the concerned internal committee.
From 2012 to 2015These years were inspected and disputes were settled with the tax authority.
B. Salary tax
From 1982 to 2014These years were inspected and were settled.
Year 2015The final settlement for this year is being delivered and prepared for inspection
C. Stamp duty tax
From 1982 until 2015These years were inspected and tax was fully settled.
• On June 30, 2014, a presidential decree was issued for Law No. 53 of 2014 and on August 20, 2015, Law No. 96 of 2015 was issued. This law included orders to amend the articles on income tax law issued by law 91 of 2005 to include the following:
– Tax impose on dividend distributions with the exemption of dividends of resident corporates to other corporates
– Tax impose on capital gains resulting from the sale of shares and securities with the exemption of capital gains arising from dealing in securities restricted stocks until May 17, 2017.
14. Earnings per shareBasic
Earnings per share are calculated by dividing profit related to the shareholders by the ordinary shares’ weighted average issued during the year after, excluding the average repurchased shares during the year and kept as Treasury stocks.
2016 2015
Net profit applicable to be distributed on the shareholders
3,466,867 2,532,758
Employees’ profit share (338,986) (253,276)
Net Profit available for appropriation to shareholders 3,127,881 2,279,482
Common shares issued - weighted average (1,000 shares)
33,281 33,281
Earnings per share/EGP 93.98 68.49
15. Cash and balances with the CBE
2016 2015
Cash 799,895 752,772
Due from Central Bank (within the statutory reserve) 7,211,801 5,173,087
8,011,696 5,925,859
Non-interest-bearing balances 3,795,916 3,827,369
Fixed interest-bearing balances 4,215,780 2,098,490
8,011,696 5,925,859

48
16. Due from banks
2016 2015
Current accounts 931,920 413,184
Deposits 22,869,957 12,259,415
23,801,877 12,672,599
Due from Central Bank (other than the statutory reserve) 9,572,000 6,156,004
Local banks 90,817 60,763
Foreign banks 14,139,060 6,455,832
23,801,877 12,672,599
Non-interest-bearing balances 931,920 413,184
Fixed interest-bearing balances 22,869,957 12,259,415
23,801,877 12,672,599
Current balances 23,801,877 12,672,599
17. Treasury bills
2016 2015
Treasury bills – Egyptian 19,048,198 18,568,859
Treasury bills – American 3,646,744 -
Total 22,694,942 18,568,859
Treasury bills represent the following:
2016 2015
91 days maturity 9,190,600 4,262,675
182 days maturity 9,049,000 7,702,550
273 days maturity 1,920,469 4,267,025
364 days maturity 2,992,150 2,820,350
Unearned interest (457,277) (483,741)
Total 22,694,942 18,568,859
18. Financial assets held for trading
2016 2015
Debt instruments
Governmental bonds 8,773 10,267
Total debt instruments 8,773 10,267
Total finance assets held for trading 8,773 10,267
19. Loans and advances to banks
2016 2015
Term loans 1,285,805 556,702
Total 1,285,805 556,702
Less
Provision for impairment - -
Net 1,285,805 556,702
Non-current balances 1,285,805 556,702
1,285,805 556,702

49
20. Loans and advances to customers
2016 2015
Retail:
Overdrafts 99,637 123,098
Credit cards 964,924 888,549
Personal loans 3,906,214 3,216,016
Mortgage loans 5,249 5,818
Total 4,976,024 4,233,481
Corporate loans including small loans:
Overdrafts 3,942,899 2,494,626
Direct loans 15,203,577 9,374,055
Syndicated loans 6,103,016 5,138,041
Total 25,249,492 17,006,722
Total loans and advance to customers 30,225,516 21,240,203
Less: provision for impairment losses (1,715,505) (909,156)
Less: interest in suspense (177,783) (94,306)
Net 28,332,228 20,236,741
Distributed as follows:
Current balances 16,658,174 10,624,986
Non-current balances 11,674,054 9,611,755
Total 28,332,228 20,236,741
During the year ended 31 December 2016, the Bank has accepted trading financial securities with a fair value amounting to EGP380,090 thousand as a commercial loan guarantee.
Provision for impairment losses:
The provision for impairment losses movement for loans and advances to customers classified according to their types is as follows:
31 December 2016
Retail
Overdrafts Credit cards Personal loans Mortgage loans Total
Balance at the beginning of the year 1,193 11,390 22,631 11 35,225
Impairment losses charged/(released) 894 5,408 17,573 31 23,906
Amounts written off during the year (838) (5,290) (15,660) - (21,788)
Balance at the end of the year 1,249 11,508 24,544 42 37,343
Corporate
Overdrafts Direct loans Syndicated loans Total
Balance at the beginning of the year 109,707 244,512 519,712 873,931
Impairment losses charged 21,029 79,125 32,551 132,705
Amounts written off during the year (3,863) (14,895) (5,979) (24,737)
Foreign revaluation difference related to provision 118,919 393,275 184,069 696,263
Balance at the end of the year 245,792 702,017 730,353 1,678,162

50
31 December 2015
Retail
Overdrafts Credit cards Personal loans Mortgage loans Total
Balance at the beginning of the year 1,269 15,268 27,984 61 44,582
Impairment losses charged 659 6,012 17,354 (50) 23,975
Amounts written off during the year (735) (9,890) (22,707) - (33,332)
Balance at the end of the year 1,193 11,390 22,631 11 35,225
Corporate
Overdrafts Direct loans Syndicated loans Total
Balance at the beginning of the year 104,709 235,520 509,419 849,648
Impairment losses charged 7,253 17,344 14,938 39,535
Amounts written off during the year (15,632) (57,697) (32,197) (105,526)
Foreign revaluation difference related to provision 13,377 49,345 27,552 90,274
Balance at the end of the year 109,707 244,512 519,712 873,931
21. Financial derivativesThe Bank uses the following derivatives for hedging and non-hedging purposes:
• Currency forward contracts represent commitments to purchase/sell foreign and local currencies, including in unexecuted portion of spot transactions
• Credit risk at the Bank is considered low. Future interest rate agreements represent future exchange rate contracts negotiated on a case-by-case basis. These contracts require financial settlements of any differences in contractual interest rates and prevailing market interest rates on future dates based on contractual amount/nominal value agreed on
• Currency and/or interest swap contracts represent the commitments to exchange a group of cash flows with another. These contracts’ result is the exchange of currencies or interest rates (ie fixed rate for floating rate) or both (ie cross-currency interest rate swaps). No exchange of principal takes place except for certain currency swaps. The Bank’s credit risk represents the potential cost to replace the swap contracts if counterparties fail to fulfil their obligation. This risk is monitored on an ongoing basis by comparing current fair value and contractual amount. To control an existing credit risk, the Bank assesses counterparties using the same techniques as for its lending activities
• Option contracts in foreign currencies and/or interest rates represent contract agreements in which the buyer (issuer) give to seller (holders) a right, not an obligation, to buy (buy option) or to sell (sell option) at a certain date or within a certain year of time by certain amount denominated in foreign currency or a financial instrument with prior agreed price. The buyer receives, in return, a commission against the burden of risk he took on option contracts that are either traded in the market or negotiable between the Bank and one of its customers. The Bank is exposed to credit risk for the purchased options’ contracts only and to the extent of its book value which represent its fair value
• The notional amounts of certain types of financial instrument are used as a basis for comparison purpose, with financial instruments recognised on the balance sheet but do not necessarily indicate the amounts of future cash flows or the current fair value of the instruments, and therefore, does not indicate the Bank’s exposure to credit or price risks The derivative instruments become favourable (assets) or unfavourable (liabilities) as a result of fluctuations in the market interest rates or foreign exchange rates related to them. The aggregate contractual or notional amount of the existing financial derivative instruments, the duration to which instruments are favourable or unfavourable, and the aggregate fair value of financial assets and liabilities derivatives can fluctuate significantly from time to time
• The table below represents the fair value of financial derivatives:
31 December 2015
Contract amount Assets
Contract amount
Liabilities
Assets Liabilities
Derivatives held for trading
Foreign currency derivatives
Currency swap contracts 178,788 (178,788) 7,184 (7,184)
Currency forward contracts 102,736 (102,736) 6,473 (6,522)
Currency exchange contracts 180,982 (180,982) - -
Total assets (liabilities) of derivatives held for trading 13,657 (13,706)

51
22. Financial investments
2016 2015
A. Available-for-sale
Equity instruments unlisted (at cost) 22,845 24,953
Debt instruments listed (at FMV)* 2,442,242 4,501,264
Total available-for-sale investments (1) 2,465,087 4,526,217
B. Held-to-maturity
Debt instruments unlisted (mutual fund)** 21,292 32,143
Total held-to-maturity investments (2) 21,292 32,143
Total financial investments (1+2) 2,486,379 4,558,360
Current balances 1,422,983 1,873,086
Non-current balances 1,063,396 2,685,274
2,486,379 4,558,360
Fixed interest debt instruments 2,414,106 4,495,732
Variable interest debt instruments 28,136 5,532
2,442,242 4,501,264
Available-for -sale Held-to-maturity** Total
31 December 2016
Balance at beginning of the year 4,526,217 32,143 4,558,360
Additions 408,881 - 408,881
Disposals (sale/redemption) (2,749,943) (10,851) (2,760,794)
Monetary assets forex differences 475,036 - 475,036
Gain from change in FMV (195,104) - (195,104)
Balance at end of the year 2,465,087 21,292 2,486,379
31 December 2015
Balance at beginning of the year 5,966,502 39,928 6,006,430
Additions 1,432,824 - 1,432,824
Disposals (sale/redemption) (2,926,541) (7,785) (2,934,326)
Monetary assets forex differences 21,700 - 21,700
Gain from change in FMV 31,732 - 31,732
Balance at end of the year 4,526,217 32,143 4,558,360
*Debt instruments at listed fair market value include local bonds amounting to EGP2,414,106 thousand secured by the Egyptian Ministry of Finance.
**The redemption amount of the mutual funds certificates as at 31 December 2016 amounted to EGP35,731 thousand against EGP49,023 thousand as at 31 December 2015.
Gain/(loss) from investments
2016 2015
Gain on redemption of debt instruments held to maturity 6,846 3,910
Gain on sale of available-for-sale equity instruments 16,390 737
Impairment losses of equity instruments of subsidiaries (13,717) -
Gain on sale of debt instruments available for sale 910 294
10,429 4,941

52
23. Investment in subsidiariesThe Bank's net investment in subsidiaries amounted to EGP21,800 thousand after deducting current year impairment amounted to EGP13,717 (EGP35,517 thousand as at 31 December 2015). The Bank's ownership percentage is as follows (based on the last financial position for the company as at 31 December 2016):
Company’s country
Company’s assets
EGP (000)
Company’s liabilities
(without equity)EGP (000)
Company’s revenues
EGP (000)
Company’s losses
EGP (000)
%
HSBC Securities Egypt Company SAE
Egypt 34,867 11,398 12,695 (516) 98%
Total 34,867 11,398 12,695 (516)
24. Intangible assets
Computer software
2016 2015
Balance at the beginning of the current year
Cost 16,203 10,500
Amortisation (8,174) (5,765)
Net book value at the beginning of the current year 8,029 4,735
Additions 1,643 8,409
Disposals - (2,706)
Amortisation cost (2,657) (2,409)
Net book value as at end of year 7,015 8,029
Cost 17,846 16,203
Amortisation (10,831) (8,174)
Net book value as at end of year 7,015 8,029
25. Other assets
2016 2015
Accrued revenues 341,289 255,609
Prepaid expenses 50,336 61,764
Amounts receivable on sale of fixed assets 6,491 -
Assets reverted to the Bank (after deducting the impairment)
- 470
Costs of branches under construction 11,747 3,545
Others 87,983 70,502
Total 497,846 391,890
26. Fixed assets
Land and buildings
Leasehold improvement
Machines and
equipment
Others Total
Balance as at the beginning of the current year
Cost 434,107 127,227 113,454 156,559 831,347
Accumulated depreciation (152,885) (116,795) (68,406) (98,683) (436,769)
Net book value at the beginning of the current year
281,222 10,432 45,048 57,876 394,578
Additions - 4,957 3,041 7,744 15,742
Transferred from investment property 2,800 - - - 2,800
Disposals (net) (12,640) (455) (941) - (14,036)
Depreciation for the year (17,701) (6,939) (9,673) (14,806) (49,119)
Net book value at the end of the year 253,681 7,995 37,475 50,814 349,965
Balance as at the end of the current year
Cost 411,021 119,561 112,722 152,567 795,871
Accumulated depreciation (157,340) (111,566) (75,247) (101,753) (445,906)
Net book value at the end of the year 253,681 7,995 37,475 50,814 349,965

53
27. Investment property As per CBE approval dated 9 June 2004, the Bank leased some of its head office floors which are located at Corniche El Nile Maadi and Smart Village.
2016 2015
Balance at the beginning of the year
Cost 135,074 130,902
Accumulated depreciation (41,706) (34,371)
Net book value at the beginning of the year 93,368 96,531
Transferred (to)/from fixed assets (2,800) 4,172
Depreciation (6,718) (7,335)
Net book value as at the end of year 83,850 93,368
Balance at the end of the year
Cost 132,274 135,074
Accumulated depreciation (48,424) (41,706)
Net book value as at the end of year 83,850 93,368
28. Due to banks
2016 2015
Current accounts 2,972,249 1,598,173
Deposits 2,800,000 1,400,000
5,772,249 2,998,173
Foreign banks 5,772,249 2,998,173
5,772,249 2,998,173
Non-interest-bearing balances 2,972,249 1,598,173
Fixed interest-bearing balances 2,800,000 1,400,000
5,772,249 2,998,173
Current Balances 5,772,249 2,998,173
29. Customers’ deposits
2016 2015
Demand deposits 28,548,697 22,010,746
Time and call deposits 10,755,759 7,457,515
Certificates of deposits 7,680,197 5,022,613
Saving deposits 19,902,324 15,171,324
Other deposits 3,669,213 1,714,372
70,556,190 51,376,570
Corporate deposits 32,158,482 24,659,192
Retail deposits 38,397,708 26,717,378
Net book value as at the end of year 70,556,190 51,376,570
Non-interest bearing balances 31,323,691 22,816,670
Fixed interest bearing balances 39,232,499 28,559,900
Net book value as at the end of year 70,556,190 51,376,570
Current balances 64,007,887 47,745,501
Non-current bearing balances 6,548,303 3,631,069
Net book value as at the end of year 70,556,190 51,376,570
Customers’ deposits include deposits of EGP2,704,779 thousand as at 31 December 2016 against
EGP1,223,692 thousand as at 31 December 2015, which represent collateral for irrecoverable liabilities. There is no major difference between its carrying value and fair value.
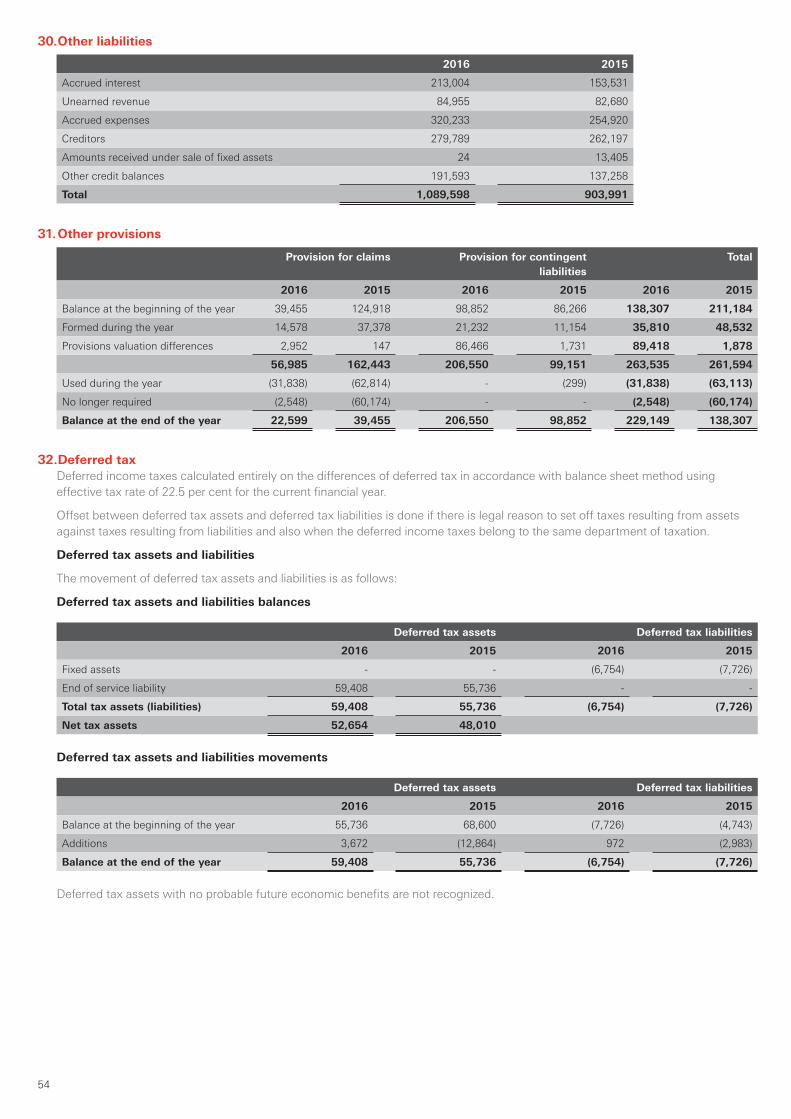
54
30. Other liabilities
2016 2015
Accrued interest 213,004 153,531
Unearned revenue 84,955 82,680
Accrued expenses 320,233 254,920
Creditors 279,789 262,197
Amounts received under sale of fixed assets 24 13,405
Other credit balances 191,593 137,258
Total 1,089,598 903,991
31. Other provisions
Provision for claims Provision for contingent liabilities
Total
2016 2015 2016 2015 2016 2015
Balance at the beginning of the year 39,455 124,918 98,852 86,266 138,307 211,184
Formed during the year 14,578 37,378 21,232 11,154 35,810 48,532
Provisions valuation differences 2,952 147 86,466 1,731 89,418 1,878
56,985 162,443 206,550 99,151 263,535 261,594
Used during the year (31,838) (62,814) - (299) (31,838) (63,113)
No longer required (2,548) (60,174) - - (2,548) (60,174)
Balance at the end of the year 22,599 39,455 206,550 98,852 229,149 138,307
32. Deferred taxDeferred income taxes calculated entirely on the differences of deferred tax in accordance with balance sheet method using effective tax rate of 22.5 per cent for the current financial year.
Offset between deferred tax assets and deferred tax liabilities is done if there is legal reason to set off taxes resulting from assets against taxes resulting from liabilities and also when the deferred income taxes belong to the same department of taxation.
Deferred tax assets and liabilities
The movement of deferred tax assets and liabilities is as follows:
Deferred tax assets and liabilities balances
Deferred tax assets Deferred tax liabilities
2016 2015 2016 2015
Fixed assets - - (6,754) (7,726)
End of service liability 59,408 55,736 - -
Total tax assets (liabilities) 59,408 55,736 (6,754) (7,726)
Net tax assets 52,654 48,010
Deferred tax assets and liabilities movements
Deferred tax assets Deferred tax liabilities
2016 2015 2016 2015
Balance at the beginning of the year 55,736 68,600 (7,726) (4,743)
Additions 3,672 (12,864) 972 (2,983)
Balance at the end of the year 59,408 55,736 (6,754) (7,726)
Deferred tax assets with no probable future economic benefits are not recognized.
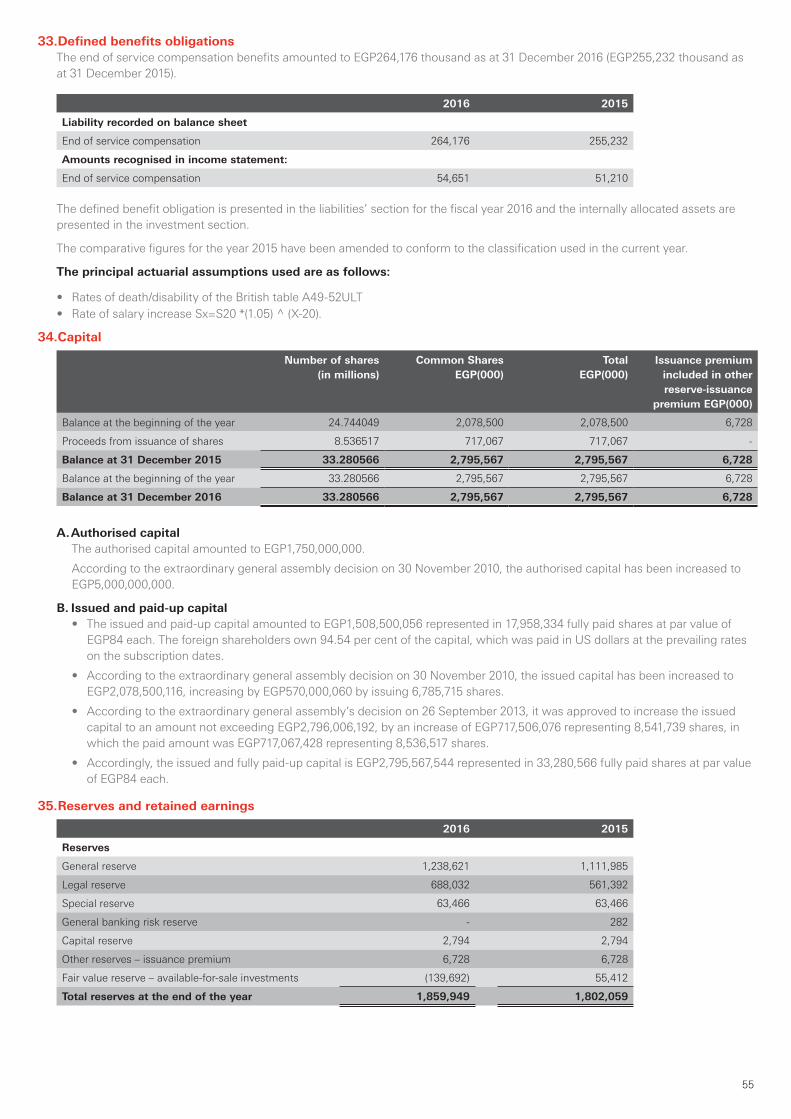
55
33. Defined benefits obligationsThe end of service compensation benefits amounted to EGP264,176 thousand as at 31 December 2016 (EGP255,232 thousand as at 31 December 2015).
2016 2015
Liability recorded on balance sheet
End of service compensation 264,176 255,232
Amounts recognised in income statement:
End of service compensation 54,651 51,210
The defined benefit obligation is presented in the liabilities’ section for the fiscal year 2016 and the internally allocated assets are presented in the investment section.
The comparative figures for the year 2015 have been amended to conform to the classification used in the current year.
The principal actuarial assumptions used are as follows:
• Rates of death/disability of the British table A49-52ULT• Rate of salary increase Sx=S20 *(1.05) ^ (X-20).
34. Capital
Number of shares (in millions)
Common Shares EGP(000)
Total EGP(000)
Issuance premium included in other reserve-issuance
premium EGP(000)
Balance at the beginning of the year 24.744049 2,078,500 2,078,500 6,728
Proceeds from issuance of shares 8.536517 717,067 717,067 -
Balance at 31 December 2015 33.280566 2,795,567 2,795,567 6,728
Balance at the beginning of the year 33.280566 2,795,567 2,795,567 6,728
Balance at 31 December 2016 33.280566 2,795,567 2,795,567 6,728
A. Authorised capitalThe authorised capital amounted to EGP1,750,000,000.
According to the extraordinary general assembly decision on 30 November 2010, the authorised capital has been increased to EGP5,000,000,000.
B. Issued and paid-up capital• The issued and paid-up capital amounted to EGP1,508,500,056 represented in 17,958,334 fully paid shares at par value of
EGP84 each. The foreign shareholders own 94.54 per cent of the capital, which was paid in US dollars at the prevailing rates on the subscription dates.
• According to the extraordinary general assembly decision on 30 November 2010, the issued capital has been increased to EGP2,078,500,116, increasing by EGP570,000,060 by issuing 6,785,715 shares.
• According to the extraordinary general assembly’s decision on 26 September 2013, it was approved to increase the issued capital to an amount not exceeding EGP2,796,006,192, by an increase of EGP717,506,076 representing 8,541,739 shares, in which the paid amount was EGP717,067,428 representing 8,536,517 shares.
• Accordingly, the issued and fully paid-up capital is EGP2,795,567,544 represented in 33,280,566 fully paid shares at par value of EGP84 each.
35. Reserves and retained earnings
2016 2015
Reserves
General reserve 1,238,621 1,111,985
Legal reserve 688,032 561,392
Special reserve 63,466 63,466
General banking risk reserve - 282
Capital reserve 2,794 2,794
Other reserves – issuance premium 6,728 6,728
Fair value reserve – available-for-sale investments (139,692) 55,412
Total reserves at the end of the year 1,859,949 1,802,059

56
Reserves movements during the year are as follows:
A. General reserve
2016 2015
Balance at the beginning of the year 1,111,985 1,023,767
Transferred from prior year profits 126,636 88,218
Balance at the end of the year 1,238,621 1,111,985
B. Legal reserve
2016 2015
Balance at the beginning of the year 561,392 473,177
Transferred from prior year profits 126,640 88,215
Balance at the end of the year 688,032 561,392
In accordance with local laws, 5 per cent of the net profit shall be transferred to undistributable reserve until it reaches 50 per cent of the capital.
C. General banking risk reserve
2016 2015
Balance at the beginning of the year 282 235
Transferred to general banking risk reserve - 47
Used during the year (282) -
Balance at the end of the year - 282
In accordance with the CBE instructions, general banking risk reserve is formed to meet unexpected risks and this reserve is undistributable except after obtaining the approval of the CBE.
D. Special reserve
2016 2015
Balance at the beginning of the year 63,466 63,466
Balance at the end of the year 63,466 63,466
In accordance with the CBE instructions, special reserve is formed to meet unexpected risks and this reserve is undistributable except after obtaining the approval of the CBE
E. Reserve for excess over par value – issuance premium
2016 2015
Balance at the beginning of the year 6,728 6,728
Balance at the end of the year 6,728 6,728
This reserve represents the difference between the value of shares acquired by the shareholders and employees during capital increase in years 1998 and 1999 (price per share was EGP168) and its par value (price per share EGP84) in addition to the gain resulted from sale of Treasury shares in year 2000 after deducting the capital increase that occurred in year 2002.
F. Fair value reserve available-for-sale investments
2016 2015
Balance at the beginning of the year 55,412 23,680
Net change in available-for-sale investments (195,104) 31,732
Balance at the end of the year (139,692) 55,412
This reserve represents the change in available-for-sale investments fair value.
G. Capital reserve
2016 2015
Balance at the beginning of the year 2,794 73
Transferred from prior year profits - 2,721
Balance at the end of the year 2,794 2,794

57
H. Retained earnings
2016 2015
Movement on retained earnings
Balance at the beginning of the year 2,532,758 1,766,981
Net profit for year 3,478,203 2,532,805
Dividends for year (1,519,655) (1,587,827)
Transferred to legal reserve (126,640) (88,215)
Transferred to general banking risk reserve - (47)
Transferred to capital reserve - (2,721)
Transferred to general reserve (126,636) (88,218)
Balance at the end of the year 4,238,030 2,532,758
36. Dividends Payment of dividends is not registered unless being approved by the general assembly. The Board of Directors proposed to the general assembly that was held on 9 March 2017 a payment of EGP62.50 per share as cash dividends for the year 2016 with a total amount of EGP2,080,035,375 (payment of EGP38.05 per share as cash dividends for year 2015 with a total amount of EGP1,266,379,151). In addition to cash dividends to shareholders, the Board of Directors proposed in the general assembly meeting to distribute EGP338,985,610 as employee’s distribution related to the profit in year 2016. (The actual employees dividends distributed in 2015 amount to EGP253,275,830).
37. Cash and cash equivalentsFor the purpose of preparing the statement of cash flow, cash and cash equivalents include the following balance of maturity dates within less than three months from the date of acquisition:
2016 2015
Cash and due from the CBE (note 15) 799,895 752,772
Due from banks (note 16) 23,801,877 12,672,599
Treasury bills (note 17) 9,031,525 4,355,893
33,633,297 17,781,264
38. Commitment and contingent liabilities
A. Legal claimsThere are lawsuits filed against the Bank as at 31 December 2016. The charged provision amounting to EGP5,929 thousand, provision of EGP2,013 thousand has been refunded during the year.
B. Commitments for loans, guarantees and facilitiesBank commitments for loans, guarantees and facilities are represented as follows:
2016 2015
Acceptances 399,347 294,651
Letters of guarantee 19,342,787 10,849,519
Letters of credit (import and export) 1,554,258 1,018,940
Other contingent liabilities 96,680 114,921
Commitments for loans 5,047,568 2,884,369
Cash margin (2,704,779) (1,223,692)
Total 23,735,861 13,938,708
C. Commitments for operating lease contractsThe total minimum lease payments for irrevocable operating leases are as follows:
2016 2015
Less than one year 10,455 18,430
More than one year and less than five years 25,948 21,219
More than five years 11,667 19,167
Total 48,070 58,816

58
39. Related party transactionsThe Bank is a subsidiary of parent HSBC Holdings B.V., which owns 94.54 per cent of ordinary shares. The remaining percentage (5.46 per cent) is owned by other shareholders.
Number of banking transactions with related parties has been conducted in the normal course of the business, including loans, deposits and foreign currency swaps.
Related parties transactions and balances at the end of the financial year are as follows:
A. Other loans
HSBC group
2016 2015
Subordinated loans (40) 272,000 272,000
272,000 272,000
B. Loans and advances to related parties
Subsidiaries
2016 2015
Loans and advances to customers
Existing loans at the beginning of the year 1,498 1,675
Loans collected during the year (1,498) (177)
Existing loans at the end of the year - 1,498
Interest on loans - 367
• No provisions formed for loan given to related parties.
C. Deposits from related parties
Subsidiaries
2016 2015
Due to customers
Deposits at the beginning of the financial year 15,963 29,893
Deposits received during the financial year 26,403 466
Deposits redeemed during the financial year (399) (14,396)
Deposits at the end of the financial year 41,967 15,963
The cost of deposits and similar costs - -
The preceding deposits are of no guarantee and of fixed interest rate and recoverable on call.
D. Other related party transactions
HSBC group Subsidiaries
2016 2015 2016 2015
Operating lease 10,405 21,190 601 1,091
The cost of services by HSBC Group as at 31 December 2016 amounted to EGP473,624 thousand against EGP436,046 thousand as at 31 December 2015.
On 17 September 2007, HSBC Middle East agreed with HSBC Egypt, HSBC Bahrain (on 2 November 2007) and HSBC Hong Kong (on 21 September 2011) to sell to HSBC Egypt part of loans’ portfolio originally granted by HSBC Middle East, HSBC Bahrain, and HSBC Hong Kong to certain corporates. HSBC Egypt purchased these loans based on nominal value with no recourse. According to the above-mentioned agreement, interest will be split among HSBC Egypt, HSBC Middle East and HSBC Bahrain based on the percentage of loans bought by HSBC Egypt to the total granted loans. These loans are subject to classification and general provisioning rules as set out by the CBE. The balance of such loans, as at 31 December 2016, amounted to USD8,134 thousand equivalent to EGP148,571 thousand and has been presented as loans to customers.
In order to maintain the minimum capital adequacy ratio which was affected as a consequence of the EGP floating decision in November 2016, and following to new CBE circular regarding the top 50 exposures cap, the Bank has sold certain FCY loans included in the portfolio of loans to customers (financial assets), during the last quarter of fiscal year 2016, to HSBC Bank Middle East; and losses realized from such transactions were included in “other operating income (expenses)”.
E. Board of Directors and top management benefitsThe average net monthly salary paid to the top 20 employees in the Bank for the year of 2016 amounted to EGP3,506 thousand (EGP2,554 thousand average net monthly salary paid to the top 20 employees for the year 2015).

59
40. Subordinated loans
Current interest rate
2016 2015
Subordinated loans 19.25% 272,000 272,000
272,000 272,000
‘Subordinated loans’ represents a loan obtained from HSBC holding BV by EGP272 million, according to an agreement extension of 15 years starting from December 2013 and ending in December 2028.
41. Mutual fundsHSBC first mutual fund (kol youm)
The mutual fund is an activity authorised for the Bank by virtue of Capital Market Law No.95/1992 and its Executive Regulations. The fund is managed by Hermes for Managing Mutual Funds. The certificates of the fund reached 1,000,000 certificates with an amount of EGP100,000,000 of which 50,000 certificates (with nominal value of EGP5,000,000) were allocated to the Bank to undertake the funds’ activity.
The Bank held as at 31 December 2016, a number of 182,970 certificates amounting to EGP21,292,421 with a redeemable value amounting to EGP35,731,146 against 276,210 certificates amounting to EGP32,142,862 with redeemable value amounting to EGP49,022,527 as at 31 December 2015.
The redeemable value of the certificate amounted to EGP195.28 as at 31 December 2016 against EGP177.48 as at 31 December 2015. The outstanding certificates as at 31 December 2016 reached 5,309,617 certificates against 12,112,199 certificates as at 31 December 2015.
According to the fund’s management contract and its prospectus, HSBC Egypt shall obtain fee and commission for supervision on the fund and other managerial services rendered by the Bank. Total commission amounted to EGP8,642 thousand for the year ended 31 December 2016 against EGP11,525 thousand for the year ended 31 December 2015 under the item of fees and commission income caption in the income statement.
42. Important eventsa. The revolution which took place in 2011 had a severe impact on the dissolution of the political structures and deterioration of
economic conditions. In order to mitigate the impact of the deteriorating political and economic conditions on the business sectors, and hence HBEG portfolio, a stress testing analysis was conducted to determine the needed provisions on a forecast looking basis. Accordingly, judgemental provisions were put in place which amount to EGP926.33 million as at 31 December 2016.
It is to be noted that total provisions in December 2016 stand at EGP1,715.5 million relative to EGP909.16 million at December 2015.
The total provisions encompass specific, collective and judgemental impairment. The specific provision stands at EGP579.19 million in December 2016 relative to EGP381.88 million in December 2015, while the total collective impairment stands at EGP1,136.3 million in December 2016 relative to EGP527.28 million as at December 2015.
b. In its meeting held on November 3, 2016, the CBE took a number of measures to reform the foreign currency circulation policy, these measures include the following:
• Enables the banks operating in Egypt to set the exchange rate prices of foreign currencies through the Interbank mechanism
• Increases interest rate on the overnight deposit, overnight lending, the rate of the CBE's main operation and credit rate by 300 bps to reach 14.75 percent, 15.75 percent, 15.25 percent and 15.25 percent respectively.
The exchange rates of main foreign currencies against Egyptian pound before and after November 3, 2016, date of the CBE decisions were as follows:
From January 1, 2016 till November 2, 2016
Currency Buy Sell
USD 8.633 8.656
EUR 9.631 9.659
From November 3, 2016 till December 31, 2016
Currency Buy Sell
USD 17.419 17.898
EUR 18.547 19.064
Accordingly, the value of monetary assets and liabilities denominated in foreign currencies have been changed significantly after the CBE decision which led the bank to change the pricing policies of its products.
43. Comparative figuresCertain comparative figures have been adjusted to conform to the presentation of the current financial statements.

60
Head office
306 Corniche El Nil, Maadi,Cairo, EgyptTel: +2(02) 2529 8000Fax: +2(02) 2529 8080SWIFT: EBBK EGCX
Cairo
Abou Dawoud El Zahiry branch62 Abou Dawoud El Zahiry Street, Nasr City,Cairo, EgyptTel: +2(02) 2672 0522Fax: +2(02) 2672 0526
Baghdad Premier Centre10 Baghdad Street, El Korba,Cairo, EgyptTel: +2(02) 2418 9948Fax: +2(02) 2418 9953
Cairo branch3 Aboul Feda Street, Zamalek,Cairo, EgyptTel: +2(02) 2739 6001Fax: +2(02) 2736 4010
City Lights branch1 Makram Ebeid, City Lights Building, Nasr CityCairo, EgyptTel: +2(02) 2671 8883Fax: +2(02) 2273 7554
City Stars branchTower A2 City Stars, Omar Ibn El Khattab Street, Heliopolis, Cairo, EgyptTel: +2(02) 2480 2356Fax: +2(02) 2480 2358
Corniche El Maadi branch306 Corniche El Nil, Maadi,Cairo, EgyptTel: +2(02) 2529 8750Fax: +2(02) 2529 8080
Down Town branch13 Kasr El Nil Street, Down Town,Cairo, EgyptTel: +2(02) 2578 8819Fax: +2(02) 2578 8455
Gezira Sporting Club branchGezira Sporting Club, Saraya El Gezira Street, Zamalek,Cairo, EgyptTel: +2(02) 2736 0863Fax: +2(02) 2736 0879
Hegaz branch70 El Hegaz Street, Heliopolis,Cairo, EgyptTel: +2(02) 2241 7372Fax: +2(02) 2241 7232
Heliopolis branchI Roxy Square, Heliopolis,Cairo, EgyptTel: +2(02) 2451 1480Fax: +2(02) 2258 3152
Maadi branch1B Road 256, Maadi,Cairo, EgyptTel: +2(02) 2519 5459Fax: +2(02) 2519 5458
Maadi Club branchMaadi Club, Maadi,Cairo, EgyptTel: +2(02) 2380 4729Fax: +2(02) 2380 4775
Masaken Sheraton branch3 Khaled Ibn ElWalid Street, Masaken Sheraton, Heliopolis,Cairo, EgyptTel: +2(02) 2266 6426Fax: +2(02) 2266 6430
Mokattam branch3 El Nafoura Square, MokattamCairo, EgyptTel: +2(02) 2667 9890Fax: +2(02) 2667 9894
Nasr City branch29 El Batrawy Street, Nasr City,Cairo, EgyptTel: +2(02) 2401 7147Fax: +2(02) 2461 9703
New Maadi branch10/2 El Nasr Road, New MaadiCairo, EgyptTel: +2(02) 2754 4816Fax: +2(02) 2754 5521
Nile City branchNile City Tower, Corniche El Nil, Ramlet BeaulacCairo, EgyptTel: +2(02) 2461 9701Fax: +2(02) 2461 9703
El Obbour Buildings branch13 El Obbour Buildings, Salah Salem StreetCairo, EgyptTel: +2(02) 2403 1379Fax: +2(02) 2403 1408
El Orouba branch90 Beirut Street, HeliopolisCairo, Egypt.Tel: +2(02) 2415 3371Fax: +2(02) 2415 3378
Safir branch1 El Sheikh Hassouna El Nawawi Street, HeliopolisCairo, EgyptTel: +2(02) 2418 9938Fax: +2(02) 2418 9943
El Shams Club branch15 Abdel Hamid Badawy Street, HeliopolisCairo, EgyptTel: +2(02) 2622 0828Fax: +2(02) 2620 4982
Sun City branch Sun City Mall, Square 1258F, Autostrad RoadSheraton Buildings, HeliopolisCairo, EgyptTel: +2(02) 2268 9641 Fax: +2(02) 2268 9642
El Thawra branch109 El Thawra Street, Ard El Golf, Nasr CityCairo, EgyptTel: +2(02) 2414 2157Fax: +2(02) 2417 4428
New Cairo
Cairo Festival City branch Cairo Festival City Mall, Unit No.10, Ring Road Cairo, Egypt Tel: +2(02) 26168155
HSBC Bank Egypt head office and branchesHSBC Bank Egypt SAE

61
Katameya Heights branchKatameya Heights, Fifth District,New Cairo, EgyptTel: +2(02) 2984 0998Fax: +2(02) 2759 3887
El Tagamoo branch67, El Teseen Street,5th Settlement, New CairoCairo, Egypt Tel: +2(02) 2920 1371/2920 1716Fax: +2(02) 2920 0123
Rehab branch Shop 411, New Souk El Rehab, ground floorEl Rehab CityCairo, Egypt Tel: +2(02) 2693 2273
El Sherouk City and Obbour City
Obbour City branch3 City Club Fence,Obbour City, EgyptTel: +2(02) 4610 4196Fax: +2(02) 4610 4362
El Sherouk branchEl Sherouk Academy, Suez/Ismailia Road,El Sherouk City, EgyptTel: +2(02) 2688 0210Fax: +2(02) 2688 0220
Giza
Agouza branch128 Nile Street, AgouzaGiza, EgyptTel: +2(02) 3761 8126Fax: +2(02) 3761 8154
El Batal branch 6 Wezaret Elzeraa, AgouzaGiza, EgyptTel: +2(02) 3762 0131 Fax: +2(02) 3762 0174
Dokki branch80 Mosadak Street, DokkiGiza, EgyptTel: +2(02) 3762 0589Fax: +2(02) 3762 0568
Gameat El Doual branch54 Gameet El Doual Street, MohandessinGiza, EgyptTel: +2(02) 3748 6879Fax: +2(02) 3748 6878
Haram branch179 Haram Street, Haram,Giza, EgyptTel: +2(02) 3981 6875Fax: +2(02) 3743 1514
Lebanon branch25 Lebanon Street, MohandessinGiza, EgyptTel: +2(02) 3346 7090Fax: +2(02) 3346 7092
Mohandessin branch8 Geziret El Arab Street, MohandessinGiza, EgyptTel: +2(02) 3337 0756Fax: +2(02) 3337 0813
Shooting Club branch40 Kambiz Street,Giza, EgyptTel: +2(02) 3760 7936Fax: +2(02) 3760 8298
Vinni branch8 El Sad El Aaly Street, DokkiGiza, EgyptTel: +2(02) 3749 6336Fax: +2(02) 3749 6329
Sheikh Zayed City and Sixth of October City
Arkan branchArkan Mall,El Sheikh Zayed City, Entrance No.2Giza, EgyptTel: +2(02) 3850 4010Fax: +2(02) 3850 7993
Dandy Mall branchDandy Mall, 28th Km, Cairo/Alexandria Desert Road Giza, EgyptTel: +2(02) 3539 0174Fax: +2(02) 3539 0173
Hyper One branchHyper One Market,El Sheikh Zayed CityGiza, EgyptTel: +2(02) 3850 7990Fax: +2(02) 3850 7993
Mall of Arabia branch Mall of Arabia, Juhayna Square,6th of October CityGiza, EgyptTel: +2(02) 3826 0179
Smart Village branchBuilding 122B, Smart Village28th km Cairo/Alexandria Desert Road,EgyptTel: +2(02) 3537 0602Fax: +2(02) 3537 0606
Alexandria
Alexandria branch47 Sultan Hussein Street, Azarita,Alexandria, EgyptTel: +2(03) 487 2949Fax: +2(03) 487 2925
Glym branch556 Horreya Road,Glym,Alexandria, EgyptTel: +2(03) 583 6711Fax: +2(03) 584 5562
Kafr Abdou branch38 intersection of Ahmed Abdel Aziz Street and Abdel Kader Ragab Street,Kafr Abdou, Roushdy,Alexandria, EgyptTel: +2(03) 541 4138Fax: +2(03) 541 4139
Loran branch264 Abdel Salam Aref Street, LoranAlexandria, EgyptTel: +2(03) 357 3961Fax: +2(02) 2529 7938
Saraya branchBorg El Delta, Corniche El Saraya, Sidi BeshrAlexandria, EgyptTel: +2(03) 358 2202Fax: +2(03) 358 2339
Semouha branchAzhar El Saraya Buildings, SemouhaAlexandria, EgyptTel: +2(03) 421 0002Fax: +2(03) 421 0008
Hacienda branch138th km Alexandria/Matrouh Desert Road,EgyptTel: +2(010) 9409 0251
Delta RegionBorg El Arab branchServices Area, Fifth District, Borg El ArabAlexandria, EgyptTel: +2(03) 459 5470Fax: +2(03) 459 5473
Mansoura branch182 Geish Street, El MansouraDakahleya, EgyptTel: +2(050) 230 8124Fax: +2(050) 230 8122
Port Said branch27 El Gomhoureya StreetPort Said, EgyptTel: +2(066) 324 4698Fax: +2(066) 324 4694

62
Sinai and Red Sea
Banking District branch3 Banking District, El Kawthar DistrictHurghada, EgyptTel: +2(065) 345 3062Fax: +2(065) 345 3065
El Gouna branchAbu Tig Marina, El GounaHurghada, EgyptTel: +2(065) 358 0571Fax: +2(065) 358 0570
Sharm Azur branchVilla Chris Village, Peace RoadSharm El Sheikh, EgyptTel: +2(069) 360 3790Fax: +2(069) 360 3793
Upper Egypt
Assiut branchAssiut University,Assiut, EgyptTel: +2(088) 237 3681Fax: +2(088) 237 3686
Luxor branchKhaled Ibn El Walid Street, Iberotel HotelLuxor, Quena, EgyptTel: +2(095) 235 7853Fax: +2(095) 235 7786
© Copyright HSBC Bank Egypt S.A.E. 2016
All rights reserved
No part of this publication may be reproduced, stored in a retrieval system, or transmitted, in any form or by any means, electronic, mechanical,
photocopying, recording, or otherwise, without the prior written permission of HSBC Bank Egypt S.A.E.
Published by Finance Department, HSBC Bank Egypt S.A.E., Cairo
HSBC Bank Egypt S.A.E.
306, Corniche El Nil, Maadi, Cairo, Egypt
Telephone: (202) 2529 8000
Facsimile: (202) 2529 8080
www.hsbc.com.eg