
HRT-17-014: State of the Practice for Traveler Information ... · lbf/in2 poundforce p e r s quare...
76
State of the Practice for Traveler Information During Nonrecurring Events PUBLICATION NO. FHWA-HRT-17-014 APRIL 2018 Research, Development, and Technology Turner-Fairbank Highway Research Center 6300 Georgetown Pike McLean, VA 22101-2296
Transcript of HRT-17-014: State of the Practice for Traveler Information ... · lbf/in2 poundforce p e r s quare...

State of the Practice for TravelerInformation During Nonrecurring Events PUBLICATION NO. FHWA-HRT-17-014 APRIL 2018
Research, Development, and TechnologyTurner-Fairbank Highway Research Center6300 Georgetown PikeMcLean, VA 22101-2296

FOREWORD
The Federal Highway Administration has recognized the need to take a comprehensive look at
the information requirements and decisionmaking processes of travelers across a range of
nonrecurring events. Properly constructed and presented traveler information about nonrecurring
events provided at key decision points can be a powerful tool for operators and managers to
better inform travelers of those events. The purpose of this project was to identify, review, and
synthesize literature and best practices on efforts to understand travelers’ information needs and
related decisionmaking processes during nonrecurring events.
The intended target audience for this report includes transportation professionals involved in the
management, planning, engineering, research design, and operations of traffic and traveler
information systems. The information presented in this report has the potential to help
transportation professionals and researchers provide optimal traveler information on roadway
networks to allow users to make better route choices, thereby decreasing travel time and
congestion.
Monique R. Evans, P.E., CPM
Director, Office of Safety
Research and Development
Notice
This document is disseminated under the sponsorship of the U.S. Department of Transportation
(USDOT) in the interest of information exchange. The U.S. Government assumes no liability for
the use of the information contained in this document.
The U.S. Government does not endorse products or manufacturers. Trademarks or
manufacturers’ names appear in this report only because they are considered essential to the
objective of the document.
Quality Assurance Statement
The Federal Highway Administration (FHWA) provides high-quality information to serve
Government, industry, and the public in a manner that promotes public understanding. Standards
and policies are used to ensure and maximize the quality, objectivity, utility, and integrity of its
information. FHWA periodically reviews quality issues and adjusts its programs and processes to
ensure continuous quality improvement.

TECHNICAL REPORT DOCUMENTATION PAGE 1. Report No.
FHWA-HRT-17-014
2. Government Accession No.
3. Recipient’s Catalog No.
4. Title and Subtitle
State of the Practice for Traveler Information During Nonrecurring
Events
5. Report Date
April 2018
6. Performing Organization Code
7. Author(s)
Emanuel Robinson, Elisha Lubar, Jeremiah Singer, Dan Kellman,
Bryan Katz, and Scott Kuznicki
8. Performing Organization Report
9. Performing Organization Name and Address
Leidos, Inc.
11951 Freedom Drive
Reston, VA 20190
Westat
1600 Research Boulevard
Rockville, MD 20850
Toxcel
7140 Heritage Village Plaza
Gainesville, VA 20155
10. Work Unit No. (TRAIS)
11. Contract or Grant No.
DFTH6116D00053
12. Sponsoring Agency Name and Address
U.S. Department of Transportation
Federal Highway Administration
1200 New Jersey Ave., S.E.
Washington, DC 20590
13. Type of Report and Period Covered
Final Report; October 2015–May 2016
14. Sponsoring Agency Code
HRDS-30
15. Supplementary Notes
The Contracting Officer’s Representative was Barry Zimmer (HOP-1), and the Government Task Manager was
Michelle Arnold (HRDS-30).
16. Abstract
The Federal Highway Administration has recognized the need to take a comprehensive look at the information
requirements and decisionmaking processes of travelers across a range of nonrecurring events. The goal of this
study was to review and synthesize information about travelers’ information needs and current practices for
information dissemination related to nonrecurring events. Researchers identified, reviewed, and synthesized
academic literature, practitioner reports, and best practices for information provision related to nonrecurring
events. This report discusses user needs, best practices, data collection and information dissemination
technologies, and knowledge gaps. Case studies and information dissemination strategies are also provided.
17. Key Words
Nonrecurring event, Decisionmaking, Traveler
information, Road weather information, Special events
18. Distribution Statement
No restrictions. This document is available to the public
through the National Technical Information Service,
Springfield, VA 22161.
http://www.ntis.gov
19. Security Classif. (of this report)
Unclassified
20. Security Classif. (of this page)
Unclassified
21. No. of Pages
73
22. Price
N/A
Form DOT F 1700.7 Reproduction of completed page authorized.

ii
SI* (MODERN METRIC) CONVERSION FACTORS APPROXIMATE CONVERSIONS TO SI UNITS
Symbol When You Know Multiply By To Find Symbol
LENGTH in inches 25.4 millimeters mm ft feet 0.305 meters m
yd yards 0.914 meters m mi miles 1.61 kilometers km
AREA in
2square inches 645.2 square millimeters mm
2
ft2
square feet 0.093 square meters m2
yd2
square yard 0.836 square meters m2
ac acres 0.405 hectares ha
mi2
square miles 2.59 square kilometers km2
VOLUME fl oz fluid ounces 29.57 milliliters mL
gal gallons 3.785 liters L ft
3 cubic feet 0.028 cubic meters m
3
yd3
cubic yards 0.765 cubic meters m3
NOTE: volumes greater than 1000 L shall be shown in m3
MASS oz ounces 28.35 grams g
lb pounds 0.454 kilograms kgT short tons (2000 lb) 0.907 megagrams (or "metric ton") Mg (or "t")
TEMPERATURE (exact degrees) oF Fahrenheit 5 (F-32)/9 Celsius
oC
or (F-32)/1.8
ILLUMINATION fc foot-candles 10.76 lux lx fl foot-Lamberts 3.426 candela/m
2 cd/m
2
FORCE and PRESSURE or STRESS lbf poundforce 4.45 newtons N
lbf/in2
poundforce per square inch 6.89 kilopascals kPa
APPROXIMATE CONVERSIONS FROM SI UNITS
Symbol When You Know Multiply By To Find Symbol
LENGTHmm millimeters 0.039 inches in
m meters 3.28 feet ft m meters 1.09 yards yd
km kilometers 0.621 miles mi
AREA mm
2 square millimeters 0.0016 square inches in
2
m2 square meters 10.764 square feet ft
2
m2 square meters 1.195 square yards yd
2
ha hectares 2.47 acres ac
km2
square kilometers 0.386 square miles mi2
VOLUME mL milliliters 0.034 fluid ounces fl oz
L liters 0.264 gallons gal m
3 cubic meters 35.314 cubic feet ft
3
m3
cubic meters 1.307 cubic yards yd3
MASS g grams 0.035 ounces ozkg kilograms 2.202 pounds lbMg (or "t") megagrams (or "metric ton") 1.103 short tons (2000 lb) T
TEMPERATURE (exact degrees) oC Celsius 1.8C+32 Fahrenheit
oF
ILLUMINATION lx lux 0.0929 foot-candles fc cd/m
2candela/m
20.2919 foot-Lamberts fl
FORCE and PRESSURE or STRESS N newtons 0.225 poundforce lbf
kPa kilopascals 0.145 poundforce per square inch lbf/in2
*SI is the symbol for th International System of Units. Appropriate rounding should be made to comply with Section 4 of ASTM E380. e
(Revised March 2003)

iii
TABLE OF CONTENTS
EXECUTIVE SUMMARY .......................................................................................................... 1
CHAPTER 1. INTRODUCTION ................................................................................................ 5 BACKGROUND AND OBJECTIVES ................................................................................. 5 METHODOLOGY ................................................................................................................. 5 ORGANIZATION OF REPORT .......................................................................................... 8
CHAPTER 2. USER INFORMATION NEEDS AND DECISIONMAKING ........................ 9
INFORMATION NEEDS FOR NONRECURRING EVENTS ....................................... 10 INTERNATIONAL PERSPECTIVE REGARDING TRAVELER
PREFERENCES .............................................................................................................. 13
CHAPTER 3. TRAVELER INFORMATION FOR NONRECURRING EVENTS
STATE OF THE PRACTICE ............................................................................................. 15 BEST PRACTICES FOR IMPLEMENTATION ............................................................. 15
Data Collection Technology ............................................................................................. 16
EMERGING TECHNOLOGIES AND TRENDS ............................................................. 19 Private Sector Data ........................................................................................................... 19
Integration with Vehicle Telematics ................................................................................. 20
Road Weather Information Systems ................................................................................. 20
DISSEMINATION METHODS AND MEDIA .................................................................. 20 MESSAGE TYPES AND EXAMPLES .............................................................................. 22
MESSAGING STRATEGIES ............................................................................................. 26 Planned Events .................................................................................................................. 26 Matching Traveler Information Needs and Expectations ................................................. 26
Nonlocal Versus Local Travelers ...................................................................................... 27 Nonagency Traveler Information Context ........................................................................ 27
Maximizing Use and Benefits of Traveler Information .................................................... 28 EVALUATION AND ASSESSMENT OF THE PUBLIC’S USE AND
UNDERSTANDING OF TRAVELER INFORMATION ............................................ 28
CHAPTER 4. GAPS BETWEEN PRACTICES AND USER NEEDS, CHALLENGES,
AND ISSUES ......................................................................................................................... 31
CHAPTER 5. CASE STUDIES ................................................................................................. 35 CASE STUDY 1—MOBILE APPS ..................................................................................... 35 CASE STUDY 2—COMPREHENSIVE RURAL ITS ...................................................... 40
CHAPTER 6. CONCLUSION ................................................................................................... 43
APPENDIX A. TAXONOMY OF MESSAGES AND USES .................................................. 45
APPENDIX B. MOBILE APPS FROM STATE TRANSPORTATION
DEPARTMENTS AND REGIONAL SOURCES.............................................................. 51
REFERENCES ............................................................................................................................ 53
BIBLIOGRAPHY ....................................................................................................................... 59

iv
LIST OF FIGURES
Figure 1. Screenshot. Kansas City Scout website ......................................................................... 12
Figure 2. Map. Screenshot. Traffic map of Seattle, WA .............................................................. 17 Figure 3. Screenshot. TravelMidwest website .............................................................................. 19 Figure 4. Flowchart. PLA example ............................................................................................... 33 Figure 5. Screenshot. WSDOT mobile app home screen ............................................................. 36 Figure 6. Screenshot. WSDOT mobile app display ...................................................................... 37
Figure 7. Photo. WSDOT DMS on I-90 at Snoqualmie Pass ....................................................... 38
Figure 8. Screenshot. MN 511 mobile app layer control view 1 .................................................. 38 Figure 9. Screenshot. MN 511 mobile app layer control view 2 .................................................. 39
Figure 10. Screenshot. Lake County PASSAGE mobile app ....................................................... 40
LIST OF TABLES
Table 1. Preliminary list of candidate implementations ............................................................... 15 Table 2. Example messages for various types of situations and delivery methods ...................... 23
Table 3. Example messages for non-recurring events .................................................................. 46

v
LIST OF ABBREVIATIONS
ATIS advanced traveler information system
CB citizen band
CCTV closed-circuit television
CMS changeable message sign
DMS dynamic message sign
ESS environmental sensing system
FHWA Federal Highway Administration
GPS Global Positioning System
HAR highway advisory radio
ITE Institute for Transportation Engineers
ITS intelligent transportation system
MnDOT Minnesota Department of Transportation
PASSAGE Program for Arterial Signal Synchronization and trAvel GuidancE
PLA problem, location, and action
RITIS Regional Integrated Transportation Information System
RS-D roadside detection
RWIS road weather information system
TMC traffic management center
TRB Transportation Research Board
VDOT Virginia Department of Transportation
VMS variable message sign
WisDOT Wisconsin Department of Transportation
WSDOT Washington State Department of Transportation


1
EXECUTIVE SUMMARY
The Federal Highway Administration has recognized the need to take a comprehensive look at
the information requirements and decisionmaking processes of travelers across a range of
nonrecurring events, which include unplanned or planned events that impact traffic conditions.
Unplanned events may include traffic incidents, severe weather, and emergencies, while planned
events may include road work, sporting events, concerts, marathons, county fairs, parades,
political rallies, planned protests, and holiday celebrations. Whether planned or unplanned,
because these events are nonrecurring, travelers may not expect them, and they may cause
disruptions to travel as well as impair broader network flow. The provision of information about
these events can help drivers make informed decisions that minimize the impact of these events.
In order to provide effective information, it is important to understand travelers’ information
needs and preferences.
Information dissemination modes include both pre-trip and en-route messages. Pre-trip
information may include TV, radio, text or email alerts, websites (including 511), and mobile
mapping applications (referred to as “apps” throughout this report) with traffic information.
En-route information may include many of the previously listed media as well as changeable
message signs (CMSs), highway advisory radio, and in-vehicle devices linked to the connected
vehicle ecosystem. Thanks to rapid expansion of wireless communication technologies, travelers
have access to more information in more places than ever; however, it is important to understand
exactly what information travelers need, when they need it, and how they want to receive it.
The purpose of this study was to identify and review literature and synthesize the best practices
on efforts to understand traveler information needs and related decisionmaking processes within
the context of nonrecurring events. This report provides a comprehensive, up-to-date review that
is easily accessible for use with present-day challenges while also being forward-looking for
upcoming trends and advances as the landscape of nonrecurring events information evolves.
Traveler behavior involves individual decisionmaking, such as what trips to make, where to visit,
when to depart, what mode of travel to utilize, and what route to follow.(1) Decisionmaking is
defined as the thought process for selecting a logical choice from the available options by
weighing the positives and negatives of each option and considering all the alternatives.(2) It is
not always an error-free process and can be affected by various factors, including, but not limited
to, fatigue, lack of information, perceived or real-time pressure, and stress.(3) In addition, when in
an unknown situation that may elicit stress, decisionmakers (e.g., drivers or travelers faced with
information about a nonrecurring event) may do the following:
Seek out certainty (and be less tolerant of ambiguity).
Attempt to make fast decisions and seek out closure.
Narrow perception due to sensory overload (e.g., tunnel vision).
Demonstrate suboptimal judgment due to perception distortion.
Have a decreased capacity to handle complex tasks.
Choose risky alternatives.
2
In addition, not all decisionmakers operate or approach, perceive, and navigate problems the
same way. Individual differences, such as age, familiarity with the area, culture/language, and
personality can have an impact on the effectiveness of pre-trip and en-route messages.
According to Torma-Krajewski and Powers, an effective decisionmaker is confident and
competent, is knowledgeable of the situation, seeks advice, takes advantage of opportunities,
remains flexible and open to new options, is calculated and selective, takes a comprehensive
approach, has the initiative to make a decision, and has a good understanding of his or her own
abilities.(4) More specifically, driver-related decisions should be timely, minimize damage,
and accomplish a specific objective or mission while keeping everyone safe. To reduce the
difficulties experienced by drivers in decisionmaking environments, all forms of uncertainty
must be minimized, and all information necessary to make a good decision should be provided
at the time that the decision needs to be made.
Certain precautions must be taken when developing strategies for assisting the decisionmaking
process, especially in situations of nonrecurring events where there may be limited or rapidly
changing information (e.g., evacuations and emergency situations). For example, an overload of
information can contribute to poor decisionmaking, cause drivers to forget already processed
information, induce mental fatigue, or delay the actual decision.(4) This report reviews literature
regarding information needs for nonrecurring events, as noted in surveys and focus groups of the
traveling public (both nationally and internationally).
Both public and private sector entities have roles in the process of disseminating information to
the public. For example, many State transportation departments or other Government entities
send alerts via text message or email, post messages on CMSs, and provide traveler information
via automated telephone services and websites. Common information available on traveler
information websites includes maps showing color-coded traffic conditions, incident locations,
CMS messages, travel times, traffic cameras, and weather conditions. Many agencies have also
expanded their outreach to social media platforms such as Twitter™ and Facebook®. In
addition, comprehensive collection of real-time traffic information from sources such as private
vendors and State transportation departments can help agencies detect and respond to unplanned
events, such as collisions.
In the private sector, mapping apps can provide travelers with pre-trip and en-route directions
and traffic information. While much of the focus on traveler information is on drivers, the utility
of traveler information can be enhanced by providing multimodal information, such as bus and
train schedules, online and at transit stations. Partnerships between various public and private
entities (e.g., mapping companies, news media, and the Government) can also help to expand the
quality and availability of information.
In the past decade, the quality and availability of traveler information have expanded
dramatically.(5) In the future, this trend is likely to continue. One major new development in
traveler information is connected vehicle technology, which allows vehicles to wirelessly
communicate with one another and with highway infrastructure. This new technology
provides vehicles with traveler information to a much greater degree than in the past. While
this technology has great potential to improve the information available to drivers, it also
brings challenges, such as developing interfaces that are safe to use while driving.

3
The section entitled Message Types and Examples in chapter 3 as well as table 3 in appendix A
provide a taxonomy of message types that can be used for traveler information about
nonrecurring events. The appendix indicates event type, messages that can delivered at various
times (before an event, at the time of an event, after an event has begun, etc.), the delivery
method, and example messages. Events addressed include incidents, work zone, and weather-
related events. Appendix A can be used as a tool to plan messaging strategies for a wide range of
potential nonrecurring events.
There are a variety of methods to assess the public’s use, perception, and effect of traveler
information systems. Traditional methods have included call statistics, website hits, and
satisfaction surveys. Based on prior experiences and findings, a toolbox method could be used
to evaluate traveler information systems (specifically nonrecurring events messaging).(6) This
approach combines a variety of focused, targeted, and low-cost methods (e.g., focus groups,
traveler logs or diaries, and targeted surveys) that evaluate different aspects of a traveler
information program in a particular area. It is also desirable to use a combination of methods
due to the large variety of dissemination methods, traveler characteristics, and information
types. Findings from these methods can then be combined to generate a profile of overall
system effectiveness, especially with respect to its effect on trip behavior as a result of
nonrecurring events.
The intended audience for this report includes transportation agencies interested in implementing
or managing a traveler information system that includes information for nonrecurring events as
well as researchers investigating traveler needs and behaviors related to nonrecurring event
information.


5
CHAPTER 1. INTRODUCTION
BACKGROUND AND OBJECTIVES
Incident-related and other nonrecurring congestion are major contributors to total congestion
delays on highways. For example, it has been estimated that roughly half of all delays on
freeways in the United States are due to nonrecurring causes.(7) Types of nonrecurring events
may include traffic incidents, severe weather, work zones, emergencies, and sporting events.
Devices and media that can be used to convey information about nonrecurring events to travelers
may include mobile apps, changeable message signs (CMSs), telephony, websites, radio, and in-
vehicle devices that may become part of the connected vehicle ecosystem. It is important to
review outcomes from a traveler’s perspective regarding access to, perception of, and need for
traveler information surrounding nonrecurring events. It is also essential to take into
consideration that in order for information for nonrecurring events to be optimally presented, it
must match user needs in both content and media. Examination of the ever-expanding role of the
private sector in existing and future real-time advanced traveler information systems (ATISs)
were also considered throughout.
The purpose of this task order was to identify and comprehensively review literature and
synthesize best practices on efforts to understand travelers’ information needs and related
decisionmaking processes within the context of nonrecurring events. The ultimate goal was to
find what information will help the traveling public make the most effective and safest travel
decisions during nonrecurring events.
This report presents a comprehensive review that is up to date and easily accessible for use with
present-day challenges while also being forward-looking for upcoming trends and advances as
the landscape of nonrecurring events information evolves. This review emphasizes clarity,
relevance, and ease of use for a wide range of potential users. It can be used as a tool to
understand how to anticipate and adapt to user needs and decisionmaking processes in a range
of nonrecurring event situations. Information about nonrecurring events had traditionally been
investigated from the perspective of agency dissemination practices and considered a limited
range of situations. The best dissemination practices, however, must also account for the
audience and needs of the public.
METHODOLOGY
The research effort began with keyword searches of relevant databases with an emphasis on
recent information.(8) To be fully comprehensive, the review also included information gathered
from international sources.(9,10) Each search included a combination of keywords as well as
supplemental keywords used to refine search results. The following five main search categories
were created to encompass the key project dimensions, as outlined in the statement of work:
(1) core concept, (2) data and technology, (3) location, (4) specific technologies, and
(5) supplementary terms. Using these categories, a list of search terms was then compiled and
organized appropriately. As an example, the search terms “traveler information” and “incident”
were both placed in the core concept category. The following list shows an initial sample set of
search terms organized by the five key search categories:

6
Core concept: Traveler information, nonrecurring events, decisionmaking, weather,
work zone, incident, special event (planned), event, user, and travel time.
Data and technology: ATIS, intelligent transportation system (ITS), technology,
real time, dissemination, and instrumentation.
Location: Pre-trip, en route, and destination.
Specific technologies: Connected vehicle, CMS, highway advisory radio (HAR), 511,
mobile apps, cell phones, and Global Positioning System (GPS).
Supplementary terms: Guidelines, best practices, operations, traffic, congestion,
requirements, implementation, and reliability.
Additional search terms were added and adjusted for follow-up searches.
Boolean logic was applied to further define the search. Search terms from the five categories
were combined with Boolean operators (AND, OR, etc.) to exclude irrelevant literature and limit
results to within the project scope. For example, in an initial search, terms from the core concept,
location, data and technology, and specific technologies categories were combined in a way that
would return literature containing any of the keywords in any of the categories. Due to search
character limits, this Boolean combination can be divided into a series of searches as follows:
(“nonrecurring event” OR “traveler information” OR “user”) AND (en-route OR pre-trip)
AND (“smartphone apps” OR “changeable message sign” OR “radio” OR “511”)*.
(“nonrecurring event” OR “traveler information” OR “user”) AND (“intelligent
transportation system” OR “ATIS”) AND (“connected vehicle” OR “cell phone”)*.
Note that the asterisk represents a “wildcard” character. In anticipation of these search terms
returning thousands of documents, in each case, the first 100 search results were carefully
screened. Relevant literature was identified, as defined by the project dimensions and the
statement of work. Additionally the following avenues were reviewed:
Societies and committees: Several societies and committees were reviewed to aid in
information gathering and outreach, such as the following:
o Transportation Research Board (TRB) (e.g., Regional Transportation Systems
Management and Operations Committee and Freeway Operations Committee).
o ITS America (e.g., Information Communication Forum).
o ITS World Congress.
o Institute for Transportation Engineers (ITE) (e.g., Transportation Systems
Management and Operations Council and associated committees).

7
o American Association of State Highway and Transportation Officials, including
the Subcommittee on Traffic Engineering.
o Institute of Electrical and Electronics Engineers.
o National Committee on Uniform Traffic Control Devices.
o Consumer electronics meetings and relevant committees.
o International organizations and committees (e.g., ERTICO ITS Europe is a
partnership of around 100 companies and institutions involved in the production
of ITSs).
Conference proceedings: Conference proceedings were searched because developmental
work and practices are often presented there. Conferences conducted by the organizations
mentioned in the previous list were a starting point for a search. (Note that helpful
conference proceedings are documented throughout the report.)
Social networking: It was important to utilize social communities through sites such as
LinkedIn®, Facebook®, and online community forums (e.g., ITE Community) to share
information among practitioners who are tackling many of the challenging topics
regarding traveler information for nonrecurring events.
Industry contacts: Informal meetings often aid in providing a view into trends. Industry
contacts were established and contacted throughout the research process. The team
reached out to traffic management center (TMC) pooled fund study members along with
engineers, ITS managers, TMC systems operators at State transportation departments,
and other contacts via email and telephone to conduct brief interviews. This allowed the
team to leverage contacts from other projects simultaneously.
News: News websites, magazines, and trade journals were searched. (Note that helpful
websites, magazines, and trade journals are documented throughout the report.)
Once key sources were identified, they were analyzed in terms of the following:
Range of content and level of detail.
Treatment of general principles, techniques, specific parameters, and features that could
be applied to the task at hand.
Relevance—both technological and practical.
Audience/practitioner, including driver needs and desires of content, mode, and timing.
Potential for impact on traveler information operations, management, and dissemination.

8
ORGANIZATION OF REPORT
The remainder of the report is organized into the following chapters:
Chapter 2 discusses traveler information needs and decisionmaking processes around
nonrecurring events.
Chapter 3 provides a brief overview of agencies’ dissemination methods and practices to
provide a general impression of the range of available methods, emerging technologies,
and trends.
Chapter 4 highlights some of the common challenges and issues practitioners face when
implementing a traveler information system for nonrecurring events.
Chapter 5 presents two brief case studies of successful traveler information for
nonrecurring event implementations. The case studies were chosen from the set of
implementations briefly discussed in chapter 2.
Chapter 6 presents lessons learned and conclusions.
Appendix A provides example messages for a range of events as well as information
regarding message timing in respect to the event and delivery method.
Appendix B offers a sampling of mobile apps from State transportation departments and
other regional sources.

9
CHAPTER 2. USER INFORMATION NEEDS AND DECISIONMAKING
Schofer, Khattak, and Koppelman define traveler behavior as the process of individual
decisionmaking about what trips to make, where to visit, when to depart, what mode of travel to
utilize, and what route to follow.(1) In the rapidly changing environment of today’s society,
individual needs and trip purpose are often fluctuating. Pre-trip information, such as the location
of traffic incidents and traffic congestion, is often available from a variety of sources, such as
local news and radio reports. This chapter highlights traveler decisionmaking, user information
needs, and traveler behavior.
Decisionmaking is defined as the thought process for selecting a logical choice from the
available options by weighing the positives and negatives of each option and considering all the
alternatives.(2) Decisionmaking is not always an error-free process and can be affected by various
factors including, but not limited to, fatigue, lack of information, perceived or real-time pressure,
and stress.(3) In addition, when in an unknown situation that may elicit stress, decisionmakers
(e.g., drivers or travelers faced with information about a nonrecurring event) may experience the
following:
Seek out certainty (and are less tolerant of ambiguity).
Attempt to make fast decisions and seek out closure.
Narrow perception due to sensory overload (e.g., tunnel vision).
Demonstrate suboptimal judgment due to perception distortion.
Experience decreased capacity to handle complex tasks.
Choose risky alternatives.
In addition, not all decisionmakers operate or approach, perceive, or navigate problems the same
way. As a result, the following individual differences can have an impact on how travelers
understand traffic-related messages:
Age-related differences in processing, perceiving, and understanding messages as well as
the decisions and strategies chosen.
Personality differences in style, types, and preferences.
Cultural/language (including regional differences within the United States).
Familiarity with area (e.g., local commuters versus tourists).
Information influencing driver decisionmaking has three layers. The first layer is the initial
observation, which includes providing primary information. The second layer is secondary
information (i.e., passive messages). The third layer is the tertiary information, which represents
the actively sought specifics. When providing information to drivers, the goal is to help them
make a decision to avoid disruption at the highest level with the least amount of interaction with
traveler information sources.

10
According to Torma-Krajewski and Powers, an effective decisionmaker is confident and
competent, is knowledgeable of the situation, seeks advice, takes advantage of opportunities,
remains flexible and open to new options, is calculated and selective, takes a comprehensive
approach to decisionmaking, has initiative to make a decision, and has a good understanding of
his or her own abilities.(4) Specifically, driving-related decisions should be timely to minimize
delays resulting from driving into an incident or other delay-inducing events, such as work
zones, and should accomplish a specific objective or mission. To reduce the difficulties
experienced by drivers when confronted with decisions, all forms of uncertainty must be
minimized, and all information necessary to make a good decision should be provided at the time
that the decision needs to be made.
Certain precautions must be taken when developing strategies for assisting the decisionmaking
process, especially in situations of nonrecurring events where there may be limited or rapidly
changing information (e.g., evacuations and emergency situations). For example, providing too
much information can cause drivers to forget already processed information, which may induce
mental fatigue or delay the actual decision.(4)
INFORMATION NEEDS FOR NONRECURRING EVENTS
When reviewing research findings about travelers’ information needs and wants for nonrecurring
events, it is important to consider how rapidly the traveler information environment is evolving.
For example, dynamic message signs (DMSs) and other ITS features have become increasingly
common, and Internet sources or social media in particular (e.g., Twitter™) have become much
more prevalent, reliable, and, popular. Smartphones in particular have allowed travelers to access
an incredible amount of information in real time wherever they are, including on the road. The
rapid evolution of traveler information options and availability means that information about
traveler preferences for routing can be outdated even if the data are only a few years old.
Therefore, the literature discussed in this section should be considered with that caveat in mind.
Higgins et al. conducted a study on behalf of the Wisconsin Department of Transportation
(WisDOT) to better understand drivers’ decisionmaking processes when faced with unexpected
lane restrictions or closures.(11) The researchers conducted focus groups and traveler surveys with
commuters in two Wisconsin cities (n = 20, where n is the total number of observations). Focus
group results showed that traffic congestion and travel speed were primary factors in determining
route choice for commutes. During hazardous weather such as snow, the perceived safety and
accessibility of the route was a factor. For example, some drivers preferred driving on freeways
because of specific features such as divided traffic and wide shoulders. About half of the
participants indicated that they check traffic conditions at least occasionally before beginning a
trip using a variety of information sources, including WisDOT’s website, TV, radio, and mobile
apps.(12) Participants were mixed in their willingness to divert to alternate routes. Factors in
choosing an alternate route included the availability of viable alternates, expectation of time
savings, and easy access to relevant traveler information. The focus groups revealed that
participants were sometimes suspicious of alternative route suggestions because of concerns that
the alternate route would be overburdened by diverting traffic.(11) They also expressed
uncertainty about whether the alternative was consistent with the planned destination as well as
that the alternative might be less direct than the current route.
11
When asked about their information needs and preferences, participants expressed an interest
in obtaining information related to traffic, roadway, and weather conditions.(11) If participants
encountered a delay-causing event, most wanted to know the cause of the delay, the length of
the expected delay, travel time on the original route, and the time that the delay was expected
to be resolved. Some participants also wanted to know pre-trip route planning information,
recommended exit numbers to divert around a delay, and messages about special events that
could affect traffic. They also expressed the desire for obtaining advance notifications prior
to a diversion point.
When asked about specific information sources, participants generally liked DMS messages.(11)
Few had used HAR, 511, the WisDOT mobile website, or traffic mobile apps.(12) Participants had
mixed opinions of receiving text messages due to the risks of reading text messages while
driving.
Higgins et al. also conducted focus groups with commercial vehicle drivers.(11) These drivers
frequently received traffic information from other drivers via citizen band (CB) radio and could
choose an alternate route based on previous experience or guidance from dispatch. They also
used DMS while en route. Drivers were aware of the availability of traffic incident alert
information, but because the alerts were given for the entire State with no customization option,
most drivers chose not to receive these alerts.
When asked about their information needs and preferences, commercial drivers indicated that
they wanted detailed information about planned construction over the next 10 d, traffic and
delays, length of delay, and bridge height/weight for available routes.(11) It would also be
beneficial to create a commercial driver page on the WisDOT website as well as additional
mobile traffic information resource apps and real-time text-to-voice message updates.(12)
Higgins et al. also conducted traveler information surveys at DMV locations and online
(n = 287).(11) Results show that the most commonly used sources of traveler information for
drivers were travel websites other than WisDOT/511 (such as other private sector online
mapping tools), road signs/DMSs, radio, mobile apps, mobile websites, and television. It is
notable that participants were more than three times as likely to use a non-State transportation
department website than a State transportation department website.(11)
When participants were asked about the types of information they wanted to receive about a
delay, the answers, from most to least important, were length of delay, recommendations for
alternate routes, general traffic-related messages indicating that drivers should take an alternate
route, and expected travel time on usual route.(11) When asked about specific information related
to alternate routes, participants most wanted to know how long the congestion delay on the usual
route would last, travel time on the alternative route, and the name of the alternative route. If the
information was for an unfamiliar trip, turn-by-turn directions for the alternate route and a map
of the alternate route were especially desirable regardless of the source.
A survey conducted by Sun et al. investigated the route choices of truck drivers.(13) Data
collection took place during February and June 2012 at three rest area and truck stop locations
along major highways in Texas and Indiana as well as Ontario, Canada. Part of the survey
questioned truck drivers about the sources of information that affected their routing choices.

12
Commonly cited factors included prior experience/knowledge, maps, and navigation systems.
While en route, the most common source of information was other truck drivers via CB radio.
When considering whether to choose an alternate route, truck drivers were likely to consider the
availability of fueling stations, predictability of travel time, and availability of truck parking.(13)
Schroeder and Demetsky investigated the effects of various DMS content strategies on the
likelihood that drivers would choose one of two viable alternate routes (i.e., I-95 or I-295) in the
Richmond, VA, area.(14) Results showed that changes in DMS wording could influence diversion
rates or the number of drivers who actually decided to take an alternative route after seeing the
DMS message. The authors recommended that traffic managers provide estimates of travel times
for the original route and alternate routes to encourage diversion. DMS text should be consistent
in format, use one-phase messages, avoid all capital letters, and be staircase or left-justified.
The Kansas City Scout Advanced Traffic Management System is a comprehensive traveler
information and traffic congestion management system that is a joint effort between the
Missouri and Kansas TMCs. Kansas City Scout has two main traveler information dissemination
methods: its website (see figure 1) and CMSs.(15) The website shows a live traffic map of
Kansas City, MO/KS. The map also includes clickable live traffic cameras and CMS messages,
as well as locations of incidents, scheduled closures, and special events. Once on the road,
drivers can use the network of freeway CMS. These CMSs are primarily used to provide
travel time information but can also be used to provide incident information.
Screen Capture ©Kansas City Scout, Kansas Department of Transportation, and Missouri
Department of Transportation (Map in screen capture ©Google® Maps™).
Figure 1. Screenshot. Kansas City Scout website.(15,16)

13
To gauge driver feedback, Kansas City Scout conducted a mobility survey in spring 2015.
The survey gathered feedback about preferred ways for travelers to receive real-time traffic
information pre-trip and en route. Survey results indicated that before beginning trips, the
preferred information source for drivers was the Kansas City Scout website map and mobile
app.(15,17) While en route, drivers indicated that DMSs were the preferred means for obtaining
real-time traffic information. The survey also asked drivers about their preferences for the types
of information that they would like to see on DMSs. Drivers ranked DMS messages in the
following order of importance: (1) incident and lane closures, (2) roadwork, and (3) weather
updates.
INTERNATIONAL PERSPECTIVE REGARDING TRAVELER PREFERENCES
Chang et al. investigated automobile and commercial travelers’ requirements of multimodal
travel information systems in New Zealand.(9) The research was carried out between
October 2014 and May 2015 in several stages, which included surveying the public through
indepth user interviews and online surveys at sites in Dunedin and Auckland. Through the
survey, drivers across both cities identified delays, detours, and parking information as their top
three pre-trip information needs. Across both cities, important information sought en route
included road closure, delay, and detour information. In Auckland, route planning and trip
duration was ranked higher as a pre-trip need than in Dunedin. The authors speculated that this
may be due to Auckland’s size and longer commuting times and distances along with having a
more complex transportation network, though no significant differences between the two sites
was shown.(9)
Muizelaar provided findings from a Dutch online survey that included several components,
including examining the impact of nonrecurring events on traffic.(10) Three nonrecurring
situations were presented to drivers: crashes, road work, and large events. In the case of crashes,
travelers wanted to receive extended traffic information, such as the cause and expected duration.
Travelers wanted to be able to make their own route choice from that information. In regard to
road work, travelers showed a greater preference toward wanting to receive information about
the fastest route. In the case of large events, travelers preferred receiving information that
increased their comfort level for accuracy of the information.


15
CHAPTER 3. TRAVELER INFORMATION FOR NONRECURRING EVENTS STATE
OF THE PRACTICE
BEST PRACTICES FOR IMPLEMENTATION
This section summarizes the range of appropriate apps, including their delivery medium, related
emerging technologies, and agency practices. Table 1 provides a summary of preliminary
implementations reviewed. A few of the implementations were chosen for further discussion in
this section. The case studies presented in chapter 5 also address some of these implementations.
Table 1. Preliminary list of candidate implementations.
Location Implementation Technologies
Florida Florida Department of Transportation 511 and private
partnership.(18,19)
Georgia NaviGAtor™, which is a traveler information Web
page.(20)
Lake County, IL Lake County Program for Arterial Signal
Synchronization and trAvel GuidancE (PASSAGE),
which is a traveler information Web page.(21)
Minnesota Minnesota Department of Transportation (MnDOT)
511 mobile app (MN 511), which is a mobile app that
provides traveler information.(22)
Pennsylvania Turnpike PA TURNPIKE TRIP TALK APP, which is a mobile
app that provides traveler information.(23)
San Francisco Bay area (through the
Metropolitan Transportation
Commission)
511 SF Bay, which is a one-stop phone and Web
source for up-to-the-minute Bay Area traffic, transit,
rideshare, and bicycling information.(24)
Texas I-35 “Smart Work Zone,” which uses DMSs to
provide real-time details to motorists on I-35 about
travel impacts due to active work zones.
Washington, DC, metro area Regional Integrated Transportation Information
System (RITIS) chat instant messaging tool, which is
used by members of the I-95 Corridor Coalition and
other interested parties.(25)
Washington Washington State Department of Transportation
(WSDOT) mobile app that provides traveler
information.(26)
Wisconsin 511 Wisconsin, which is a traveler information Web
page.(27)
Wyoming Weather Responsive Traffic Management and Rural
ITS, which provides road weather information during
weather events and applies variable speed limits to
improve safety during weather events.

16
Data Collection Technology
Data collection technology in traveler information system apps is currently applied by both
public agency and private sector stakeholders. Public agencies typically use fixed location
equipment. Common systems for data collection at discrete locations include induction loop
detectors, ultrasonic and microwave detection, and camera systems. Some agencies, in order to
reduce costs associated with urban freeway systems, use detection systems for the entire roadway
at longer intervals while detecting a typical lane at closer intervals for adequate data resolution.
This field detection hardware is connected to a field cabinet, and data transmission to a
centralized processing facility is typically achieved with ground-based communications. In
older systems, leased and owned copper cable systems are used (i.e., four-stranded phone lines).
Conversely, newer systems and those on reconstructed freeways are connected to fiber-optic
networks, generally using Internet provider-addressable detection and communications hardware.
The traffic data, typically detector occupancy, are processed by the agency, and algorithms are
used to generate travel times and congestion limits. This information is typically provided free of
charge to media outlets, often with a dedicated information terminal, and by means of websites
and mobile apps.
Private sector data collection efforts are typically executed using position data from private
mobile devices. These position data are generated by the cellular network and enhanced with
wireless connection triangulation and GPS location information provided by the device. The
users of these apps agree to the privacy statement and are therefore providing the information in
accordance with the privacy policy of the app developer and device vendor, which is typically a
cellular network provider. The position data are processed by the app vendor and used to service
their product. They are also often sold to service other products.
The extent of the data collection activities in western Washington is indicated by the Seattle,
WA, traffic map (see figure 2), which indicates the degree of congestion on the system during
the early part of the afternoon peak period. Many of the areas on lesser traveled freeways or
urban fringe roadways are depicted in gray, indicating a lack of information due to the areas not
being covered by the agency’s detection hardware.(28) A similar view, from a Web-based private-
sector provider, would show information available throughout the system because users of those
mobile apps and mobile devices tied to that data collection system are traveling throughout the
system.

17
Screen Capture ©WSDOT.
Figure 2. Map. Screenshot. Traffic map of Seattle, WA.(28)
While ubiquitous mobile device use has provided a platform for traveler information
dissemination, app creators must consider integration across all modes of travel and for a wide
variety of users.
In the 1990s, traveler information was disseminated using traditional media sources that did not
include the Internet, such as television and terrestrial radio, as well as via roadside infrastructure,
such as variable message signs (VMSs). As the Internet emerged and information became
accessible at home and in the workplace, Web-based portals for traffic information became
popular. An example of the type of traffic maps pioneered by agencies such as WSDOT is shown
in figure 2.(28) This map is still accessed by a large number of users, even on mobile devices,
because it is straightforward and provides a consistent display of traffic information. Also, it
does not require a lot of data usage, so it downloads quickly.
Traveler information regarding transit operations can also be obtained using mobile devices, but
the utility of displays at transit stops and train stations lies in its ability to serve all users,
regardless of economic availability of mobile data or the availability of a reliable mobile data
connection itself. In the deployment of new bus rapid transit corridors, agencies such as the King
County Metro in King County, WA, as well as other operating regional bus systems have
deployed ITS infrastructure to provide arrival time displays at transit stops. Even traditional
static maps, which are occasionally made interactive with touch-responsive displays in some
transit stations, are a useful tool when coupled with a static copy of the schedule.

18
Mobile Devices
Mobile devices can offer travelers information on every mode of travel, including transit buses,
transit trains, intercity and regional rail, and travel times for various modes of travel. One
significant advance is the ability of mobile apps to predict travel times for various modes or
combinations of modes based on expected traffic conditions. Additionally, the use of mobile
devices for determining the availability of parking in a dense urban area or the best choice for a
transit connection based on parking availability (commonly used in Germany) is mainstream and
serves to reduce congestion in urban areas by eliminating superfluous parking searches.
As digitally available traveler information systems evolve, it remains important for agencies and
traveler information providers to provide not only mobile access but also Web-based access on
nonmobile devices and access using terrestrial radio and in-vehicle telematics. Each of these
systems has a different role and can display information based on the potential for user
distraction (e.g., leading mobile devices to fill an important gap between websites and in-vehicle
telematics).
Social Media
Numerous large municipalities and several State transportation departments have made extensive
use of Twitter™, which is a short-message social media platform that emphasizes networks of
followers. Typically, owing to the brevity of Twitter™ messages and their short duration in a
user’s media feed, agencies use Twitter™ to share information regarding transient events,
rapidly changing conditions, and travel advisories. The more static nature of Facebook® and its
platform for sharing longer messages and more images is used by certain State transportation
departments to support information on the impacts of construction projects, project development,
opportunities for public involvement, and the general work of the agency.
Private companies collecting and sharing traffic data have created their own social networks. For
example, some apps have created a platform where users can share information with each other.
Case study 1 in chapter 5 further addresses some of the social media techniques that agencies are
using to reach larger audiences inexpensively while ensuring that the agency’s mission and
message remain consistent.
Integration with Partners
Partnerships exist between agencies and media outlets, agencies and data suppliers, and agencies
and other agencies. Partnerships between agencies and media outlets help agencies improve the
delivery of information by broadening their reach, while partnerships between agencies and data
suppliers create a new market for agency data and improve the reliability of information with
additional and supplemental data from the suppliers. Agencies form partnerships with other
agencies in an effort to share information and resources, facilitate coordinated emergency
response operations, and ease traveler transition between regions while providing a platform for
meeting multi-agency regional objectives in traveler information.
In northeastern Illinois, the Illinois Department of Transportation provides travel time
information to media outlets through a dedicated feed option, in addition to disseminating that
information through the Great Lakes Regional Traffic Operations Coalition portal (see figure 3).

19
Screen Capture ©Illinois Department of Transportation and Great Lakes Regional Transportation Operations
Coalition partners in cooperation with the University of Illinois at Chicago Artificial Intelligence Lab (Map in
screen capture ©NAVTEQ).
Figure 3. Screenshot. TravelMidwest website.(29)
The TravelMidwest website (formerly referred to as the “Gary-Chicago-Milwaukee Corridor”
website) provides access to information, including cameras, VMSs, and other data, from multiple
agencies across three States (Wisconsin, Illinois, and Indiana), including a toll authority.(29)
Other notable interregional efforts to consolidate traveler information and provide a framework
for large-scale incident management include the I-95 Corridor Coalition and RITIS, which is a
tool designed to facilitate efforts to disseminate traveler information among both managing
agencies as well as cooperating agencies.(25)
EMERGING TECHNOLOGIES AND TRENDS
This section highlights the latest approaches and technologies used in traveler information for
nonrecurring events. Private sector data and mobile apps are included in the discussion.
Private Sector Data
Agencies have long used hardware that they maintained and operated as a means of collecting
traffic data, weather data, and imagery, with the objective of providing information to the
traveling public as necessary to manage the system and inform road users of travel times and a
range of traffic incidents. The proliferation of mobile devices has enabled private sector
entities to collect and quickly disseminate reliable data on vehicle speeds, traffic congestion,
and incidents.

20
Agencies without extensive surveillance and traffic data collection systems are sometimes
choosing to forego extensive public investment in those systems and are instead turning to
private sector suppliers.
Integration with Vehicle Telematics
In the last 15 yr, on-board vehicle systems with connections to the Internet as well as satellite-
based communications systems have become standard equipment in many vehicles. Many cars
with GPS-based navigation systems and full-color screens also offer traffic condition overlays on
those maps, incident information (including reoccurring and nonrecurring special events), and
even navigation system-based dynamic rerouting.
Traveler information systems play an important role in vehicle operations and electric vehicles
in particular. The range of an electric vehicle is heavily impacted by operating conditions, and
traveler information systems can provide information the vehicle can use to predict the impact of
traffic conditions, speed on hills, and even weather conditions to provide accurate determination
of range and the viability of alternative routes.
Road Weather Information Systems
Efforts are underway in Wyoming and other States to integrate road weather information from
connected vehicles with traveler information systems and current systems that use fixed location
weather stations. Part of this development involves the incorporation of feedback from vehicle
speed, accelerator position, and inputs from vehicle stability control systems to determine
road conditions and the applicability of traveler messages related to inclement weather and
deteriorating road surface friction characteristics. These weather-related messages can also
promote safety by altering road user behavior with messages.
DISSEMINATION METHODS AND MEDIA
This section focuses on some of the common approaches used to provide traveler information
to the public for nonrecurring events. The general methods for establishing and implementing
programs for traveler information systems for nonrecurring events are discussed with brief focus
on each type of media (e.g., mobile apps, radio, CMSs, HAR, 511). Examples include the
following:
511 telephone system: The 511 telephone system is a publicly operated telephone hotline
available free of charge to the traveling public. The system primarily disseminates
information on crashes, road closures, construction, or other events. The reporting that is
provided is more generic (e.g., road work from X date to X date), and daily impacts are
usually not reported. The system is most effective when the information is available from
a variety of reliable sources, such as road weather information systems (RWISs), closed-
circuit television (CCTV), roadside detection (RS-D), and environmental sensing systems
(ESSs), among others.
DMSs: Also known as VMSs or CMSs, DMSs can alter the displayed message to provide
travelers with important information about nonrecurring events. For example, messages
about events can be displayed on a DMS upstream of affected areas and provide

21
alternate routes. Portable DMSs can be strategically placed to provide advance
information for planned events or long duration events. Signs are often placed on
freeways within a region or corridor, and this may expand to high-speed arterials over
the next 10 yr based on industry experts’ predictions.(30)
Traveler information websites, including 511: Traveler information websites provide
real-time traffic condition reports about information such as work zones, weather
conditions, traffic speed, message signs, traffic events, and incident reports. Similar to the
511 telephone system, these websites are publicly operated. They can be accessed via
desktop or laptop computer as well as via mobile devices.
HAR: HAR provides free roadway information in particular areas. It is an en-route
information source, and users must tune in to a specific channel (using an AM or FM
radio band) that is often specified on a roadway sign to obtain information. HAR
provides traveler information about road closures, work zones, incidents, alternate routes,
and current roadway conditions. Information that is provided is gathered from RWISs,
ESSs, RS-Ds, CCTVs, pavement sensors, and other technologies that gather roadway
information. One of its limitations is its reliability with its reach due to radio
transmission.
Mobile apps: Mobile apps are available for smartphones, tablets, and other portable
devices. They are available through private companies and, increasingly, from the public
sector through State and regional transportation agencies. Examples include the
following:
o Private sector: Mobile apps that are provided through a private company provide
travelers with pre-trip and en-route directions and traffic information that are free
community-based platforms for road users to share information about local roads.
o Public sector: Public sector mobile apps generally provide camera images of
specific incidents as well as their nature and duration. They also generally provide
information for other transportation modalities aside from roadways (e.g., ferry
and rail service; see the Case Study 1: Mobile Apps section in chapter 5 for an
example). Mapping services for these apps are generally integrated with online
mapping software.
Social media platforms: Two commonly used platforms include the following:
o Twitter™: This short-message social media platform (i.e., messages are currently
limited to 140 characters) emphasizes networks of followers. Typically, owing to
the brevity of Twitter™ messages and their short duration in a user’s media feed,
agencies use it to share information regarding transient events, rapidly changing
conditions, and travel advisories. Messages can include hyperlinks to an agency’s
website for additional information as well as hashtags that allow users to search
for or follow only messages that relate to their routes or areas of travel (e.g., a
hashtag can be created specifically for a major road work project or for stadium
events).(11) Users can share (i.e., retweet) messages at any time, so it is important

22
to post messages with timestamps for nonrecurring events so that outdated
messages are not perceived to be current.(31)
o Facebook®: This platform is generally used for sharing longer messages and
images. It can be used to provide information on the impacts of construction
projects, project development, opportunities for public involvement, and the
general work of an agency.
Alerts systems: Alert systems are subscription-based systems available in some regions
and metro areas that allow users to sign up to receive emergency alerts and warnings,
which may include alerts on major nonrecurring traffic events. These systems often allow
users to customize the areas of interest to them, the types of messages they want
to receive (weather, traffic, schools, etc.), and how they want to receive them
(email, text message, etc.). Information is “pushed” to users, allowing rapid
dissemination. Users can then make decisions either pre-trip or en route based on alerts.
Radio: Radio via the AM/FM radio band is a traditional method for receiving travel
information. It is easy to access and assists travelers with en-route travel planning. It
provides only brief details about events (e.g., the location of a crash).
Television: Television is another traditional method for receiving travel information
through the local news media outlets. Similar to radio, it is easy to access, and travelers
can use this method before trips. It, too, typically provides only brief details about
incidents or delays.
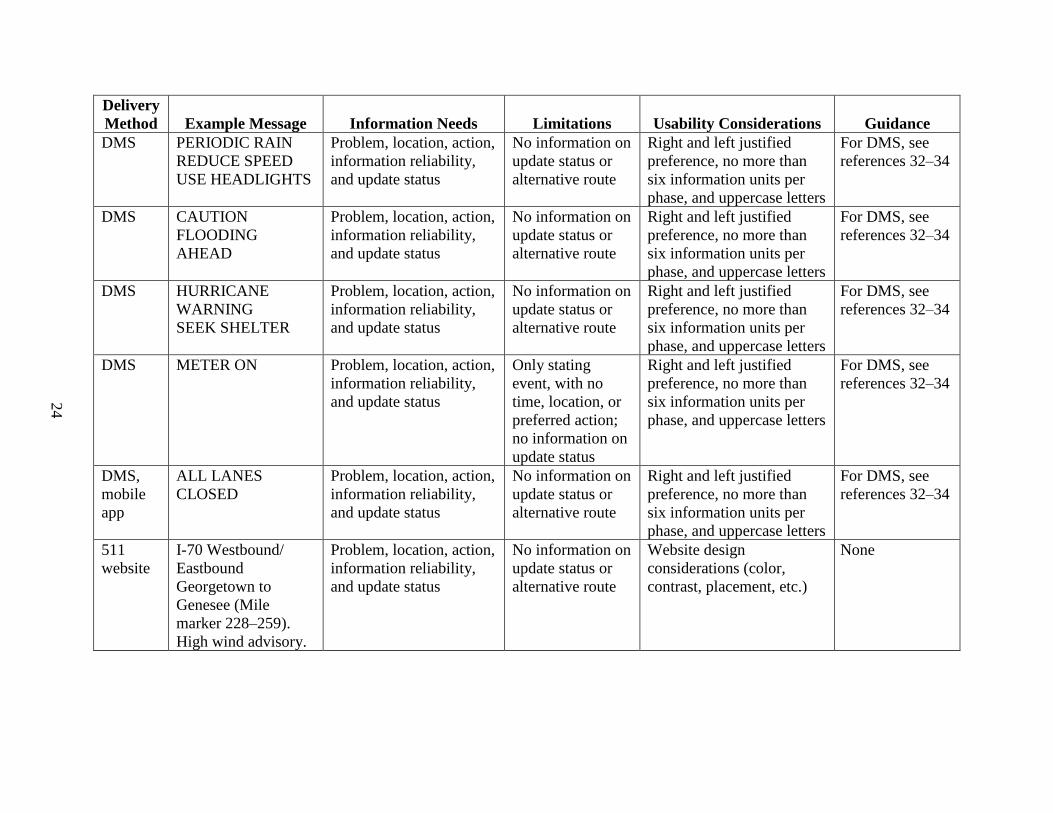
MESSAGE TYPES AND EXAMPLES
This section focuses on some of the common messages and examples used to provide traveler
information for nonrecurring events. Table 2 provides a summary of example messages
for various types of situations and delivery methods. In addition to the messages, the table
provides information about the needs and limitations of the message type as well as usability
considerations and sources for further guidance on message design. Note that there are very few,
if any, direct sources investigating these needs specifically for nonrecurring event information.
Several studies or guidance documents include nonrecurring events along with other types of
traveler information, and the table draws from a variety of broader sources (see table 2 for
relevant sources).

23
Table 2. Example messages for various types of situations and delivery methods.
Delivery
Method Example Message Information Needs Limitations Usability Considerations Guidance
DMS
I-95 NB CRASH;
AT RTE 240;
EXPECT LONG
DELAYS
Problem, location, action,
information reliability,
and update status
No information on
update status or
alternative route
Right and left justified
preference, no more than
six information units per
phase, and uppercase letters
For DMS, see
references 32–34
DMS
CONGESTION
AHEAD/
REDUCED SPEED;
15 MPH
Problem, location, action,
information reliability,
and update status
No information on
update status or
alternative route
Right and left justified
preference, no more than
six information units per
phase, and uppercase letters
For DMS, see
references 32–34
DMS
WATCH FOR
STOPPED TRAFFIC
Problem, location, action,
information reliability,
and update status
No information on
update status or
alternative route
Right and left justified
preference, no more than
six information units per
phase, and uppercase letters
For DMS, see
references 32–34
DMS
RIGHT LANE
CLOSED; 5 MILES
AHEAD/REDUCE
SPEED
Problem, location, action,
information reliability,
and update status
No information on
update status or
alternative route
Right and left justified
preference, no more than
six information units per
phase, and uppercase letters
For DMS, see
references 32–34
DMS
ROAD CLOSED
AHEAD; FOLLOW
DETOUR
Problem, location, action,
information reliability,
and update status
No information on
update status
Right and left justified
preference, no more than
six information units per
phase, and uppercase letters
For DMS, see
references 32–34
DMS
ICY SPOTS, NEXT
5 MILES
Problem, location, action,
information reliability,
and update status
No information on
update status or
alternative route
Right and left justified
preference, no more than
six information units per
phase, and uppercase letters
For DMS, see
references 32–34
DMS
ICE ON BRIDGE
SLOW
Problem, location, action,
information reliability,
and update status
No information on
update status or
alternative route
Right and left justified
preference, no more than
six information units per
phase, and uppercase letters
For DMS, see
references 32–34
24
Delivery
Method Example Message Information Needs Limitations Usability Considerations Guidance
DMS PERIODIC RAIN
REDUCE SPEED
USE HEADLIGHTS
Problem, location, action,
information reliability,
and update status
No information on
update status or
alternative route
Right and left justified
preference, no more than
six information units per
phase, and uppercase letters
For DMS, see
references 32–34
DMS CAUTION
FLOODING
AHEAD
Problem, location, action,
information reliability,
and update status
No information on
update status or
alternative route
Right and left justified
preference, no more than
six information units per
phase, and uppercase letters
For DMS, see
references 32–34
DMS HURRICANE
WARNING
SEEK SHELTER
Problem, location, action,
information reliability,
and update status
No information on
update status or
alternative route
Right and left justified
preference, no more than
six information units per
phase, and uppercase letters
For DMS, see
references 32–34
DMS METER ON Problem, location, action,
information reliability,
and update status
Only stating
event, with no
time, location, or
preferred action;
no information on
update status
Right and left justified
preference, no more than
six information units per
phase, and uppercase letters
For DMS, see
references 32–34
DMS,
mobile
app
ALL LANES
CLOSED
Problem, location, action,
information reliability,
and update status
No information on
update status or
alternative route
Right and left justified
preference, no more than
six information units per
phase, and uppercase letters
For DMS, see
references 32–34
511
website
I-70 Westbound/
Eastbound
Georgetown to
Genesee (Mile
marker 228–259).
High wind advisory.
Problem, location, action,
information reliability,
and update status
No information on
update status or
alternative route
Website design
considerations (color,
contrast, placement, etc.)
None

25
Delivery
Method Example Message Information Needs Limitations Usability Considerations Guidance
511
website
Motorists are advised
of possible heavy
smoke on Interstate
10 east and west
bound in Santa Rosa
county. Use caution.
Problem, location, action,
information reliability,
and update status
No information on
update status or
alternative route
Website design
considerations (e.g., color,
contrast, and placement)
None
Social
media
***TRAVEL
ALERT ***High
winds, blowing dust,
and limited visibility
Problem, location, action,
information reliability,
and update status
No information on
update status or
alternative route
None None
Social
media
Magnitude 4.8
earthquake followed
by two small jolts
strike east of Fresno
Problem, location, action,
information reliability,
and update status
No information on
update status
None None
Social
media
Downed trees are
causing issues on
I-277 in Charlotte.
Crews working to
clear road before
evening rush hour.
Problem, location, action,
information reliability,
and update status
No information on
update status or
alternative route
None None
Mobile
app
Heavy Snow Problem, location, action,
information reliability,
and update status
None Legibility and size of text
while driving
None

26
Table 3 in appendix A provides a taxonomy of message types that can be used for traveler
information about nonrecurring events. It provides information and messages where possible,
although it is not complete due to a lack of examples or information in the literature for some
situations. The table indicates the event type, messages that can be delivered at various times
(before an event, at the time of an event, after an event has begun, etc.), the delivery method, and
example messages. Events addressed include incidents such as work zone and weather-related
events. The information contained is based on current practices. It should be noted that there is a
desire for information about when a current event will end (including those that are more
difficult to predict, such as unplanned events), although that is not common practice.(11) Table 3
can be used as a tool to plan messaging strategies for a wide range of potential nonrecurring
events.
MESSAGING STRATEGIES
Earlier sections of this report addressed user information needs, dissemination methods, and
message examples. These topics can be synthesized to develop high-level strategies and best
practices for dissemination of information for nonrecurring events.
Planned Events
While rapid dissemination of information for unplanned events is key, planned events allow an
agency some time to prepare and inform travelers in advance of the event. Information can be
targeted toward individuals who are planning to travel to an event such as a concert or festival, or
it can be targeted to other travelers who will be affected by the event. Advance information can
be provided in a variety of ways. For example, press releases and other free media can be used to
broadly share information through television and radio, and billboards and other print media can
also be developed. Additionally, multiple agencies can coordinate to maximize outreach.
Advance information can also be disseminated on roadways. For example, DMSs can be used
to alert drivers to upcoming road work in the area. If a fixed DMS is not present in the to-be-
affected area, fixed signage or a portable DMS can be moved to the area on a temporary basis.
Planned events also provide traffic managers with a greater opportunity to provide travelers with
solutions. The public can be encouraged to take alternate modes of transportation or alternate
routes. For example, detour signage can be set up to route drivers around road work events.
Where planned events occur with some regularity (e.g., near a stadium), dynamic devices such
as trailblazer signs, lane control signs, and blank-out signs can be installed to aid in providing
traveler information.(35) The Federal Highway Administration (FHWA) notes that current
practices for planned events tend to be event specific, so there is no universal set of best
practices to providing traveler information for planned events.(36)
Matching Traveler Information Needs and Expectations
Nonrecurring events may lead to unexpected congestion, delays, and detours while
inconveniencing and frustrating travelers. Whereas recurring congestion (e.g., urban commute
traffic) is often predictable and somewhat consistent over time, nonrecurring congestion may be
much less predictable. Travelers want information that helps them understand the nature of a
nonrecurring event and how to minimize the impact of the event on their travel. Information

27
provided to travelers before their trips or early enough in their trips so that they can take alternate
routes can lead to time-savings benefits for travelers as well as broader traffic flow benefits.(11,37)
Even if the information does not result in any concrete benefits, such as time savings, simply
understanding the reason and the scope of the unexpected travel disruption provides a stress-
relieving benefit to drivers.(30,33)
When choosing a route or considering diverting from a route due to an unexpected event, drivers
may want to know the delay or disruption it will cause, availability and time savings of alternate
routes, cause of the delay, and when the event (or the resulting congestion) is expected to end.(11)
When traveling in an unfamiliar area, drivers may also want turn-by-turn directions for the
alternate route, a map of the route, and exit numbers where they can leave and return to the
original route.(11) Commercial drivers have special concerns regarding route diversion because of
the potential for commercial vehicle restrictions (height, hazardous materials, etc.) and other
concerns such as narrow or steep roads. They could benefit by receiving advanced notice of
planned events and information about height and weight restrictions on available routes.(11)
The affected locations by a nonrecurring event should be described as specifically as possible
so travelers can tell if their planned route is affected. It is important that travelers receive
accurate and current information. One solution would be to add timestamps to messages.(31)
Nonlocal Versus Local Travelers
Nonlocal drivers, such as tourists, business travelers, and long-distance through drivers, differ
from local drivers in some important ways. Nonlocal drivers are likely to be less familiar with
area roads, alternative route options, transit alternatives, planned events, congestion patterns, and
sources of traveler information. They may benefit from en-route information such as DMSs,
especially when clear route guidance is provided.(11) This is especially important for areas with a
large percentage of unfamiliar drivers. For example, Anaheim, CA, has a network of arterial
DMSs to provide information to tourists around Disneyland®.(30)
Nonagency Traveler Information Context
Prior to the advent of the Internet, transportation agencies and local television and radio stations
were largely the only providers of traveler information. In recent years, however, the Internet has
enabled the private sector to enter this domain. Websites and apps allow drivers to automatically
plot the fastest route to their destination, view traffic conditions and delays, select alternate
routes and alternative transportation modes, and identify the cause and location of a nonrecurring
event. These platforms can be used pre-trip or en route. Some stand-alone navigation devices
also provide real-time traffic information. Such systems are powerful traveler information tools
and popular with travelers. Similarly, travelers may have access to traveler information from
other agencies, including local or State jurisdictions, transit agencies, etc. It is important for
transportation agencies to consider the various information sources available to drivers from
private sector sources, as well as other public sector sources, when considering how best to
provide traveler information within the broader information context available to travelers.
Partnerships with other regional agencies may provide benefits in terms of traveler information
consistency, cohesiveness, geographical range, and multimodal coverage within the broader
framework of integrated corridor management principles.(38)

28
Maximizing Use and Benefits of Traveler Information
Traveler information can only be beneficial to travelers if they know of it and use it. Studies have
found that travelers are often unaware of information available to them through 511 systems,
mobile apps, HAR, and other sources.(11,33) Informing the public of available options and
potential benefits may increase usage. Presenting information on multiple platforms may help
as well. For instance, information about a major nonrecurring event could be posted on social
media, 511 websites, and mobile apps to maximize the likelihood that travelers see the
information. To reduce the likelihood of receiving redundant or irrelevant information, users
may be able to customize the types of messages that are of interest to them and their preferred
notification settings. Finally, the availability and popularity of technologies and information
platforms can change quickly. For example, since the first iPhone® was unveiled in 2007,
smartphones have proliferated. It is important to develop websites and apps that are optimized
for current mobile devices as well as to keep pace with the public’s changing technology
preferences.
EVALUATION AND ASSESSMENT OF THE PUBLIC’S USE AND UNDERSTANDING
OF TRAVELER INFORMATION
There are a variety of methods to assess the public’s use and perception as well as the effect of
traveler information systems. Traditional methods have included call statistics, website hits, and
satisfaction surveys. Although helpful, these methods have limitations regarding understanding
the effect of traveler information on travel behavior and decisionmaking. For example, 511 calls
may spike if an incident occurs but may not result in many people adjusting their travel route,
especially if there is low confidence in 511 accuracy or operation. Similarly, a satisfaction survey
may provide information about the overall likeability of information sources but not the overall
use or effects on travel behavior. In a previous study on real-time travel time signs, it was found
that individuals liked having the signs present but generally did not use them to adjust their trip
behaviors (often due to lack of alternative route options or information).(33,39) Consequently,
assessing the effect of traveler information on trip behavior requires alternative approaches used
in combination with these more traditional methods.
Based on prior experiences and findings, a “toolbox” method could be used to evaluate traveler
information systems (specifically nonrecurring events messaging).(6) This approach combines a
variety of focused, targeted, and low-cost methods such as targeted surveys, focus groups, driver
diaries, and interviews that evaluate different aspects of a traveler information program in a
particular area. It is also desirable to use a combination of methods due to the large variety of
dissemination methods, traveler characteristics, and information types. Findings from these
methods can then be combined to generate a profile of overall system effectiveness, especially
with respect to its effect on trip behavior.
The toolbox should consist of several components that can be inexpensively adapted to a
particular area or region and can provide insight into the effectiveness of a traveler information
program. These practices could be incorporated into a funded evaluation program where outside
expertise can be brought in to execute and properly interpret the findings. The following list
provides examples of methods that can be used:

29
Focus groups targeting particular travelers: Questions should be tested and developed
on populations of interest.
Traveler logs or diaries: This method focuses on effects on actual travel behavior and
looks for shifts in planned route/mode, trip characteristics (occupancy, chaining, etc.),
pre-trip and en-route behavior, outcomes, and perceived benefits. This method should be
used in a limited manner to supplement focus group findings. In fact, focus group
participants can also be invited to participate in a traveler log study.
Targeted surveys: A combination of Web-based surveys and mail-outs should be used.
Interviews: Due to the resource-intensive nature (one interviewer per participant at a
time), this method should only be used for a focused follow-up to some responses or
statements collected in earlier phases through surveys.
The methods described should be used in combination to gather a variety of information. Some
methods are more suitable for certain types of information (e.g., interviews and focus groups are
useful for gaining insight into particular issues the public may have with hypothetical systems or
test implementations, while traveler logs can be a validity check on how frequently people really
change trips and based on what type of information source they use before changing trips). In
order to develop a profile of traveler information effects on trip behavior and traveler
information usage in an area, the following information should be collected:
Traveler type (commuters, elderly, etc.).
Information type (travel time, congestion levels, incident information, weather, work
zone, location, etc.).
Information source or media used (mobile apps, websites, radio, TV, signs, etc.).
Temporal information need (e.g., pre-trip, near trip, or en route).
Traveler perception of quality, accuracy, reliability, and availability of information.
Information comprehension.
Information effect on travel behavior.
Likeability/satisfaction with the traveler information.
Frequency of use.
Traveler perception of risk (e.g., distraction of mobile devices).
Crash data.


31
CHAPTER 4. GAPS BETWEEN PRACTICES AND USER NEEDS, CHALLENGES,
AND ISSUES
This chapter highlights some of the common challenges and issues that practitioners face with
respect to implementing traveler information dissemination strategies for nonrecurring events.
Every implementation and messaging strategy faces a unique set of circumstances and
constraints (geography, topography, budget, rationale for implementation, etc.), and guidance on
this topic cannot be a one-size-fits-all solution. Rather than providing prescriptive guidance, this
chapter focuses on identifying options and practices that can be adapted to the needs of a
particular situation, guiding the practitioner to areas that are needed most by users.
Features of an ideal system according to travelers and where there is agreement with agency
practices include the following:(6)
The system should be targeted, local, and relevant to the consumer and possibly based on
GPS-enabled cell phones or vehicles so that relevant, location-based information is
provided.
The system should be easy to access and use, including when en route.
The system should provide clear, concise, and trustworthy information that is accurate
and reliable.
The system should include information on nonrecurring events that may drastically affect
routes, such as special events, construction/maintenance, or emergencies.
The system should use technologies that are widely available to everyone and easily
implemented (e.g., radio).
These features were recommended by travelers who participated in that study and are not
necessarily complete or recommended by the authors of this report.(6) For example, weather is
not included as information that would affect routes, yet it would be recommended to include as
part of an ideal system. In addition, actionable information should be included but was not
mentioned by participants. Surprisingly, features that are considered less effective by both
agencies and the public are still in wide use today (e.g., HAR).(6)
Similarly, Higgins, et al. found that the following features were preferred by the traveling
public:(11)
The system should indicate the length of expected delay on original route.
The system should recommend a specific alternate route.
The system should provide the travel time on both original and alternative routes.
The system should indicate the time when the roadway event is expected to be resolved.

32
The system should provide exit numbers for unfamiliar alternative routes and ideally
directions with a map.
The system should provide options for radio, DMS, and GPS (with some indication of a
desire for text messages and mobile apps).
There are also some notable examples of where perceptions between the public and the agencies
do not match. It is these instances that are of interest to transportation departments, as they point
to features where resources are needlessly being expended or where features might need
considerable improvement. Some examples of information sources that may be perceived to have
limited effectiveness or where there are disagreements among the public and agencies about
effectiveness are as follows:
HAR: Research by Robinson et al. found that both agencies and the public agree that
HAR has limited effectiveness.(6) Of the methods used by agencies, this was deemed the
least effective method of getting traveler information to the public. The public agrees, as
focus groups and surveys indicated that an overwhelming majority of people do not trust
or use HAR.(6) In addition, Higgins, et al. found similar issues with HAR use by the
public within Wisconsin.(11) However, it should be noted that Al-Deek suggested that
HAR has the potential to provide benefits to drivers.(40) Survey responses showed that
only 24 percent of motorists have used HAR, while only 57 percent were aware of
HAR.(6) Although these numbers indicate a low usage rate, 87 percent of respondents
believed that the service should be continued, while 84 percent said they would use HAR
in the future. Survey results indicated that HAR could also be a valuable tool for
providing emergency information, as 87 percent of respondents said they would use it in
emergencies. Despite these mixed impressions, HAR is widely available to en-route
drivers using their car radios and may be considered worthwhile as part of a traveler
information toolbox, particularly if some improvements are made (e.g., more frequent
information updates or a timestamp to indicate how recently the message was updated).
Social media and mobile apps: Traveler information program features using social
media and mobile apps are receiving increased attention from agencies, as they are
considered effective. From a traveler information program perspective, these features are
perhaps the most “cutting edge” in terms of state of the practice; however, the long-term
viability remains to be seen. From a public perspective, as of 2012, very few people had
been using social media and mobile apps to receive traveler information (although that
has likely increased dramatically since).(6)
511 phone systems: Many agencies have implemented or are moving toward using
511 phone systems, as they are considered to be highly effective, so much so that FHWA
sponsored the 511 deployment initiative along with other entities.(6) However, at the same
time, State legislatures have been moving to ban cell phone use while driving, and the
public’s mindset is changing in the same direction.(6) This may explain why a review of
survey results indicates that making a 511 phone call is not deemed a particularly
effective method of getting en-route traveler information.(6) This may be the result of a
conflict between developing State laws and public perceptions targeting cell phone use
and the desire for en-route travel information. The overall aim for an effective traveler

33
information system should be alignment between the agency’s goals and the public’s
needs/wants. It should be noted that the 511 phone system could still be used by
passengers.
There are several potential gaps between how systems are being operated and user needs that
cut across dissemination methods.(6) Some of these issues are due to implementation or terrain
impediments, while others are related to technology that has not been developed but is needed.
The problem, location, and action (PLA) method is often used to define basic DMS message
content. An example of PLA that was inspired by Lichty et al. is presented in figure 4.(41)
Source: FHWA.
Figure 4. Flowchart. PLA example.
The PLA structure can be broken down further to include message elements that provide the
travel time or may use the word “delay” to let travelers know how severe a situation is. This can
assist them with understanding the expectations about the specific trip or make alternate travel
plans. Example message elements that provide information on the effect on travel include
“X Min Delay” or “Major Delay.” The audience for the action might also be specified by
including the message element “X Metro Area” or “Eastbound traffic.” There also may be
message elements that provide travelers with a good reason to follow the action, such as “Avoid
X Min Delay” or “Best Route to I-95,” which indicates that following the advice on the DMS
could lead to time savings or a safer traveling situation. The following gaps intersect with these
different components to a message and highlight issues with each:
Potential gap 1—location: There are some locations (e.g., rural areas or mountainous
regions) where information about major events (including weather) and related
emergencies need to be projected at a great distance. For example, some areas within
Missouri have grappled with the issue that if there is a major accident or inclement
weather that forces the shutdown of a corridor, then drivers need to be informed upward
of 100 mi out in order to properly route around that town (where there are not viable
alternatives once a driver enters that corridor).(37) Similarly, location-sensitive
information needs to be relevant. In other words, travelers do not want to be inundated
with information about an event hundreds of miles away. Yet, there is a balance between
information about near nonrecurring events as well as messages about distant
nonrecurring events that can affect routing or trip planning. Location may also mean
providing relevant information at key decision points, such as a freeway entrance.(34)
Information about the situation that
the driver will encounter
Flooding Problem
Location
Action
Description of the location or distance
to the situation
Recommendation to the driver in
response to problem and location data
At US-23
Use I-280 East
34
Potential gap 2—timeliness: In addition to being mindful of distance, timeliness of
messages is also important to travelers. For example, providing warning messages about
the potential for ice after cars are starting to spin out on an interstate would not be
considered helpful. Timeliness is a challenge for agencies because gathering and
validating incoming information about quickly changing conditions (weather,
emergencies, etc.) is very complex and difficult. Connected vehicle technology may help
with this due to enhanced localized information from various sources being transmitted
back to the TMC. In addition, greater social media usage on mobile devices and two-way
messaging (from the TMC to the traveler and from the traveler to the TMC) will also help
close this gap.
Potential gap 3—alternative route or action information: A common complaint
by many travelers is the lack of alternative route or action information. In some cases,
this depends on the local terrain, as there may not be any alternative routes to offer as
guidance. Other times, there may be jurisdictional issues between the entities managing
the highways and the local roads. Regardless, system efficiency would seem to benefit
from giving travelers alternative routes or alternative actions to take in the event of a
nonrecurring event. For example, in Nevada, agency representatives1 noted that
compliance of truck drivers to reroute or delay a trip may result from not giving them a
suitable alternative when providing high wind warnings. One possible approach that the
agency representatives are interested in pursuing is partnering with local businesses and
offering parking facilities for truck drivers to take a break until the dangerous wind
conditions subside. If these alternatives are given, then proper messaging is a vital part of
success.
Although these gaps focus on structural and operational aspects, improper input into messages or
dissemination practices could negatively impact travelers’ decisionmaking.
1Phone interviews of (Director of Nevada Department of Transportation’s Freeway & Arterial System of
Transportation and District II Manager for Nevada conducted by Westat on February 1, 2016.

35
CHAPTER 5. CASE STUDIES
When nonrecurring events cause disruptions to a roadway, from short delays to complete road
closures during a peak travel period, it is beneficial to provide road users with information from
multiple sources. Travelers may first perform a visual assessment of the situation (e.g., a long
line of vehicles approaching an intersection exit ramp or slow-moving vehicles covered with
snow and ice proceeding in the opposite direction). Secondary information that they may receive
includes roadside DMSs, which can display a limited number of characters in a multi-screen
message or an announcement on a terrestrial commercial radio. However, these types of
information are typically limited and often nonspecific. Tertiary information generally includes
detailed, incident-specific information (e.g., information presented on mobile apps or websites).
For example, in an urban area, intended destinations and reliability expectations vary so greatly
that road users may desire specific and detailed information, including congestion limits, the
condition of alternate routes, and even comparative travel times. This information is too
complex and detailed to include on a DMS. Consequently, several media outlets should be used
in a coordinated effort to get the necessary information to the user at the right time. For example,
a comprehensive system can be coordinated within a mobile app as well as across various
components of an ITS system.
In each of the following case studies, the authors examine the use of a medium for providing
traveler information as well as its impact in several situations. Delving deeper into a particular
medium within a specific context in such a case study approach can provide the audience with
useful insights into implementation challenges, as well as useful potential solutions. The
examples given below were chosen due to their novel approaches to challenges that other
locations may encounter with the hope that they can provide useful lessons learned.
CASE STUDY 1—MOBILE APPS
Road user decisionmaking is aided by specific information regarding the nature of the disruption
and its anticipated impact. That impact can be expressed in terms of time, restricted access, or
distance. For exceptionally complex disruptions, providing immediate information about the
impact the disruption will have is sufficient to spur the use of mobile apps and other traveler
information systems in making a decision. The user decisionmaking process, which typically
assesses the risk of further disruption related to the impact, is generally dictated by the hope of
minimizing delays and safety risks by choosing the least disruptive option, which may include
proceeding on the planned route.
The ease of access to the Internet by means of mobile cellular devices has revolutionized
how the traveling public obtains and interacts with information and the agencies providing it.
While traditional traveler information outlets, such as HAR, terrestrial and satellite commercial
radio, VMSs, and even variable warning and speed limit signs retain broad application to all
travelers, the use of mobile apps enables users to obtain a personalized insight into conditions
that can affect their travel.
Numerous agencies, including both State transportation departments and regional transportation
agencies, have released mobile apps for traveler information for all modes of transport.

36
Additionally, private sector apps display information concerning congestion levels and even
cameras sourced from public agency data.
Apps from MnDOT, the Georgia Department of Transportation, and WSDOT (see figure 5)
allow immediate access to camera images from roadside surveillance systems, integration with
information from mapping services to view traffic conditions, and the ability to instantly learn
about the nature and duration of incidents reported in the app.(22,42,26) These incidents can include
a variety of disruptions, such as sporting events, parades, traveling dignitaries, transient road
work, and crashes.
©WSDOT.
Figure 5. Screenshot. WSDOT mobile app home screen.(26)
In Washington, due to the complexity of the transportation network, an effort was made to
incorporate a variety of traveler information systems, even across modes, into a single source. In
addition to roadway travel information, WSDOT provides information on the ferry system (used
by walk-on passengers)—the largest in the United States—and provides the ability to make
vehicle reservations using a mobile-optimized external site. It also provides information on the
Amtrak Cascades® intercity regional rail service. Additionally, WSDOT uses the app interface
as a platform for its efforts to disseminate information using social media.(26) WSDOT has made
extensive use of Facebook® and Twitter™, particularly with regard to reporting incidents and
the progress associated with clearing those incidents. WSDOT’s Twitter™ feed is also used to
advise road users of incidents related to snow removal, avalanche control, large gatherings such
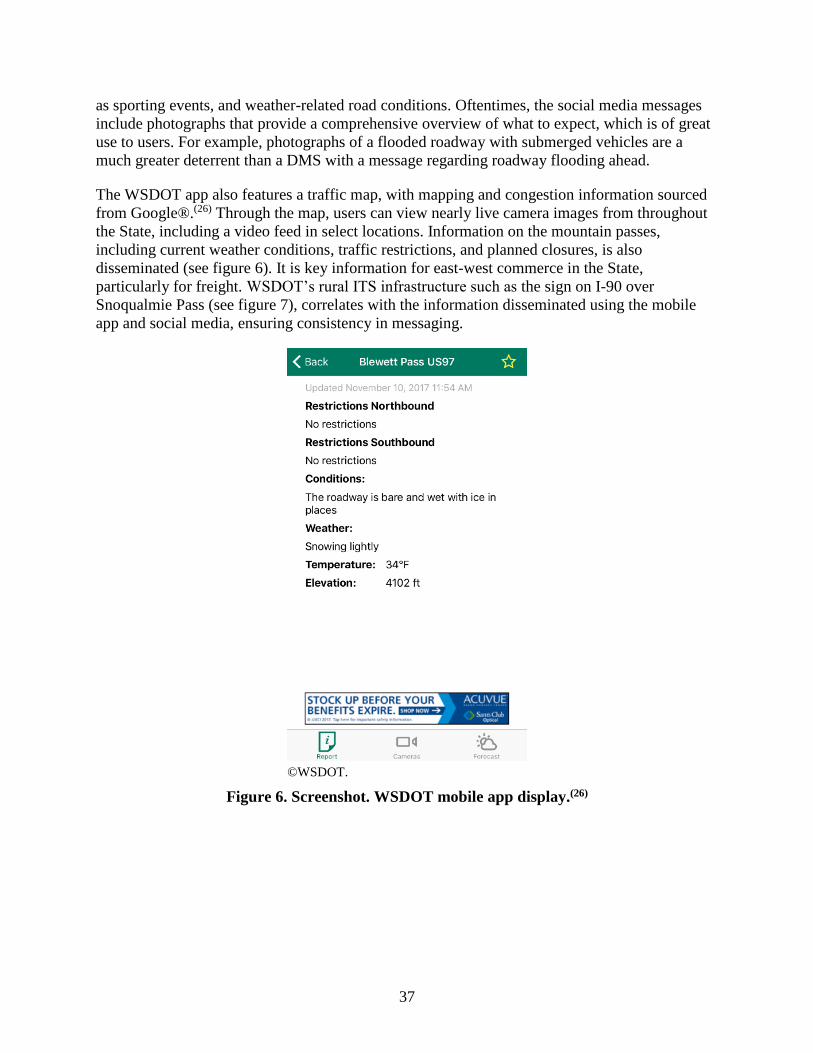
37
as sporting events, and weather-related road conditions. Oftentimes, the social media messages
include photographs that provide a comprehensive overview of what to expect, which is of great
use to users. For example, photographs of a flooded roadway with submerged vehicles are a
much greater deterrent than a DMS with a message regarding roadway flooding ahead.
The WSDOT app also features a traffic map, with mapping and congestion information sourced
from Google®.(26) Through the map, users can view nearly live camera images from throughout
the State, including a video feed in select locations. Information on the mountain passes,
including current weather conditions, traffic restrictions, and planned closures, is also
disseminated (see figure 6). It is key information for east-west commerce in the State,
particularly for freight. WSDOT’s rural ITS infrastructure such as the sign on I-90 over
Snoqualmie Pass (see figure 7), correlates with the information disseminated using the mobile
app and social media, ensuring consistency in messaging.
©WSDOT.
Figure 6. Screenshot. WSDOT mobile app display.(26)

38
©WSDOT.
Figure 7. Photo. WSDOT DMS on I-90 at Snoqualmie Pass.
The MN 511 app focuses on urban freeway traffic conditions and rural roadway status.(22) It also
provides still shots from camera feeds for the entire State. The flexibility of the MN 511 mobile
app and users’ abilities to turn layers on and off allows them to obtain information specific to the
disruption in question. Simplification of the user interface (see figure 8) with easy-to-understand
layer control allows users to add information until the desired detail is reached so that they can
make a decision at the earliest possible and least complex stage of the interface. The app also
allows users to toggle different layers to customize the details shown (see figure 9).
Screen Capture ©MnDOT (Map in
screen capture ©Google® Maps™).
Figure 8. Screenshot. MN 511 mobile app layer control view 1.(43,22,19)
©

39
Screen Capture ©MnDOT (Map in
screen capture ©Google® Maps™).
Figure 9. Screenshot. MN 511 mobile app layer control view 2.(44)
Bridge and toll road authorities as well as county-level transportation departments are producing
apps to provide traveler information. The Lake County PASSAGE app (see figure 10), which
was produced by the same department within Lake County PASSAGE that manages traffic
signal operations in Lake County, IL, provides an interactive map that prioritizes traffic incidents
and road work.(45) That app as well as another produced by the Virginia Department of
Transportation (VDOT) also provide a textual means of accessing information on incidents
through an incident list and Twitter™ feed, respectively.(46)

40
©Lake County PASSAGE.
Figure 10. Screenshot. Lake County PASSAGE mobile app.(45)
CASE STUDY 2—COMPREHENSIVE RURAL ITS
In areas where cellular network coverage is problematic and/or driver distraction can lead to
high-speed crashes, such as rural freeway networks, providing users with easy access to critical
information is a primary concern for agencies. This case study describes one such example in
Wyoming. It was recognized that rural traveler information was a means of ensuring public
safety and possibly saving lives. As such, the State sought to develop a rural ITS network to
support weather-related traveler information systems covering primary highways throughout the
State. It developed its Weather Responsive Traffic Management System, which receives data
from weather stations and condition reports from maintenance employees using a mobile app
hosted on a tablet.
The Wyoming system disseminates information to users primarily through the rural ITS
infrastructure in direct and indirect methods. The rural DMS system is used to advise of road
closures, inclement weather, and speed reductions by providing direct information to the
motoring public. The variable speed limit systems on I-80 and State Highway 28 provide indirect
information, an implicit indication of hazardous conditions by means of a reduced speed limit. In
most cases, traffic volumes are low enough that users can calculate the extent of the impact of
the weather-related disruption by simply adjusting their arrival time expectation based on the
revised speed limit. While inferred, the adjustment in speed indicates both the nature of the
incident (visible to the user) and the impact (a reduction in expected travel speed, leading to a
later arrival).

41
Typical rural ITS apps tend to focus more on hazards due to nonrecurring conditions and less
on disruptions due to incidents related to those conditions. As noted in chapter 2, when a
decisionmaker is in a potentially stressful situation (e.g., a dangerous weather event), that person
is less capable of handling complex tasks (including making calculations or logical inferences).
Therefore, providing clear, direct, and concise information is preferred.


43
CHAPTER 6. CONCLUSION
Traveler information for nonrecurring events is a vital component to the effective functioning of
any transportation system. Timely, correct, and clear information is most needed in situations
where unexpected or unusual events occur. These events stress the transportation system the
most as well as the traveling public who have to make decisions often based on incomplete or
outdated information.
Traveler information for nonrecurring events has evolved significantly in recent years.
While agencies continue to use traditional dissemination methods, such as DMSs, HAR, and
511 websites, the available tools have expanded to include mobile apps, social media platforms,
and text/email alerts. In the near future, it is hoped that connected vehicle technology will
provide personalized, real-time traveler information directly to travelers in their vehicles.
Currently, private sector websites and apps provide users with valuable real-time routing,
congestion, and event information. While the availability of media drastically expands the
toolbox from which traffic managers can draw, it is important to implement information
approaches in ways that meet the needs and desires of travelers as well as the needs and
limitations of agencies. Key findings and recommendations from this project are
as follows:
Planned and unplanned events necessitate different information strategies. For example,
information about events planned in advance can be disseminated early to alert the
public. Press releases, news coverage, paid media, DMS messages (including portable
DMSs placed at relevant location), emails, and other media can be used. Information
about unplanned events should emphasize dissemination methods that can reach
travelers as quickly as possible.
Concrete information should be provided for nonrecurring events. Travelers want
to know the nature of the event, the delay or disruption it will cause, and availability
and time savings of alternate routes. The affected locations should be described as
specifically as possible. Travelers also want to know that the information they receive
is accurate and current.
The audience must be considered. Local travelers and commuters are likely to be familiar
with an area’s roads and options to seek information about traffic and events. Nonlocal
travelers (e.g., tourists and long-distance travelers) may not be familiar with area roads
or options for traveler information. Commercial vehicle drivers often acquire relevant
information from other commercial vehicle drivers via CB radio.
Nonagency traveler information should be considered. Radio, television, mobile apps,
and websites are widely available and popular with travelers. A traveler information
strategy should be developed that considers and complements the various resources
available to travelers.
Where applicable, users should be allowed to personalize the information received.
Travelers want information that is relevant to them; irrelevant information is likely to

44
be a nuisance and may reduce usage. Where possible, users should be allowed to choose
to receive information that is customized to their location, route, or general areas of
interest. This is particularly important for push notifications such as text messages.
Resources available to the public need to be publicized. The general public is often
unaware of the traveler information resources available to them. Informing them of
available options and potential benefits may increase usage.
Travelers may have different preferences for how they like to receive information, so
they should be provided information on multiple platforms.
Traveler information partnerships should be considered. Partnerships with public or
private sector organizations can lead to improvements in traveler information data
collection and dissemination, improve consistency of information, and expand
geographical coverage and audience.
The availability and popularity of technologies and information platforms can change
quickly. It is important to keep pace with the public’s changing preferences.
Travelers routinely mentioned the need for information about nonrecurring events that is
helpful and easy to access.(33,6,34) There are several areas of research that would benefit from
understanding the needs of the public, the transportation system, and the intersection of the two,
which would result in optimal decisions being made to adjust to nonrecurring events, such as the
following:
User limitations and decisionmaking in stressful situations (especially emergencies and
evacuations).
Most effective formats and content to convey messages regarding a range of nonrecurring
events.
Most effective dissemination methods, (e.g., social media and in-vehicle devices).
Future research should focus on determining what information from nonrecurring events will
help the traveling public make the most effective and safest travel decisions.

45
APPENDIX A. TAXONOMY OF MESSAGES AND USES
A goal of the current study was to provide a list of representative messages for nonrecurring
events that can be used for subsequent testing and guidance. The following table provides
example messages for a range of events, as well as considerations of message timing in respect
to the event and delivery method. Example messages were changed or tailored to be generic for
the purposes of this table. There are cases where there is no information beyond the event type of
specific event. These have been left in the table for the purposes of being comprehensive and in
respect to the original goal of providing a range of considerations for testing. Example messages
can be created for these categories for subsequent testing.

46
Table 3. Example messages for nonrecurring events.
Type of
Event
Specific
Event
Type of Information Presented in Relation to Event Timing
Delivery
Method Example Message
Hours Before
Event
Minutes
Before Event
At Time of
Event
Minutes
After Event
Started
Incident Crash — — Incident
occurrence
(location, lane
closures, etc.)
Incident
occurrence
(location, lane
closures, etc.)
DMS I-95 NB CRASH;
AT RTE 240;
EXPECT LONG
DELAYS
Work zone Speed
management
Awareness of
the presence of
work zones
along a route
Initial/
advisory
speed control
Regulatory
speed
Regulatory
speed
— CONGESTION
AHEAD/REDUCED
SPEED; XX MPH
Work zone Queue
management
Awareness of
the presence of
work zones
along a route,
departure time,
and route
selection
Initial queue
warning
Specific
speed/
merging
action
Specific
speed/merging
action
— WATCH FOR
STOPPED
TRAFFIC
Work zone Lane
configuration/
closure
Awareness of
the presence of
work zones
along a route,
departure time,
and route
selection
Initial notice
of lane
closure/
configurations
Specific
merging/
lane tracking
Specific
merging/
lane tracking
DMS RIGHT LANE
CLOSED; X MILES
AHEAD/REDUCE
SPEED

47
Type of
Event
Specific
Event
Type of Information Presented in Relation to Event Timing
Delivery
Method Example Message
Hours Before
Event
Minutes
Before Event
At Time of
Event
Minutes
After Event
Started
Work zone Lane shift Awareness of
the presence of
work zones
along a route,
departure time,
and route
selection
Initial notice
of lane
configurations
Specific lane
guidance
Specific lane
guidance
DMS —
Weather Snow Awareness of
the presence of
work zones
along a route,
departure time,
and route
selection
Alert to
upcoming
condition;
route change
Advisory or
regulatory
speed
Advisory or
regulatory
speed
Mobile
app
Heavy Snow
Weather Intermittent
icy spots
— — — — DMS ICY SPOTS, NEXT
X MILES
Weather Icy roads — — — — DMS ICE ON BRIDGE
SLOW
Weather Rain Departure time Initial/advisor
y speed
control
— — DMS PERIODIC RAIN
REDUCE SPEED
USE HEADLIGHTS
Weather Wind/high
wind
— — — — 511
website
I-70 Westbound/
Eastbound
Georgetown to
Genesee
(Milemarker 228–
259). High wind
advisory.

48
Type of
Event
Specific
Event
Type of Information Presented in Relation to Event Timing
Delivery
Method Example Message
Hours Before
Event
Minutes
Before Event
At Time of
Event
Minutes
After Event
Started
Weather Fog/low
visibility
— — — — Social
media
***TRAVEL
ALERT ***High
winds, blowing dust,
and limited
visibility
Weather Flooding — — — — DMS CAUTION
FLOODING
AHEAD
Weather Hurricane — — — — DMS HURRICANE
WARNING
SEEK SHELTER
Weather Full roadway
closure
— — — — DMS,
Web app
ALL LANES
CLOSED
Planned
special
event
Detours — — — — DMS ROAD CLOSED
AHEAD; FOLLOW
DETOUR
Planned
special
event
Traffic signal
control
— — — — — —
Planned
special
event
Remote video
access
— — — — — —
Evacuation Lane reversals — — — — — —
Evacuation Detours — — — — DMS —
Other
Smoke
warning
— — — — 511
website
Motorists are
advised of possible
heavy smoke on
Interstate 10 east and
west bound in Santa

49
Type of
Event
Specific
Event
Type of Information Presented in Relation to Event Timing
Delivery
Method Example Message
Hours Before
Event
Minutes
Before Event
At Time of
Event
Minutes
After Event
Started
Rosa County. Use
caution.
Other Road
blockage
— — — — Twitter™ Downed trees are
causing issues on I-
277 in Charlotte.
Crews working to
clear road before
evening rush hour.
Other Dangerous
road
conditions
— — — — Social
media
Magnitude 4.8
earthquake followed
by two small jolts
strike east of Fresno
Other Ramp
metering
— — — — CMS METER ON
—A lack of information was found during the scan. Cells are provided as an indication of considerations to subsequently test.


51
APPENDIX B. MOBILE APPS FROM STATE TRANSPORTATION DEPARTMENTS
AND REGIONAL SOURCES
The following list represents a sample of mobile apps from State transportation departments and
other regional sources, which is current as of the publication of this report:
511 Georgia & Atlanta Traffic*.(42)
511 Wisconsin*.(27)
PA TURNPIKE TRIP TALK APP.(23)
Texas Department of Transportation’s Drive On.(47)
WV 511 Drive Safe.(48)
Florida 511*.(18)
Idaho 511.(49)
Iowa 511.(50)
Lake County PASSAGE*.(45)
MN 511*.(22)
MDT Travel Info.(51)
NM Roads.(52)
OneBusAway.(53)
Sigalert.(54)
Utah Department of Transportation’s Traffic.(55)
VDOT 511*.(46)
WSDOT*.(26)
Wyoming 511.(56)
This list is not meant to be comprehensive but rather a sample of the types of mobile apps
available for travelers that are provided through State transportation departments and other
regional sources. Note that the entries with asterisks are described in more detail in the current
report.


53
REFERENCES
1. Schofer, J.L., Khattak, A., and Koppelman, F.S. (1993). “Behavioral Issues in the Design and
Evaluation of Advanced Travel Information Systems,” Transportation Research Part C:
Emerging Technologies, 1(2), pp. 107–117, Elsevier, New York, NY.
2. Business Dictionary. s.v. “decision making,” Available online:
http://www.businessdictionary.com/definition/decision-making.html, last accessed
November 8, 2017.
3. Robinson, E. (2014). Improving Decision-Making in Command Centers: Identifying Errors
and Mitigation Strategies, Presented at the 93d Annual Meeting of the Transportation
Research Board, Washington, DC.
4. Torma-Krajewski, J. and Powers, J. (2010). Decision-Making and Emergency Responses:
Training for Incident Command Centers and Mine Rescue Teams, Colorado School of Mines,
Mine Safety and Health Administration, U.S. Department of Labor, Washington, DC.
5. Shaheen, S., Cohen, A., Zohdy, I., and Kock, B. (2016). Smartphone Applications to
Influence Travel Choices: Practices and Policies, Report No. FHWA-HOP-16-023, Federal
Highway Administration, Washington, DC.
6. Robinson, E., Jacobs, T., Frankle, K., Serulle, N., and Pack, M. (2012). Deployment, Use,
and Effect of Real-time Traveler Information Systems, NCHRP Web-Only Document 192,
National Cooperative Highway Research Program, Washington, DC.
7. Lappin, J. and Bottom, J. (2001). Understanding and Predicting Traveler Response to
Information: A Literature Review, Report No. FHWA-JPO-04-014, Federal Highway
Administration, Washington, DC.
8. The National Academies of Science, Engineering, and Medicine. (n.d.). “TRID: The TRIS
and ITRD Database,” (website) Transportation Research Board, Washington, DC. Available
online: https://trid.trb.org/, last accessed December 14, 2016.
9. Chang, J., Jones, C., Mora, K., Rive, G., and Beetham, J. (2015). Detailed Customer
Requirements for Travel Information Services and the Effectiveness of Current Channels,
Research Report 572, New Zealand Transport Agency, Wellington, New Zealand.
10. Muizelaar, T.J. (2011). Non-Recurrent Traffic Situations and Traffic Information:
Determining Preferences and Effects on Route Choice, TRAIL Thesis Series T2011/16,
TRAIL Research School, Delft, Netherlands.
11. Higgins, L., Nelson, A., Geiselbrecht, T., and Ullman, B. (2013). Understanding the
Decision-Making Process for Drivers Faced with Lane Restriction or Closures on Wisconsin
Highways, Report No. 0092-11-15, Wisconsin Department of Transportation, Madison, WI.

54
12. State of Wisconsin Department of Transportation. (n.d.). “Welcome to WisDOT,” (website)
Wisconsin Department of Transportation, Madison, WI. Available online:
http://wisconsindot.gov/Pages/home.aspx, last accessed January 10, 2018.
13. Sun, Y., Toledo, T., Rosa, K., Ben-Akiva, M.E., Flanagan, K., Sanchez, R., and Spissu, E.
(2013). “Route Choice Characteristics for Truckers,” Transportation Research Record, 2354,
pp. 115–121, Transportation Research Board, Washington, DC.
14. Schroeder, J.L. and Demetsky, M.J. (2010). Evaluation of Driver Reactions for Effective Use
of Dynamic Message Signs in Richmond, Virginia, Report No. FHWA/VTRC 10-R16,
Virginia Department of Transportation, Richmond, VA.
15. Kansas City Scout. (2001). “Kansas City Scout MoDOT + KDOT.” (website) Kansas City
Scout, Lee's Summit, MO. Available online: http://www.kcscout.net/, last accessed
November 10, 2017.
16. Google® Maps™. (2017). Kansas City Scout website. Generated via Google® Maps™
online by Kansas City Scout. Available online: https://maps.google.com.
17. ScoutTraffic. Android. TransCore, LP. Nashville, TN. Available online:
https://play.google.com/store/apps/details?id=com.transcore.android.kcscout, last accessed
January 10, 2018.
18. Florida Department of Transportation. (n.d.). “Florida 511,” (website) Florida Department of
Transportation, Tallahassee, FL. Available online: https://fl511.com/, last accessed January
10, 2018.
19. Kane, D. (2014). “FDOT Establishes a Data Sharing Partnership with Navigation Leader
WAZE,” Capital Soup, Tallahassee, FL. Available online: http://capitalsoup.com/2014/05/
14/fdot-establishes-a-data-sharing-partnership-with-navigation-leader-waze/, last accessed
December 14, 2016.
20. Georgia Department of Transportation. (n.d.). “Georgia 511,” (website) Georgia Department
of Transportation, Atlanta, GA. Available online: http://www.511ga.org/, last accessed
January 10, 2018.
21. Lake County PASSAGE. (n.d.). “Lake County PASSAGE,” (website) PASSAGE. Available
online: https://www.lakecountypassage.com/, last accessed January 10, 2018.
22. Minnesota 511 (version 4.4.3). Android. Castle Rock Associates. Portland, OR. Available
online: https://play.google.com/store/apps/details?id=crc.carsapp.mn&hl=en last accessed
March 1, 2018.
23. TRIP Talk (version 3.20). Android. Information Logistics, Inc. Pennsauken, NJ. Available
online:
https://play.google.com/store/apps/details?id=com.ptc.locationAlerts&feature=search_result
and https://www.paturnpike.com/travel/trip_talk.aspx last accessed January 10, 2018.

55
24. Metropolitan Transportation Commission. (2011). “511 SF Bay,” (website) Metropolitan
Transportation Commission, San Francisco, CA. Available online: http://511.org/, last
accessed December 14, 2016.
25. 1-95 Corridor Coalition. (n.d.). “Regional Integrated Transportation Information System
(RITIS),” (website) 1-95 Corridor Coalition, Baltimore, MD. Available online:
http://i95coalition.org/projects/regional-integrated-transportation-information-system-ritis/,
last accessed December 14, 2016.
26. WSDOT. Android. Washington State Department of Transportation. Olympia, WA.
Available online:
https://play.google.com/store/apps/details?id=gov.wa.wsdot.android.wsdot&hl=en last
accessed January 10, 2018.
27. Wisconsin Department of Transportation. (n.d.). “511 Wisconsin,” (website) Wisconsin
Department of Transportation, Madison, WI. Available online: https://511wi.gov/, last
accessed December 14, 2016.
28. Washington State Department of Transportation. (n.d.) “Washington State Department of
Transportation,” (website) Washington State Department of Transportation.,Olympia, WA.
Available online: http://www.wsdot.wa.gov/mapsdata.htm last accessed January 10, 2018.
29. Great Lakes Regional Transportation Operations Coalition. (n.d.) “travelmidwest.com
Homepage,” (website) Great Lakes Regional Transportation Operations Coalition. Available
online: https://www.travelmidwest.com/lmiga/home.jsp last accessed January 10, 2018.
30. Deeter, D. (2009). Real-Time Traveler Information Systems, NCHRP Synthesis 399, National
Cooperative Highway Research Program, Washington, DC.
31. McClelland, J. (2016). “Weather Technology Falters amid Communication Breakdown,”
National Public Radio. Available online:
http://www.npr.org/2016/05/31/480183260/weather-technology-falters-amid-
communication-breakdown, last accessed June 1, 2016.
32. Campbell, J.L., Cluett, C., Gopalakrishna, D., and Lichty, M.G. (2012). Testing and
Evaluation of Preliminary Design Guidelines for Disseminating Road Weather Advisory &
Control Information, Report No. FHWA-JPO-12-073, Federal Highway Administration,
Washington, DC.
33. Lerner, N., Singer, J., Robinson, E., Huey, R., and Jenness, J. (2009). Driver Use of En Route
Real-Time Travel Time Information: Project White Paper, Federal Highway Administration,
Washington, DC. Available online: https://tmcpfs.ops.fhwa.dot.gov/cfprojects/
uploaded_files/real_time_tt_wp.pdf, last accessed November 8, 2017.
34. Robinson, E., Lerner, N., Singer, J., Barragan, D., Kulbicki, K., Kline, J., and Kellman, D.
(2016). Travel Time Displays at Freeway Entrance Approaches, Report No. FHWA-HRT-
16-059, Federal Highway Administration, Washington, DC.

56
35. Dunn, W. (2007). Managing Travel for Planned Special Events Handbook: Executive
Summary, Report No. FHWA-HOP-07-108, Federal Highway Administration,
Washington, DC.
36. Office of Operations. (n.d.). “Planned Special Events Traffic Management,” (website) 21st
Century Operations Using 21st Century Technologies, Federal Highway Administration,
Washington, DC. Available online: http://ops.fhwa.dot.gov/aboutus/one_pagers/planned_
events.htm, last accessed October 06, 2017.
37. Singer, J., Robinson, A.E., Krueger, J., Atkinson, J.E., and Myers, M.C. (2013). Travel Time
on Arterials and Rural Highways: State-of-the-Practice Synthesis on Rural Data Collection
Technology, Report No. FHWA-HOP-13-029, Federal Highway Administration,
Washington, DC.
38. Intelligent Transportation Systems. (2007). Managing Congestion with Integrated Corridor
Management (ICM), Report No. FHWA-JPO-07-025, U.S. Department of Transportation,
Washington, DC. Available online: http://www.its.dot.gov/icms/docs/cs_over_final.pdf, last
accessed December 14, 2016.
39. Robinson, R., Singer, J., Lerner, N., Jenness, J., and Huey, R. (2011). En Route Real-Time
Travel Time Information: Experimental Evaluation of Display Characteristics, Presented at
the 18th World Congress on Intelligent Transport Systems, Orlando, FL.
40. Al-Deek, H. (2016). Evaluating the Impact and Usefulness of Highway Advisory Radio
(HAR) and Citizens’ Band Radio Advisory Systems (CBRAS) in Providing Traveler
Information and Improving the User Experience on the Florida Turnpike Enterprise’s Toll
Road Network and the Florida Interstate Highway (FIH) System, FOD No. BDV24-977-11,
Florida Department of Transportation Research Center, Tallahassee, FL. Available online:
http://ntl.bts.gov/lib/57000/57100/57194/FDOT-BDV24-977-11-rpt.pdf, last accessed
May 11, 2016.
41. Lichty, M.G., Richard, C.M., Campbell, J.L., and Bacon, L.P. (2012). Guidelines for
Disseminating Road Weather Advisory & Control Information, Report No. FHWA-JPO-12-
046, Federal Highway Administration, Washington, DC.
42. 511 Georgia & Atlanta Traffic (version 1.50.3). IPhone. Iteris, Inc. Santa Ana, CA. Available
online: https://itunes.apple.com/us/app/511-georgia-atlanta-traffic/id584675609?mt=8, last
accessed March 1, 2018.
43. Google® Maps™. (2017). MN 511 mobile app layer control view 1. Generated via Google®
Maps™ online by Minnesota Department of Transportation. Available online:
https://maps.google.com.

57
44. Google® Maps™. (2017). MN 511 mobile app layer control view 2. Generated via Google®
Maps™ online by Minnesota Department of Transportation. Available online:
https://maps.google.com.
45. Lake County PASSAGE (version 1.3.2). Android. Lake County, IL. Available online:
https://play.google.com/store/apps/details?id=com.lakecountypassage&hl=en, last accessed
January 10, 2018.
46. VDOT 511 (version 4.4.11). Android. Iteris, Inc. Santa Ana, CA. Available online:
https://play.google.com/store/apps/details?id=com.meridian.vdot&hl=en, last accessed
March 1, 2018.
47. Texas Department of Transportation. (n.d.). “Drive Texas.” (website) Texas Department of
Transportation., TX. Available online: https://drivetexas.org/#/7/32.340/-
99.500?future=false, last accessed January 10, 2018.
48. WV511 Drive Safe (version 2.10). Android. Information Logistics, Inc. Pennsauken, NJ.
Available online:
https://play.google.com/store/apps/details?id=com.infolog.WVDriveSafe&feature=search_re
sult#?t=W251bGwsMSwyLDEsImNvbS5pbmZvbG9nLldWRHJpdmVTYWZlIl0, last
accessed January 10, 2018.
49. Idaho 511 (version 4.4.3). Android. Castle Rock Associates. Portland, OR. Available online:
https://play.google.com/store/apps/details?id=crc.carsapp.id&hl=en, last accessed January
10, 2018.
50. Iowa 511 (version 4.4.4). Android. Iowa Department of Transportation. Ames, IA. Available
online: https://play.google.com/store/apps/details?id=com.transcore.android.iowadot&hl=en
last accessed March 1, 2018.
51. MDT Travel Info (version 3.0). Android. Montana Department of Transportation. Helena,
MT. Available online: https://play.google.com/store/apps/details?id=gov.mt.mdt last
accessed March 1, 2018.
52. New Mexico Department of Transportation. (n.d.). “NMRoads.” (website) New Mexico
Department of Transportation. Santa Fe, NM. Available online:
https://www.nmroads.com/mapIndex.html?, last accessed January 3, 2018.
53. OneBusAway. Android. OneBusAway. Available online:
https://play.google.com/store/apps/details?id=com.joulespersecond.seattlebusbot&hl=en, last
accessed January 10, 2018.
54. Sigalert (version 4.0.7). IPhone. Sigalert. Available online:
https://itunes.apple.com/us/app/sigalert-com-live-traffic-reports/id424889327?mt=8, last
accessed January 10, 2018.

58
55. UDOT Traffic (version 3.3). Android. UDOT. Salt Lake City, UT. Available online:
https://play.google.com/store/apps/details?id=com.transcore.android.commuterLink&hl=en,
last accessed January 10, 2018.
56. Wyoming 511 (version 1.3.2). Android. Wyoming Department of Transportation. Cheyenne,
WY. Available online:
https://play.google.com/store/apps/details?id=info.wyoroad.mobile.android&hl=en, last
accessed January 10, 2018.

59
BIBLIOGRAPHY
Arena, M., Azzone, G., Franchi, F., and Malpezzi, S. (2012). “An Integrated Framework for
Infomobility,” Proceedings of the Third International Engineering Systems Symposium,
Council of Engineering Systems Universities, Delft, Netherlands.
Bagloee, S., Kermanshah, M., and Bozic, C. (2013). “Assessment of Public-Private Partnership
in Traveler Information Provision: Case Study of a Developing Country,” Transportation
Research Record, 2394, pp. 19–29. Transportation Research Board, Washington, DC.
Baumgart, L.A., Bass, E.J., Philips, B., and Kloesel, K. (2006). “Emergency Management
Decision-Making During Severe Weather,” Weather and Forecasting, 23(6), pp. 1,268–
1,279, American Meteorological Society, Boston, MA.
Belloche, S., Pierrefeua, C., and Soranda, C. (2014). Pre-trip Road Information Impact
Assessment: A Literature Review, Transport Research Arena (TRA) 5th Conference on
Transport Solutions from Research to Deployment, Paris, France.
Bierstedt, J., Gooze, A., Gray, C., Peterman, J., Raykin, L., and Walters, J. (2014). Effects of
Next-Generation Vehicles on Travel Demand and Highway Capacity, pp. 10–11, FP
Think Working Group, Washington, DC.
Carson, J.L. and Bylsma, R.G. (2003). Transportation Planning and Management for Special
Events: A Synthesis of Highway Practice, NCHRP Synthesis 309, National Cooperative
Highway Research Program, Washington, DC.
Ceylan, H., Gopalakrishnan, K., and Kim, S. (2013). Improving the Accuracy and Usability of
Iowa Falling Weight Deflectometer Data, Institute for Transportation, Iowa State
University, Ames, IA.
Chorus, C.G., Molin, E.J.E., and Van Wee, B. (2006). “Use and Effects of Advanced Traveller
Information Services (ATIS): A Review of the Literature,” Transport Reviews, 2(26), pp.
127–149, Taylor & Francis Online, England, United Kingdom.
Clark, M.L. (2015). A Microscopic Simulation Approach to Performance Evaluation of
Intelligent Transportation Corridors: A Case in Michigan, Master’s Thesis, Western
Michigan University, Kalamazoo, MI.
Colorado Department of Transportation. (2004). Colorado Work Zone Best Practices Safety
Guide, Colorado Department of Transportation, Denver, CO. Available online:
https://www.
codot.gov/library/traffic/lane-close-work-zone-safety/work-zone-booklets-guidelines/
Work_Zone_Safety_Guide_English_2004.pdf, last accessed December 14, 2016.
Creaser, J. (2017). Examining Signing Options for Improving Safe Driving Behaviors in Work
Zones, Minnesota Department of Transportation, Minneapolis, MN. Available online:

60
http://dot.state.mn.us/research/reports/2017/201719.pdf, last accessed December 14,
2016.
Dudek, C.L. and Ullman, G.L. (2006). Dynamic Message Sign Message Design and Display
Manual, Report No. FHWA/TX-04/0-4023-P3, Texas Department of Transportation,
Austin, TX.
Fan, E. (2000). “Extended Tanh-Function Method and its Applications to Nonlinear Equations,”
Physics Letters A, 277(4–5), pp. 212–218, Elsevier, Netherlands.
Federal Highway Administration. (2008). Intelligent Transportation Systems for Planned Special
Events: A Cross Cutting Study, U.S. Department of Transportation, Washington, DC.
Available online: http://ntl.bts.gov/lib/30000/30400/30470/14436.pdf, last accessed
December 14, 2016.
Federal Highway Administration. (2017). 511 Traveler Information Services,
U.S. Department of Transportation, Washington, DC. Available online:
https://ops.fhwa.dot.gov/511/about511/history.htm, last accessed October 5, 2017.
Florida Department of Transportation. (2005). Approved Motorist Safety Messages for Portable
Changeable Message Signs on the State Highway System, Florida Department of
Transportation, Tallahassee, FL. Available online: http://www.fdot.gov/traffic/pdf/
approved_cms_messages_4_28_05.pdf, last accessed December 14, 2016.
Florida Department of Transportation. (2013). Displaying Messages on Dynamic Message Signs
Permanently Mounted on the State Highway System, Florida Department of
Transportation, Tallahassee, FL.
Fontaine, M.D., Ma, J., and Hu, J. (2015). Evaluation of the Virginia Department of
Transportation Adaptive Signal Control Technology Pilot Project, Report No. VCTIR
15-R24, Virginia Department of Transportation, Richmond, VA.
Fu, H., Liu, N., Liang, J., Pel, A.J., and Hoogendoorn, S.P. (2015). Modeling and Simulation of
Evacuation Route Choice Behavior Using Fuzzy Set Theory, Intelligent Transportation
Systems 2015 IEEE 18th International Conference, pp. 1,327–1,332, Gran Canaria,
Spain.
Goodwin, L.C. (2003). Best Practices for Road Weather Management, Version 2.0,
Report No. FHWA-OP-03-081, Federal Highway Administration, Washington, DC.
Gopalakrishna, D., Cluett, C., Kitchener, F., and Sturges, L. (2013). Utah DOT Weather
Responsive Traveler Information System, Report No. FHWA-JPO-13-089, Federal
Highway Administration, Washington, DC.
Graves, T., Ramirez, J., Grunewald, C., and Tang, K. (2008). Testudo’s Informed Route
Planning System, University of Maryland, College Park, MD.

61
Guéziec et al. (2015). Patent No. US 8,982,116 B2, U.S. Patent and Trademark Office,
Washington, DC. Available online: https://www.google.com/url?sa=t&rct=j&q=&esrc=
s&source=web&cd=2&cad=rja&uact=8&ved=0ahUKEwj57pbeqvTQAhWEi1QKHarw
BRYQFggdMAE&url=http%3A%2F%2Fpatentimages.storage.googleapis.com%2Fpdfs
%2FUS8982116.pdf&usg=AFQjCNEOzE2UbM08ueOjWkzbhsgmfvOGjA&sig2=fsOuI
k_5Vv7sLu0z-MlM7g&bvm=bv.141320020,d.cGw, last accessed December 14, 2016.
Guo, J. (2008). “Modelling User Response to Innovative Traveller Information Systems,”
PATREC Research Forum, Edith Cowan University, Perth, Australia.
Haas, R., Carter, M., Perry, E., Trombly, J., Bedsole, E., and Margiotta, R. (2009). iFlorida
Model Deployment Final Evaluation Report, Report No. FHWA-HOP-08-050, Federal
Highway Administration, Washington, DC.
Habermann, J. (2015). I-35 Smart Work Zone Update, Texas Department of Transportation,
Austin, TX. Available online: https://ftp.dot.state.tx.us/pub/txdot-
info/cst/conference/washto-jhabermann.pdf, last accessed December 14, 2016.
Ibarguen, B. (2007). Changeable Message Signs—Procedures and User Guideline,
Memorandum, State of Maine Department of Transportation, Augusta, ME. Available
online: http://www.maine.gov/mdot/csd/mlrc/documents/pdf/messagesigns.pdf, last
accessed December 14, 2016.
Indiana Department of Transportation. (2010). Indiana Department of Transportation Interstate
Highways Lane Closure Policy, Indiana Department of Transportation, Ames, IA.
Available online: http://www.in.gov/indot/files/IntstLaneClosurePolicy_3-17-10.pdf, last
accessed December 14, 2016.
Information Logistics, Inc. (n.d.). PA Turnpike Travel Alerts: Hands-Free, Eyes-Free!,
Information Logistics, Inc., Pennsauken Township, NJ. Available online:
https://www.paturnpike.com/pdfs/travel/TRIP_Talk_rack_card.pdf, last accessed
December 14, 2016.
Jiang, Y. and Zhang, J. (2014). “How Drivers Adapt to Traffic Accidents and Dynamic Travel
Information: Stated Preference Survey in Japan,” Transportation Research Record, 2413,
pp. 74–83, Transportation Research Board, Washington, DC.
Jones, S.L., Aslam, M., Robinson, C., and Cheekoti, N. (2003). Multimodal Transportation
Planning Needs Survey, Report No. FHWA/CA/OR-01225, University Transportation
Center for Alabama, University of Alabama, Tuscaloosa, AL.
Jones, S.L. and Thompson, M.W. (2003). “State of the Practice for Displaying Non-Traffic
Related Messages on Dynamic Message Signs,” Proceedings from Toda’s Transportation
Challenge: Meeting Our Customer’s Expectations, Palm Harbor, FL.
Juster, R.M., Jacobs, T.H., and Hutchinson, T. (2015). Evaluation of Regional Real-time Transit
Communications and Data Information Sharing in the National Capital Region,
FTA Report No. 0079, Federal Transit Administration, Washington, DC.

62
Kapucu, N. and Garayev, V. (2011). “Collaborative Decision-Making in Emergency and Disaster
Management,” International Journal of Public Administration, 34(6), pp. 366–375,
Taylor & Francis Online, England, United Kingdom.
Kattan, L., Habib, K., Nadeem, S., and Islam, T. (2010). “Modelling Travelers’ Response
to Incident Information Provided by Variable Message Signs in Calgary, Canada,”
Transportation Research Record, 2185, pp. 71–80, Transportation Research Board,
Washington, DC.
Khattak, A., Pan, X., Williams, B., Rouphail, N., and Fan, Y. (2008). “Traveler Information
Delivery Mechanisms: Impact on Consumer Behavior,” Transportation Research Record,
2069, pp. 77–84, Transportation Research Board, Washington, DC.
Khattak, A., Polydoropoulou, A., and Ben-Akiva, M. (1996). “Modeling Revealed and Stated
Pre-Trip Travel Response to Advanced Traveler Information Systems,” Transportation
Research Record, 1537, pp. 46–54, Transportation Research Board, Washington, DC.
Kittelson & Associates, Inc. (2003). Transit Capacity and Quality of Service Manual, Second
Edition, Transportation Research Board, Washington, DC.
Kittelson & Associates, Inc. (2013). Evaluating Alternative Operations Strategies to Improve
Travel Time Reliability, SHRP 2 Report S2-L11-RR-1, the Second Strategic Highway
Research Program, Washington, DC.
KMJ Consulting. (2015). ATMS/ATIS Best Practices-Winter Travel Conditions for Mid-
Atlantic/Southern Region: Summary, I-95 Corridor Coalition, College Park, MD.
Kowalski, K. and Vaught, C. (2003). “Judgment and Decision-Making Under Stress: An
Overview for Emergency Managers,” International Journal of Emergency Management,
1(3), pp. 278–289, Inderscience, Geneva, Switzerland.
Kristof, T., Lowry, M., and Rutherford, G.S. (2005). Assessing the Benefits of Traveler and
Transportation Information Systems, Report No. WA-RD 597.1, Washington State
Department of Transportation, Olympia, WA.
Kuhn, B., Higgins, L., Nelson, A., Finley, M., Ullman, G., Chrysler, S., Wunderlich, K., Shah,
V., and Dudek, C. (2014). Effectiveness of Different Approaches to Disseminating
Traveler Information on Travel Time Reliability, SHRP 2 Report S2-L14-R-1, the Second
Strategic Highway Research Program, Washington, DC.
Kuhn, B., Higgins, L., Nelson, A., Finley, M., Ullman, G., Chrysler, S., Wunderlich, K., Shah,
V., and Dudek, C. (2014). Lexicon for Conveying Travel Time Reliability Information,
SHRP 2 Report S2-L14-RW-2, the Second Strategic Highway Research Program,
Washington, DC.
Kurkcu, A., Morgul, E.F., and Ozbay, K. (2015). “Extended Implementation Method for Virtual
Sensors: Web-Based Real-Time Transportation Data Collection and Analysis for Incident

63
Management,” Transportation Research Record, 2528, pp. 27–37, Transportation
Research Board, Washington, DC.
Kwon, J., Mauch, M., and Varaiya, P. (2006). “Components of Congestion: Delay from
Incidents, Special Events, Lane Closures, Weather, Potential Ramp Metering Gain, and
Excess Demand,” Transportation Research Record, 1959, pp. 84–91, Transportation
Research Board, Washington, DC.
Larson, G. (2012). The Connected Traveler Project: A Component of the Safe Trip-21 Initiative,
Report No. CA12-1935, Research and Innovative Technology Administration, Volpe
National Transportation Systems Center, Cambridge, MA.
Lee, M.S. and McNally, M.G. (2003). “On the Structure of Weekly Activity/Travel Patterns,”
Transportation Research Part A: Policy and Practice, 37(10), pp. 823–839, Elsevier,
New York, NY.
Liao, C.F. and Donath, M. (2015). Developing a Real-Time Incident Decision Support System
(IDSS) for the Freight Industry, University of Minnesota, Minneapolis, MN.
Liu, Y., Lai, X., and Chang, G.L. (2006). “Cell-Based Network Optimization Model for Staged
Evacuation Planning Under Emergencies,” Transportation Research Record, 1964, pp.
127–135, Transportation Research Board, Washington, DC.
Lochrane, T.W, Venkata, S.R.C.C., and Khattak, A. (2013). The Role of Dynamic Message Signs
in Travelers’ Diversion During Unexpected Congestion on Toll Roads, Transportation
Research Board 92d Annual Meeting, Washington, DC.
Mahmassani, H.S., Koppelman, F., Frei, C., Frei, A., and Haas, R. (2013). Synthesis of Traveler
Choice Research: Improving Modeling Accuracy for Better Transportation
Decisionmaking, Report No. FHWA-HRT-13-022, Federal Highway Administration,
Washington, DC.
Maryland State Highway Administration. (2006). Maryland State Highway Administration Work
Zone Lane Closure Analysis Guidelines, Maryland Department of Transportation,
Baltimore, MD.
Mehndiratta, S., Kemp, M., Lappin, J., and Brand, D. (1999). “What Advanced Traveler
Information System Information Do Users Want? Evidence from In-Vehicle Navigation
Device Users,” Transportation Research Record, 1679, pp. 41–49, Transportation
Research Board, Washington, DC.
Morris, N., Ton, A., Cooper, J., Edwards, C., and Donath, M. (2014). A Next Generation Non-
Distracting In-Vehicle 511 Traveler Information Service, Report No. CTS 14-13,
Minnesota Department of Transportation, St. Paul, MN.
Mounce, J.M., Ullman, G., Pesti, G., and Pezoldt, V. (2007). Guidelines for the Evaluation
of Dynamic Message Sign Performance, Report No. FHWA/TS-07/0-4772-1, Texas
Department of Transportation, Austin, TX.
64
Muizelaar, T. and Van Arem, B. (2007). “Drivers’ Preferences for Traffic Information for Non-
Recurrent Traffic Situations,” Transportation Research Record, 2018, pp. 72–79,
Transportation Research Board, Washington, DC.
National Committee on Science Education Standards and Assessment, National Research
Council. (1996). National Science Education Standards, National Academy Press,
Washington, DC.
Oregon Department of Transportation. (2013). Guidelines for the Operation of Permanent
Variable Message Signs, Salem, OR.
Paniati, J.F. (2006). Policy for Messages on Dynamic Message Signs (DMS), Memorandum,
Federal Highway Administration, Washington, DC. Available online: http://ops.fhwa.dot.
gov/travelinfo/resources/dmspolcy02906.pdf, last accessed December 14, 2016.
Peirce, S. and Lappin, J.E. (2005). Why Don’t More People Use Advanced Traveler
Information?: Evidence from the Seattle Area, Presented at Transportation Research
Board 83d Annual Meeting, Washington, DC.
Pisano, P.A., Alfelor, R.M., and Guevara, G.N. (2012). Road Weather Management—Recent
Research Results from the United States, Presented at the 13th International Road
Weather Conference, Standing International Road Weather Commission, Helsinki,
Finland. Available online:
http://www.sirwec2012.fi/Extended_Abstracts/079_Pisano.pdf, last accessed December
14, 2016.
Polydoropoulou, A., Ben-Akiva, M., Khattak, A., and Lauprete, G. (1996). “Modeling Revealed
and Stated En-Route Travel Response to Advanced Traveler Information Systems,”
Transportation Research Record, 1537, pp. 46–54, Transportation Research Board,
Washington, DC.
Provost, L. (2014). Demand Responsive Travel Operation Based on Dynamic Passenger
Information (Dynamic Ride Share by Smartphone Request), Caltrans Division of
Research, Innovation and System Information (DRISI), California Department of
Transportation, Sacramento, CA.
PRR, Inc. (2005). WSDOT 511 IVR Survey and Usability Testing Results, Washington State
Department of Transportation, Olympia, WA. Available online: https://wsdot.com/NR/
rdonlyres/596DD86C-340E-4B10-8660-22805F9AE10E/0/511Survey.pdf, last accessed
December 14, 2016.
Robinson, R.M. and Khattak, A. (2012). “Evacuee Route Choice Decisions in a Dynamic
Hurricane Evacuation Context,” Transportation Research Record, 2312, pp. 141–149,
Transportation Research Board, Washington, DC.
Second Strategic Highway Research Program. (2013). Travel Time Reliability 2030: Innovations
and Strategies for Today and Tomorrow, Second Strategic Highway Research Program,
Transportation Research Board, Washington, DC.

65
Siddle, D. (2014). Travel Time Predictability, NZ Transport Agency Research Report 554, NZ
Transport Agency, Wellington, New Zealand.
Staszcuk, J. and McGowen, P. (2009). Deploying Portable Advanced Traveler Information
Systems, California Center for Innovative Transportation, University of California–
Berkeley, Berkeley, CA.
Sullivan, A.J., Sisiopiku, V.P., and Kallem, B.R. (2013). Measuring Non-Recurring Congestion
in Small to Medium Sized Urban Areas, UTCA Report No. 09201, University
Transportation Center for Alabama, The University of Alabama, Birmingham, AL.
Swan, N., Baker, S., Hintz, R., and Trimble, T. (2004). 511 Virginia Evaluation, Virginia
Department of Transportation, Richmond, VA.
Tao, Z., Spotts, J., Lu, B., Zhou, X., and Xing, T. (2012). Forecasting and Delivery of Highway
Travel Time Reliability Information, SHRP 2 Reliability IDEA Project L-15A,
Innovations Deserving Exploratory Analysis Programs, Transportation Research Board,
Washington, DC.
Tasic, I. (2012). Using Microsimulation to Evaluate Traffic Incident Responses for
Traffic Operations Center Decision Making, Master’s Thesis, University of Utah, Salt
Lake City, UT.
Telvent Farardyne, Inc. (2007). Best Practices for Border Bridge Incident Management, I-95
Corridor Coalition, College Park, MD.
Ullman, G.L., Gopalakrishna, D., Pisano, P., Schroeder, J.L., Scriba, T.A., and Paracha, J.
(2015). Overview of the Work Zone Intelligent Transportation Systems Implementation
Guide, Transportation Research Board 94th Annual Meeting, Washington, DC.
Varaiya, P.P. (2007). Finding and Analyzing True Effect of Non-recurrent Congestion on
Mobility and Safety, California PATH Research Report UCB-ITS-PRR-2007-10,
University of California–Berkeley, Berkeley, CA.
Virginia Department of Transportation. (2013). Changeable Message Signs (CMS) Usage,
Instructional and Informational Memorandum No. IIM-OD-13-03, Operations Division,
Virginia Department of Transportation, Richmond, VA.
Wang, X., Khattak, A., and Fan, Y. (2009). “Role of Dynamic Information in Supporting
Changes in Travel Behavior: Two-Stage Process of Travel Decision,” Transportation
Research Record, 2138, pp. 85–93, Transportation Research Board, Washington, DC.
Watkins, K.E., Wong, J., and Roell, M. (2013). Technology Scan of Future Traveler Information
Systems and Applications in Georgia, Report No. FHWA-GA-13-11-25, Georgia
Department of Transportation, Forest Park, GA.
Wolshon, P.B. (2009). Transportation’s Role in Emergency Evacuation and Reentry, NCHRP
Synthesis 392, National Cooperative Highway Research Program, Washington, DC.

66
Zhang, L. and Levinson, D. (2006). Determinants of Route Choice and the Value of Traveler
Information: A Field Experiment, University of Minnesota, Minneapolis, MN.
Zimmerman, C., Bolton, P., Raman, M., Kell, T., Unholz, S., and Bausher, C. (2007).
Communicating with the Public Using ATIS During Disasters: A Guide for Practitioners,
Report No. FHWA-HOP-07-068, Federal Highway Administration, Washington, DC.
Zou, N., Chang, G-L., and Rahwanji, S. (2003). I-270 Simulator: Integrated Knowledge-Base
and Simulation System for Real-Time Incident Management, 82d Annual Meeting of the
Transportation Research Board, Washington, DC.
Zou, N., Yeh, S.T., Chang, G.L., Marquess, A., and Zezeski, M. (2005). “Simulation-
Based Emergency Evacuation System for Ocean City, Maryland, During Hurricanes,”
Transportation Research Record, 1922, pp. 85–93, Transportation Research Board,
Washington, DC.


HRDS-30/04-18(WEB)E


![W ELCOM E [s3.amazonaws.com] · the Bib le, and while the y all comm unicate the same things, some v ersions ar e wr itten with mor e natural, con versational language than other](https://static.fdocuments.us/doc/165x107/5ec3f265b84efa5ad83cc892/w-elcom-e-s3-the-bib-le-and-while-the-y-all-comm-unicate-the-same-things-some.jpg)