HR Open Source Employer Brand Dashboard
18
Employer Brand Activity Report HR Open Source Employer Brand Team - Q1 January 2018 - March 2018
-
Upload
hr-open-source -
Category
Recruiting & HR
-
view
696 -
download
1
Transcript of HR Open Source Employer Brand Dashboard

Employer Brand
Activity Report
HR Open Source
Employer Brand Team - Q1
January 2018 - March 2018

The HR Open Source Employer Brand Dashboard was developed as a
crowdsourced community project from HROS Labs. It’s designed as an open
source .ppt framework to help practitioners roll up and report their employer
brand activities. The dashboard is not intended to be all-inclusive, rather a
customizable framework that you can modify to fit your needs.
We’d like to thank the following contributors for adding their templates,
expertise, and insights (apologies if we missed anyone). #SharingIsCaring
Maren Hogan, Shannon Smedstad, Celinda Appleby, Shaunda Zilich, Susan
LaMotte, Bryan Chaney, Lisa Colella, Lars Schmidt, Charlotte Marshall, Julia
Zelenock, Jennifer Newbill, Lamar Daniels, Adrienne Sullivan, Holland
Dombeck
THANK YOU

Snapshot View
Net Promoter Score (NPS)
Career Site
Glassdoor
+14 (+3 from Q4)
7,087 visitors (Q4: 6,237)
XX,XXX likes (+X%)
XXX Avg. Engagement (+X%)
XX,XXX likes (+X%)
XXX Avg. Engagement (+X%)
XX,XXX Followers (+X%)
XX,XXX RT’s (+X%)
XX,XXX Followers (+X%)
XX,XXX Views (+X%)
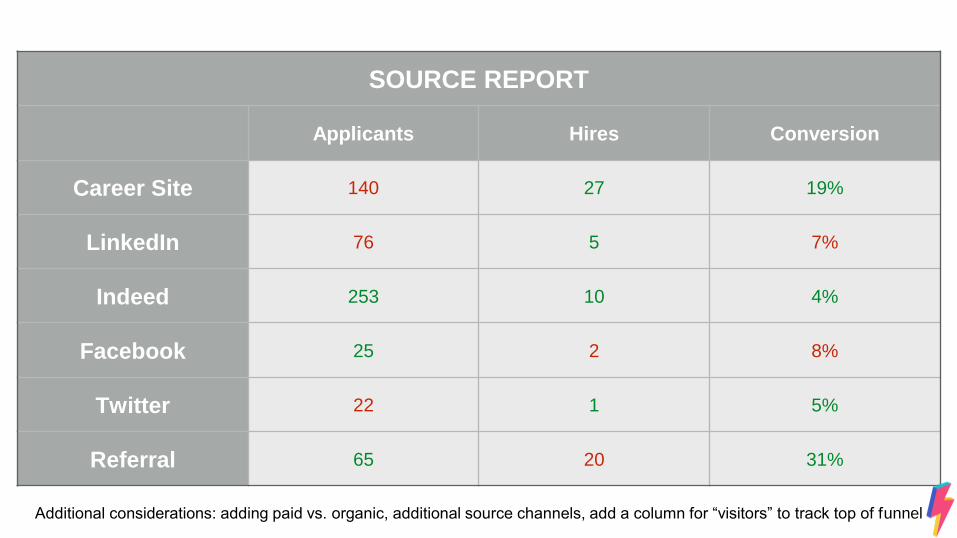
SOURCE REPORT
Applicants Hires Conversion
Career Site 140 27 19%
LinkedIn 76 5 7%
Indeed 253 10 4%
Facebook 25 2 8%
Twitter 22 1 5%
Referral 65 20 31%
Additional considerations: adding paid vs. organic, additional source channels, add a column for “visitors” to track top of funnel
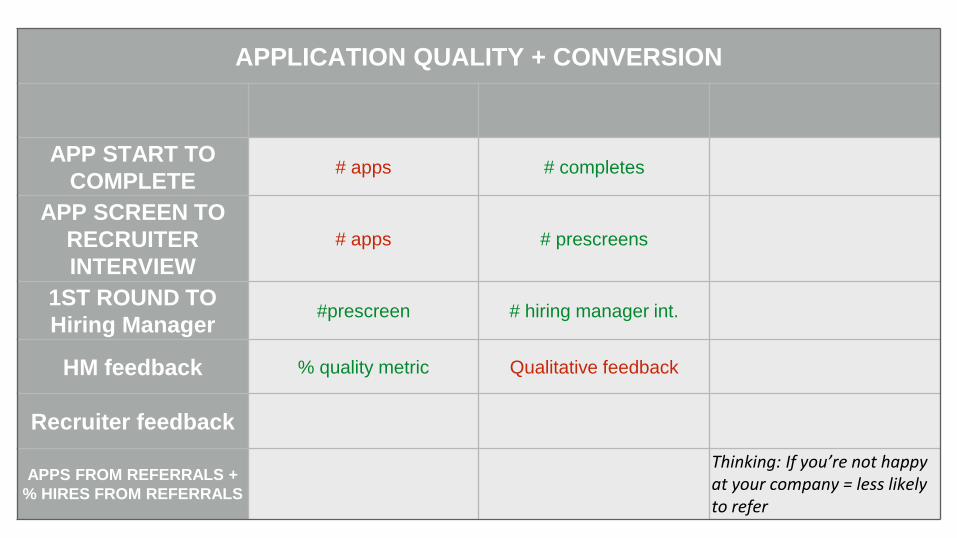
APPLICATION QUALITY + CONVERSION
APP START TO
COMPLETE# apps # completes
APP SCREEN TO
RECRUITER
INTERVIEW
# apps # prescreens
1ST ROUND TO
Hiring Manager#prescreen # hiring manager int.
HM feedback % quality metric Qualitative feedback
Recruiter feedback
APPS FROM REFERRALS +
% HIRES FROM REFERRALS
Thinking: If you’re not happy at your company = less likely to refer
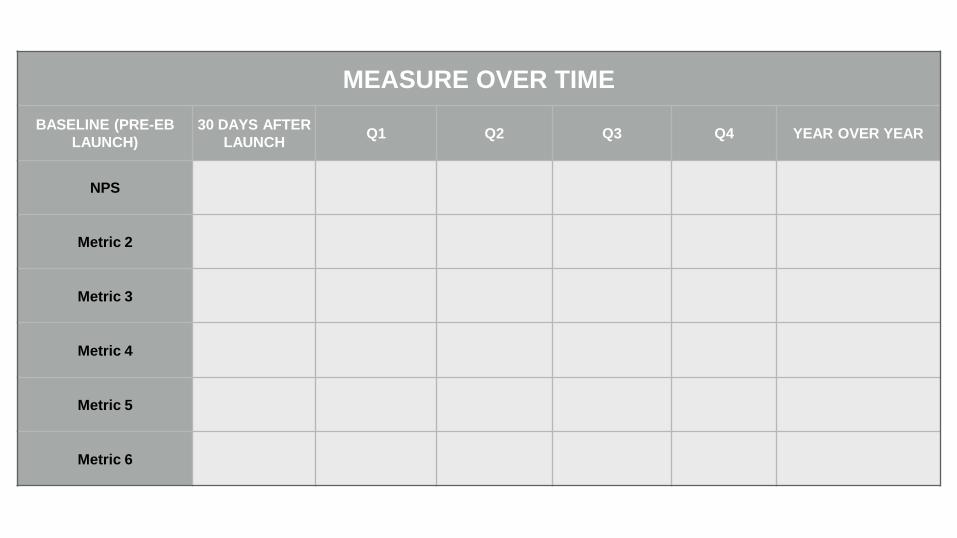
MEASURE OVER TIME
BASELINE (PRE-EB
LAUNCH)
30 DAYS AFTER
LAUNCHQ1 Q2 Q3 Q4 YEAR OVER YEAR
NPS
Metric 2
Metric 3
Metric 4
Metric 5
Metric 6

Top Content
Insert
Screensho
t
Insert
Screensho
t
Insert
Screensho
t
Likes: X
Comments: Y
Shares: Z
Likes: X
Comments: Y
Shares: Z
Likes: X
RT’s: Y
Additional considerations: segmenting by tag/topic to gauge theme engagement, additional channels

Recommend Outlook CEO Rating
2% 1% N/A
5 star: 12
4 star: 10
3 star: 8
2 star: 6
1 star: 4Rating
0.3
Employee ReviewsOverall Rating
At-a-glance Metrics Key trends / themes / flags
New - Q1 Total
Employee Reviews 7 57
Interview Reviews 4 36
Benefit Reviews 2 24
Salary Reviews 3 38
Followers 24 532
• Spike in negative interview feedback for infrastructure
team.
• Internship program getting high reviews
• Outlook has trended down past 3 quarters
• Increase in content engagement
Glassdoor UpdateAdditional considerations: add section to compare against competitors

LinkedIn Update

Twitter Update

Instagram Update

Blog Update

Indeed Update

Events Update

Talent Network/CRM Growth

Media Performance

Global / Local Performance
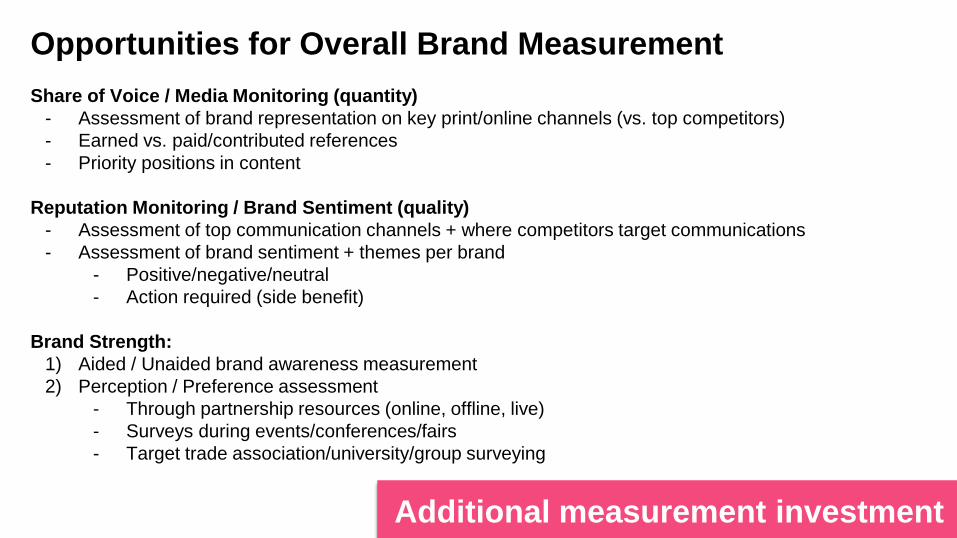
Additional measurement investment
Opportunities for Overall Brand Measurement
Share of Voice / Media Monitoring (quantity)
- Assessment of brand representation on key print/online channels (vs. top competitors)
- Earned vs. paid/contributed references
- Priority positions in content
Reputation Monitoring / Brand Sentiment (quality)
- Assessment of top communication channels + where competitors target communications
- Assessment of brand sentiment + themes per brand
- Positive/negative/neutral
- Action required (side benefit)
Brand Strength:
1) Aided / Unaided brand awareness measurement
2) Perception / Preference assessment
- Through partnership resources (online, offline, live)
- Surveys during events/conferences/fairs
- Target trade association/university/group surveying