HPTUNERS SCANNER STARTUP GUIDE Scanner SCANNER START… · HPTUNERS SCANNER STARTUP GUIDE Open up...
19
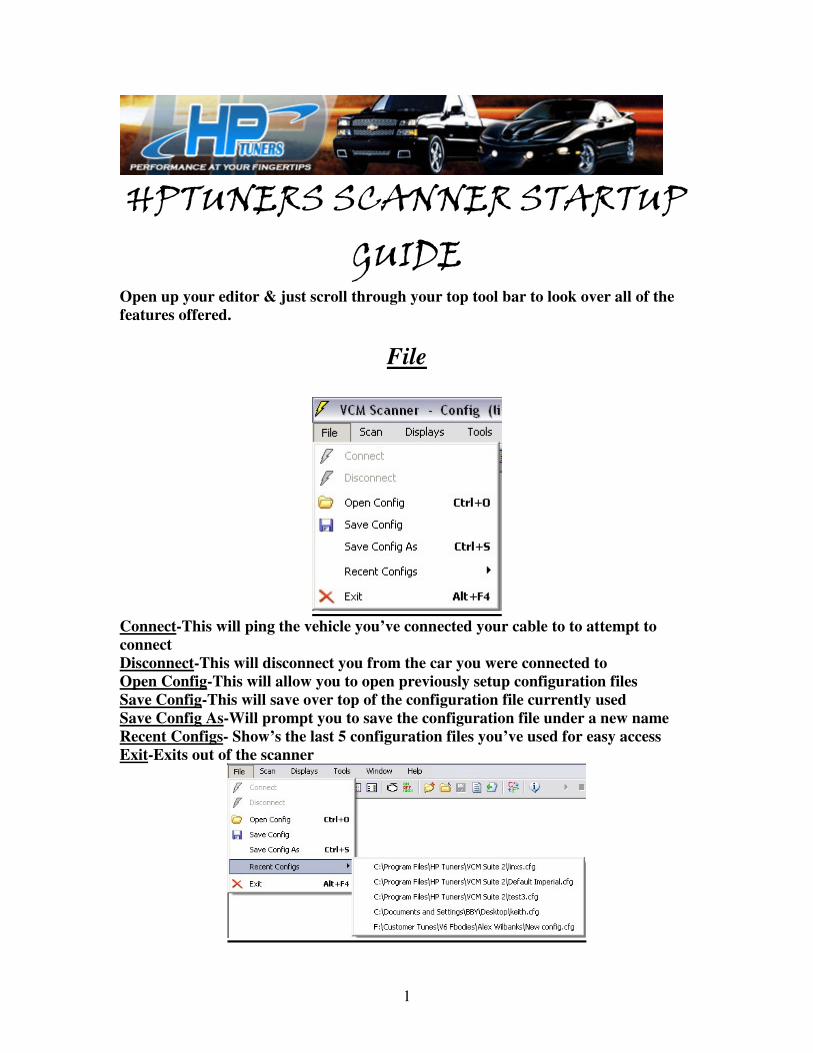
1 HPTUNERS SCANNER STARTUP GUIDE Open up your editor & just scroll through your top tool bar to look over all of the features offered. File Connect -This will ping the vehicle you’ve connected your cable to to attempt to connect Disconnect -This will disconnect you from the car you were connected to Open Config -This will allow you to open previously setup configuration files Save Config -This will save over top of the configuration file currently used Save Config As -Will prompt you to save the configuration file under a new name Recent Configs - Show’s the last 5 configuration files you’ve used for easy access Exit -Exits out of the scanner
Transcript of HPTUNERS SCANNER STARTUP GUIDE Scanner SCANNER START… · HPTUNERS SCANNER STARTUP GUIDE Open up...
1
HPTUNERS SCANNER STARTUP
GUIDE Open up your editor & just scroll through your top tool bar to look over all of the
features offered.
File
Connect-This will ping the vehicle you’ve connected your cable to to attempt to
connect
Disconnect-This will disconnect you from the car you were connected to
Open Config-This will allow you to open previously setup configuration files
Save Config-This will save over top of the configuration file currently used
Save Config As-Will prompt you to save the configuration file under a new name
Recent Configs- Show’s the last 5 configuration files you’ve used for easy access
Exit-Exits out of the scanner
2
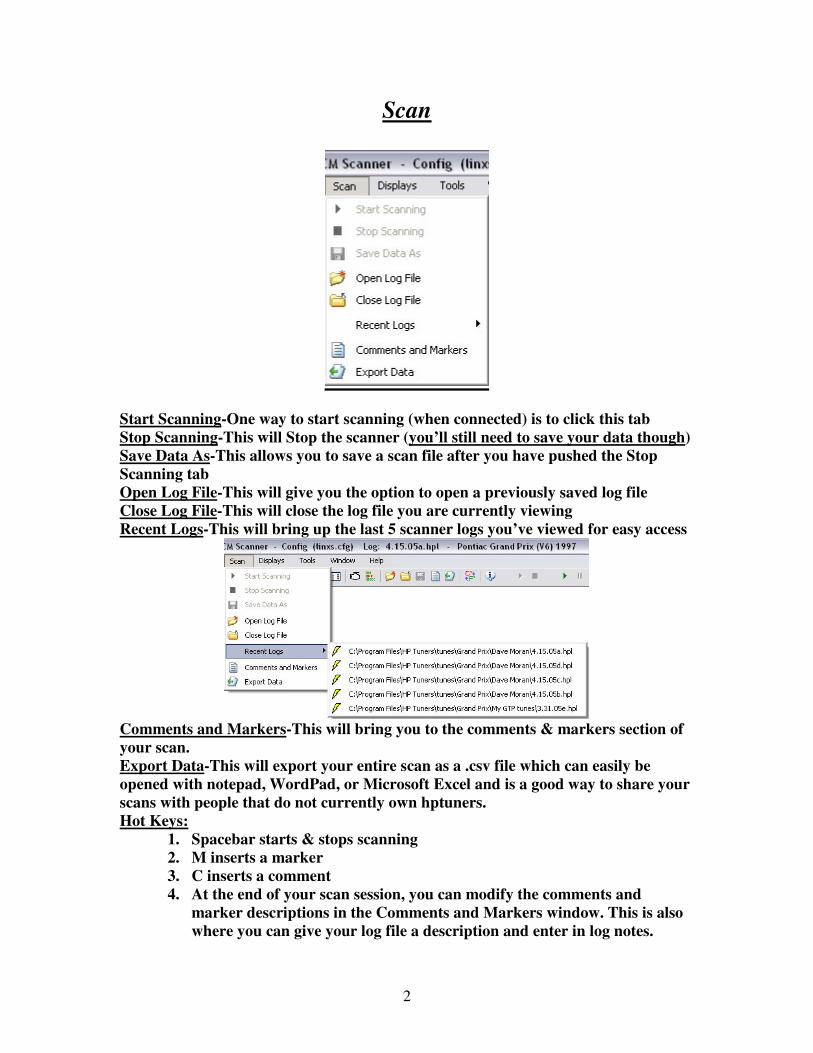
Scan
Start Scanning-One way to start scanning (when connected) is to click this tab
Stop Scanning-This will Stop the scanner (you’ll still need to save your data though)
Save Data As-This allows you to save a scan file after you have pushed the Stop
Scanning tab
Open Log File-This will give you the option to open a previously saved log file
Close Log File-This will close the log file you are currently viewing
Recent Logs-This will bring up the last 5 scanner logs you’ve viewed for easy access
Comments and Markers-This will bring you to the comments & markers section of
your scan.
Export Data-This will export your entire scan as a .csv file which can easily be
opened with notepad, WordPad, or Microsoft Excel and is a good way to share your
scans with people that do not currently own hptuners.
Hot Keys:
1. Spacebar starts & stops scanning
2. M inserts a marker
3. C inserts a comment
4. At the end of your scan session, you can modify the comments and
marker descriptions in the Comments and Markers window. This is also
where you can give your log file a description and enter in log notes.
3
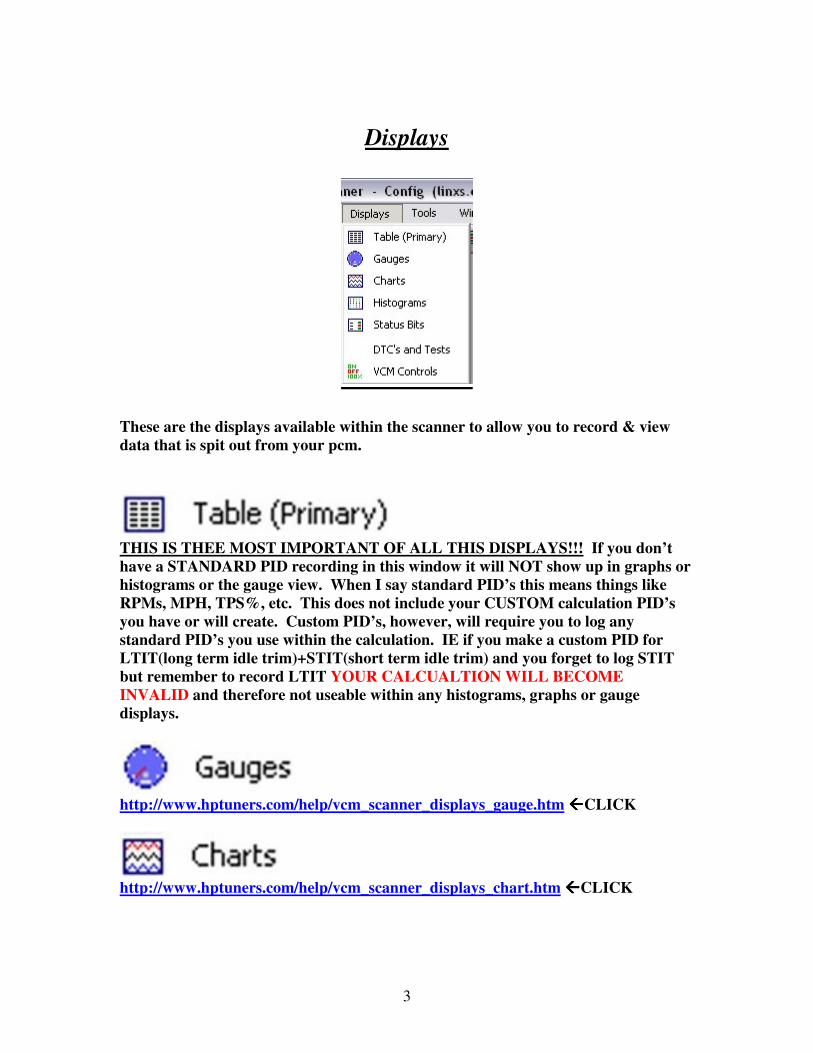
Displays
These are the displays available within the scanner to allow you to record & view
data that is spit out from your pcm.
THIS IS THEE MOST IMPORTANT OF ALL THIS DISPLAYS!!! If you don’t
have a STANDARD PID recording in this window it will NOT show up in graphs or
histograms or the gauge view. When I say standard PID’s this means things like
RPMs, MPH, TPS%, etc. This does not include your CUSTOM calculation PID’s
you have or will create. Custom PID’s, however, will require you to log any
standard PID’s you use within the calculation. IE if you make a custom PID for
LTIT(long term idle trim)+STIT(short term idle trim) and you forget to log STIT
but remember to record LTIT YOUR CALCUALTION WILL BECOME
INVALID and therefore not useable within any histograms, graphs or gauge
displays.
http://www.hptuners.com/help/vcm_scanner_displays_gauge.htm ����CLICK
http://www.hptuners.com/help/vcm_scanner_displays_chart.htm ����CLICK
4
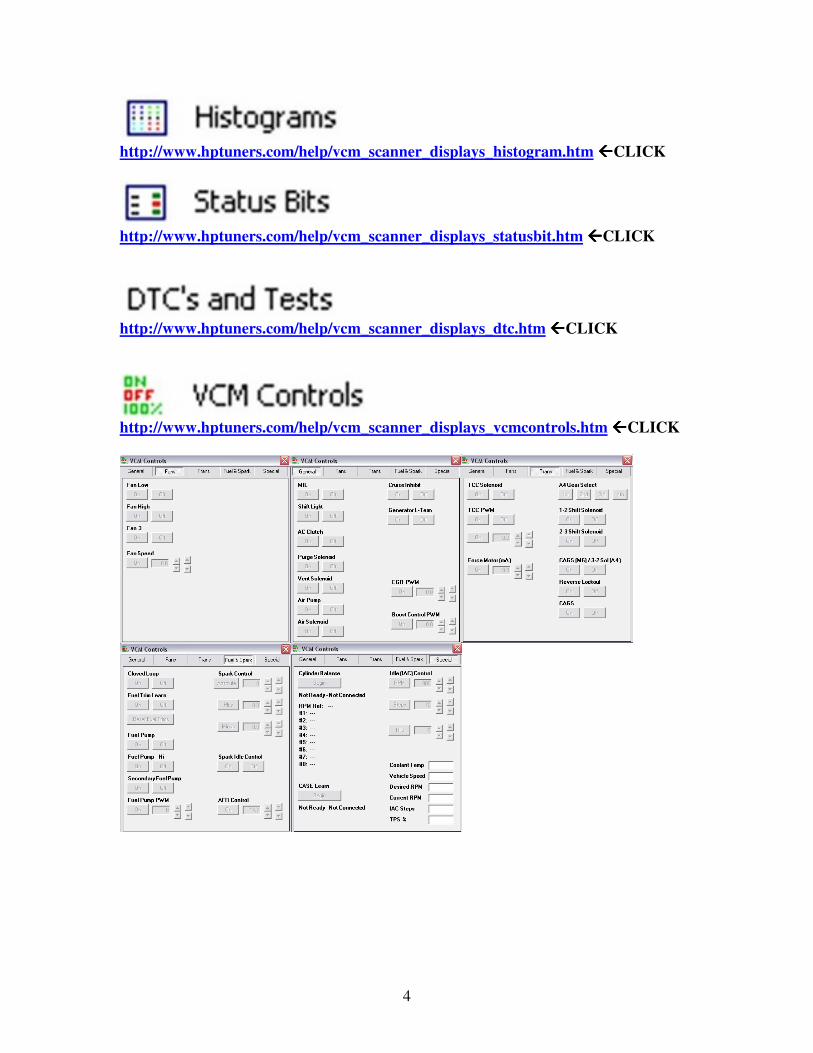
http://www.hptuners.com/help/vcm_scanner_displays_histogram.htm ����CLICK
http://www.hptuners.com/help/vcm_scanner_displays_statusbit.htm ����CLICK
http://www.hptuners.com/help/vcm_scanner_displays_dtc.htm ����CLICK
http://www.hptuners.com/help/vcm_scanner_displays_vcmcontrols.htm ����CLICK
5
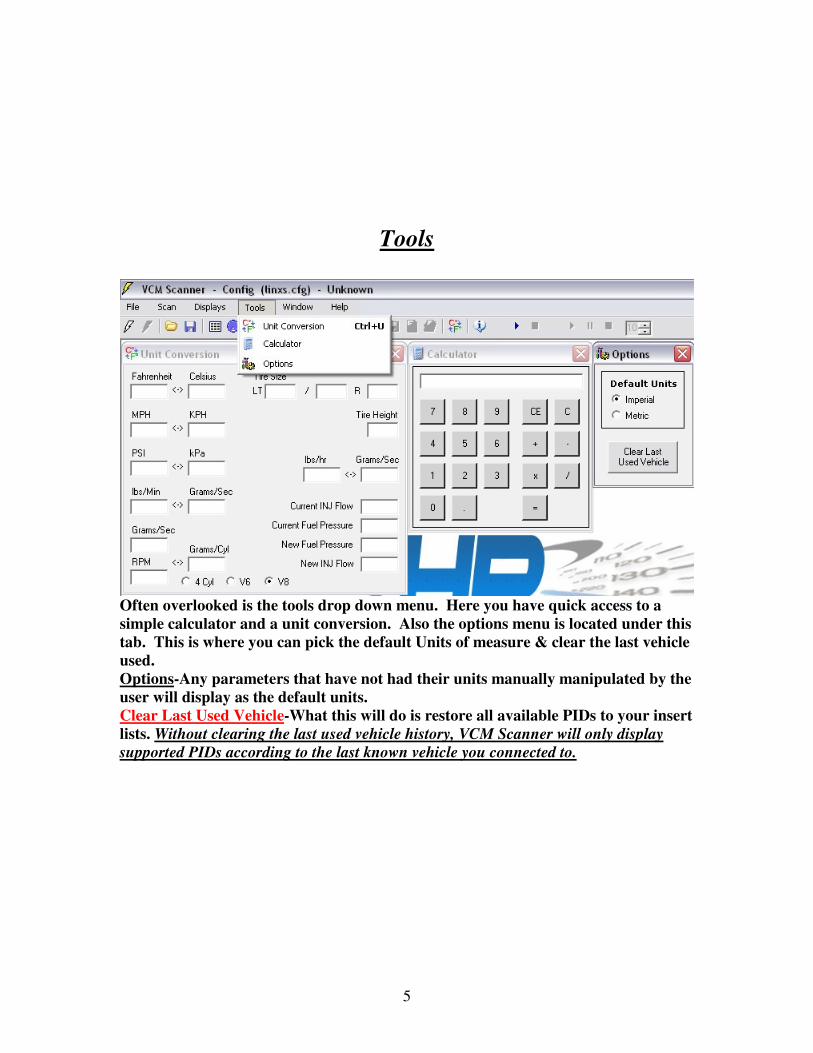
Tools
Often overlooked is the tools drop down menu. Here you have quick access to a
simple calculator and a unit conversion. Also the options menu is located under this
tab. This is where you can pick the default Units of measure & clear the last vehicle
used.
Options-Any parameters that have not had their units manually manipulated by the
user will display as the default units.
Clear Last Used Vehicle-What this will do is restore all available PIDs to your insert
lists. Without clearing the last used vehicle history, VCM Scanner will only display
supported PIDs according to the last known vehicle you connected to.
6
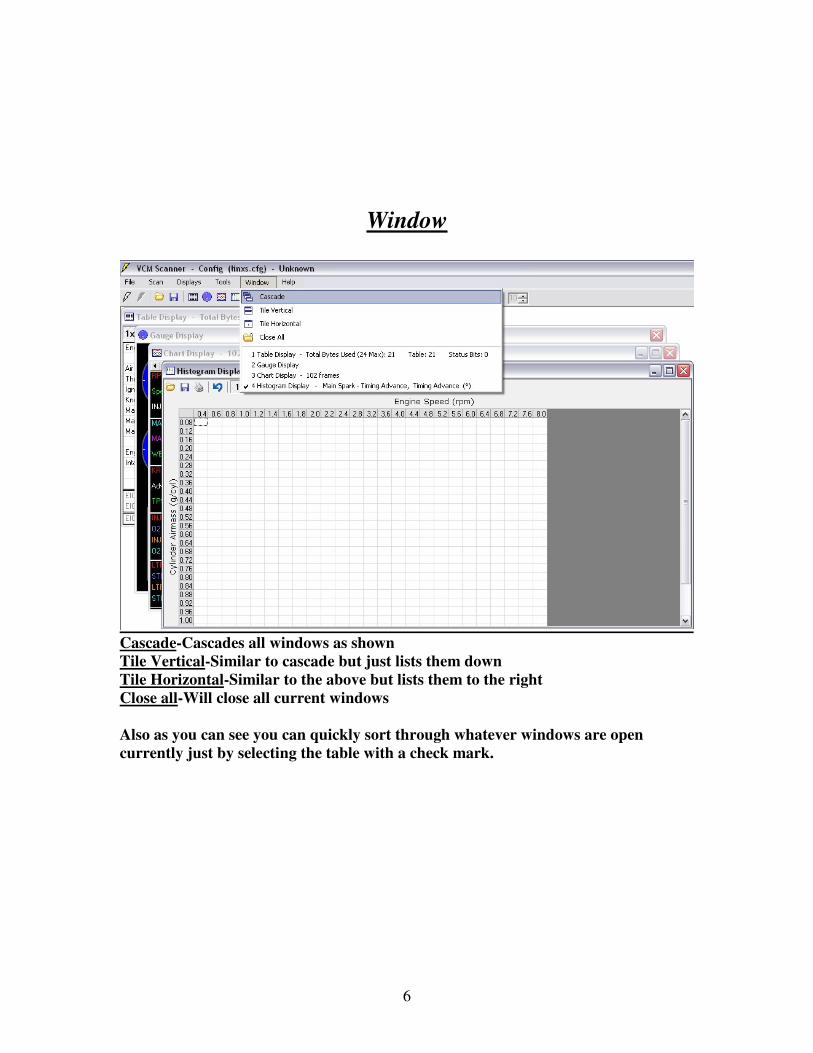
Window
Cascade-Cascades all windows as shown
Tile Vertical-Similar to cascade but just lists them down
Tile Horizontal-Similar to the above but lists them to the right
Close all-Will close all current windows
Also as you can see you can quickly sort through whatever windows are open
currently just by selecting the table with a check mark.
7
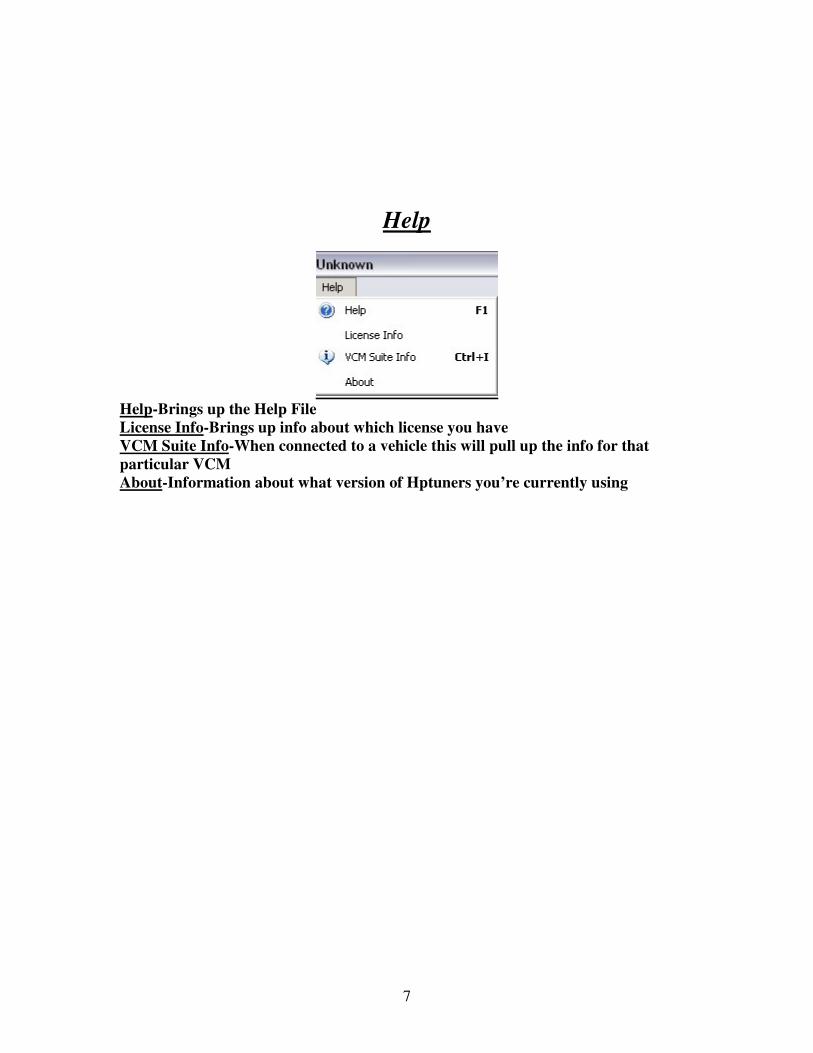
Help
Help-Brings up the Help File
License Info-Brings up info about which license you have
VCM Suite Info-When connected to a vehicle this will pull up the info for that
particular VCM
About-Information about what version of Hptuners you’re currently using
8
TABLE DISPLAY I will repeat this as it is imperative that you follow this rule:
THIS IS THEE MOST IMPORTANT OF ALL THIS DISPLAYS!!! If you don’t
have a STANDARD PID recording in this window it will NOT show up in graphs or
histograms or the gauge view. When I say standard PID’s this means things like
RPMs, MPH, TPS%, etc. This does not include your CUSTOM calculation PID’s
you have or will create. Custom PID’s, however, will require you to log any
standard PID’s you use within the calculation. IE if you make a custom PID for
LTIT(long term idle trim)+STIT(short term idle trim) and you forget to log STIT
but remember to record LTIT YOUR CALCUALTION WILL BECOME
INVALID and therefore not useable within any histograms, graphs or gauge
displays.
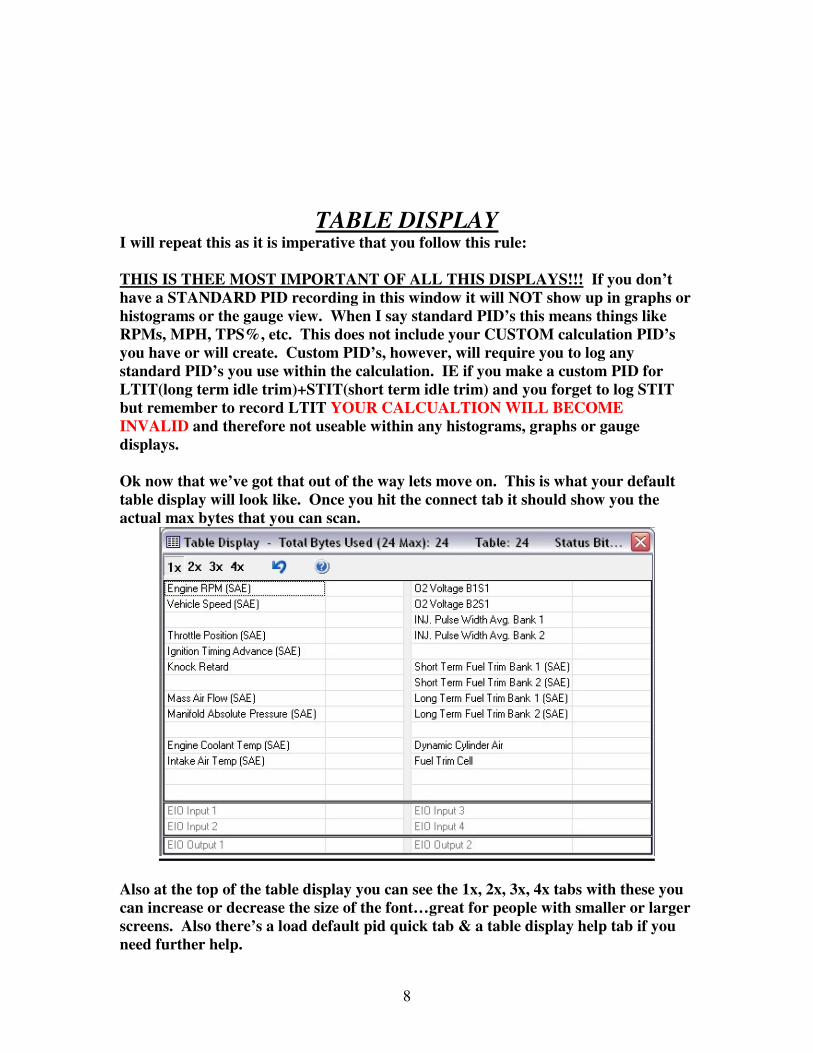
Ok now that we’ve got that out of the way lets move on. This is what your default
table display will look like. Once you hit the connect tab it should show you the
actual max bytes that you can scan.
Also at the top of the table display you can see the 1x, 2x, 3x, 4x tabs with these you
can increase or decrease the size of the font…great for people with smaller or larger
screens. Also there’s a load default pid quick tab & a table display help tab if you
need further help.
9
When scanning and you see how many “max bytes” you can log try to get 24 bytes
or under on 48max cars/trucks as this will give you more frames per second as you
can see in the chart below. The computer just pings the computer more frequently
which gives you more data which is what you need while scanning to tune. The
more frames per second the better.
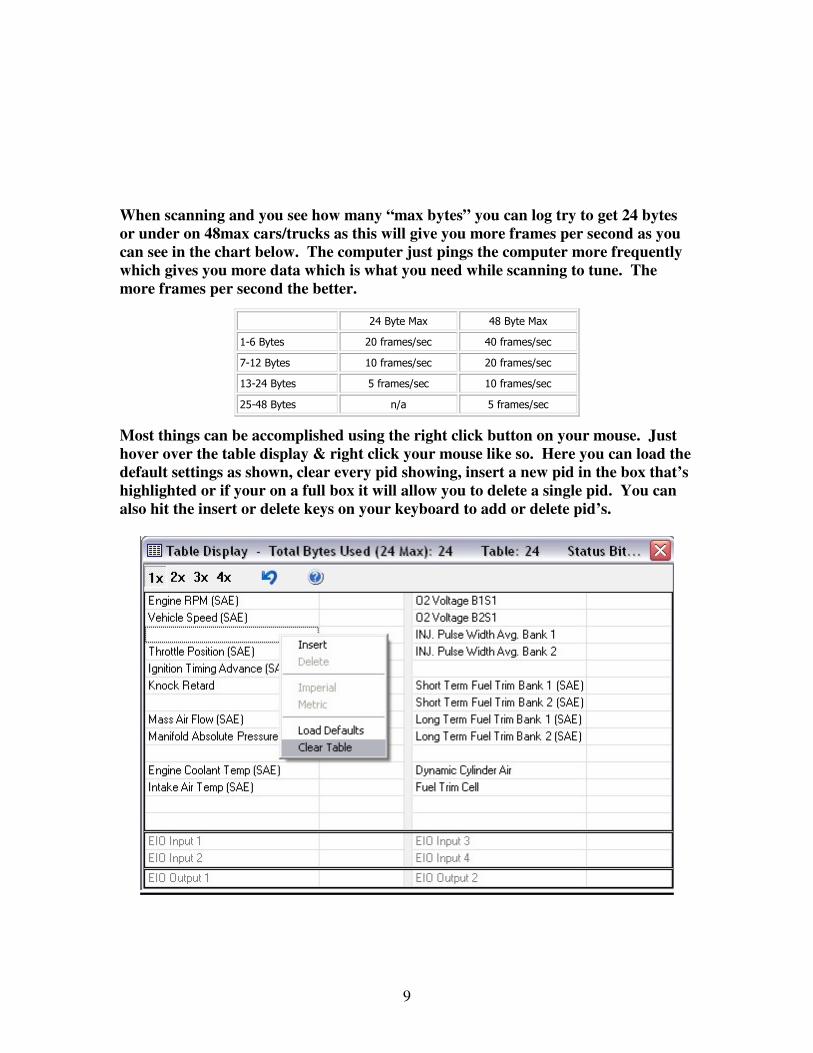
Most things can be accomplished using the right click button on your mouse. Just
hover over the table display & right click your mouse like so. Here you can load the
default settings as shown, clear every pid showing, insert a new pid in the box that’s
highlighted or if your on a full box it will allow you to delete a single pid. You can
also hit the insert or delete keys on your keyboard to add or delete pid’s.
24 Byte Max 48 Byte Max
1-6 Bytes 20 frames/sec 40 frames/sec
7-12 Bytes 10 frames/sec 20 frames/sec
13-24 Bytes 5 frames/sec 10 frames/sec
25-48 Bytes n/a 5 frames/sec
10
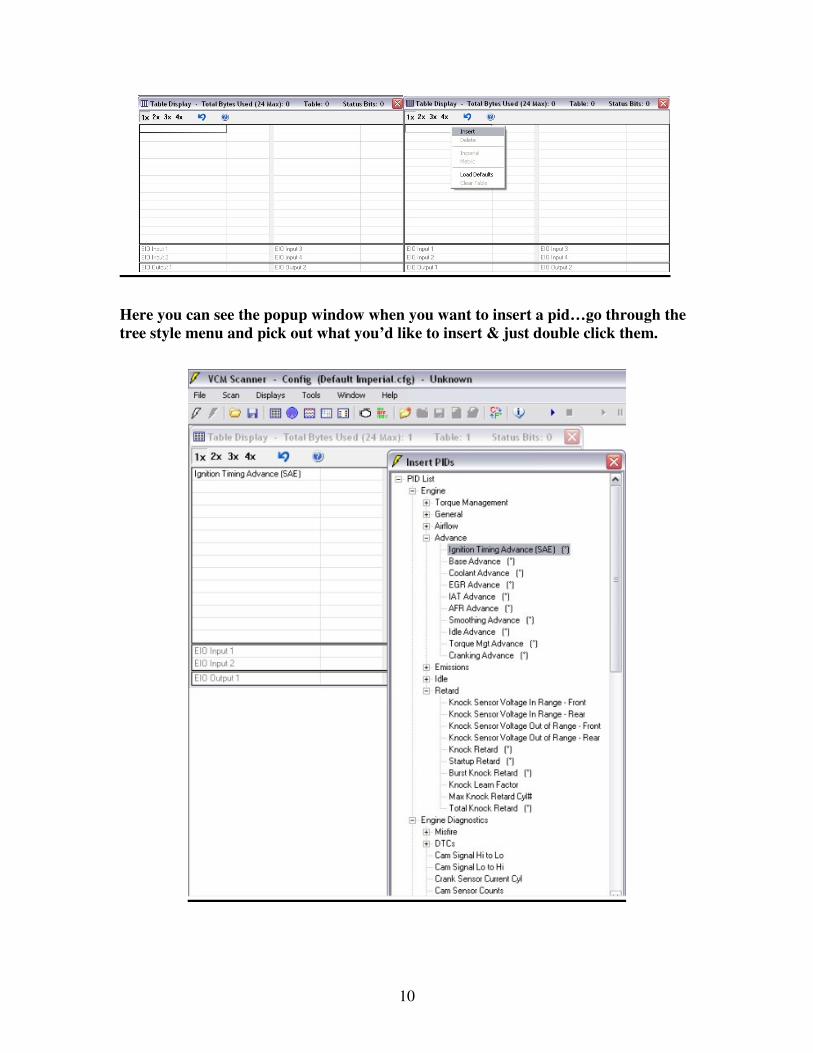
Here you can see the popup window when you want to insert a pid…go through the
tree style menu and pick out what you’d like to insert & just double click them.
11
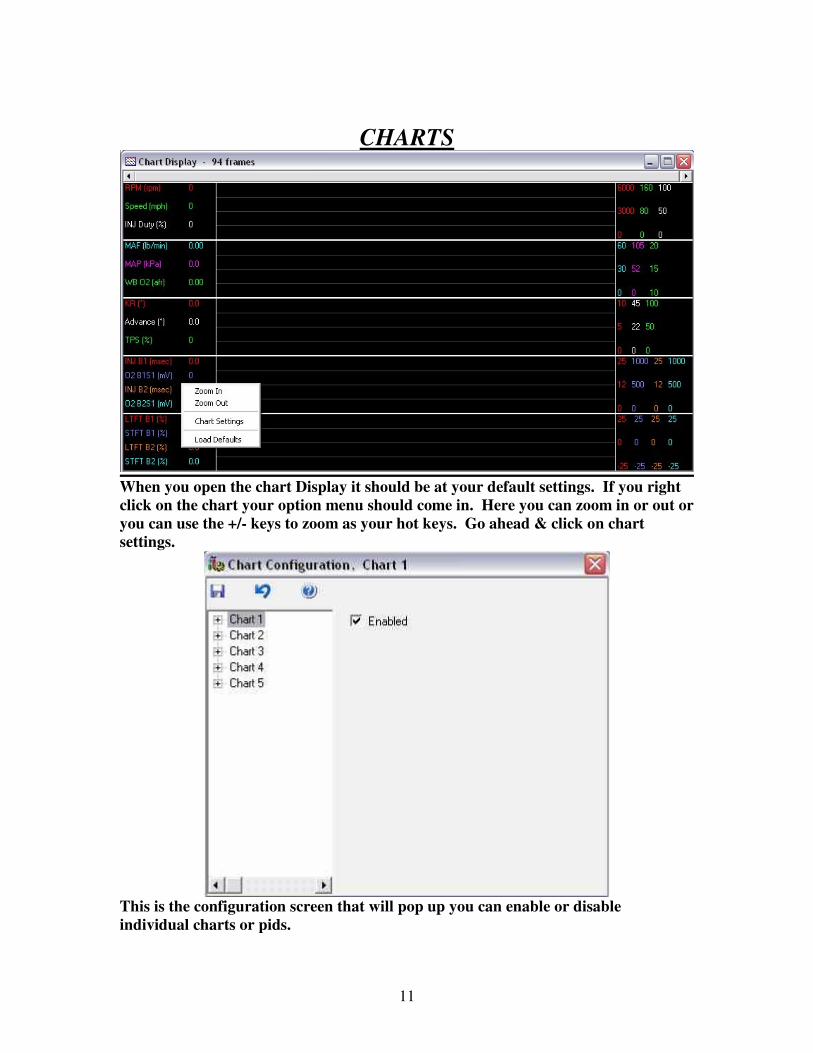
CHARTS
When you open the chart Display it should be at your default settings. If you right
click on the chart your option menu should come in. Here you can zoom in or out or
you can use the +/- keys to zoom as your hot keys. Go ahead & click on chart
settings.
This is the configuration screen that will pop up you can enable or disable
individual charts or pids.
12
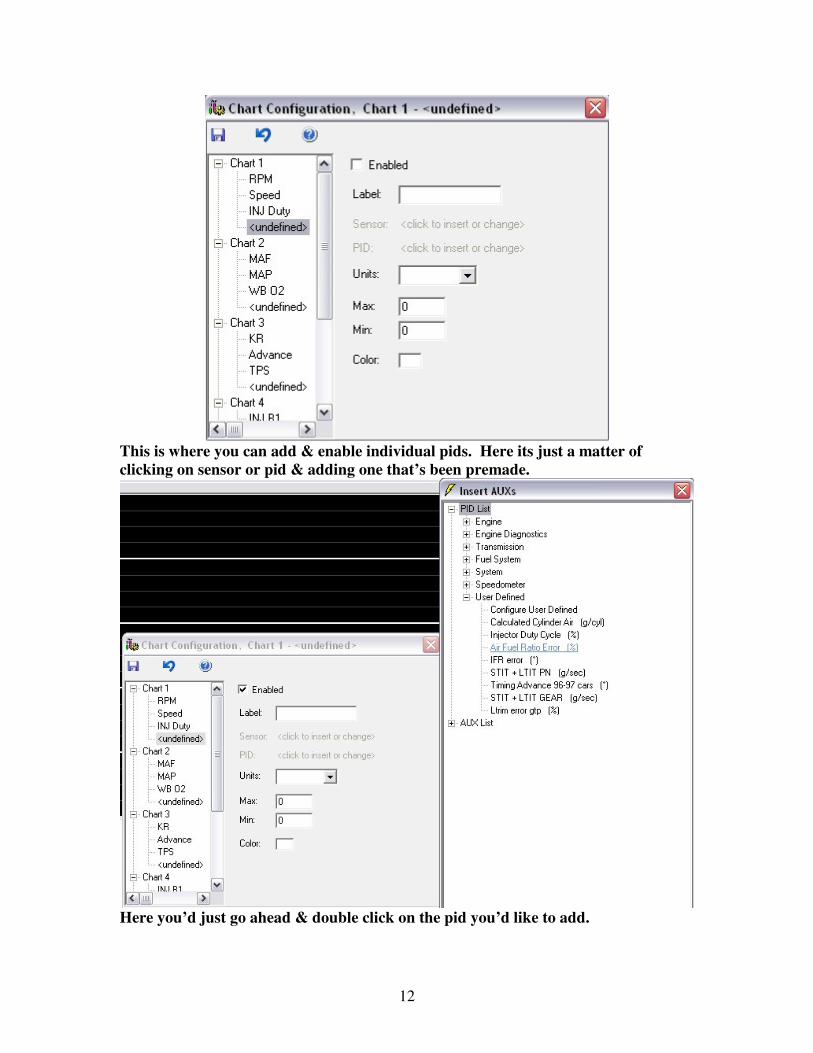
This is where you can add & enable individual pids. Here its just a matter of
clicking on sensor or pid & adding one that’s been premade.
Here you’d just go ahead & double click on the pid you’d like to add.
13
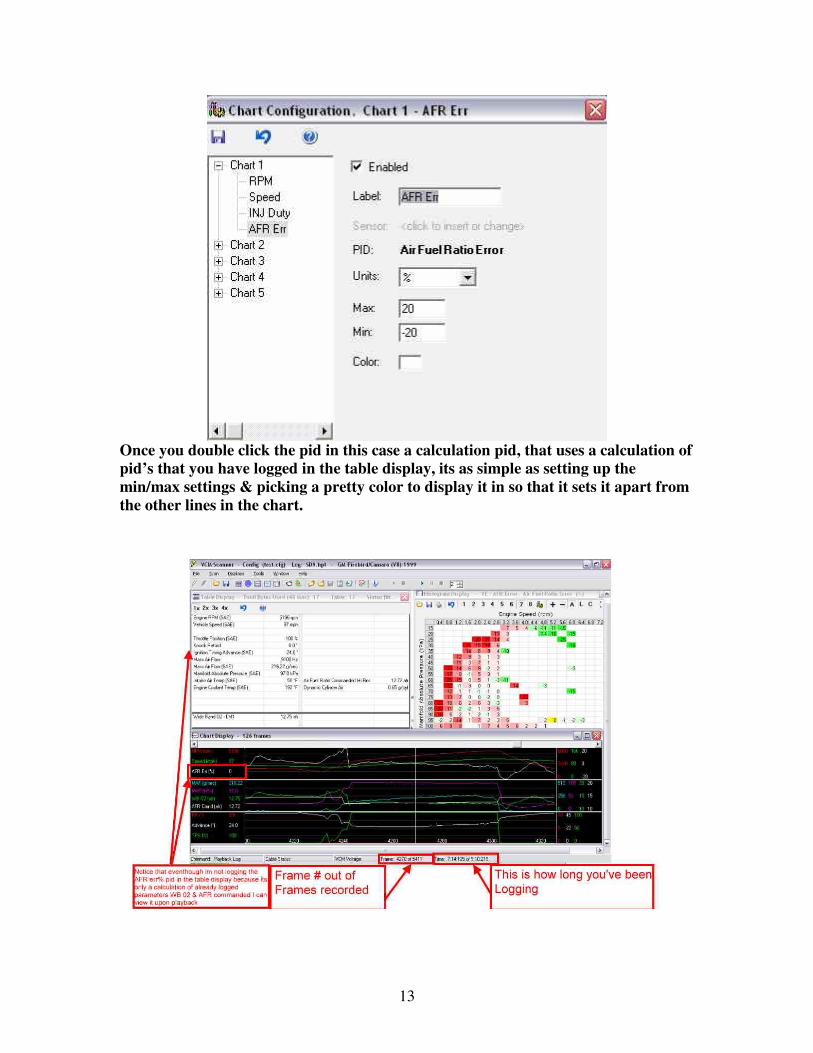
Once you double click the pid in this case a calculation pid, that uses a calculation of
pid’s that you have logged in the table display, its as simple as setting up the
min/max settings & picking a pretty color to display it in so that it sets it apart from
the other lines in the chart.
14
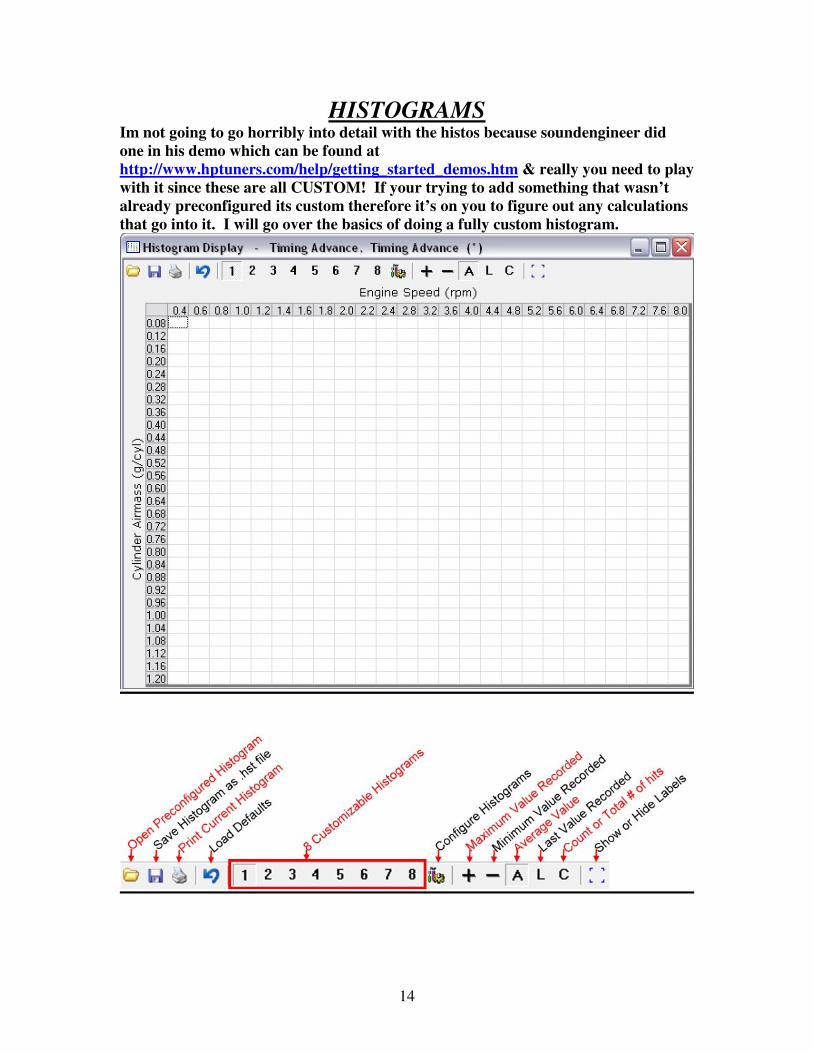
HISTOGRAMS Im not going to go horribly into detail with the histos because soundengineer did
one in his demo which can be found at
http://www.hptuners.com/help/getting_started_demos.htm & really you need to play
with it since these are all CUSTOM! If your trying to add something that wasn’t
already preconfigured its custom therefore it’s on you to figure out any calculations
that go into it. I will go over the basics of doing a fully custom histogram.
15
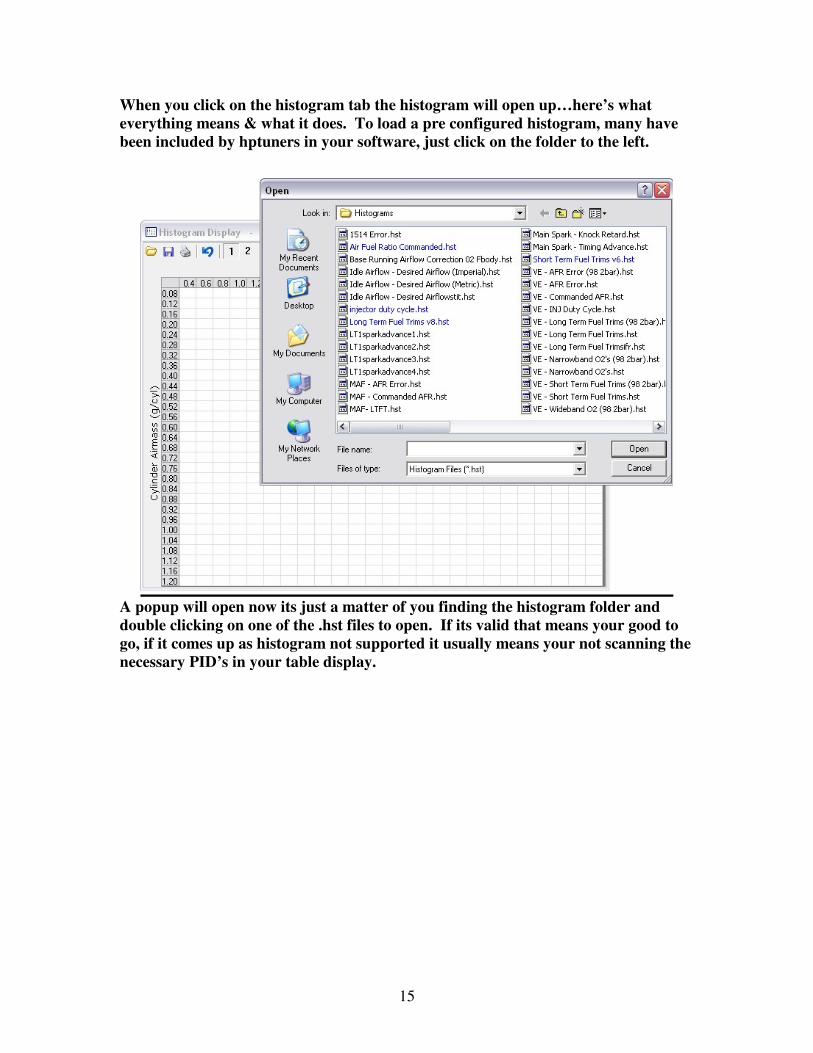
When you click on the histogram tab the histogram will open up…here’s what
everything means & what it does. To load a pre configured histogram, many have
been included by hptuners in your software, just click on the folder to the left.
A popup will open now its just a matter of you finding the histogram folder and
double clicking on one of the .hst files to open. If its valid that means your good to
go, if it comes up as histogram not supported it usually means your not scanning the
necessary PID’s in your table display.
16
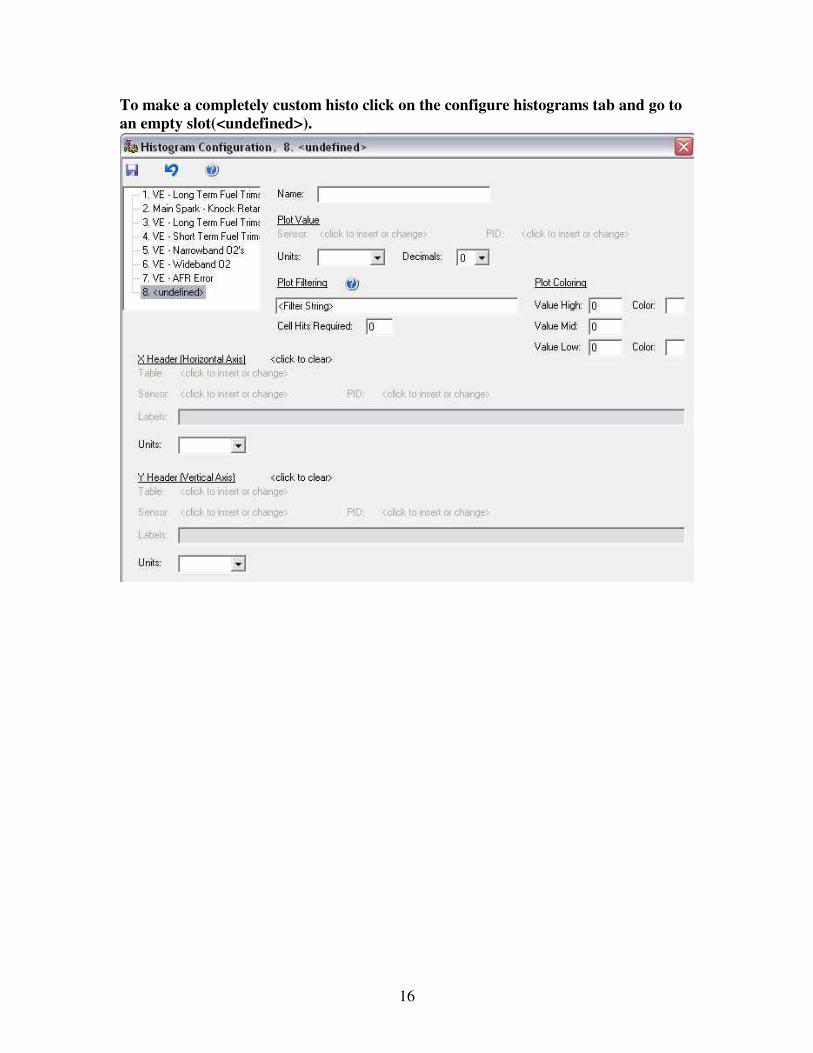
To make a completely custom histo click on the configure histograms tab and go to
an empty slot(<undefined>).

17
I’m going to do one for actual afr vs. timing. Go ahead & name it & pick the pid in
your table display you’d like to map. It should bring up the correct unit but
sometimes if your referring things like map it will ask you if you’d rather plot KPA
or PSI so just keep an eye on all the settings. We are going to set it to 1 decimal.
18
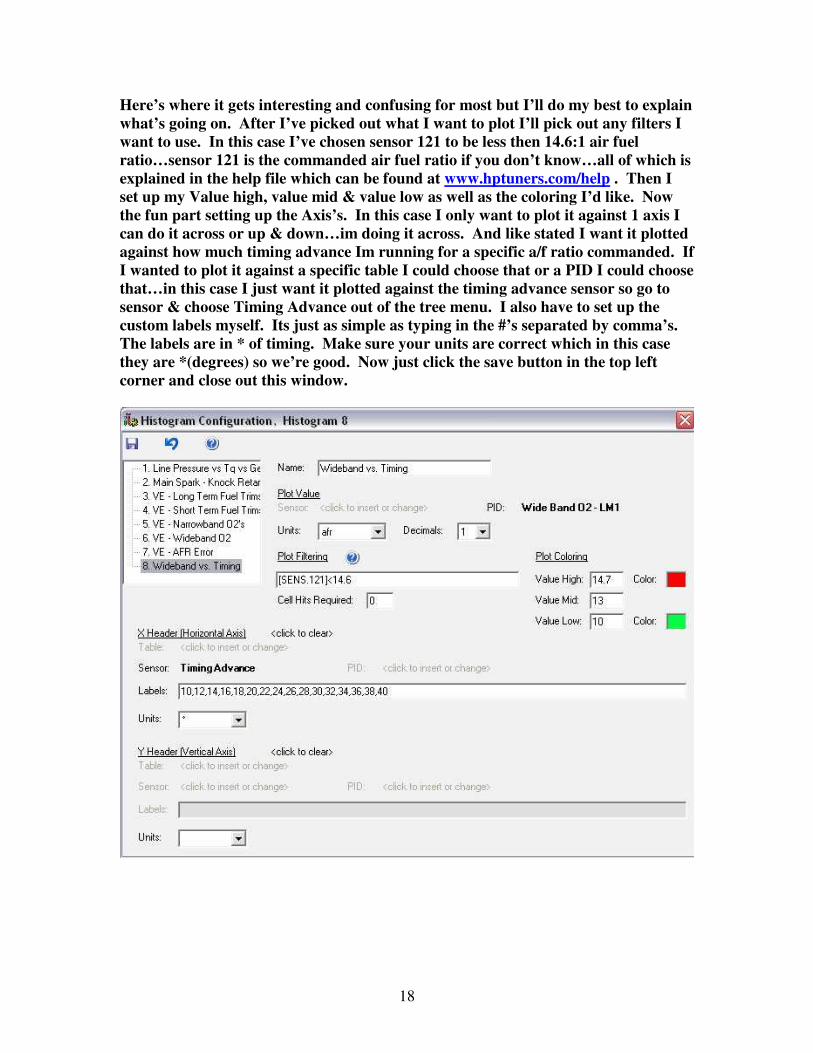
Here’s where it gets interesting and confusing for most but I’ll do my best to explain
what’s going on. After I’ve picked out what I want to plot I’ll pick out any filters I
want to use. In this case I’ve chosen sensor 121 to be less then 14.6:1 air fuel
ratio…sensor 121 is the commanded air fuel ratio if you don’t know…all of which is
explained in the help file which can be found at www.hptuners.com/help . Then I
set up my Value high, value mid & value low as well as the coloring I’d like. Now
the fun part setting up the Axis’s. In this case I only want to plot it against 1 axis I
can do it across or up & down…im doing it across. And like stated I want it plotted
against how much timing advance Im running for a specific a/f ratio commanded. If
I wanted to plot it against a specific table I could choose that or a PID I could choose
that…in this case I just want it plotted against the timing advance sensor so go to
sensor & choose Timing Advance out of the tree menu. I also have to set up the
custom labels myself. Its just as simple as typing in the #’s separated by comma’s.
The labels are in * of timing. Make sure your units are correct which in this case
they are *(degrees) so we’re good. Now just click the save button in the top left
corner and close out this window.
19
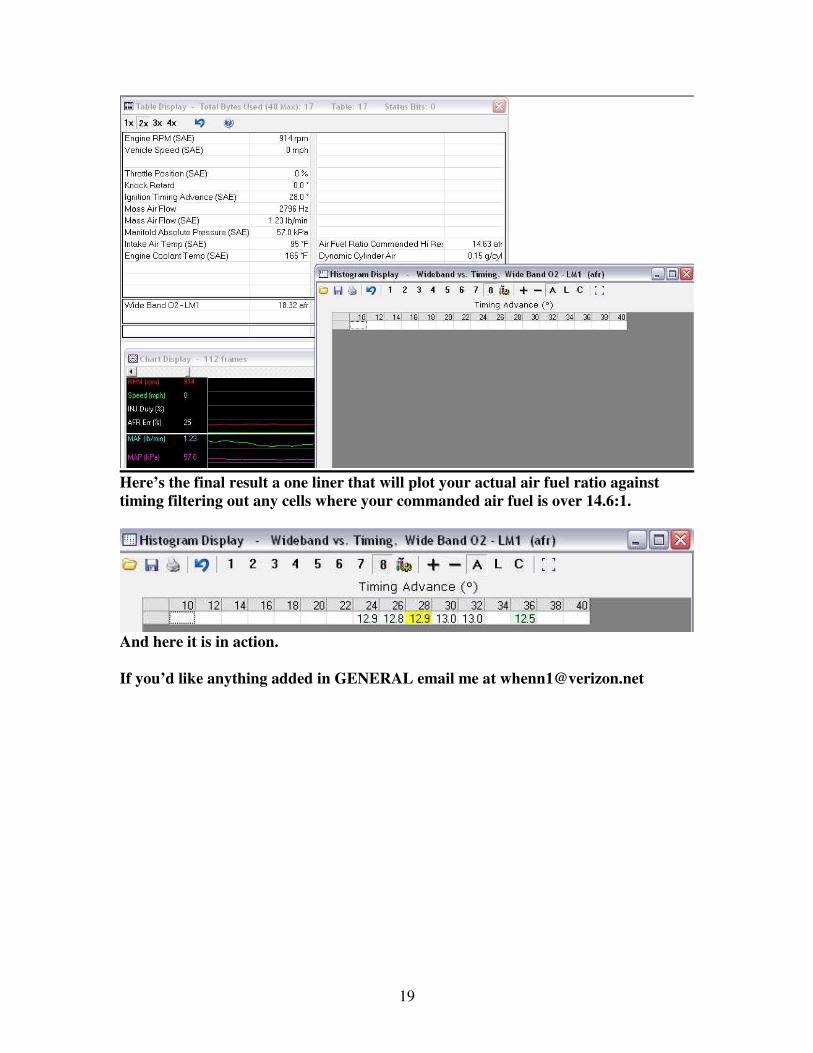
Here’s the final result a one liner that will plot your actual air fuel ratio against
timing filtering out any cells where your commanded air fuel is over 14.6:1.
And here it is in action.
If you’d like anything added in GENERAL email me at [email protected]