
HPC Performance in the Cloud: Status and Future Prospects · 20 vHadoop Benchmarking Study...
30
© 2009 VMware Inc. All rights reserved HPC Performance in the Cloud: Status and Future Prospects ISC Cloud 2012 Josh Simons, Office of the CTO, VMware
Transcript of HPC Performance in the Cloud: Status and Future Prospects · 20 vHadoop Benchmarking Study...

© 2009 VMware Inc. All rights reserved
HPC Performance in the Cloud:
Status and Future Prospects
ISC Cloud 2012
Josh Simons, Office of the CTO, VMware

2
Cloud
“Cloud computing is a model for enabling ubiquitous, convenient,
on demand network access to a shared pool of configurable
computing resources (e.g., networks, servers, storage, applications,
and services) that can be rapidly provisioned and released with
minimal management effort or service provider interaction.”
National Institute of Standards and Technology, U.S. Department of Commerce

3
VMware vCloud API
Users IT
Research Group 1 Research Group m
Public Clouds
Programmatic
Control and
Integrations
User Portals
Secure Private Cloud
Security
VMware
vShield
Research Cluster 1 Research Cluster n
VMware vCloud Director
VMware
vCenter Server
VMware vSphere VMware vSphere VMware vSphere
Catalogs
VMware
vCenter Server
VMware
vCenter Server

4
Run Any Software Stacks
application a
operating system a
application b
operating system b
virtualization layer
hardware
virtualization layer
hardware
virtualization layer
hardware
5
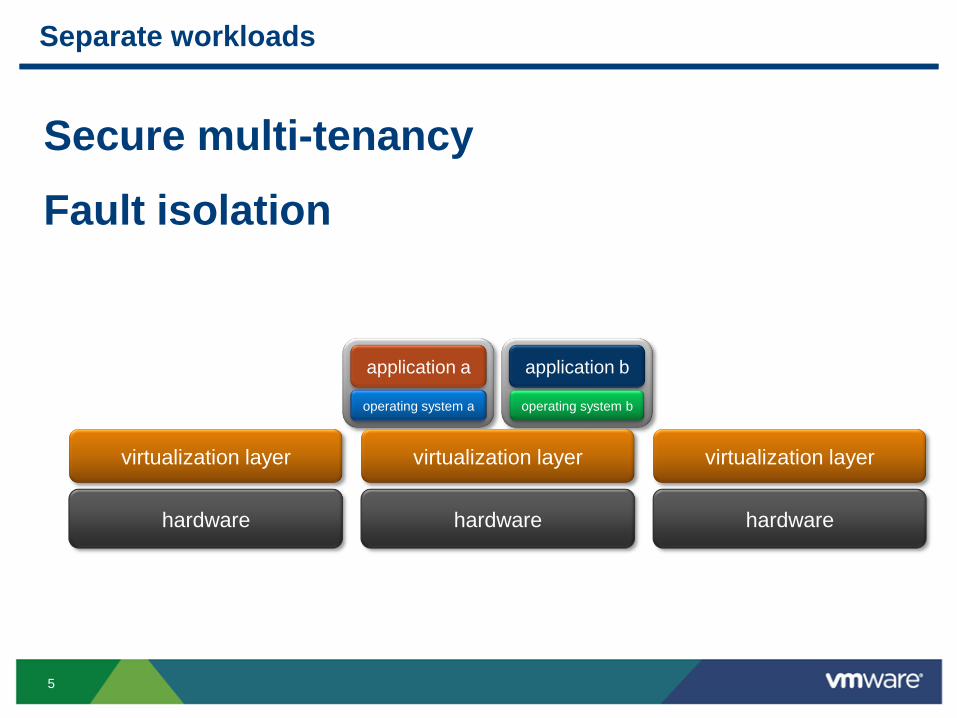
Separate workloads
application a
operating system a
application b
operating system b
virtualization layer
hardware
virtualization layer
hardware
virtualization layer
hardware
Secure multi-tenancy
Fault isolation

6
Separate workloads
application a
operating system a
application b
operating system b
virtualization layer
hardware
virtualization layer
hardware
virtualization layer
hardware
Secure multi-tenancy
Fault isolation
…and sometimes Performance

7
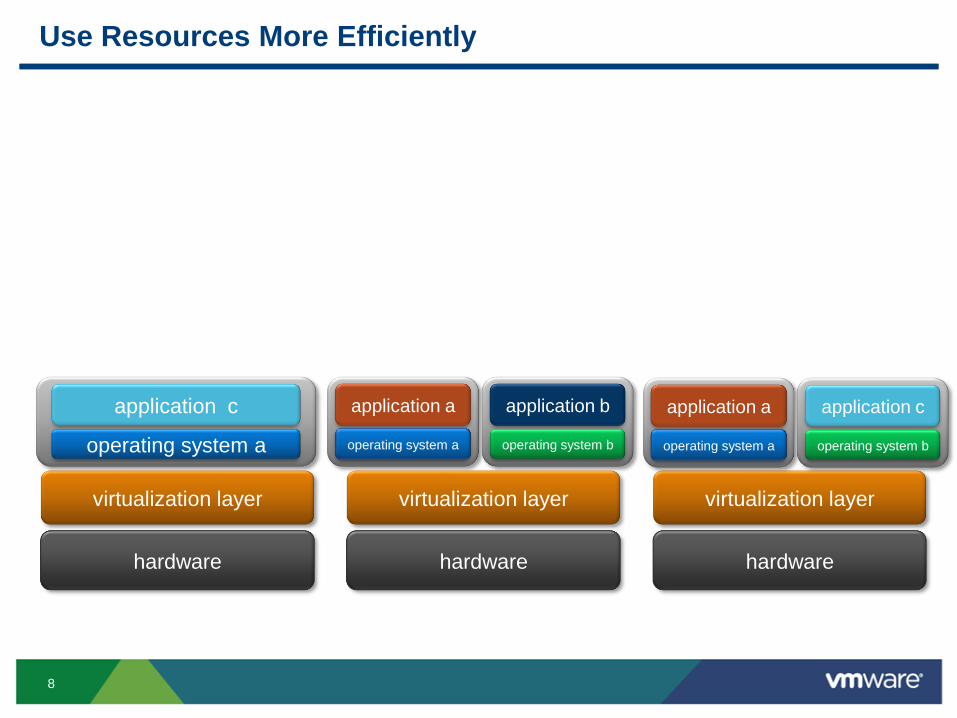
Use Resources More Efficiently
application a
operating system a
application b
operating system b
virtualization layer
hardware
virtualization layer
hardware
virtualization layer
hardware
application a
operating system a
application c
operating system b
application c
operating system a
8
Use Resources More Efficiently
application a
operating system a
application b
operating system b
virtualization layer
hardware
virtualization layer
hardware
virtualization layer
hardware
application a
operating system a
application c
operating system b
application c
operating system a

9
Protect Applications from Hardware Failures
virtualization layer
hardware
virtualization layer
hardware
virtualization layer
hardware
Reactive Fault Tolerance: “Fail and Recover”
application a
operating system

10
Protect Applications from Hardware Failures
Virtualization
Hardware
virtualization layer
hardware
virtualization layer
hardware
Reactive Fault Tolerance: “Fail and Recover”
application a
operating system

11
Protect Applications from Hardware Failures
virtualization layer
hardware
virtualization layer
hardware
virtualization layer
hardware
mpi rank 0
operating system
mpi rank 1
operating system
mpi rank 2
operating system
Proactive Fault Tolerance: “Move and Continue”

12
Protect Applications from Hardware Failures
virtualization layer
hardware
Virtualization
Hardware
virtualization layer
hardware
mpi rank 0
operating system
mpi rank 1
operating system
mpi rank 2
operating system
Proactive Fault Tolerance: “Move and Continue”

13
Virtualization
Performance

14
When a Picture Is NOT Worth a Thousand Words
virtualization layer
hardware
application
operating system

15
Linear Algebra
L. Youseff, K. Seymour, H. You, J. Dongarra, and R. Wolski. The impact of paravirtualized memory
hierarchy on linear algebra computational kernels and software. In HPDC, pages 141-152. ACM, 2008.

16
Biosequence Analysis: BLAST
C. Macdonell and P. Lu, "Pragmatics of Virtual Machines for High-Performance Computing: A Quantitative
Study of Basic Overheads, " in Proc. of the High Perf. Computing & Simulation Conf., 2007.

17
Biosequence Analysis: HMMer
C. Macdonell and P. Lu, "Pragmatics of Virtual Machines for High-Performance Computing: A Quantitative
Study of Basic Overheads, " in Proc. of the High Perf. Computing & Simulation Conf., 2007.

18
Molecular Dynamics: GROMACS
C. Macdonell and P. Lu, "Pragmatics of Virtual Machines for High-Performance Computing: A Quantitative
Study of Basic Overheads, " in Proc. of the High Perf. Computing & Simulation Conf., 2007.

19
Other Single-process Workloads
Also generally within 1 – 5% of native performance
• Electronic Design Automation (EDA)
• Digital Content Creation (DCC)
GPGPU
• About 98% of native performance, based on simple CUDA testing

20
vHadoop Benchmarking Study
Seven-node Hadoop cluster (AMAX ClusterMax)
Standard tests: PI, DFSIO, Teragen / Terasort
Configurations: native, one VM per host, two VMs per host
Details:
• two-socket Intel X5650, 96 GB, Mellanox 10 GbE, 12x 7200rpm SATA
• RHEL 6.1, 6- or 12-vCPU VMs, vmxnet3
• Cloudera CDH3U0, replication=2, max 40 map and 10 reduce tasks per host
• Each physical host considered a “rack” in Hadoop’s topology description
• ESXi 5.0 w/dev Mellanox driver, disks passed to VMs via RDMs
A Benchmarking Case Study of Virtualized Hadoop Performance on
VMware vSphere 5, J. Buell
http://www.vmware.com/files/pdf/VMW-Hadoop-Performance-vSphere5.pdf

21
Ratio to Native, Lower is Better
0
0.2
0.4
0.6
0.8
1
1.2 R
ati
o t
o N
ati
ve
1 VM
2 VMs

22
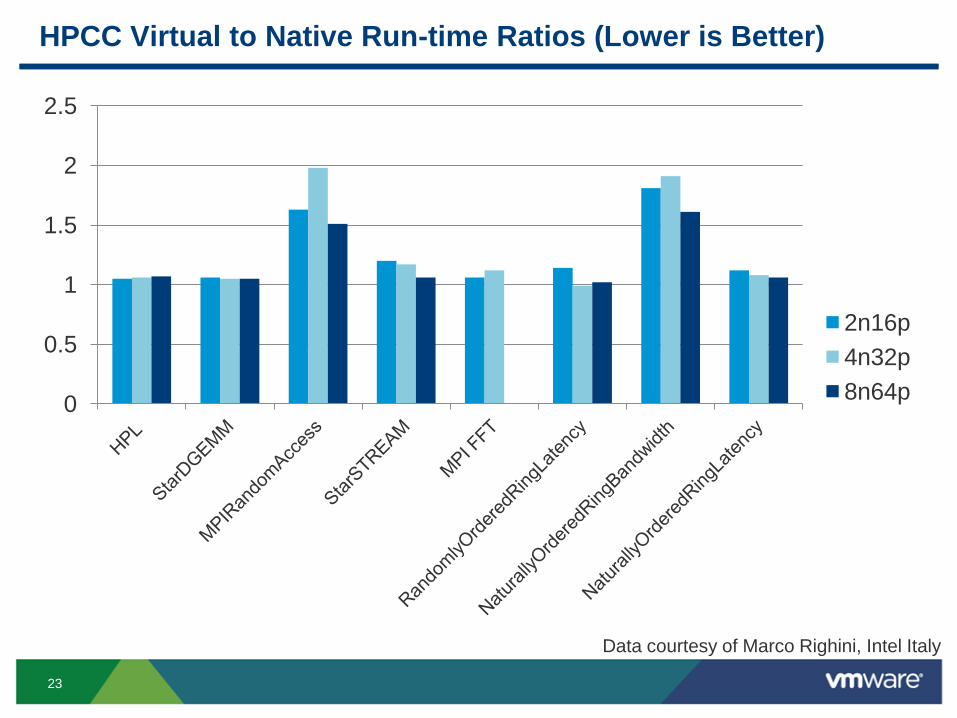
Intel 2009 Experiments
Hardware
• Eight two-socket 2.93GHz X5570 (Nehalem-EP) nodes, 24 GB
• Dual-ported Mellanox DDR InfiniBand adaptor
• Mellanox 36-port switch
Software
• vSphere 4.0 (current version is 5.1)
• Platform Open Cluster Stack (OCS) 5 (native and guest)
• Intel compilers 11.1
• HPCC 1.3.1
• STAR-CD V4.10.008_x86
23
HPCC Virtual to Native Run-time Ratios (Lower is Better)
Data courtesy of Marco Righini, Intel Italy
0
0.5
1
1.5
2
2.5
2n16p
4n32p
8n64p

24
Point-to-point Message Size Distribution: STAR-CD
Source: http://www.hpcadvisorycouncil.com/pdf/CD_adapco_applications.pdf
25
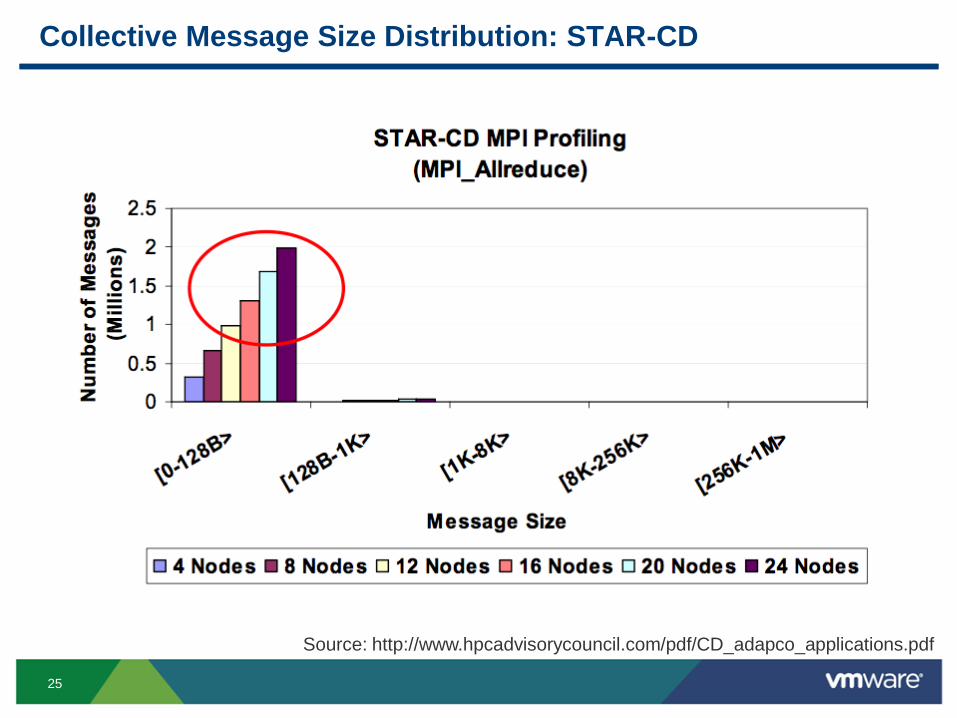
Collective Message Size Distribution: STAR-CD
Source: http://www.hpcadvisorycouncil.com/pdf/CD_adapco_applications.pdf

26
STAR-CD Virtual to Native Run-time Ratios (Lower is Better)
1.00
1.19
1.15
0.90
0.95
1.00
1.05
1.10
1.15
1.20
1.25
Physical ESX4 (1 socket) ESX4 (2 socket)
STAR-CD A-Class Model (on 8n32p)
Data courtesy of Marco Righini, Intel Italy

27
InfiniBand Bandwidth with Passthrough (VM DirectPath I/O)
0
500
1000
1500
2000
2500
3000
3500
2 4 8 16 32 64 128 256 512 1K 2K 4K 8K 16K 32K 64K 128K 256K 512K 1M 2M 4M 8M
Ban
dw
idth
(M
B/s
)
Message size (bytes)
Send: Native
Send: ESXi
RDMA Read: Native
RDMA Read: ESXi

28
Latency with VM DirectPath I/O (RDMA Read, Polling)
1
2
4
8
16
32
64
128
256
512
1024
2048
4096
2 4 8 16 32 64 128 256 512 1K 2K 4K 8K 16K 32K 64K 128K 256K 512K 1M 2M 4M 8M
Hal
f ro
un
dtr
ip la
ten
cy (
µs)
Message size (bytes)
Native
ESXi ExpA
MsgSize (bytes) Native ESXi ExpA
2 2.28 2.98
4 2.28 2.98
8 2.28 2.98
16 2.27 2.96
32 2.28 2.98
64 2.28 2.97
128 2.32 3.02
256 2.5 3.19

29
Latency with VM DirectPath I/O (Send/Receive, Polling)
1
2
4
8
16
32
64
128
256
512
1024
2048
4096
2 4 8 16 32 64 128 256 512 1K 2K 4K 8K 16K 32K 64K 128K 256K 512K 1M 2M 4M 8M
Hal
f ro
un
dtr
ip la
ten
cy (µ
s)
Message size (bytes)
Native
ESXi ExpA
MsgSize (bytes) Native ESXi ExpA
2 1.35 1.75
4 1.35 1.75
8 1.38 1.78
16 1.37 2.05
32 1.38 2.35
64 1.39 2.9
128 1.5 4.13
256 2.3 2.31

30
Summary and Conclusions
Virtualization can enable new capabilities not available in
traditional bare-metal HPC environments
Throughput-oriented applications generally run very well in virtual
environments with typical slowdowns of 1 - 5%, depending on I/O
characteristics
Latency sensitive MPI applications will generally experience
noticeable slowdowns, dependent on application messaging
profiles. 15% seen for industrial scale CFD code in 2009
Further latency reductions will improve MPI performance over time
Both the value of benefits and the performance cost will vary by
organization
Today’s cloud is not tomorrow’s cloud – we are at the very
beginning