HP OpenView Data Extraction and Reporting Bill Emmett Software Design Engineer HP OpenView...
86
HP OpenView Data Extraction and Reporting Bill Emmett Software Design Engineer HP OpenView Integration Lab Hewlett-Packard Company
-
Upload
miles-price -
Category
Documents
-
view
236 -
download
2
Transcript of HP OpenView Data Extraction and Reporting Bill Emmett Software Design Engineer HP OpenView...
HP OpenView Data Extraction and Reporting
Bill Emmett
Software Design Engineer
HP OpenView Integration Lab
Hewlett-Packard Company
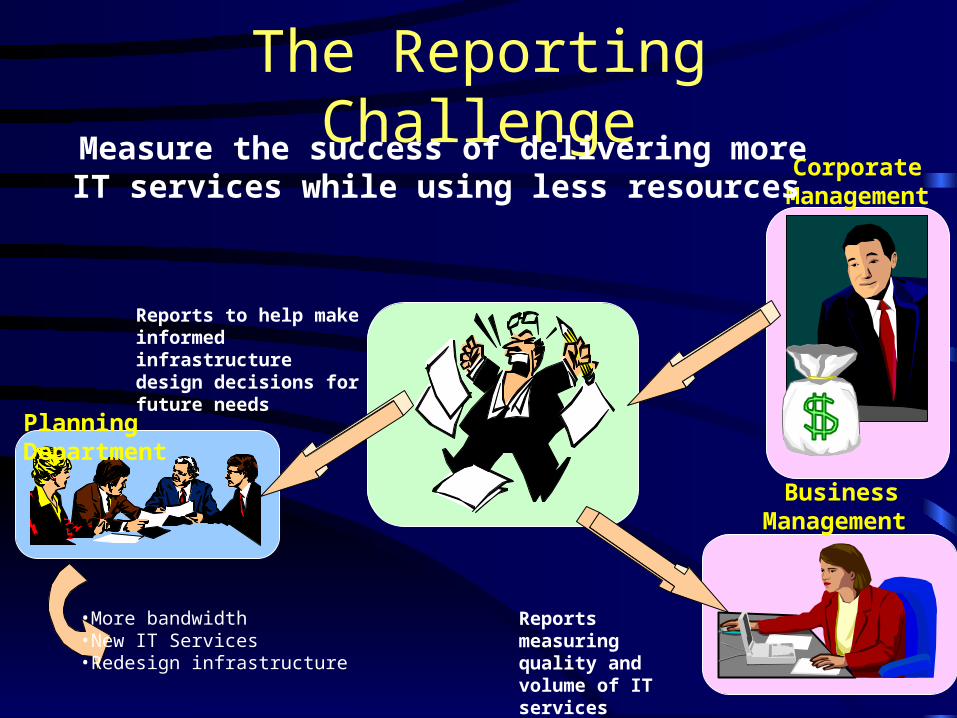
The Reporting Challenge
Reports to help make informed infrastructure design decisions for future needs
Planning Department
Corporate Management
Reports measuringquality and volume of IT services
Business Management
Measure the success of delivering more IT services while using less resources
•More bandwidth•New IT Services•Redesign infrastructure
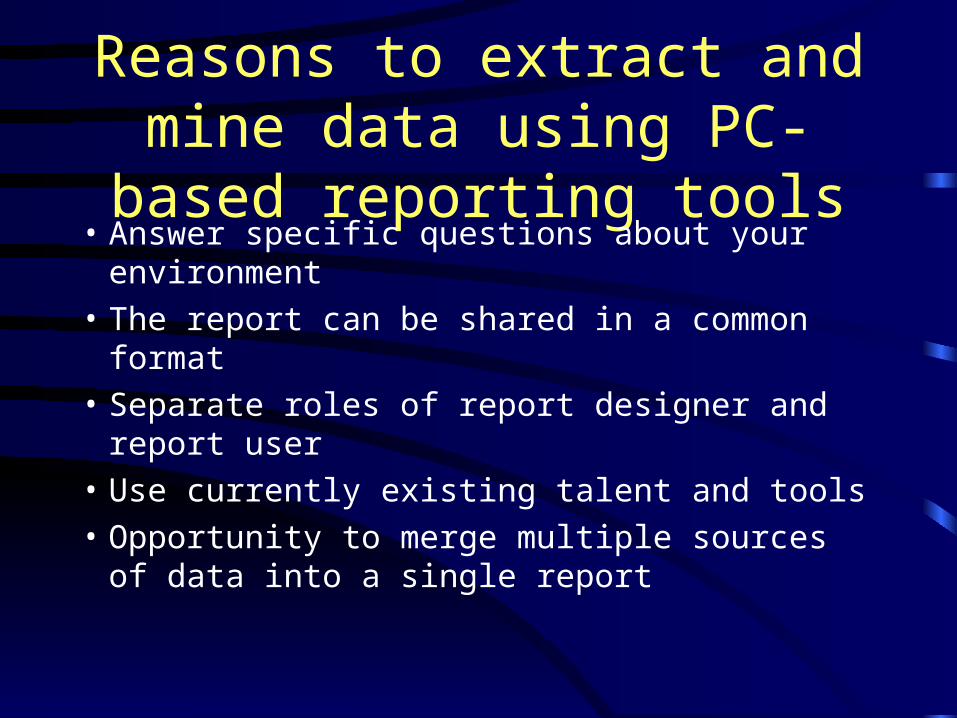
Reasons to extract and mine data using PC-based reporting tools
• Answer specific questions about your environment
• The report can be shared in a common format
• Separate roles of report designer and report user
• Use currently existing talent and tools
• Opportunity to merge multiple sources of data into a single report
Agenda
• Concepts - tools and methods
• HP OpenView product reporting– Network Node Manager– IT/Operations– MeasureWare and PerfView– Service Reporter
• Strategic reporting concepts
Objectives
• Understand why data extraction and reporting is beneficial
• Understand the concepts, tools, and processes involved in HP OpenView data extraction and reporting
• Gain additional insight on the reporting capabilities of NNM, ITO, MeasureWare, PerfView, and Service Reporter
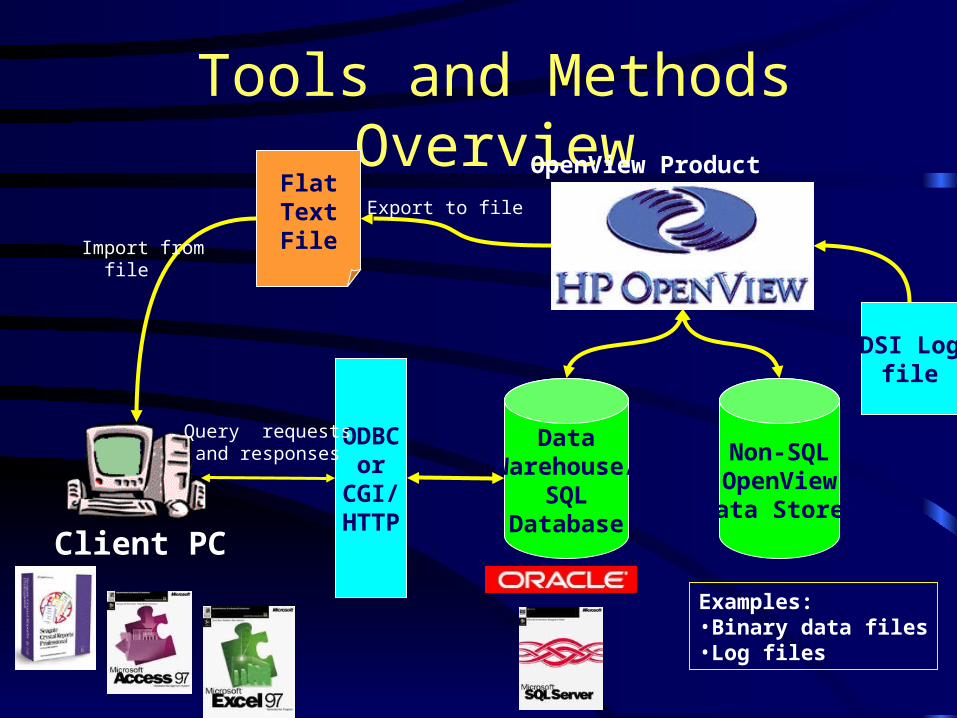
Tools and Methods Overview
Client PC
ODBCor
CGI/HTTP
DataWarehouse/
SQLDatabase
FlatTextFile
Non-SQLOpenViewData Stores
Examples:•Binary data files•Log files
OpenView Product
Export to file
Import from file
Query requestsand responses
DSI Logfile
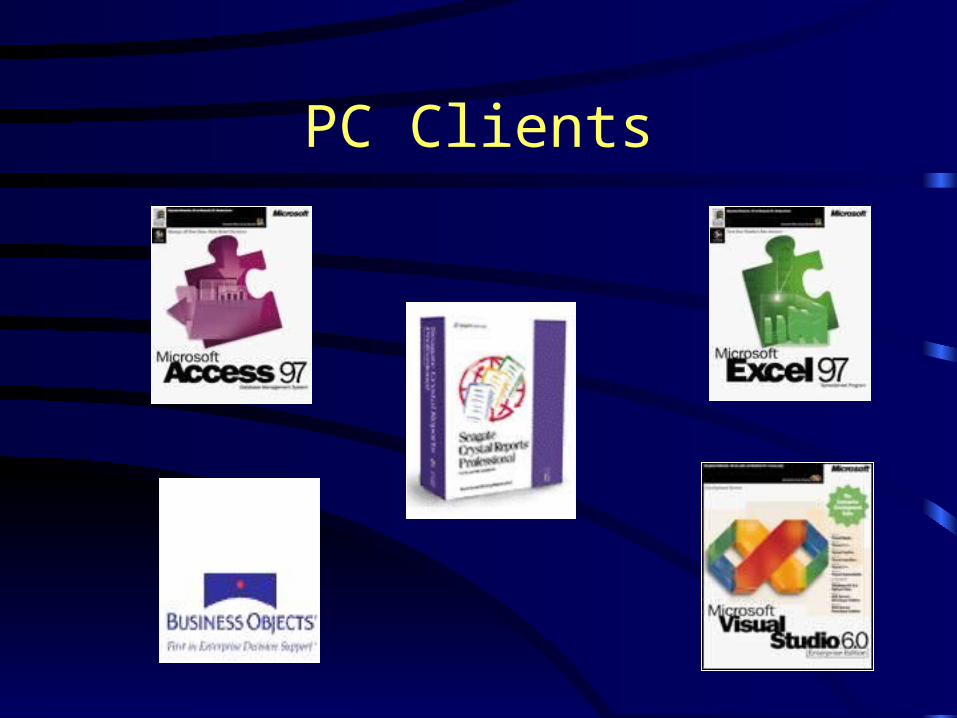
PC Clients
Microsoft Excel97
• Powerful import/export capability
• Run queries against ODBC source and display it in spreadsheet
• Perform statistics analysis, graphing, summarization using spreadsheet functionality
Seagate Crystal Reports• Develop a template once, then
run reports based on a template• Export reports to HTML format• Powerful wizards to generate
SQL queries• Capable of generating many
types of graphs, and formatting data in many ways
Business Objects
• Powerful software which allows users to create ad-hoc and periodic reports
• Administrators can customize Business Objects so that users enter real-world queries, and do not have to use SQL
• Available on NT and Unix platforms
Microsoft Access
• Relational Database Management System (RDBMS) for Windows 95/98/NT platform
• Includes query and reporting capabilities
• Ideal for integrating business and network/system/service management data
Custom Applications
• IT departments build, test, and deploy “homegrown” applications
• Could be developed using MS Visual Studio or one of many other application development environments
• Decouples data from application
SQL databases and ODBC
Oracle RDBMS• Used by IT/Operations and
Network Node Manager• HP OpenView supports Oracle
7 and 8• PC Clients use SQL*NET or
Net8 to access the database across the network
• Considered the most complex of the OV-supported databases
Microsoft SQL Server
• Supported by Network Node Manager and ManageX products
• Version 6.5 is currently supported
• Customers install and perform basic configuration of SQL Server -- HP OpenView creates database once this is performed
Microsoft Access/Jet Database
• Jet database embedded in ManageX and Service Reporter
• Lightweight database -- ideal for staging data for report generation
• Easy to generate your own reports using Microsoft Access
ODBC - Open Database Connectivity
• The bridge between data source and query tool• Used for connecting locally or across the network• Standards based• Much more prevalent on Windows 95/98/NT
platform than on Unix• Data Sources are defined on a system, and users
log in to other databases using these Data Source Names (DSN)
ODBC Issues
• ODBC driver version conflicts
• Using ODBC across the network
• Application behavior and consistency
• Performance, and less “rich” data
HTTP and CGI
• Access to OV databases over the web
• CGI scripts pass SQL queries to the RDBMS and return results to the process/user which invoked the CGI script
• This technology is available in Network Node Manager 6.0
Command-line Executables
• Used to export/extract data from an OV application and process it further
• Often used as input to shell or PERL scripts• Examples include ovtopodump(NNM) and extract
(MeasureWare)
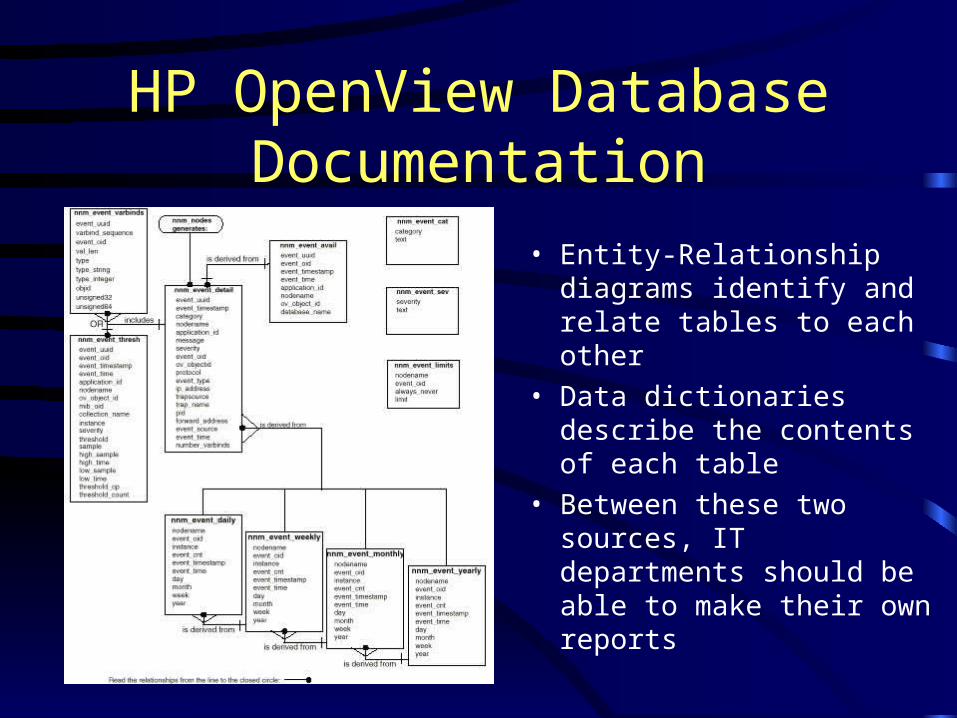
HP OpenView Database Documentation
• Entity-Relationship diagrams identify and relate tables to each other
• Data dictionaries describe the contents of each table
• Between these two sources, IT departments should be able to make their own reports
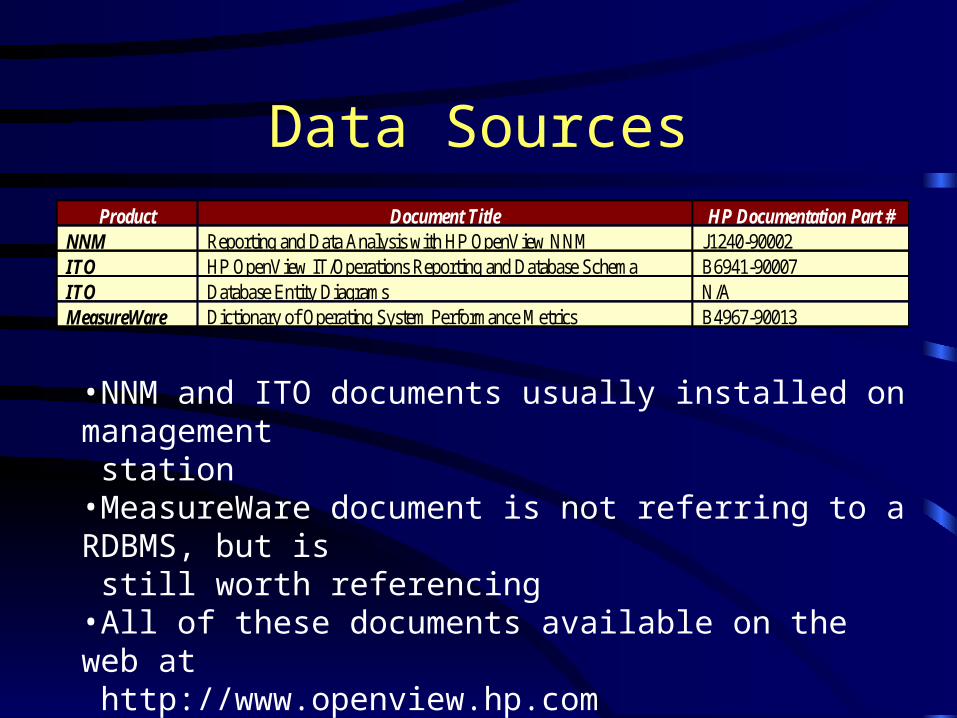
Data SourcesProduct Document Title HP Documentation Part #
NNM Reporting and Data Analysis with HP OpenView NNM J1240-90002ITO HP OpenView IT/Operations Reporting and Database Schema B6941-90007ITO Database Entity Diagrams N/AMeasureWare Dictionary of Operating System Performance Metrics B4967-90013
•NNM and ITO documents usually installed on management station•MeasureWare document is not referring to a RDBMS, but is still worth referencing•All of these documents available on the web at http://www.openview.hp.com
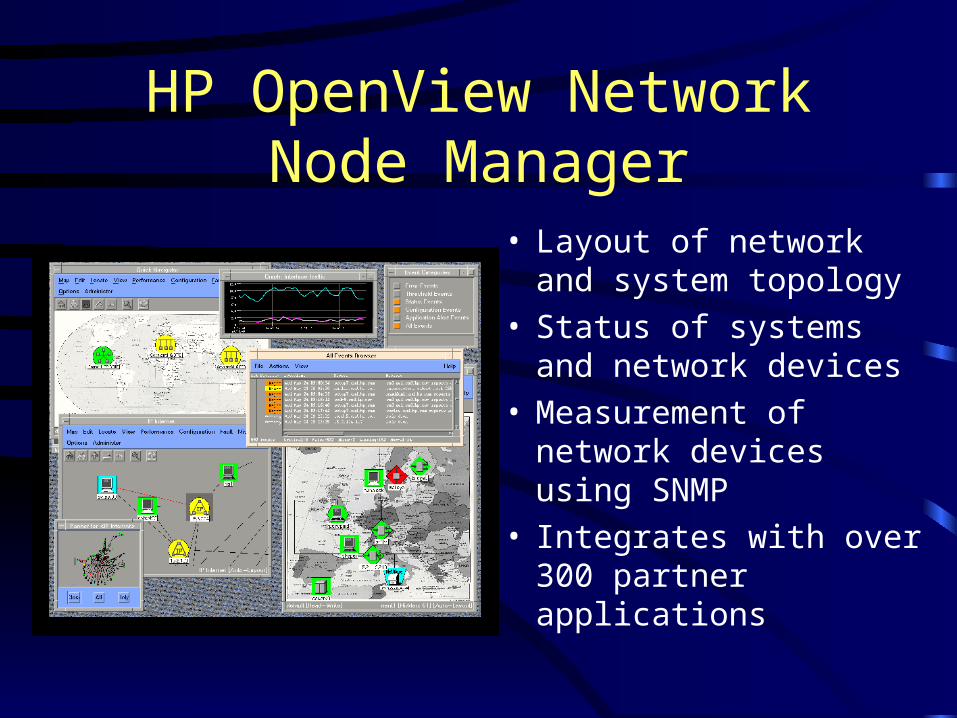
HP OpenView Network Node Manager
• Layout of network and system topology
• Status of systems and network devices
• Measurement of network devices using SNMP
• Integrates with over 300 partner applications
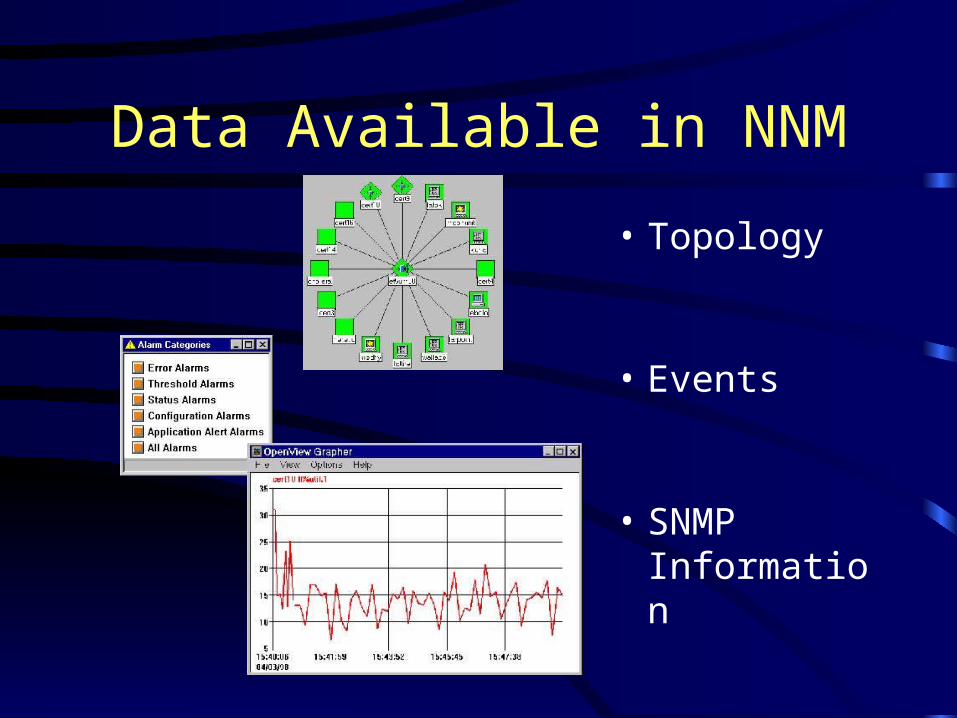
Data Available in NNM
• Topology
• Events
• SNMP Information
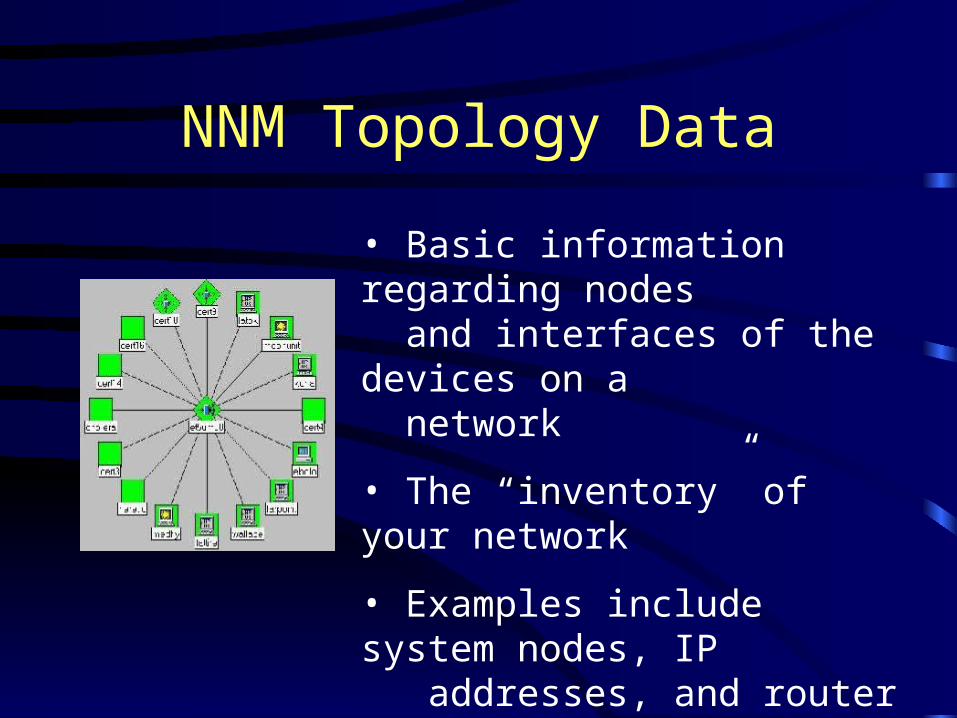
NNM Topology Data
• Basic information regarding nodes
and interfaces of the devices on a network
• The “inventory” of your network
• Examples include system nodes, IP
addresses, and router interface information
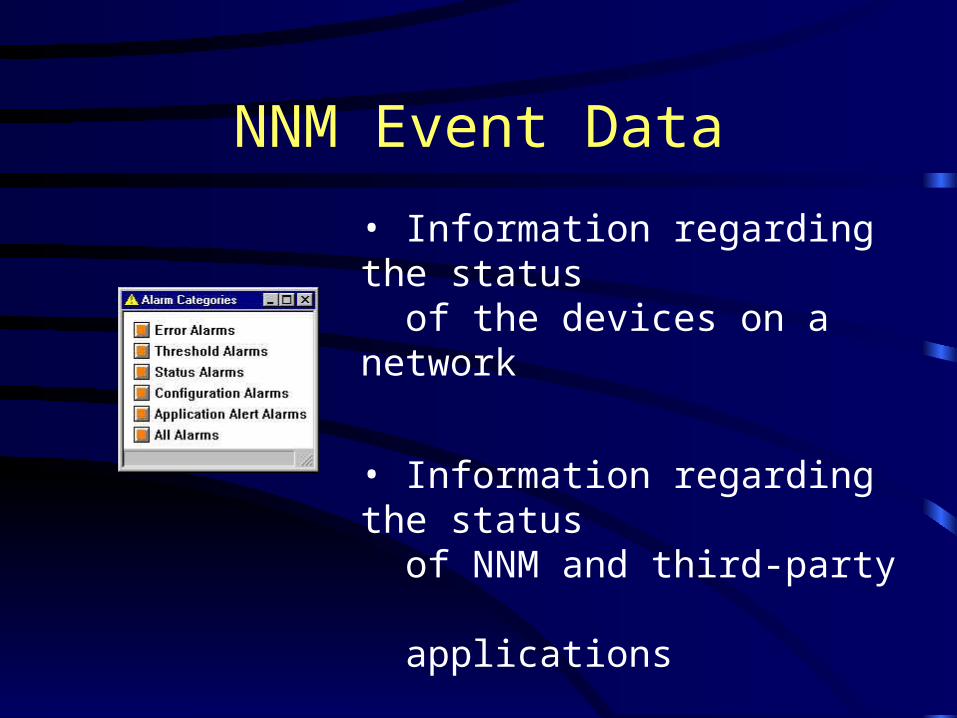
NNM Event Data
• Information regarding the status of the devices on a network
• Information regarding the status of NNM and third-party applications
• Information regarding threshold violations based on SNMP-based data
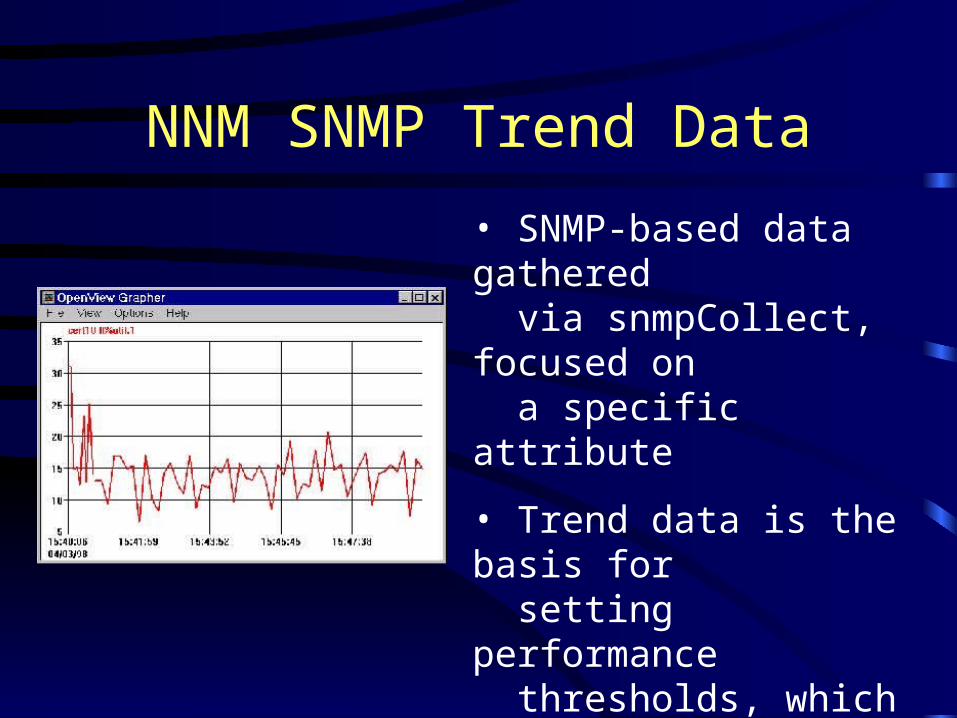
NNM SNMP Trend Data
• SNMP-based data gathered via snmpCollect, focused on a specific attribute
• Trend data is the basis for setting performance thresholds, which generate events when exceeded
• Examples include %Interface Utilization and network collisions
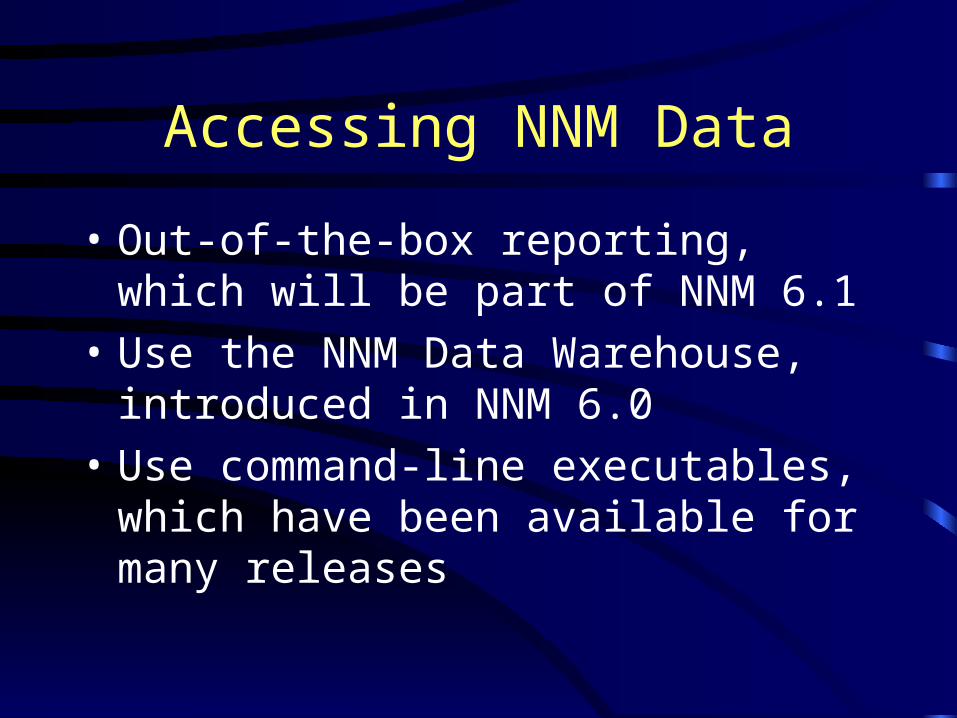
Accessing NNM Data
• Out-of-the-box reporting, which will be part of NNM 6.1
• Use the NNM Data Warehouse, introduced in NNM 6.0
• Use command-line executables, which have been available for many releases
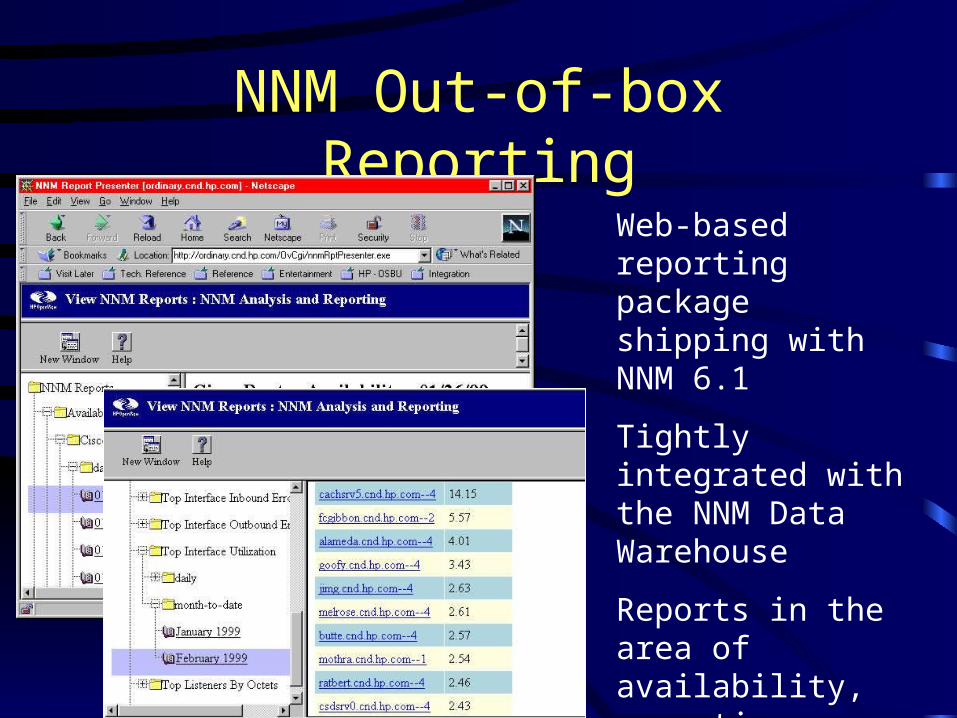
NNM Out-of-box Reporting
Web-based reporting package shipping with NNM 6.1
Tightly integrated with the NNM Data Warehouse
Reports in the area of availability, exception, inventory, and performance
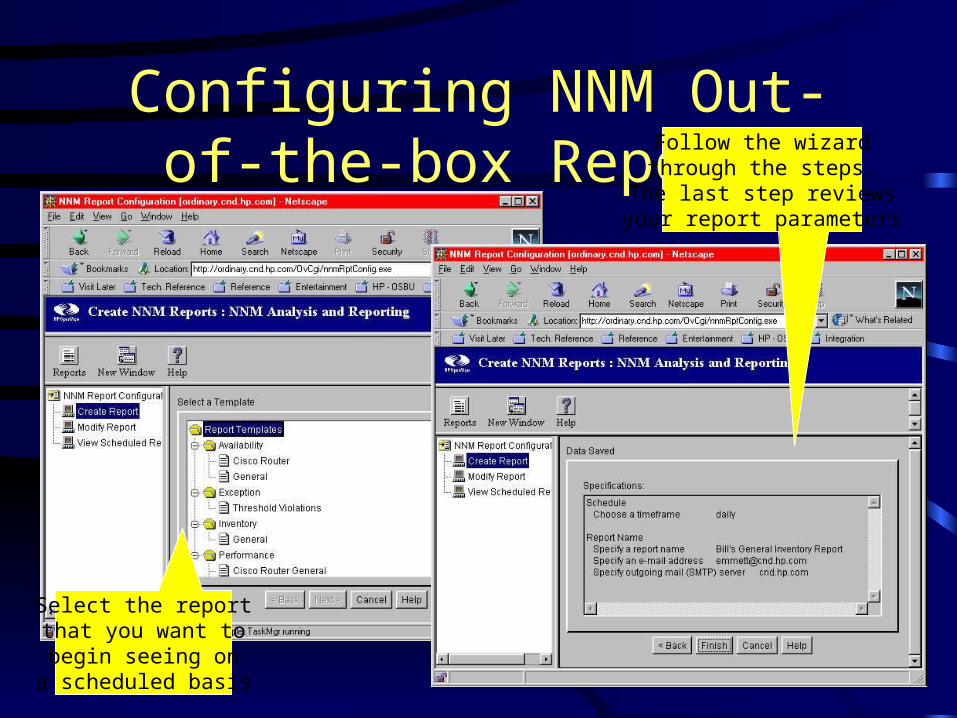
Configuring NNM Out-of-the-box Reports
Select the reportthat you want tobegin seeing on
a scheduled basis
Follow the wizardthrough the steps.
The last step reviewsyour report parameters
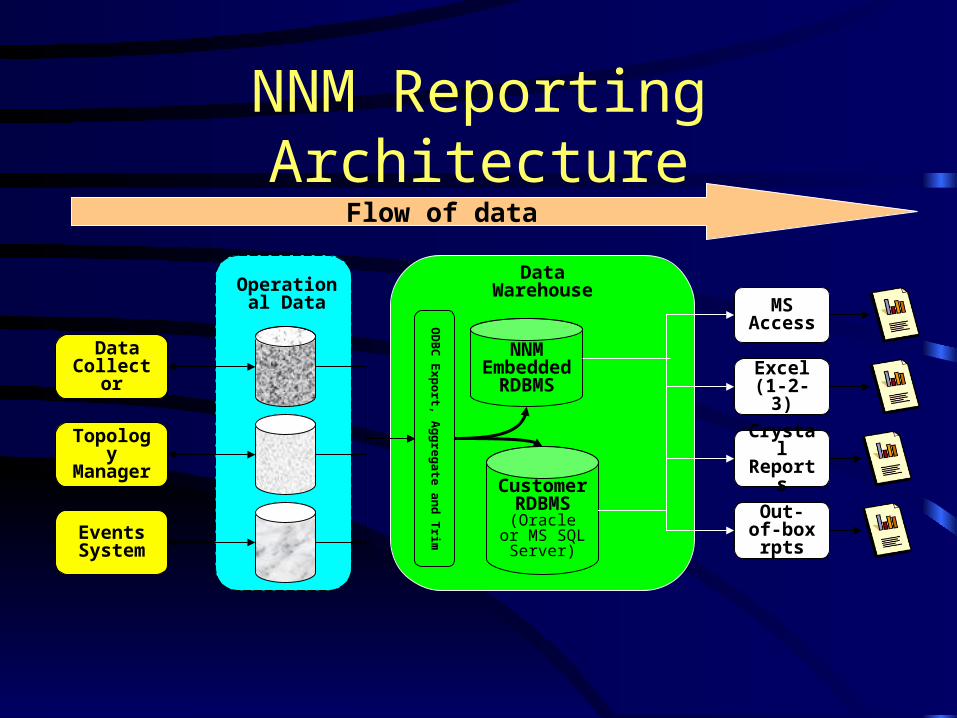
NNM Reporting Architecture
Data Warehouse
OD
BC
Exp
ort, Aggregate an
d T
rim
NNM Embedded
RDBMS
Customer RDBMS
(Oracle or MS SQL Server)
Data Collector
Topology Manager
Events System
Operational Data
Crystal Reports
Excel(1-2-3)
Out-of-box rpts
MS Access
Flow of data
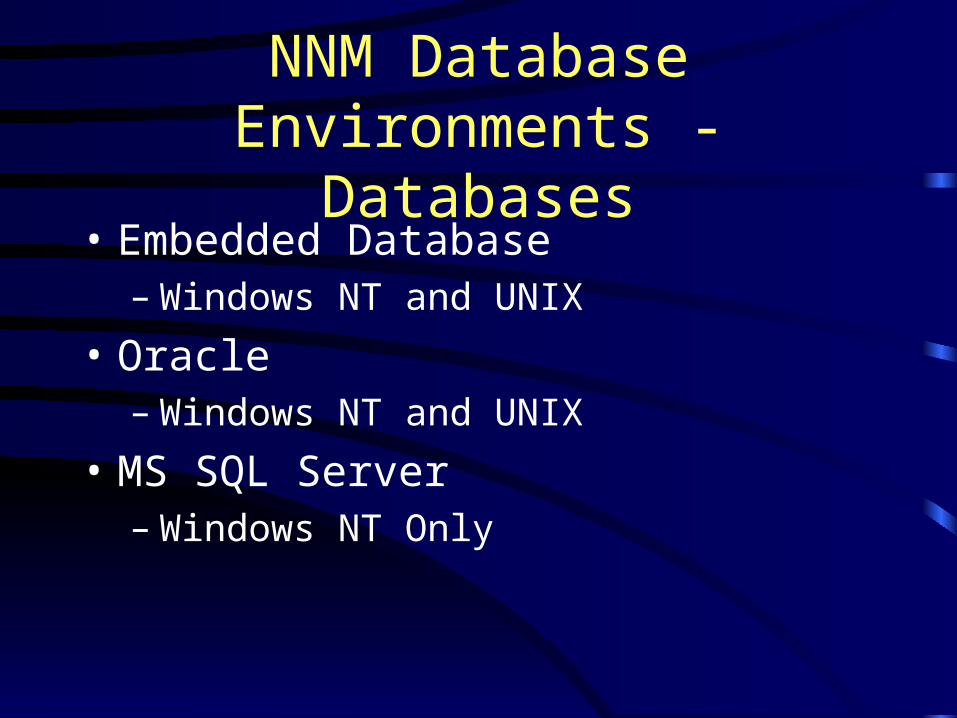
NNM Database Environments - Databases
• Embedded Database– Windows NT and UNIX
• Oracle– Windows NT and UNIX
• MS SQL Server– Windows NT Only
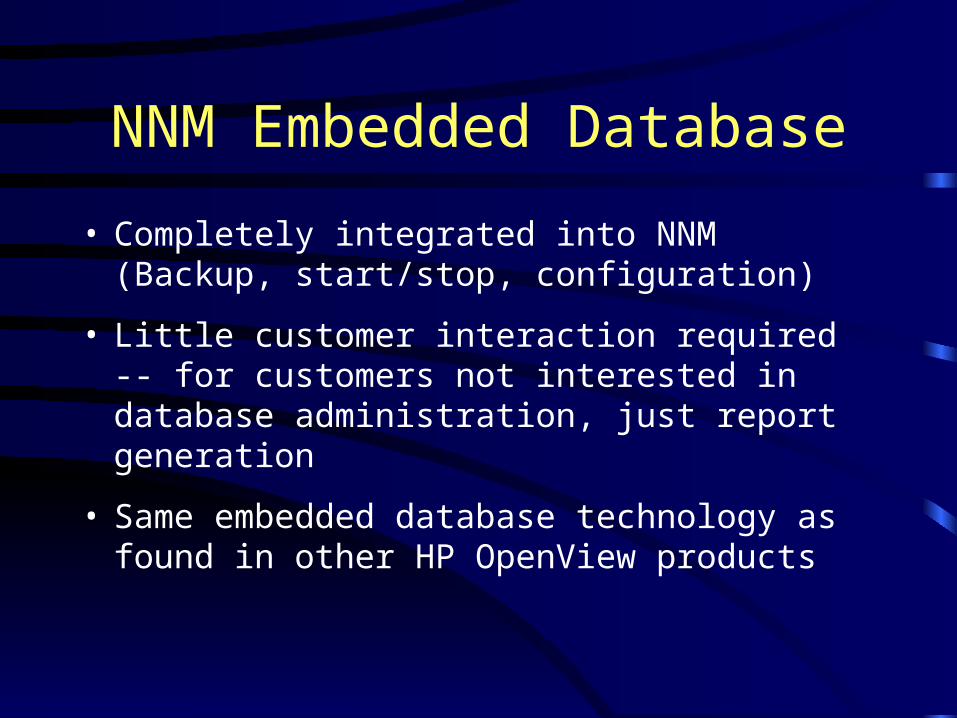
NNM Embedded Database
• Completely integrated into NNM (Backup, start/stop, configuration)
• Little customer interaction required -- for customers not interested in database administration, just report generation
• Same embedded database technology as found in other HP OpenView products
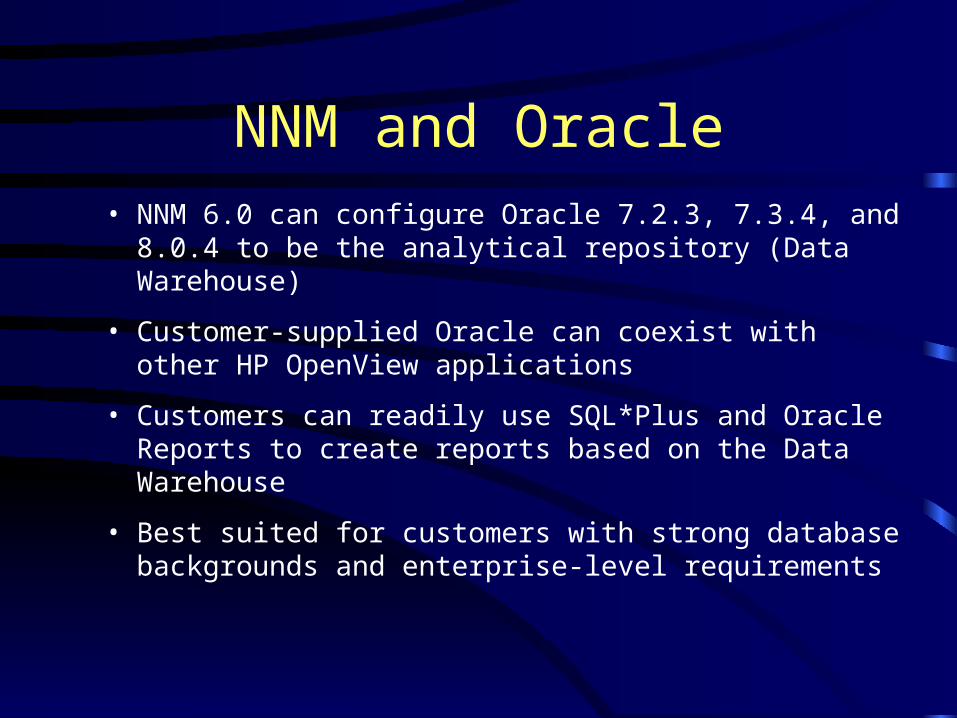
NNM and Oracle• NNM 6.0 can configure Oracle 7.2.3, 7.3.4, and 8.0.4 to be
the analytical repository (Data Warehouse)
• Customer-supplied Oracle can coexist with other HP OpenView applications
• Customers can readily use SQL*Plus and Oracle Reports to create reports based on the Data Warehouse
• Best suited for customers with strong database backgrounds and enterprise-level requirements
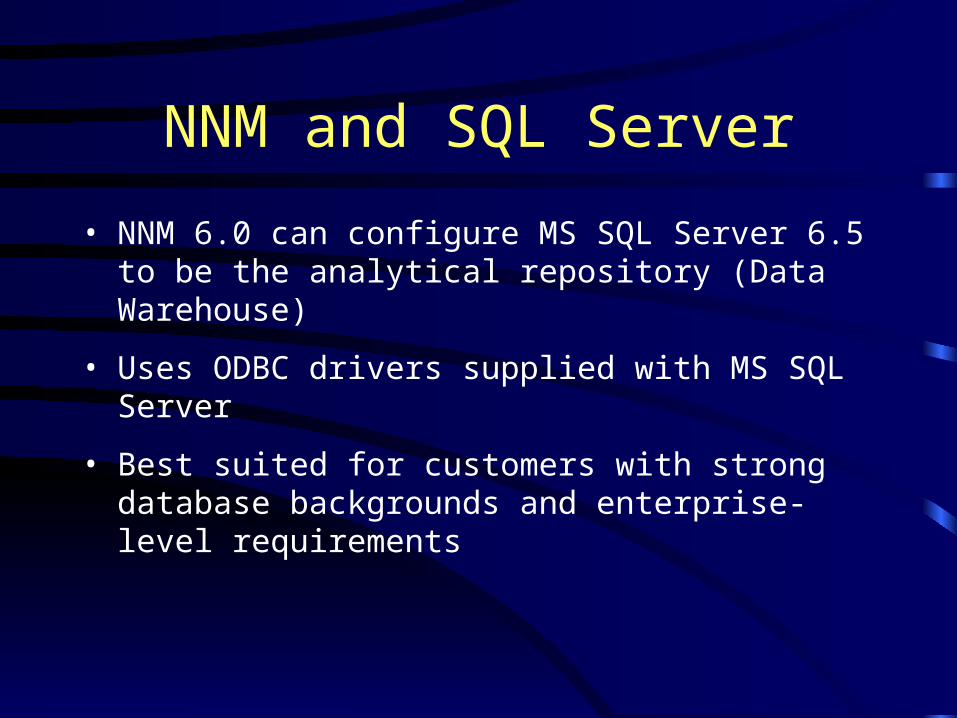
NNM and SQL Server
• NNM 6.0 can configure MS SQL Server 6.5 to be the analytical repository (Data Warehouse)
• Uses ODBC drivers supplied with MS SQL Server
• Best suited for customers with strong database backgrounds and enterprise-level requirements
NNM Interfaces - ODBC
• ODBC acts as the “bridge” between the Data Warehouse and the reporting tool
• ODBC is pervasive in NT environments, but is much less common in Unix environments
• The NNM Data Warehouse supports ODBC drivers from database vendors on Windows NT
• NNM 6.0 supplies the ODBC environment on UNIX
NNM Interfaces - ovwebdata
• CGI program running on a web server that passes SQL commands from the client to the Data Warehouse and returns the results of that query to the user
• Underlying technology used in Excel97 contrib templates
• Possible interface for customers who want to write web-based tools to retrieve data from the NNM Data Warehouse
• Currently, this interface is not documented
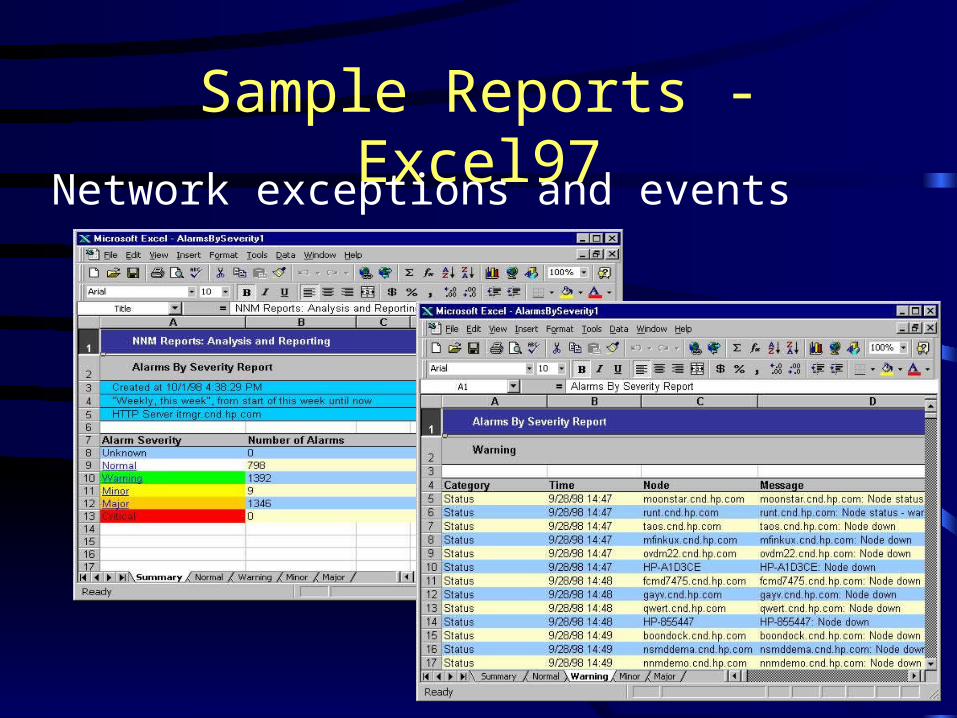
Sample Reports - Excel97Network exceptions and events
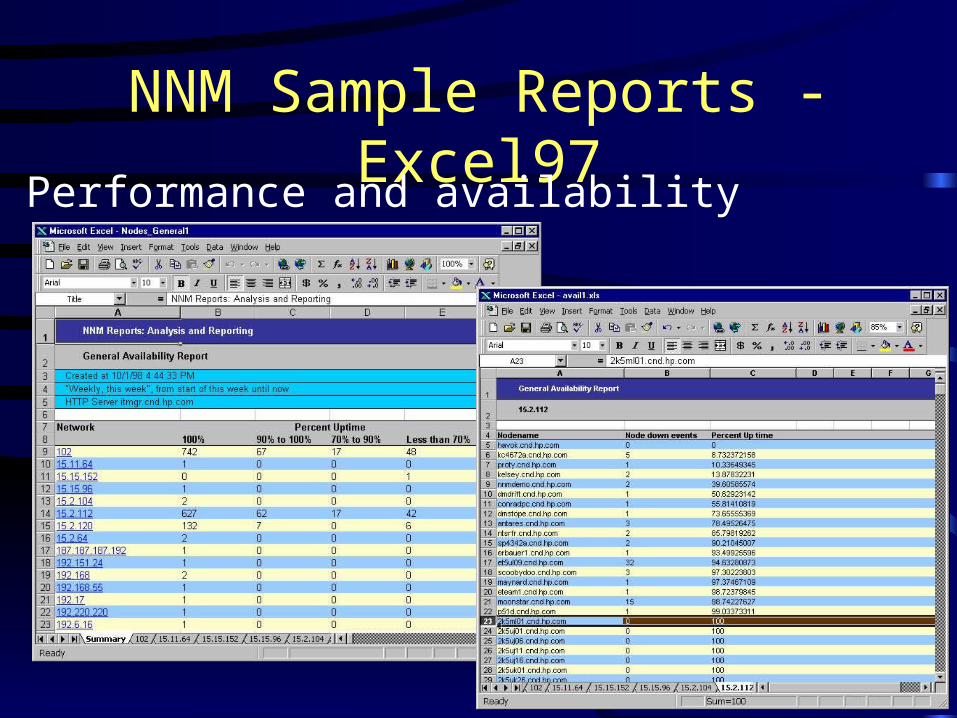
NNM Sample Reports - Excel97Performance and availability
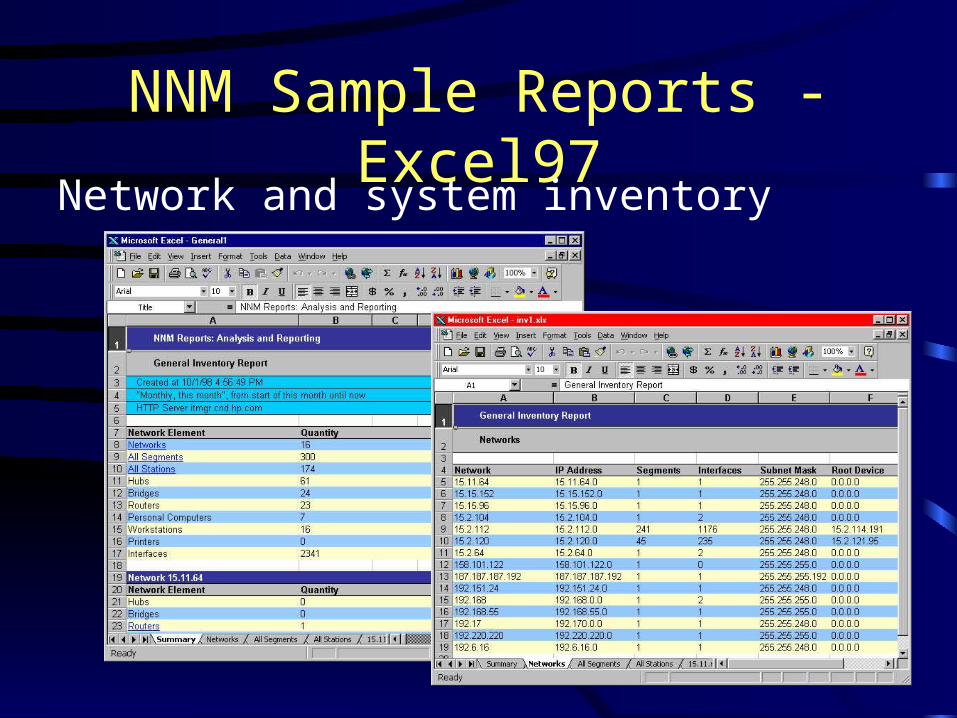
NNM Sample Reports - Excel97Network and system inventory
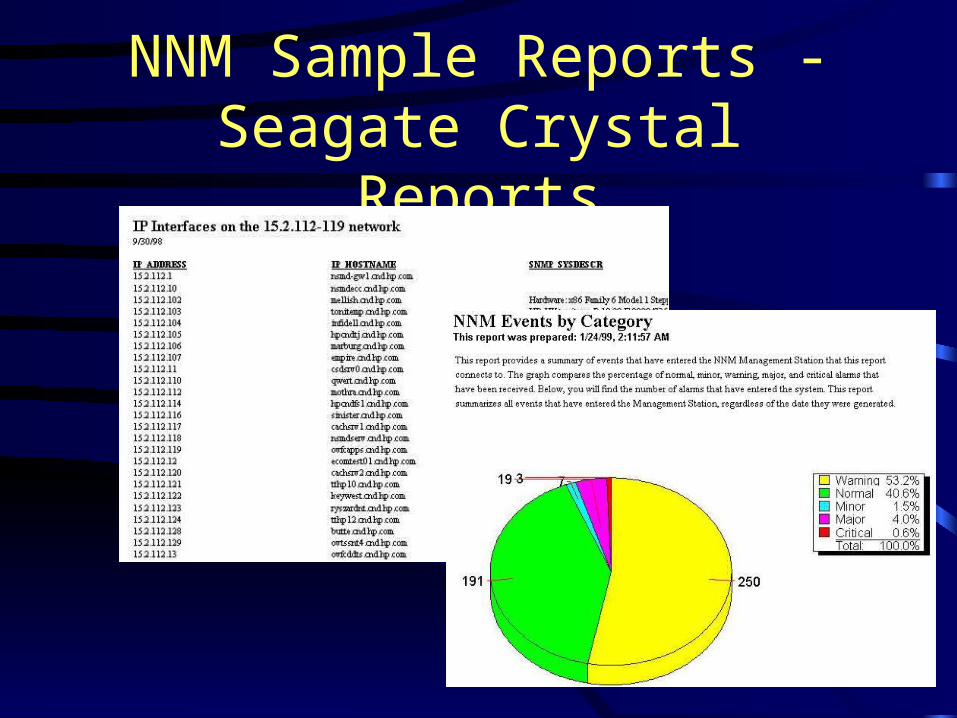
NNM Sample Reports - Seagate Crystal Reports
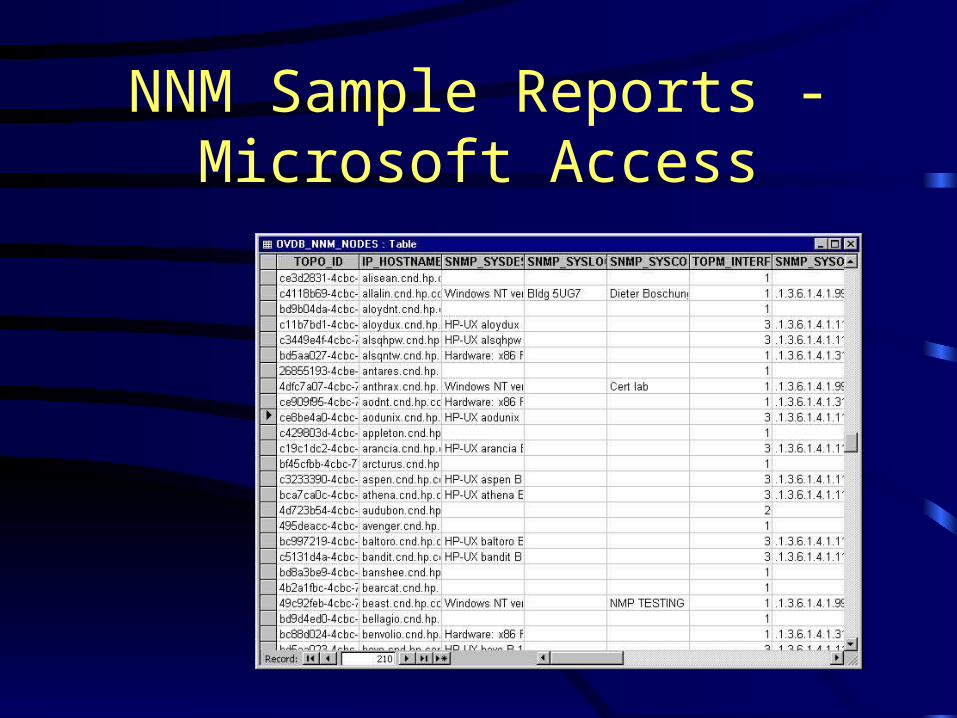
NNM Sample Reports - Microsoft Access
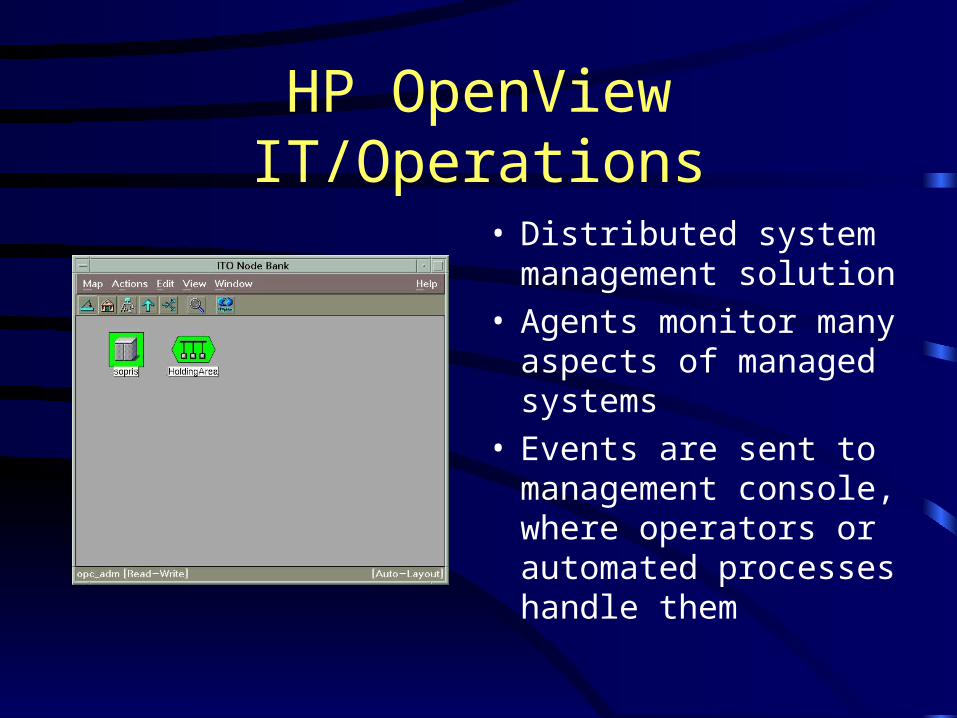
HP OpenView IT/Operations
• Distributed system management solution
• Agents monitor many aspects of managed systems
• Events are sent to management console, where operators or automated processes handle them
Data Available in ITO
• Many types of events, originating from many sources
• Status of managed nodes
• Information regarding ITO operators and administrators
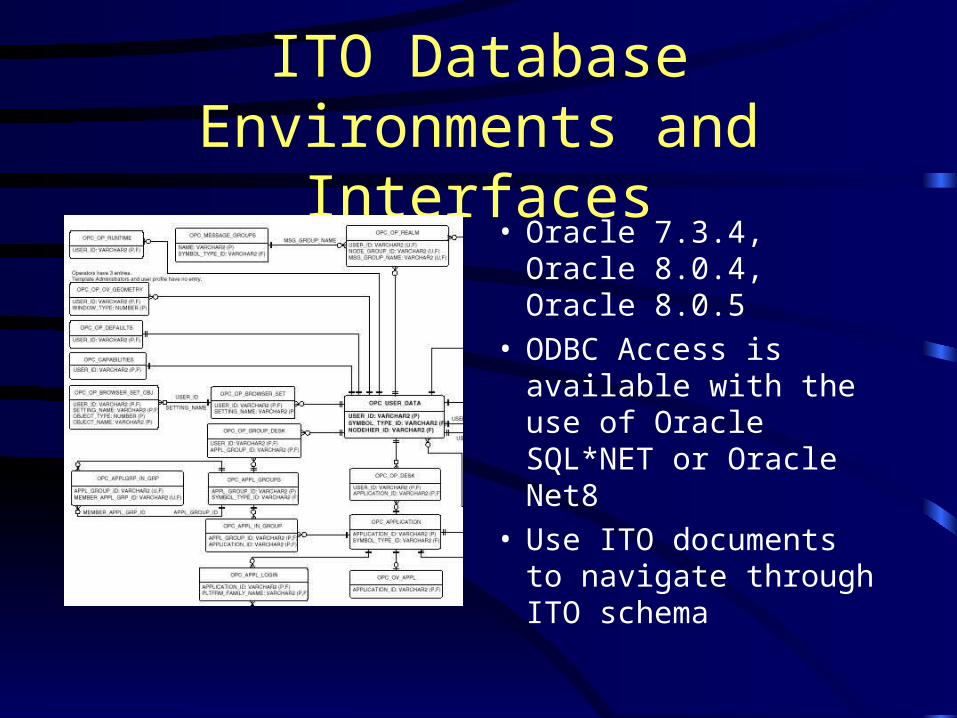
ITO Database Environments and Interfaces
• Oracle 7.3.4, Oracle 8.0.4, Oracle 8.0.5
• ODBC Access is available with the use of Oracle SQL*NET or Oracle Net8
• Use ITO documents to navigate through ITO schema
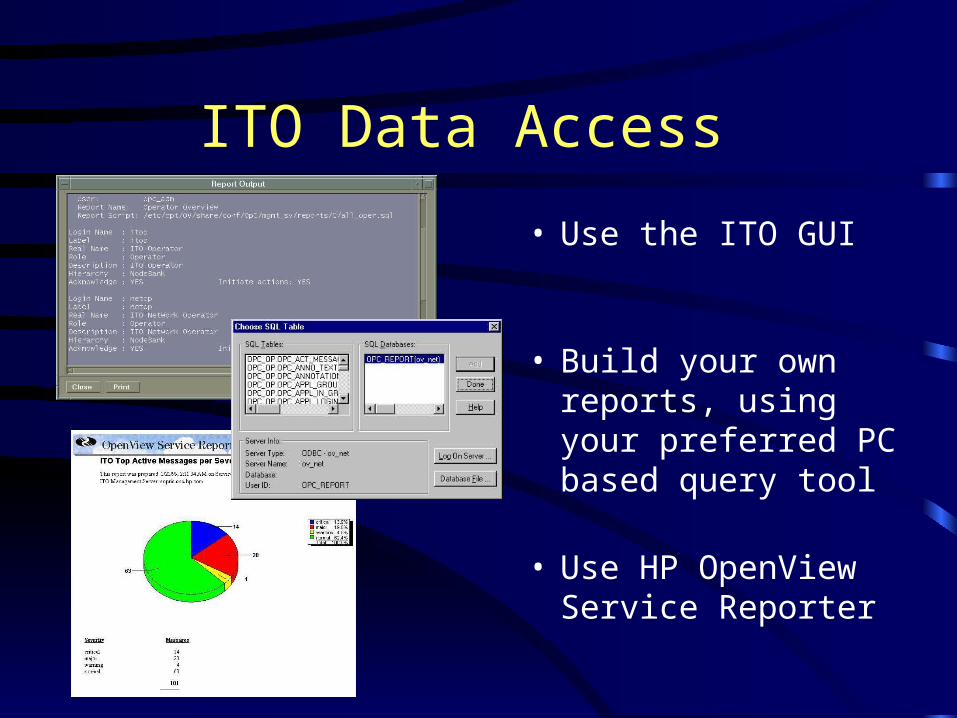
ITO Data Access
• Use the ITO GUI
• Build your own reports, using your preferred PC based query tool
• Use HP OpenView Service Reporter
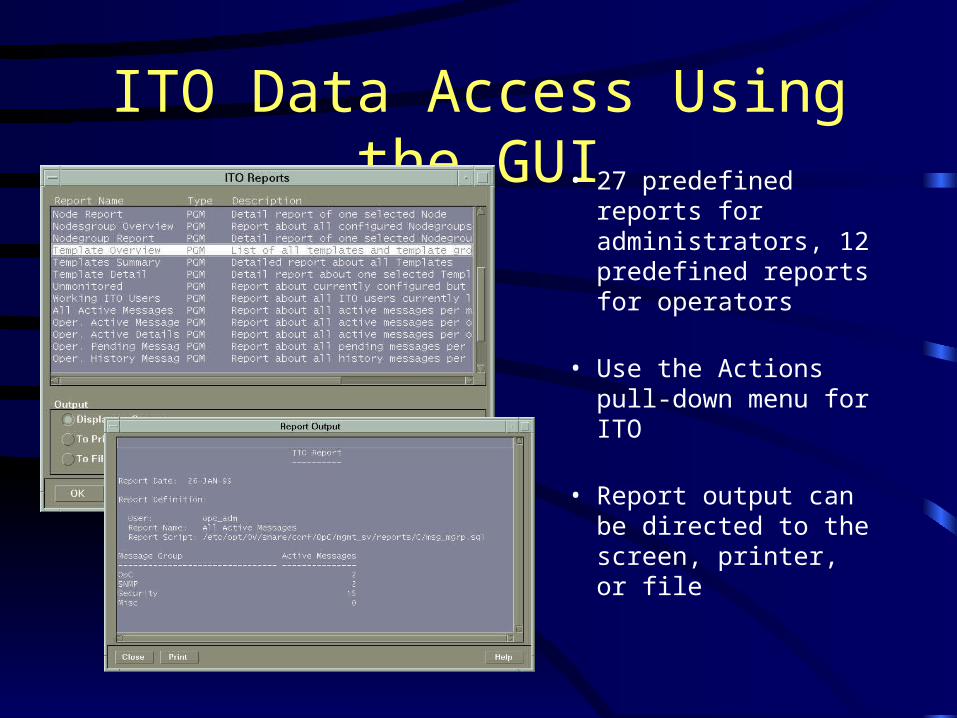
ITO Data Access Using the GUI• 27 predefined reports
for administrators, 12 predefined reports for operators
• Use the Actions pull-down menu for ITO
• Report output can be directed to the screen, printer, or file
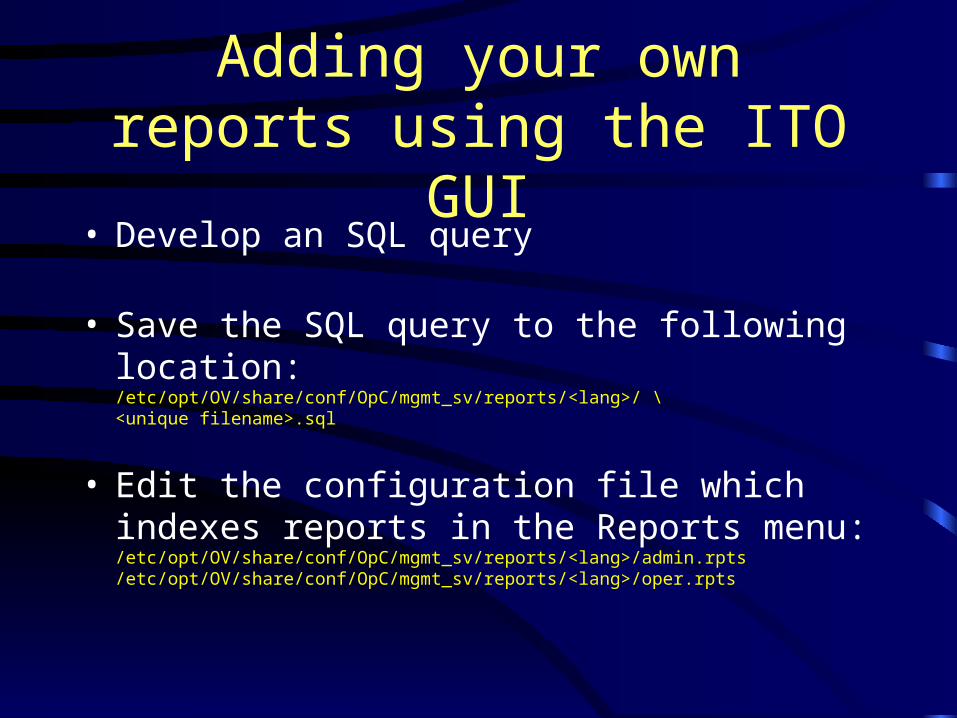
Adding your own reports using the ITO GUI
• Develop an SQL query
• Save the SQL query to the following location:/etc/opt/OV/share/conf/OpC/mgmt_sv/reports/<lang>/ \<unique filename>.sql
• Edit the configuration file which indexes reports in the Reports menu:/etc/opt/OV/share/conf/OpC/mgmt_sv/reports/<lang>/admin.rpts/etc/opt/OV/share/conf/OpC/mgmt_sv/reports/<lang>/oper.rpts
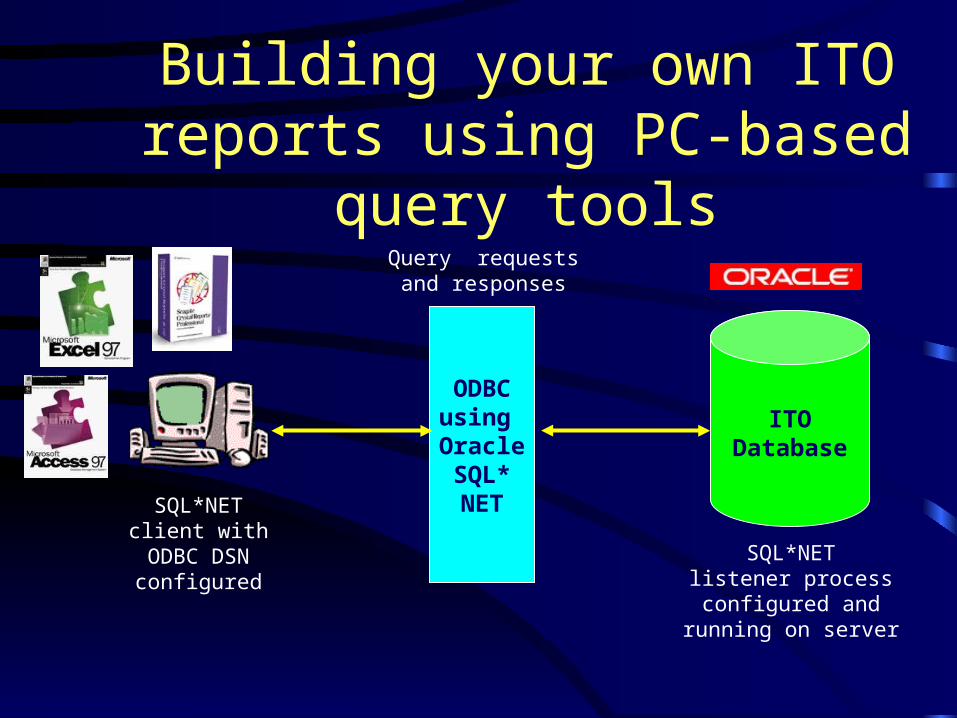
Building your own ITO reports using PC-based query tools
ODBCusing OracleSQL*NET
ITODatabase
Query requestsand responses
SQL*NETclient with
ODBC DSNconfigured
SQL*NETlistener processconfigured and
running on server
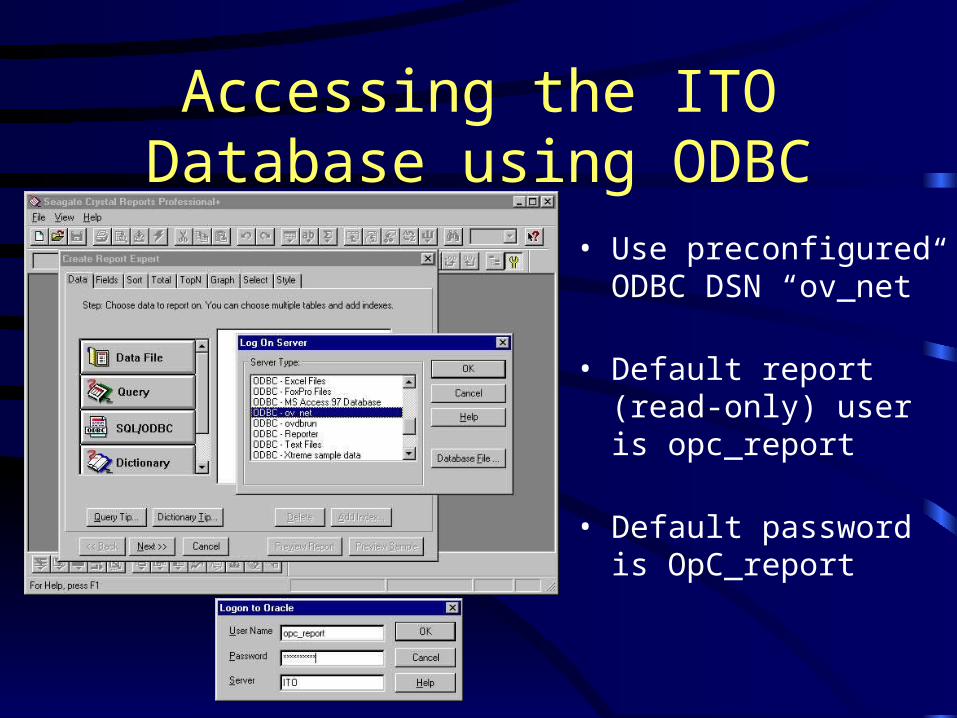
Accessing the ITO Database using ODBC
• Use preconfigured ODBC DSN “ov_net”
• Default report (read-only) user is opc_report
• Default password is OpC_report
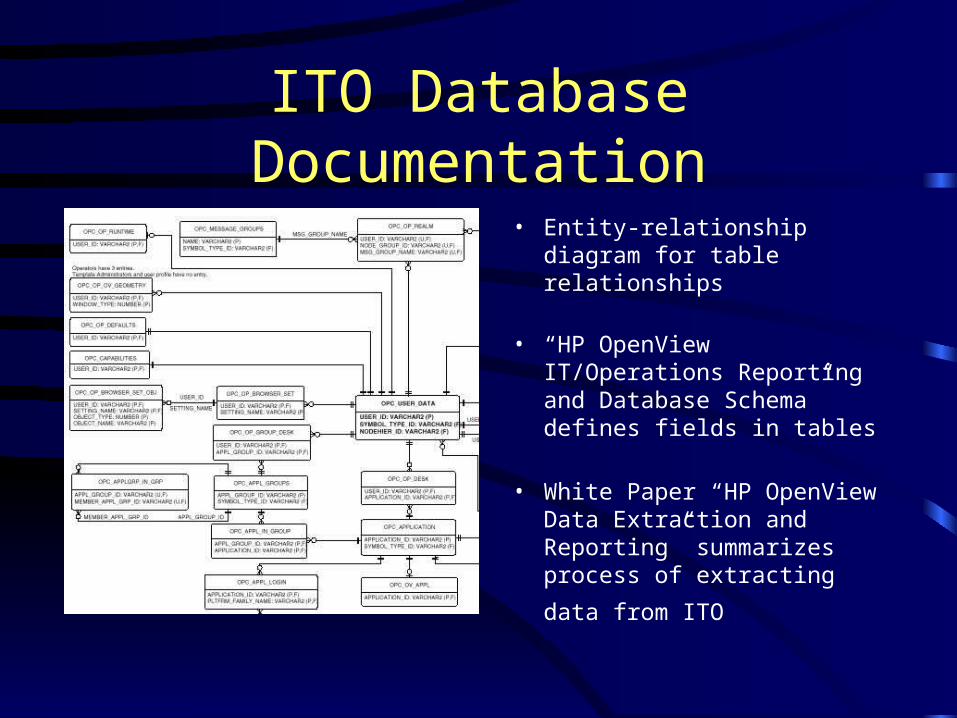
ITO Database Documentation
• Entity-relationship diagram for table relationships
• “HP OpenView IT/Operations Reporting and Database Schema” defines fields in tables
• White Paper “HP OpenView Data Extraction and Reporting” summarizes process of
extracting data from ITO
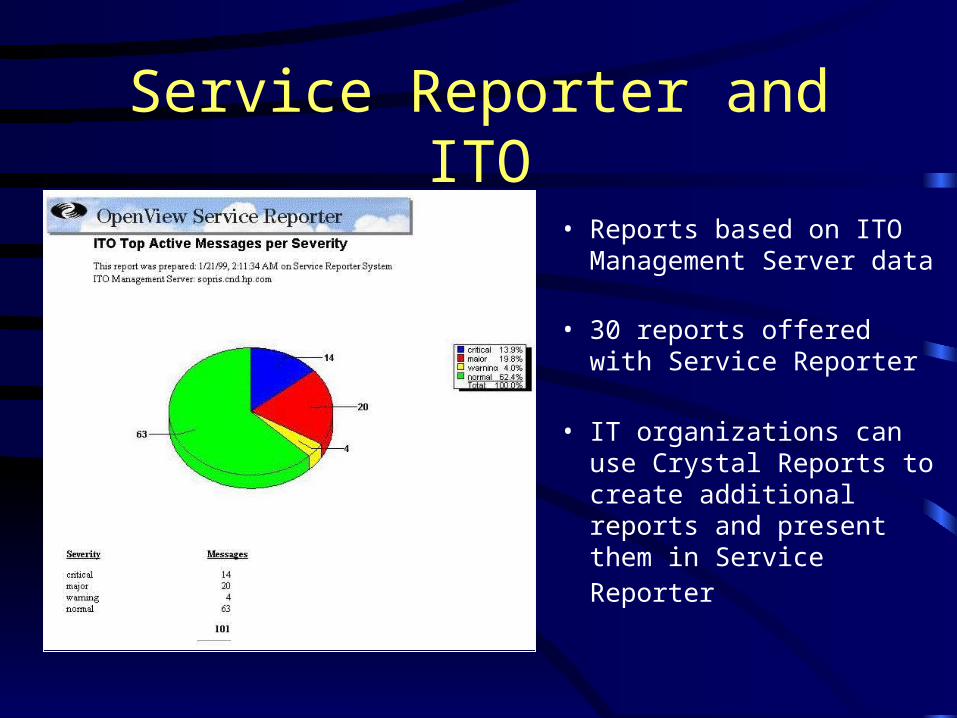
Service Reporter and ITO
• Reports based on ITO Management Server data
• 30 reports offered with Service Reporter
• IT organizations can use Crystal Reports to create additional reports and present them in Service Reporter
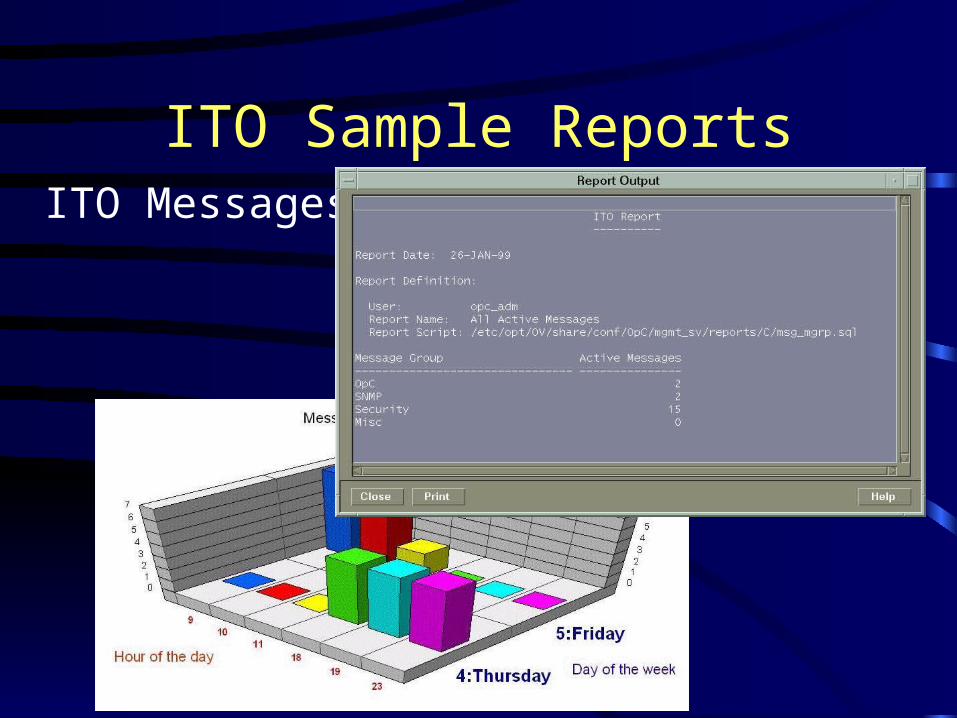
ITO Sample ReportsITO Messages
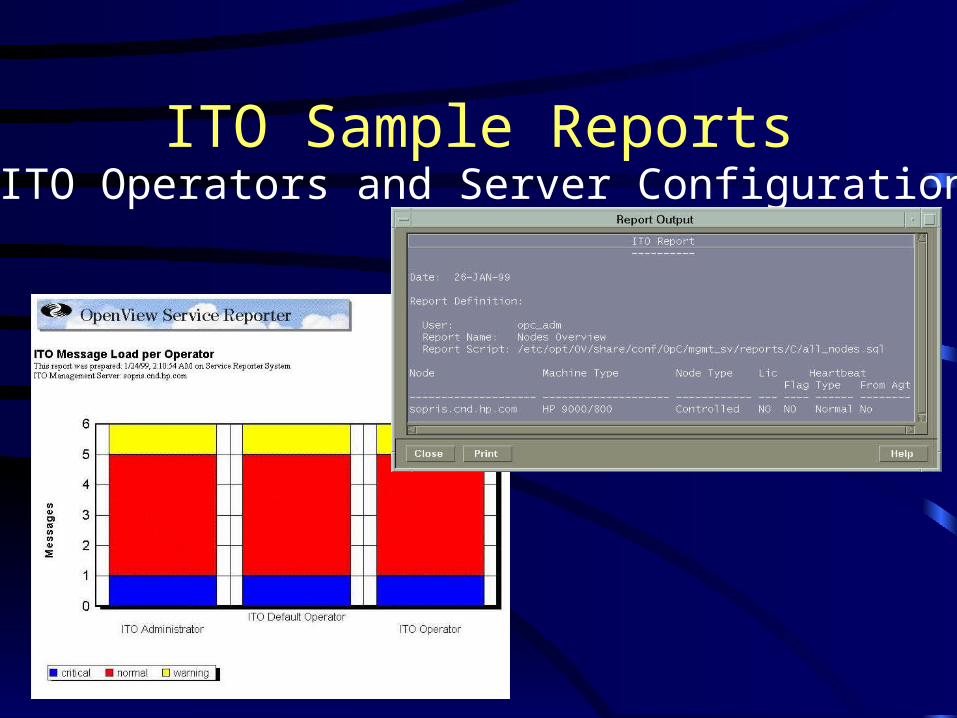
ITO Sample ReportsITO Operators and Server Configuration
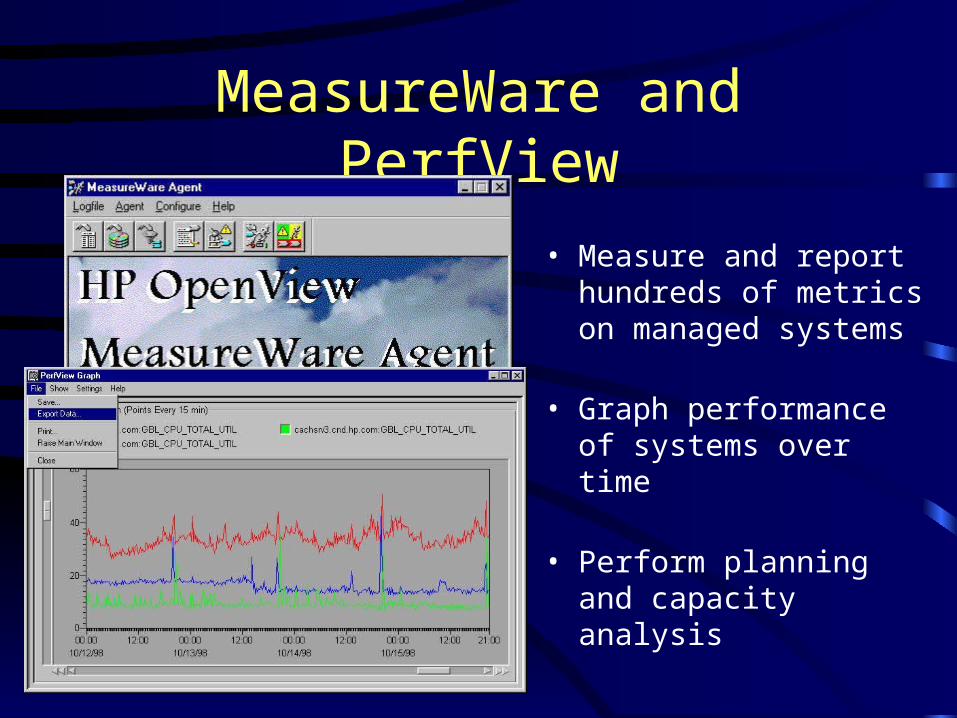
MeasureWare and PerfView
• Measure and report hundreds of metrics on managed systems
• Graph performance of systems over time
• Perform planning and capacity analysis
Performance Data
• Based on data collected by MeasureWare agents, which reside on managed machines
• Data includes CPU performance, memory utilization, network utilization, and many other areas
• “Dictionary of Operating System Performance Metrics” has details regarding metrics that are available on each platform
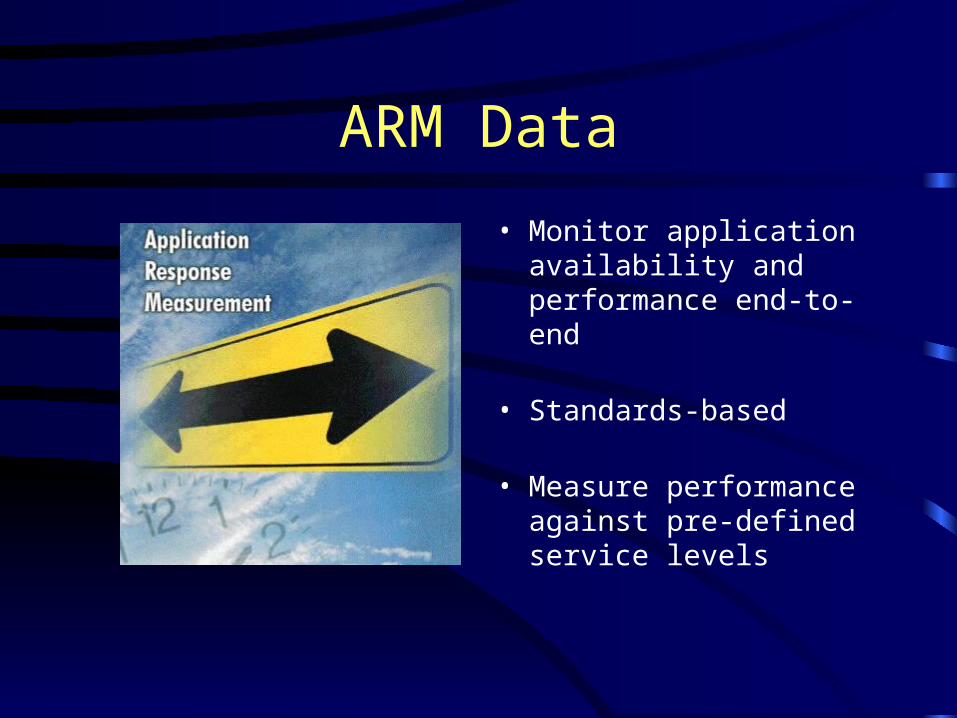
ARM Data
• Monitor application availability and performance end-to-end
• Standards-based
• Measure performance against pre-defined service levels
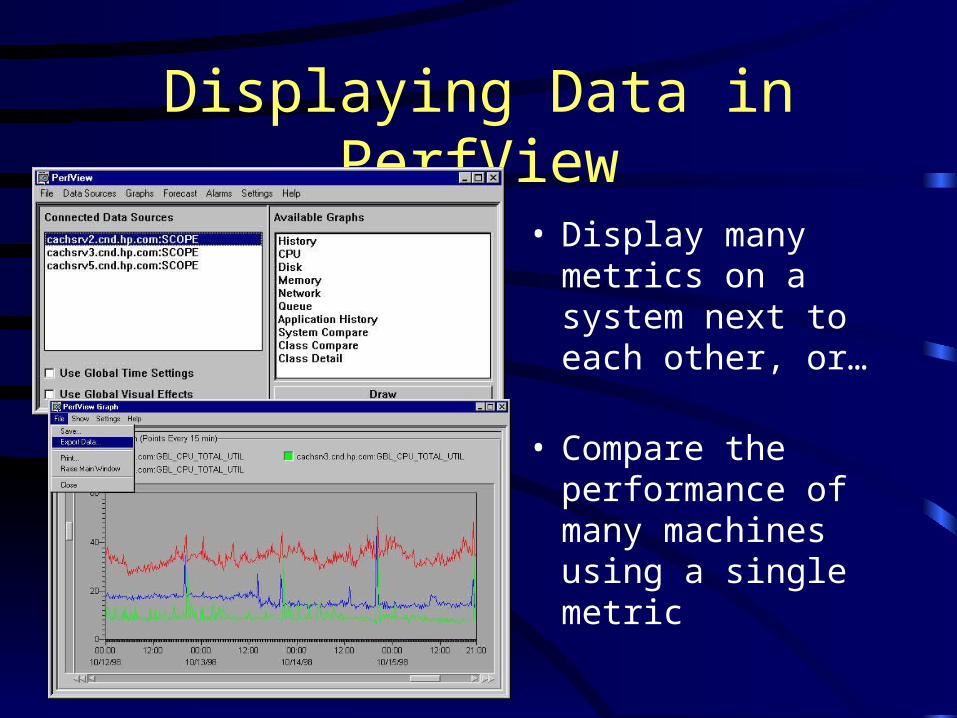
Displaying Data in PerfView
• Display many metrics on a system next to each other, or…
• Compare the performance of many machines using a single metric
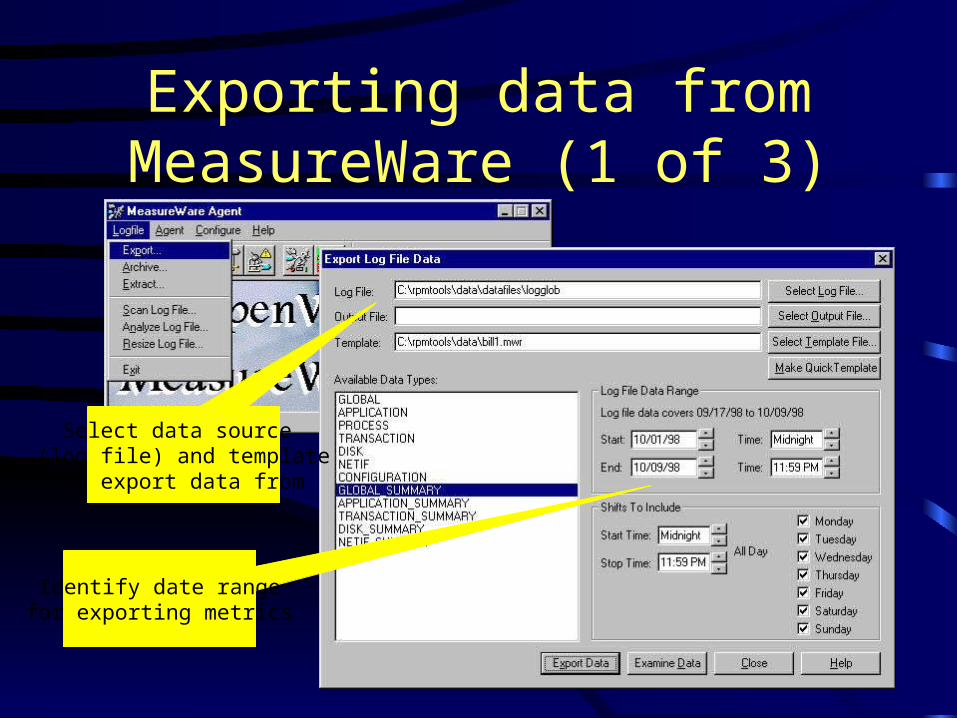
Exporting data from MeasureWare (1 of 3)
Select data source (log file) and template
to export data from
Identify date rangefor exporting metrics
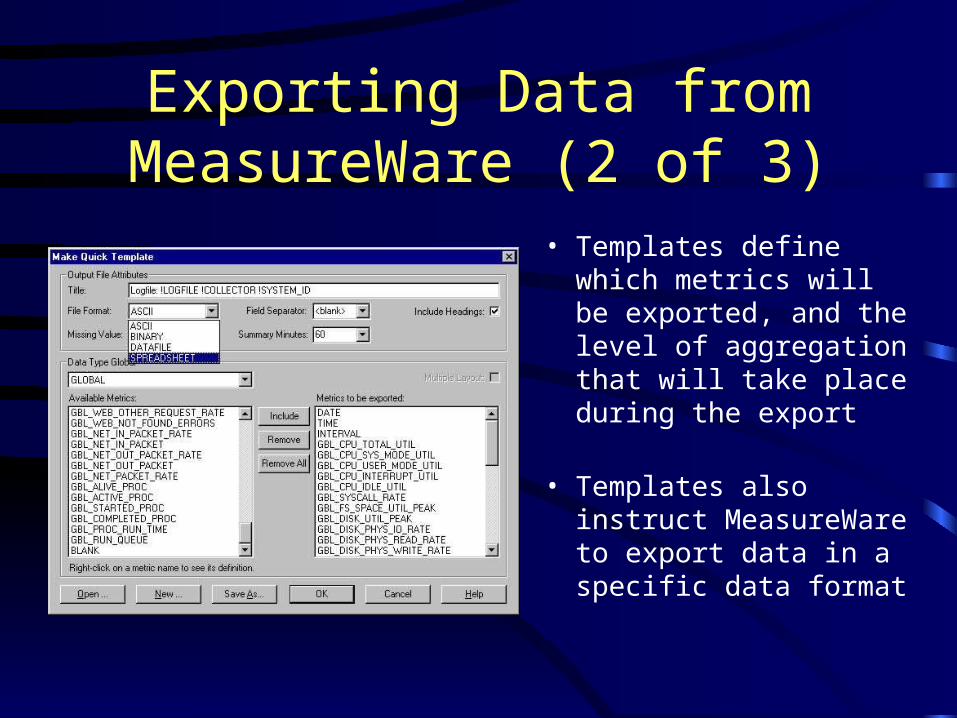
Exporting Data from MeasureWare (2 of 3)
• Templates define which metrics will be exported, and the level of aggregation that will take place during the export
• Templates also instruct MeasureWare to export data in a specific data format
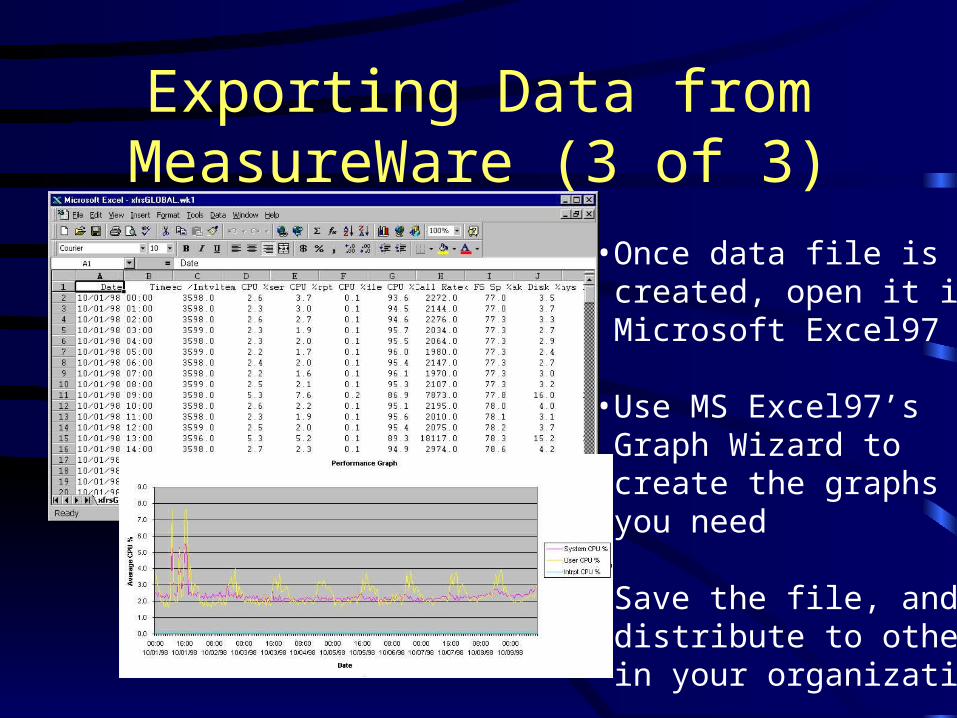
Exporting Data from MeasureWare (3 of 3)
•Once data file is created, open it in Microsoft Excel97
•Use MS Excel97’s Graph Wizard to create the graphs you need
•Save the file, and distribute to others in your organization
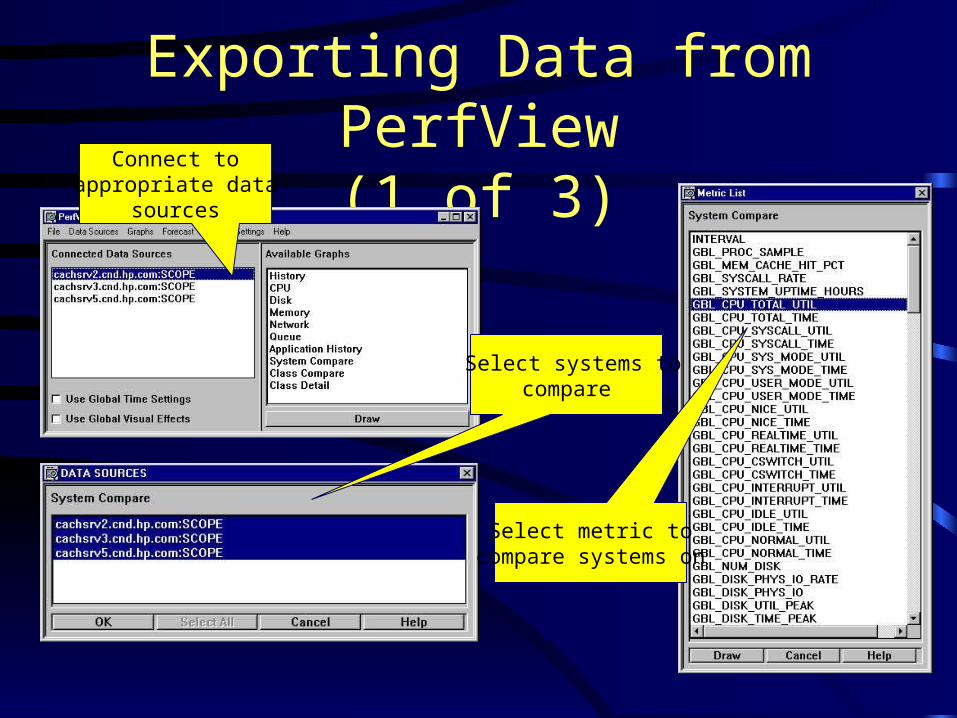
Exporting Data from PerfView(1 of 3) Connect to
appropriate datasources
Select systems tocompare
Select metric tocompare systems on
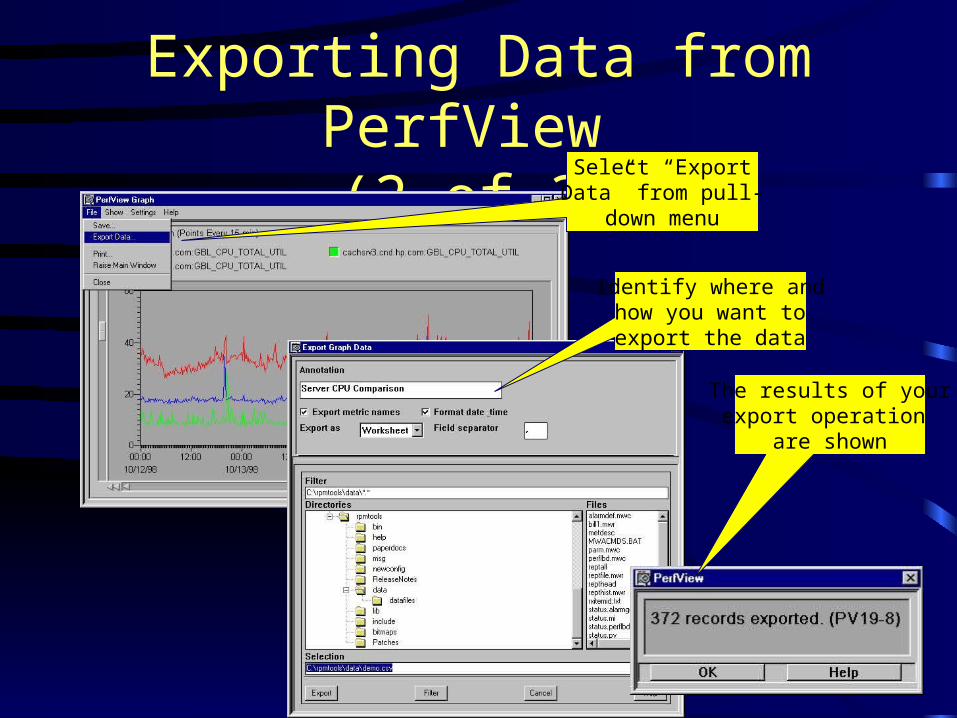
Exporting Data from PerfView (2 of 3) Select “Export
Data” from pull-down menu
Identify where andhow you want toexport the data
The results of yourexport operation
are shown
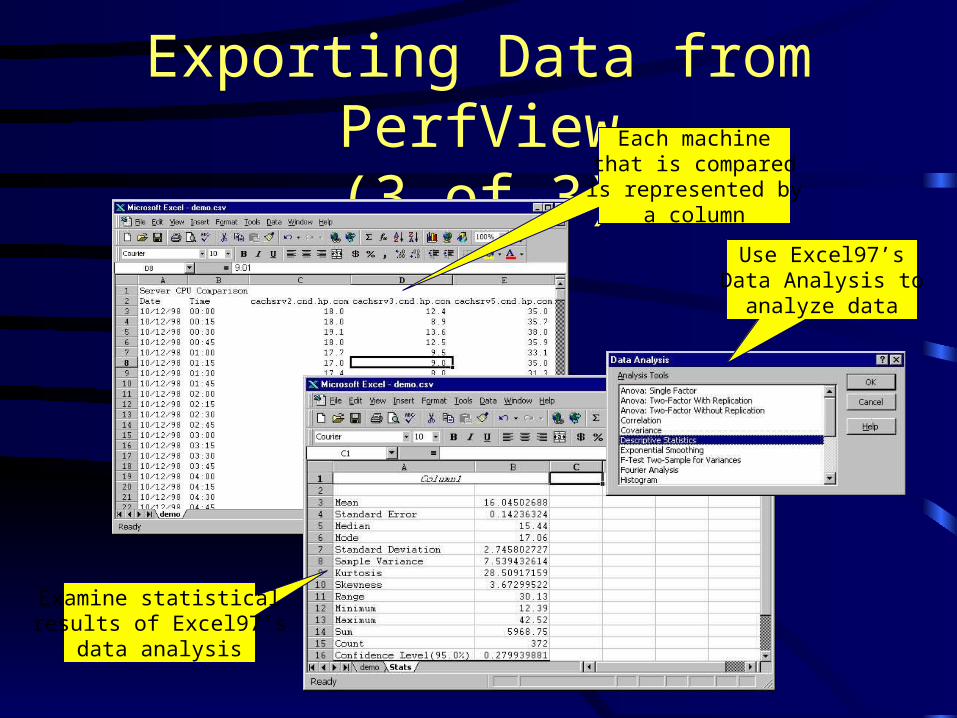
Exporting Data from PerfView(3 of 3)
Each machinethat is comparedis represented by
a column
Use Excel97’sData Analysis to
analyze data
Examine statisticalresults of Excel97’s
data analysis
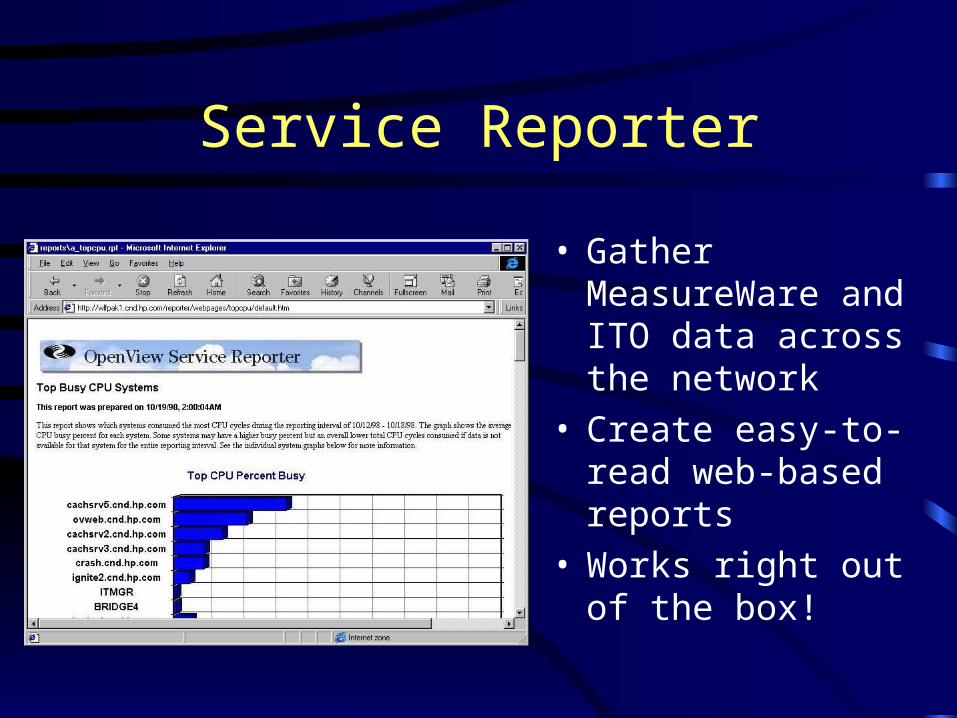
Service Reporter
• Gather MeasureWare and ITO data across the network
• Create easy-to-read web-based reports
• Works right out of the box!
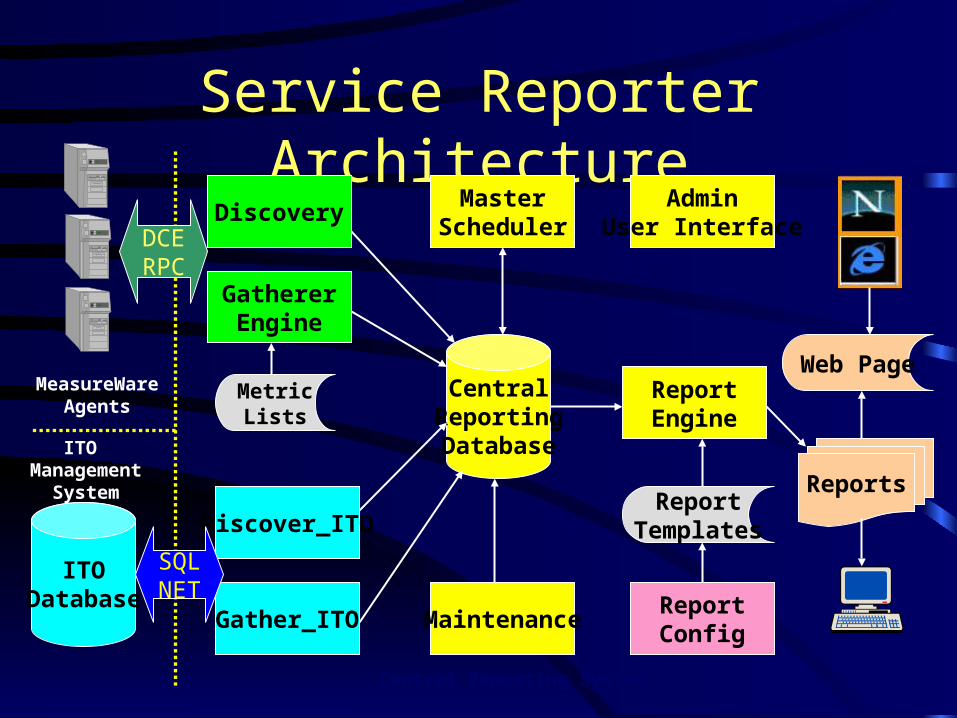
Service Reporter ArchitectureDiscovery
ReportConfig
ReportEngine
Maintenance
AdminUser Interface
MasterScheduler
Discover_ITO
Gather_ITO
GathererEngine
CentralReportingDatabase
ITODatabase
MetricLists
ReportTemplates
Web Page
Reports
SQLNET
DCERPC
ITO Management
System
MeasureWareAgents
Central Reporting System
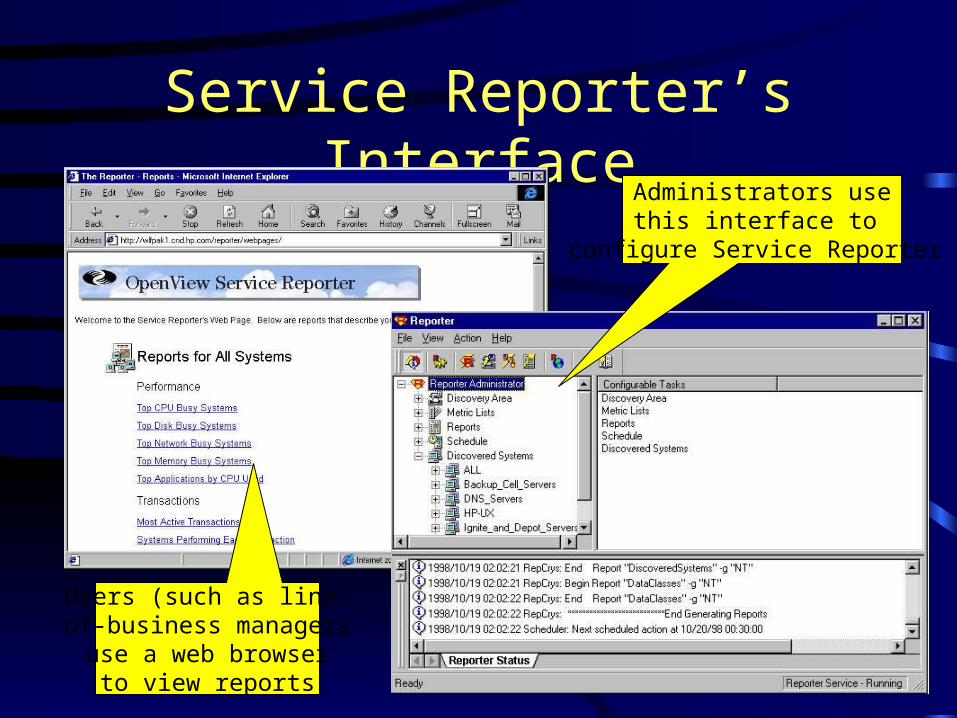
Service Reporter’s Interface
Users (such as line-of-business managers
use a web browserto view reports
Administrators usethis interface to
configure Service Reporter
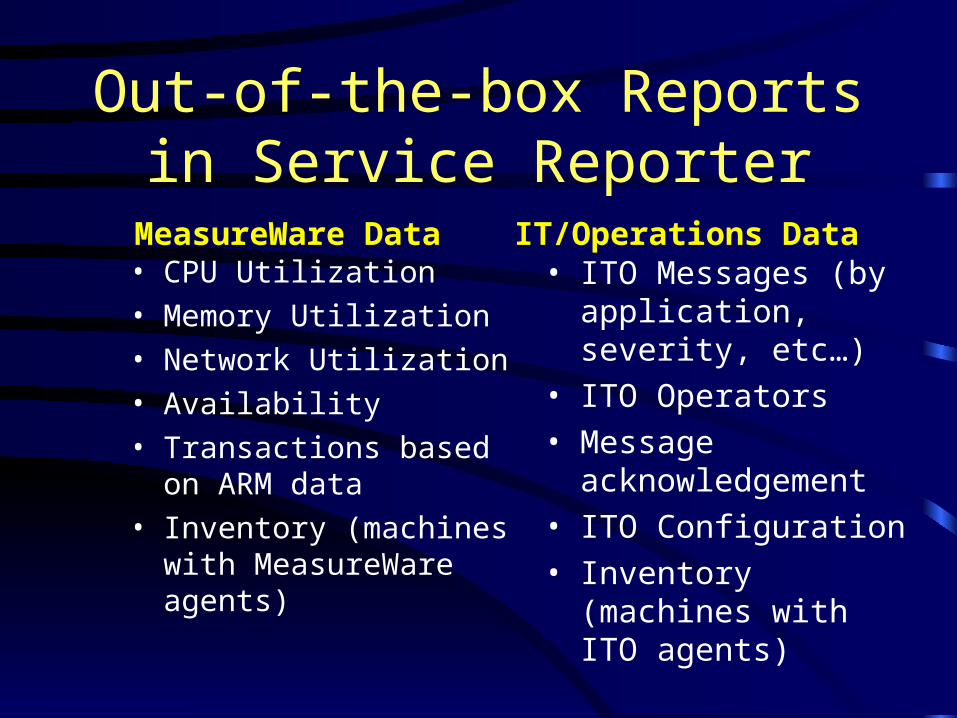
Out-of-the-box Reports in Service Reporter
• CPU Utilization
• Memory Utilization
• Network Utilization
• Availability
• Transactions based on ARM data
• Inventory (machines with MeasureWare agents)
• ITO Messages (by application, severity, etc…)
• ITO Operators
• Message acknowledgement
• ITO Configuration
• Inventory (machines with ITO agents)
MeasureWare Data IT/Operations Data
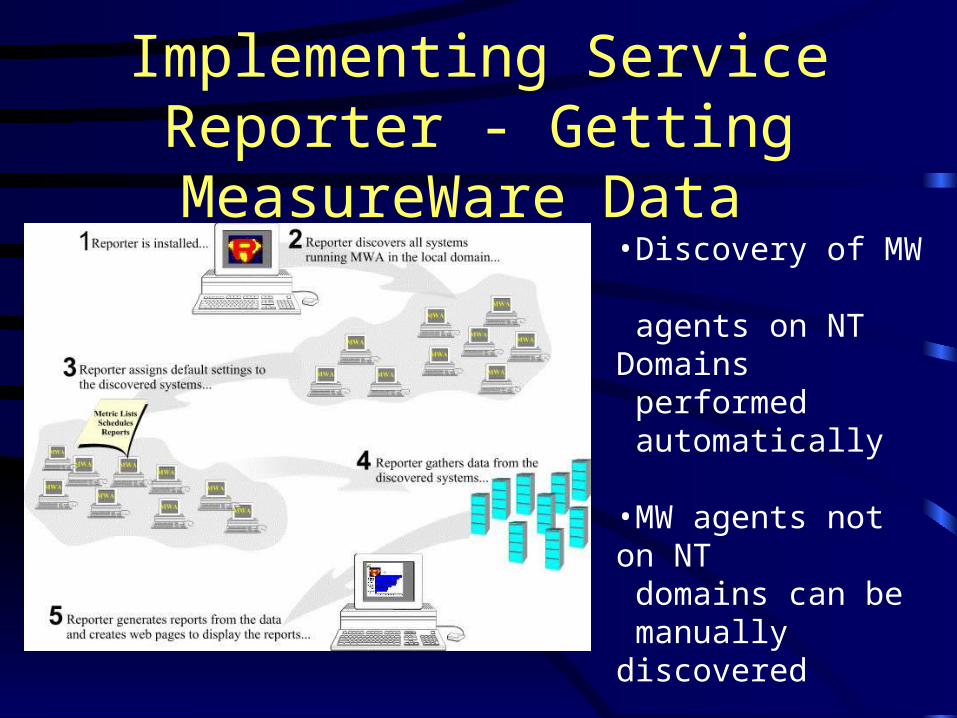
Implementing Service Reporter - Getting MeasureWare Data
•Discovery of MW agents on NT Domains
performed automatically
•MW agents not on NT domains can be manually discovered
•Once discovered, MW data is gathered
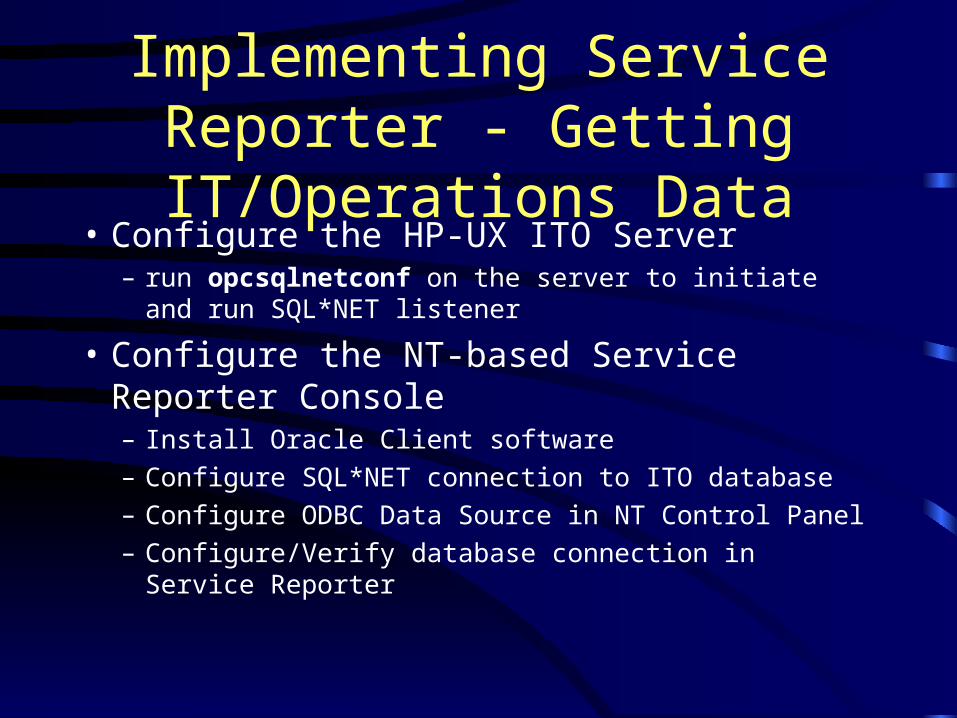
Implementing Service Reporter - Getting IT/Operations Data
• Configure the HP-UX ITO Server– run opcsqlnetconf on the server to initiate and run
SQL*NET listener
• Configure the NT-based Service Reporter Console– Install Oracle Client software
– Configure SQL*NET connection to ITO database
– Configure ODBC Data Source in NT Control Panel
– Configure/Verify database connection in Service Reporter
Building Your Own Reports for Service Reporter
• Develop a template using Crystal Reports
• Save Crystal Reports template to a directory underneath the Service Reporter installation
• Schedule the report using Service Reporter’s GUI
Building templates using MeasureWare Data
•Data source will be the Microsoft Jet (Access) database, which is part of Service Reporter
•ODBC Data Source Name will be “reporter”
•Use the “Service Reporter Concepts Guide” to determine which tables you need to use to create your report
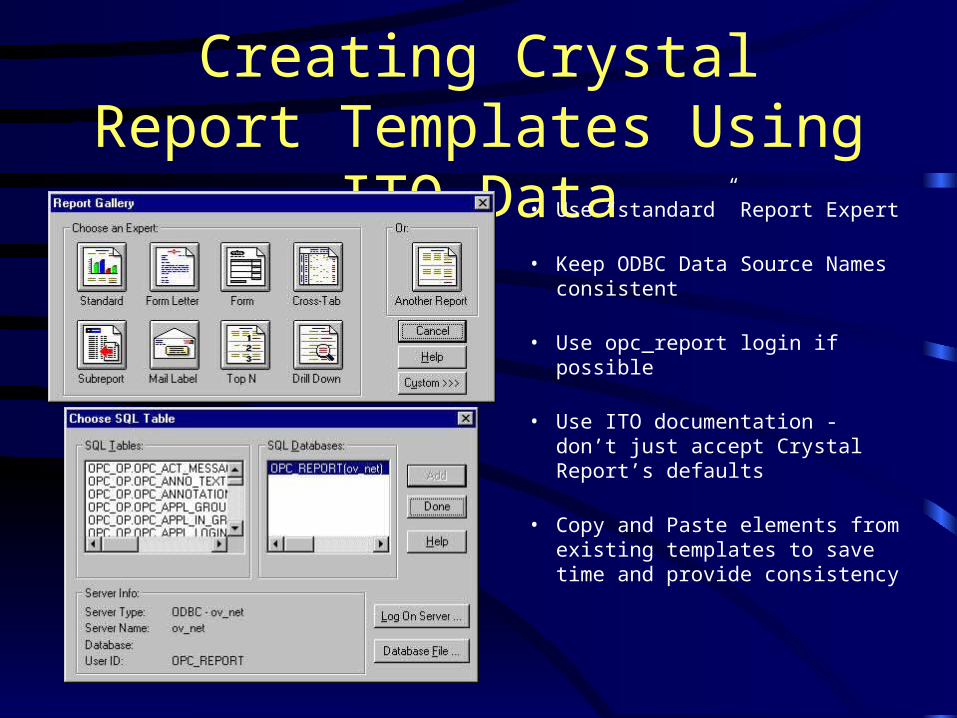
Creating Crystal Report Templates Using ITO Data
• Use “standard” Report Expert
• Keep ODBC Data Source Names consistent
• Use opc_report login if possible
• Use ITO documentation - don’t just accept Crystal Report’s defaults
• Copy and Paste elements from existing templates to save time and provide consistency
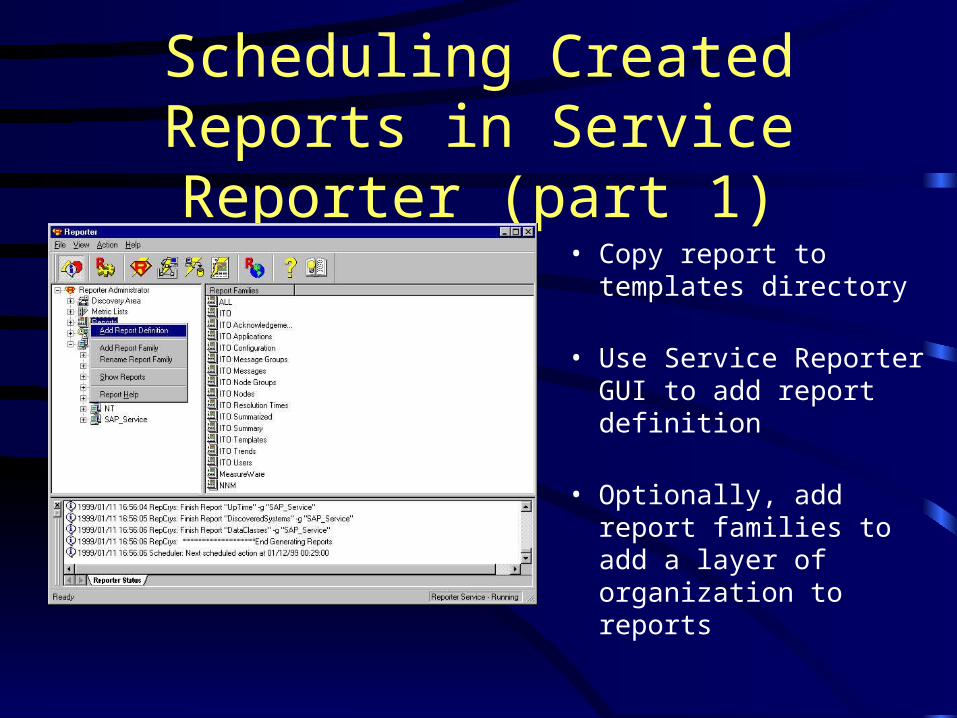
Scheduling Created Reports in Service Reporter (part 1)
• Copy report to templates directory
• Use Service Reporter GUI to add report definition
• Optionally, add report families to add a layer of organization to reports
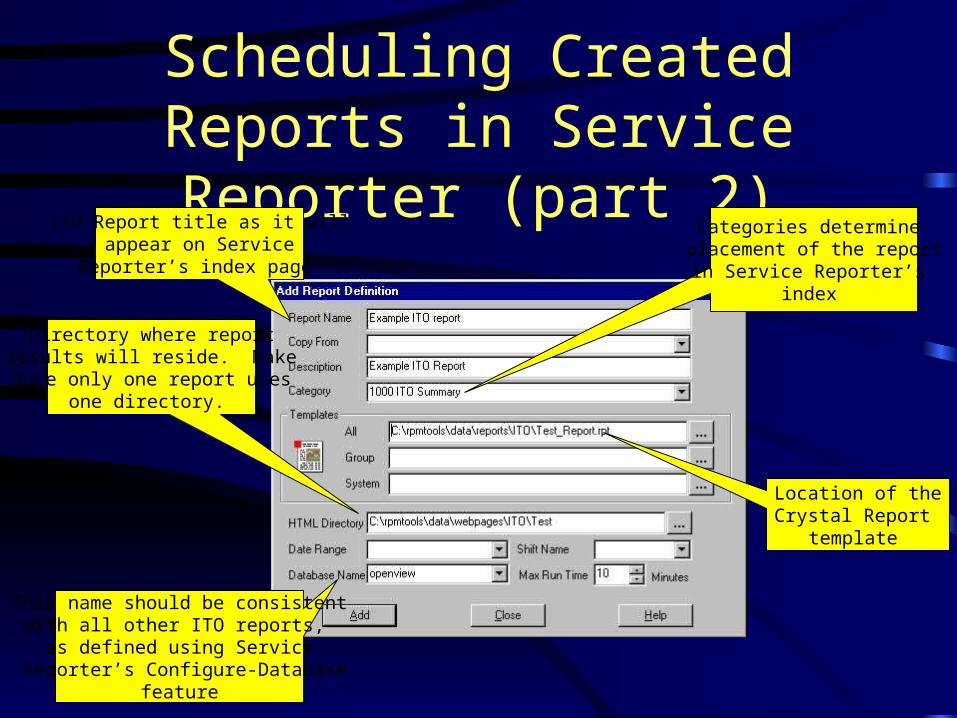
Scheduling Created Reports in Service Reporter (part 2)
ITO Report title as it willappear on Service
Reporter’s index page
Categories determine placement of the reportin Service Reporter’s
index
Location of theCrystal Report
template
Directory where reportresults will reside. Makesure only one report uses
one directory.
This name should be consistentwith all other ITO reports,
as defined using Service Reporter’s Configure-Database
feature
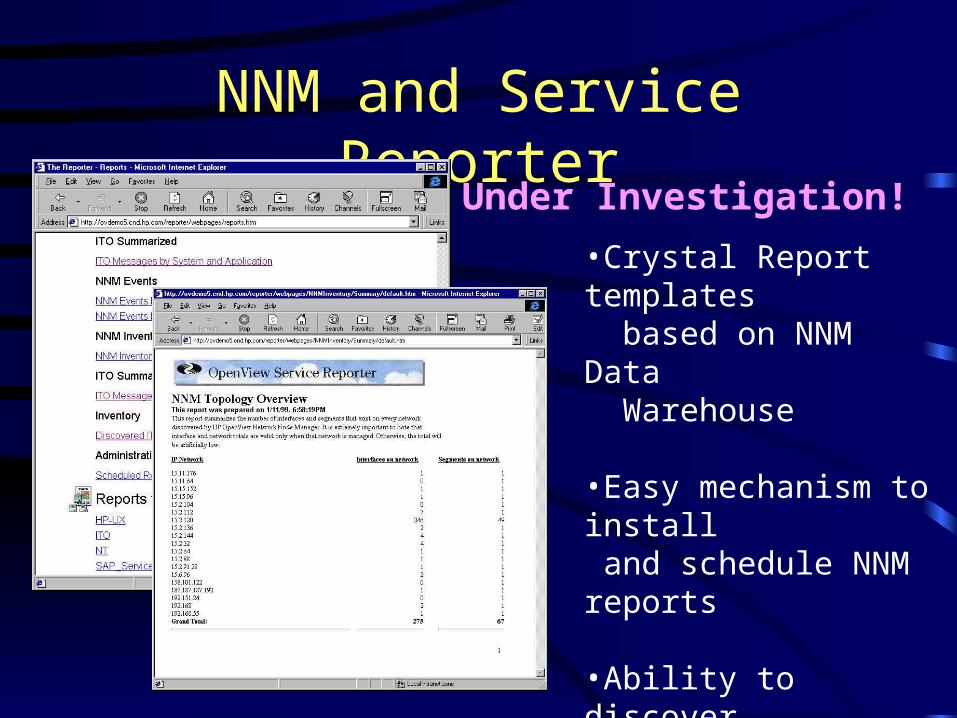
NNM and Service Reporter
•Crystal Report templates based on NNM Data Warehouse
•Easy mechanism to install and schedule NNM reports
•Ability to discover additional MeasureWare agents based on NNM topology database
Under Investigation!
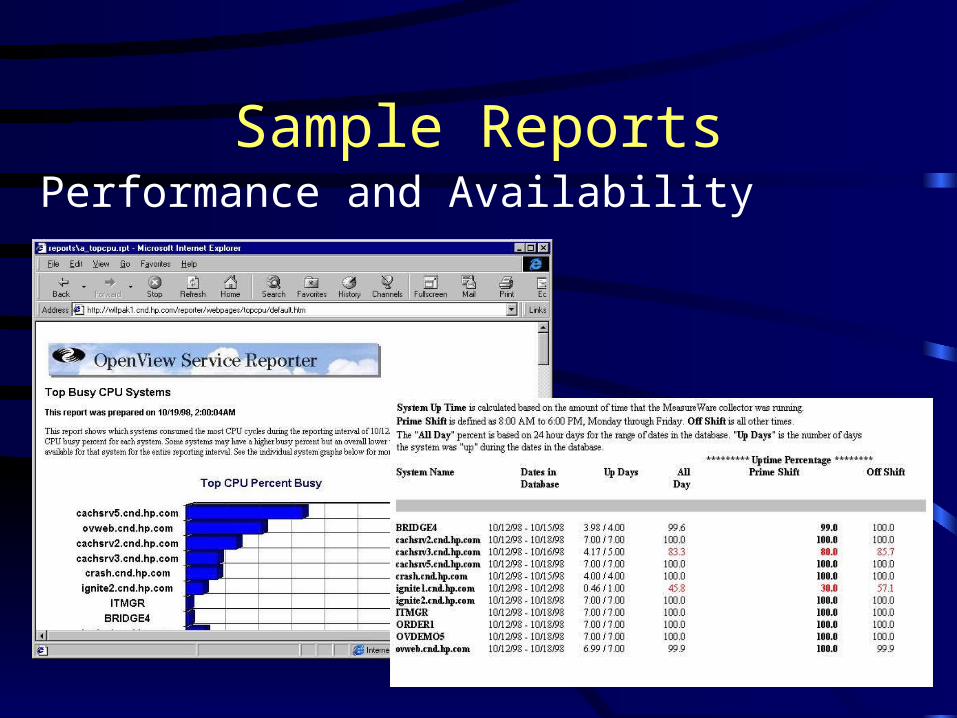
Sample ReportsPerformance and Availability
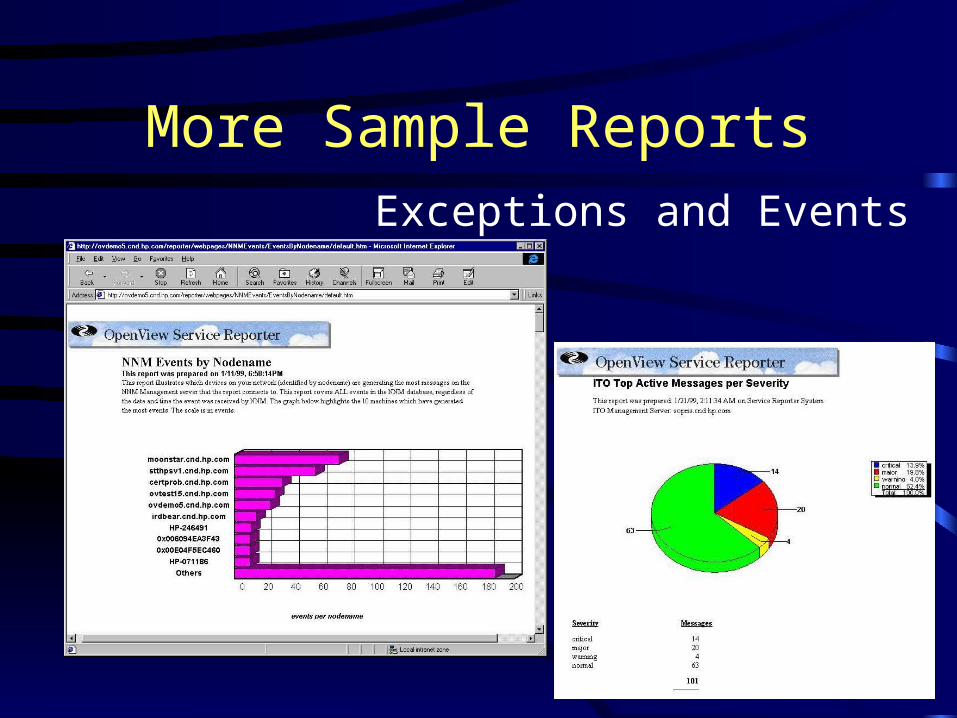
More Sample ReportsExceptions and Events
Strategic Data Extraction and Reporting
• Multi-product reporting
• Implementing reporting in your organization
• Potential issues to be aware of
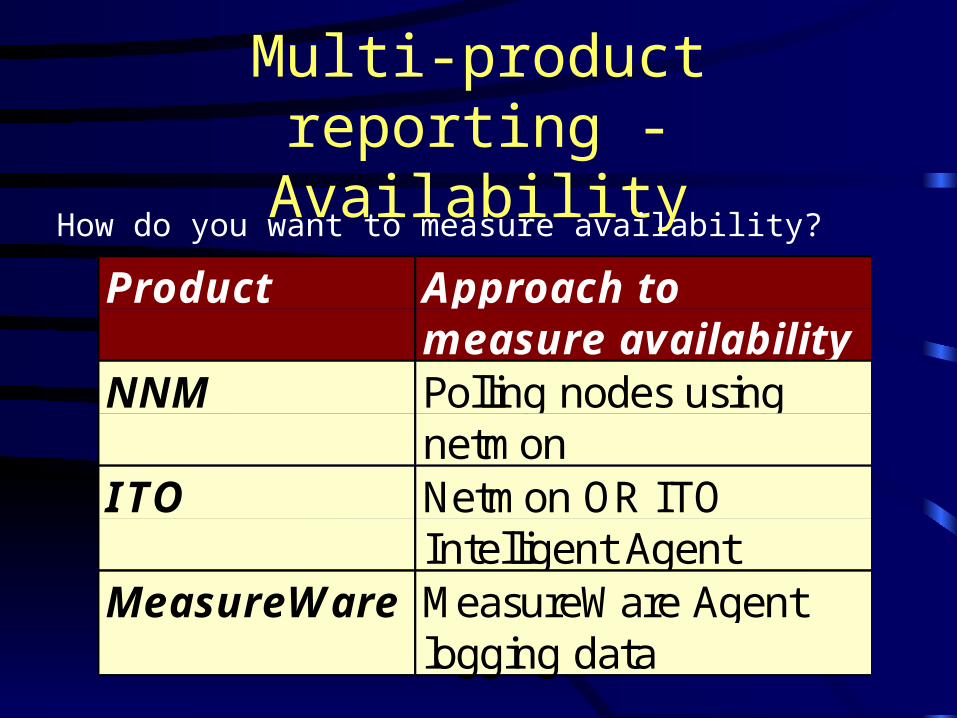
Multi-product reporting - Availability
How do you want to measure availability?
Product Approach tomeasure availability
NNM Polling nodes usingnetmon
ITO Netmon OR ITOIntelligent Agent
MeasureWare MeasureWare Agentlogging data
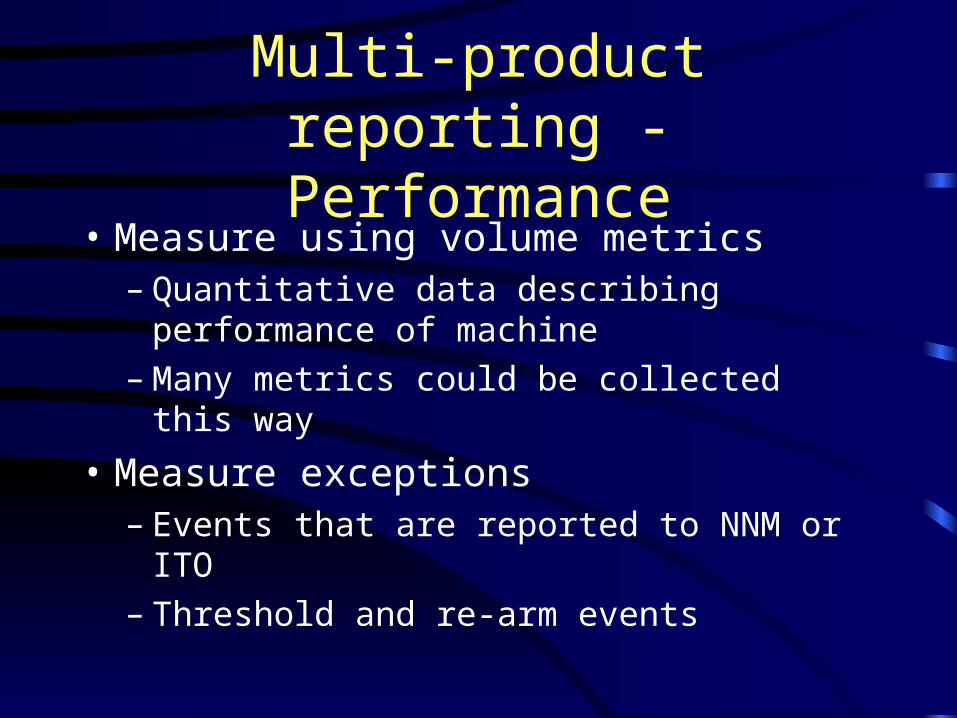
Multi-product reporting - Performance
• Measure using volume metrics– Quantitative data describing performance of
machine– Many metrics could be collected this way
• Measure exceptions– Events that are reported to NNM or ITO– Threshold and re-arm events
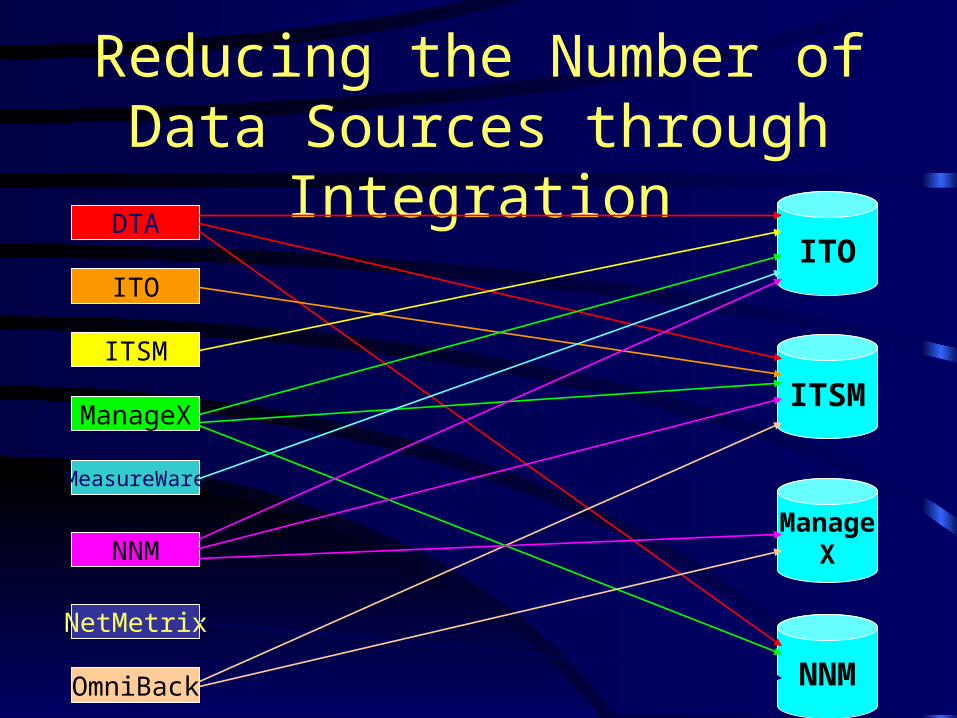
Reducing the Number of Data Sources through Integration
DTA
ITO
ITSM
ManageX
MeasureWare
NNM
NetMetrix
OmniBack
ITO
ITSM
ManageX
NNM
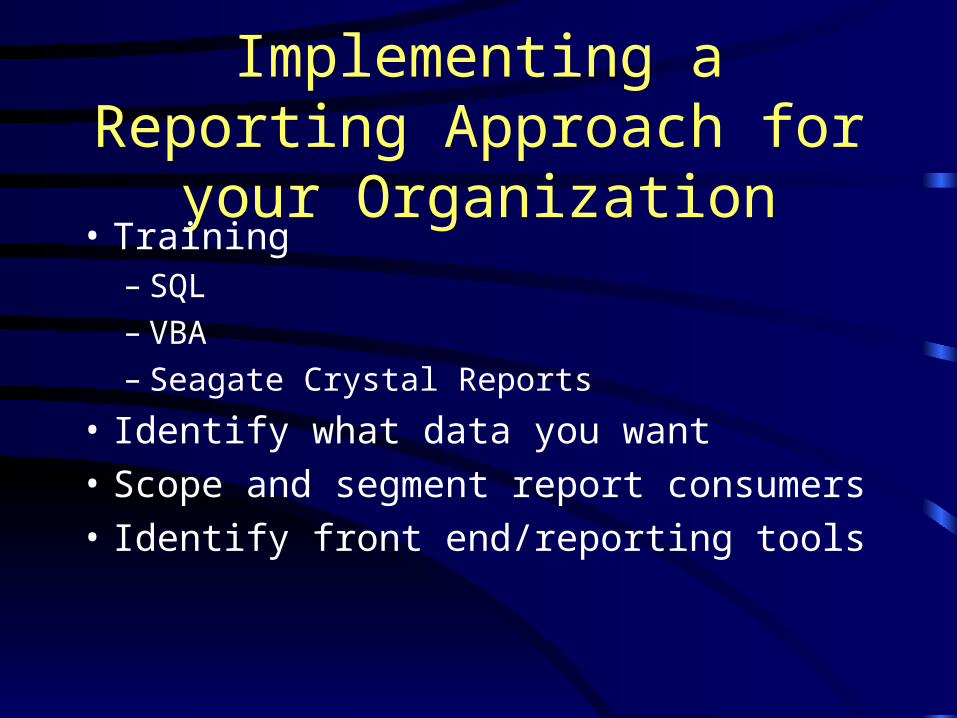
Implementing a Reporting Approach for your Organization
• Training– SQL– VBA– Seagate Crystal Reports
• Identify what data you want
• Scope and segment report consumers
• Identify front end/reporting tools
Avoiding Reporting Traps
• Set reasonable expectations regarding the questions you want answered with reports
• Balance use of HP OpenView and PC-based query tools
• Recognize that rapid evolution in the HP OpenView product line may force some changes in your reporting approach
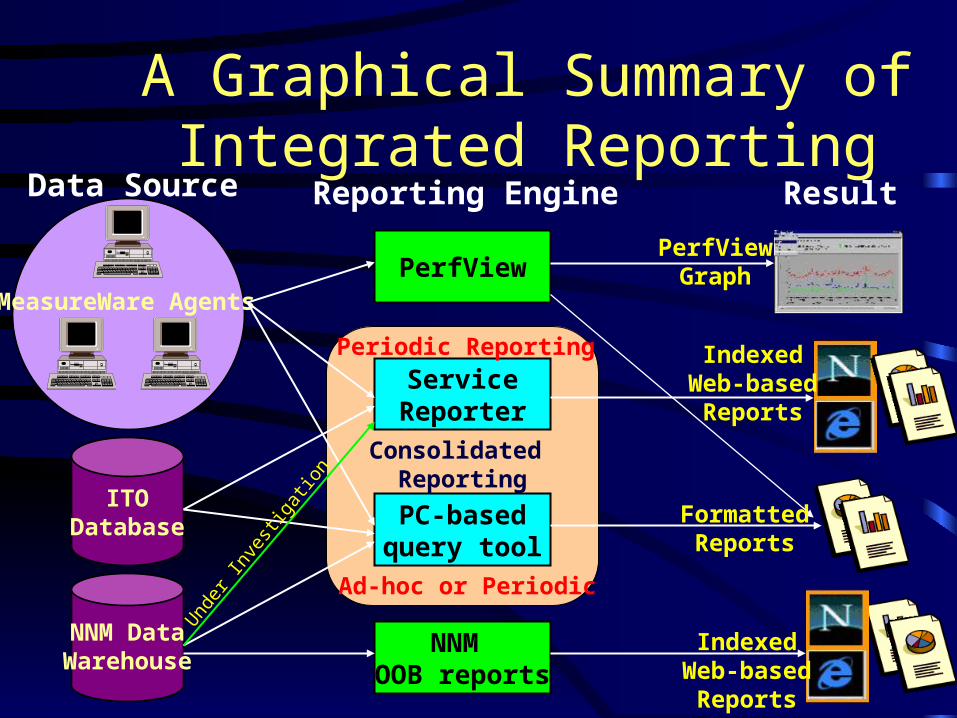
A Graphical Summary of Integrated Reporting
ServiceReporter
NNM DataWarehouse
ITODatabase
MeasureWare AgentsPerfView
PC-basedquery tool
NNM OOB reports
Reporting EngineData Source Result
PerfViewGraph
IndexedWeb-based
Reports
IndexedWeb-based
Reports
FormattedReports
Consolidated Reporting
Ad-hoc or Periodic
Periodic Reporting
Under
Inve
stiga
tion
In Closing...
• HP OpenView products offer several ways of generating reports
• PC-based query tools effectively complement HP OpenView’s data extraction capabilities to provide the reports you need today
• HP OpenView Service Reporter acts as the foundation for periodic consolidated reporting