HOWQUA RIVER WATER MONITORING REPORT … · 9 Who will be involved and where will you monitor?...
34
1 HOWQUA RIVER WATER MONITORING REPORT 1995-2009
-
Upload
nguyenliem -
Category
Documents
-
view
212 -
download
0
Transcript of HOWQUA RIVER WATER MONITORING REPORT … · 9 Who will be involved and where will you monitor?...
1
HOWQUA RIVER
WATER MONITORING REPORT 1995-2009

2
FRONT COVER : HOW008 - HOWQUA RIVER AT FRY’S FLAT, LOOKING UPSTREAM SEPTEMBER 2009

3
TABLE OF CONTENTS
INTRODUCTION .................................................................................................................................. 4 FIGURE 1. GOULBURN BROKEN CATCHMENT ...................................................................................... 5 FIGURE 2. GOULBURN RIVER BASIN ........................................................................................... 6 REGIONAL RIVER HEALTH STRATEGY ................................................................................................. 7 MONITORING PLAN ............................................................................................................................ 8 MAP OF MONITORING SITES ............................................................................................................ 10 TURBIDITY ....................................................................................................................................... 11 ELECTRICAL CONDUCTIVITY (SALINITY) ......................................................................................... 14 PHOSPHORUS ................................................................................................................................... 17 E.COLI .............................................................................................................................................. 19 STATE ENVIRONMENT PROTECTION POLICY (SEPP) COMPLIANCE .................................................. 23 MACRO-INVERTEBRATES IN HOWQUA RIVER ................................................................................... 26 SUMMARY FOR THE HOWQUA RIVER ................................................................................................ 28 REFERENCES .................................................................................................................................... 29 GLOSSARY ........................................................................................................................................ 29 APPENDIX A ..................................................................................................................................... 30
Howqua Report For Samples from 01 Jan 2009 to 31 Dec 2009 ................................... 30

4
Introduction
Waterwatch is a community water quality monitoring program that assists the community in
monitoring their local waterway. The program aims to:
increase community awareness and understanding of water quality issues;
increase community involvement in water management decisions;
generate useful data for community, and agency, use which complements Agency monitoring;
and,
assist in assessing the value of river restoration programs.
Monitoring networks across the Goulburn Broken Catchment have been formed to study water quality
in their local areas. The networks are able to test a local stream for a range of parameters using
equipment supplied by the Waterwatch Program. The parameters selected for testing in each area
depend upon the water quality issues identified by the monitoring network. Monitors also record the
date, time and rainfall to assist in the interpretation of the data.
Some sites on the Howqua River have been monitored regularly since 1995. More intensive monitoring
was initiated in 2001 after some community concern over the water quality in the lower Howqua River.
Interest from Parks Victoria has resulted in a monitoring program in the Upper Howqua River since
2002. Additional monitoring has occurred to monitor the water quality since the fires that swept
through the area in early 2007.
During 2009, the network monitored 10 sites on a monthly basis for the following parameters:
1. Electrical Conductivity (Salinity)
2. Turbidity
3. pH (HOW020 only)
4. Temperature
5. E.coli
6. Total Coliforms, and
7. Total Phosphorus.
This report contains the following information:
1. Monitoring Plan
2. Information about water quality parameters
3. A tabular summary of data collected at sites monitored
4. Graphical representation of parameters along the length of the waterway
5. Comparisons of water quality data with State Environment Protection Policy (SEPP) guidelines
6. A Macro-invertebrate survey report
7. Raw data for 2009
The report provides a summary of testing results and should be used to stimulate discussion on the
state of water quality in the Howqua River. There is the potential to use water quality data collected in
the program to discover trends in water quality over time and to measure the effects of improvement
works carried out in the sub-catchment.

5
Figure 1. Goulburn Broken Catchment
(GBCMA, 2005)

6
Figure 2. Goulburn River Basin Red numbers show river reaches
GBCMA, 2005

7
Regional River Health Strategy
Rivers are divided into sections, known as “reaches”, and each section or reach is given a number. Most sites monitored by Goulburn Broken Waterwatch are in
reaches that are addressed in the Goulburn Broken Catchment Management Authority’s (GBCMA) Regional River Health Strategy (RRHS). The reaches that are
targeted in the RRHS are identified through the five yearly Index of Stream Condition (ISC) Assessment (GBCMA, 2005). The Howqua River has two reaches which
fall under Program A in the RRHS. This program addresses key issues in forty three reaches in the Goulburn Broken catchment which have been identified as High
Priority Reaches. A High Priority Reach is one of high community value for environmental, social and economic values (GBCMA, 2005).
River Reach Description High Values to be
protected
Threats
Howqua River 69 Howqua River 1 km upstream of Mansfield-Woods
Point Road crossing, to the confluence with
Running creek, 400 m downstream of the Running
Creek and Steiners Rd crossing.
Heritage River.
High economic value.
No threats currently risk the status of the Howqua
River in Reach 69.
Howqua River 70 Howqua River from the confluence with Running
creek, 400 m downstream of the Running Creek
and Steiners Rd crossing, to Queen Spur Rd
crossing, where the Howqua river divides into
North and South branches.
Heritage River. No threats currently risk the status of the Howqua
River in Reach 70.
Table 1 GBCMA (2005)

8
Monitoring Plan Name of Project Activity Area: Howqua River
Monitoring Coordinator: Jill Breadon
Why are you monitoring ? Waterwatch has an on-going objective to encourage the community to become involved in monitoring local waterways to learn more about water quality issues. The data that is collected through this monitoring program can be used to target on-ground works to improve water quality. Volunteer monitors on the Howqua River are monitoring to:
• investigate the effects on water quality of human activities along the Lower Howqua River • gauge the impact on water quality in the Howqua River from human activities on Mt Buller • measure the impact of recreational areas such as Running Creek campground on Howqua River • understand the ecology of the Howqua River • determine any hots spots for bacterial contamination in the Howqua River • provide general water quality information
In 2009, Waterwatch was asked to participate in the Department of Sustainability and Environment’s Index of Stream Condition (ISC) project. This is a five yearly project to gauge the condition of all waterways in Victoria. Goulburn Broken Waterwatch provided water quality data to DSE for 49 sites across the Goulburn Broken Catchment, one of which is the Howqua River at Jamieson Road bridge (HOW020).
Who will use the data? The data is primarily collected for the benefit of the community. The data is also available to other organisations and individuals that have an interest in catchment water quality. These include Federal and State Government agencies, Local Government, Catchment Management Authorities (CMAs), Natural Resource Management (NRM) bodies and managers, community groups and local farmers and landholders.
How will the data be used? Waterwatch data is used by the community to understand issues regarding water quality in waterways. The data is then available to develop local action plans to improve water quality and to measure the effectiveness of these plans. Data collected by Goulburn Broken Waterwatch at chosen sites in 2009 was forwarded to the Department of Sustainability and Environment, for use in the 2009 Index of Stream Condition Assessment. This assessment is carried out every five years, and Waterwatch Victoria was approached to be included in the project, assisting with data collection for this assessment. Only one site in this report, HOW020 – Howqua River at Jamieson Road bridge, is included in the 2009 ISC Assessment. Goulburn Broken Waterwatch integrates our monitoring programs into the Goulburn Broken Catchment Management Authority’s Regional River Health Strategy. The Goulburn Broken Catchment Management Authority can utilise the data to assess actions to improve river health against targets and objectives.

9
Who will be involved and where will you monitor? PARKS VICTORIA HOW003 – MAP 8123 E 450302 N 5882778 Howqua River d/s of Black Dog Creek HOW005 – MAP 8123 E 444065 N 5883856 Howqua River at Tunnel Bend HOW006 – MAP 8123 E 441808 N 5883243 Howqua River at Sheep Yard Flat HOW007 – MAP 8123 E 441795 N 5882873 Howqua River at Howqua Hills HOW008 – MAP 8123 E 440401 N 5883091 Howqua River at Fry’s Flat JACK DONOGHUE HOW009 – MAP 8123 E 431764 N 5878234 Howqua River u/s Running Creek campground RUN009 – MAP 8123 E 3 431505 N 5878045 Running Creek u/s of Howqua campground RUN010 – MAP 8123 E 431503 N 5878338 Running Creek d/s of Howqua campground HOW016 – MAP 8123 E 428749 N 5879197 Howqua River at Terika WATERWATCH COORDINATOR HOW020 – MAP 8123 E 425952 N 5879995 Howqua River at Jamieson Road bridge See Map on page 10 also.
Which parameters will be monitored?
• E.coli • Turbidity, • Electrical Conductivity, • Temperature, • pH, • Dissolved Oxygen • Total Phosphorus (at selected sites)
Data quality controls? See Data Confidence Plan What methods will you use? When and how often will you monitor? See Community Monitoring Manual for the methods and procedures used in the Waterwatch Program. A statistical analysis of water quality data requires monthly monitoring as a minimum.
How will the data be managed and reported? All water quality data is sent to the local Waterwatch Coordinator for quality assurance checking prior to being sent to the Data Management Coordinator for entry into the Regional Waterwatch Database. Data relevant to the ISC project has been reported to DSE as requested. Periodically, raw data reports and written reports are prepared by the Data Management Coordinator and distributed to the volunteer monitoring network, and agencies or groups who have requested the data. Raw data is also loaded monthly onto the Goulburn Broken Waterwatch website (www.gbwaterwatch.org.au).

10
Map of Monitoring Sites
Figure 3: This map is taken from the Goulburn Broken Waterwatch Website, (www.gbwaterwatch.org.au) and shows the water quality monitoring sites along the Howqua River.

11
Turbidity
Turbidity is a measure of the clarity of water which is caused by suspended material in the water. As suspended material increases, the clarity decreases, and water appears cloudy or muddy. As water becomes more turbid, the ability of light to pass through the water decreases. This can limit the growth of submerged plants. This affects the fish and invertebrate communities which feed on and live in the plants. The lack of light also makes it difficult for predatory fish and birds to hunt successfully (Tiller and Newall, 2009). Turbid water loses its ability to support a large variety of aquatic organisms due to lower levels of oxygen. Where there is less light penetrating the water, there is less photosynthesis occurring, and therefore a lower level of oxygen in the water. The water also becomes warmer because the suspended material absorbs heat from the sun. This also decreases the amount of oxygen dissolved in water. Turbidity can be caused by silt, clay, micro-organisms, plant material, sewage or industrial effluent discharges, algae and chemicals, however most of the sediment comes from erosion of the surrounding catchment or stream bank (Tiller and Newall, 2009). Soil weathering and erosion are a natural process, but human land use such as agriculture, forestry or housing development can result in significant quantities entering waterways. Presence of riparian vegetation along the waterways can reduce the amount of suspended material entering waterways. It acts as a filter for rainfall runoff therefore reducing, or maintaining, the turbidity of the water. Levels of turbidity will vary over time. Rain events inevitably cause an increase in turbidity in a waterway, as apart from transporting sediment into the waterways from the surrounding catchment, they also result in an increased flow, which may stir up the water body. Bushfires also have a detrimental effect on the turbidity levels in waterways due to the decimation of vegetation, riparian and other, resulting in exposure of soil, and lack of filtering the runoff to a waterway in the case of a rain event.
HOW003 – Howqua River below Black Dog Creek, looking downstream, September 2009

12
Turbidity in the Howqua River Waterwatch has monitored sites along the Howqua River since 1995. These tables and graphs summarise the data collected by Howqua Valley Landcare Group, Parks
Victoria and Waterwatch over this monitoring period.
Site Code Site Description TURBIDITY MEDIANS (NTU)
1995 1996 1997 1998 1999 2000 2001 2002 2003 2004 2005 2006 2007 2008 2009
HOW003 Howqua River below Black Dog Creek
- - - - - - - - - - - - - 2 2
HOW005 Howqua River at Tunnel Bend - - - - - - - - - - - 1 2 2 2
HOW006 Howqua River at Sheep Yard Flat - - - - - - - - - - - - - 2 2
HOW007 Howqua River at Howqua Hills
- - - - - - - - - - - - 2 2 2
HOW008 Howqua River at Fry’s Flat - - - - - - - - - - - - 2 2 2
HOW009 Howqua River upstream of
Running Creek Campground
- - - - - - - - - - 2.1 1 2 1 1
RUN009 Running Creek upstream of campground - - - - - - - - - - 2 1 2 1 1
RUN010 Running Creek downstream of campground - - - - - - - - - - 2 1 2 1 1
HOW016 Howqua River at Terika - - - - - - 11 - 4.5 2 2.4 1 2 1 1
HOW020 Howqua River at Jamieson Road bridge 8 - - 1 2 2 6 2 4.5 2 2.4 1 14 1.5 2
Annual Rainfall Total (mm) BoM Jamieson Licola Rd Station (83091)
- - - - - - - - - - 1066 468 1016 852 963
Ratings for Valleys: <10NTU Excellent <12.5NTU Good <15NTU Fair <22.5NTU Poor >22.5NTU Degraded
Table 2

Figu
Figuund
• Turbidit
ure 4 above s
ure 5 shows dertaken. It is
0
5
10
15
20
25N
TU
0
5
10
15
20
25
NTU
ty results ar
shows the me
the long terms important t
0
5
0
5
0
5
T
re very low
edian turbidit
m median turto note that n
Turbi
Exce
Deg
urbidity
Exc
in the Howq
Fi
ty at each sit
Fi
rbidity at eacnot all sites h
S
idity Media
ellent
graded
y Median19
cellent
Degraded
13
qua River an
gure 4
te for 2009 o
gure 5
ch site for theave been mo
ite Code
ans in the H2009
Site Code
ns in the995 - 200
nd Running
nly.
e fifteen yearonitored for a
Howqua R
e Howq09
Creek.
r period that all fifteen yea
iver
ua Rive
monitoring hrs (see Table
er
has been e 2).

14
Electrical Conductivity (Salinity)
Electrical conductivity (EC) measures the flow of electricity in a solution (Tiller and Newall, 2009). As the amount of dissolved salts in the water increase, the conductivity increases. This relationship is used as a measure of salinity, and is recorded as micro Siemens per centimetre (µS/cm) (Tiller and Newall, 2009). Salts are necessary for aquatic organisms to survive, but excessive amounts may be toxic to some. Different organisms have different tolerance levels to salt, but most freshwater aquatic organisms will not tolerate high levels. In general, EC levels less than 1500 µS/cm are considered to have little short term effect (Tiller and Newall, 2009). As salinity rises, the number of species decline. Geology, urban and agricultural runoff, industrial and sewage runoff, proximity to the coast, and groundwater all affect salinity levels. Naturally salinity levels are higher in dry periods, as evaporation concentrates the salt levels. During these dry times, groundwater maybe the major contributor of water to waterways. Groundwater can have very high salt concentrations, and rising groundwater tables are known to have elevated salinity levels in many rivers in Victoria (Tiller and Newall, 2009). Once there is runoff again from rainfall, the salt concentrations will decrease. Dryland salinity is caused when deep rooted trees are replaced with seasonal crops or grasses that do not pump the water into the atmosphere as efficiently. If trees are cleared higher up in a catchment, this can lead to dramatic rises in groundwater tables. Revegetation of recharge areas and buffer strips along local streams can help to reduce salinity. The following summary can assist in interpretation of salt levels in surface waterways.
0-800 µS/cm
• Water from your tap at home would be within this range. • This is good drinking water for people and suitable for all animals. • When water of 300 µS/cm is used in irrigation through overhead sprinklers, plants that are sensitive to
salt may develop leaf scorch. 800-2500 µS/cm
• People can drink water within this range but it would start to taste very salty. • This water is still suitable for all animals. • Peas, apricots and grapes can't be grown with water over 1,500 µS/cm. • If this water is used for irrigation farming, special care must be taken with drainage and choosing plants
that are tolerant to salt. For example, lucerne can be irrigated with water of 2,000 µS/cm and white clover with water of 1,000 µS/cm, provided they are grown on sandy soil with good drainage.
2,500-10,000 µS/cm
• Water in this range is not suitable for people and should only be drunk in an emergency. • When water over 4,000 µS/cm is given to laying hens it causes their eggs to crack. • Water over 6,000 µS/cm is unsuitable for pigs and poultry. • Highly saline water may also contain a high level of magnesium which can be harmful to stock. • This water is generally not used for irrigation farming except on some crops that have a very high
tolerance to salt. • Pears, apples and tomatoes could not be grown with water in this range.
Over 10,000 µS/cm
• Water over 10,000 µS/cm has an extremely high salinity. • This water is unsuitable for people and for most animals. • Only beef cattle and adult sheep can survive on water in this range. • Irrigation farming is not possible with such highly saline water. • In dryland areas only salt tolerant pastures will survive. • At 50,000 µS/cm water has salinity similar to the sea.
15
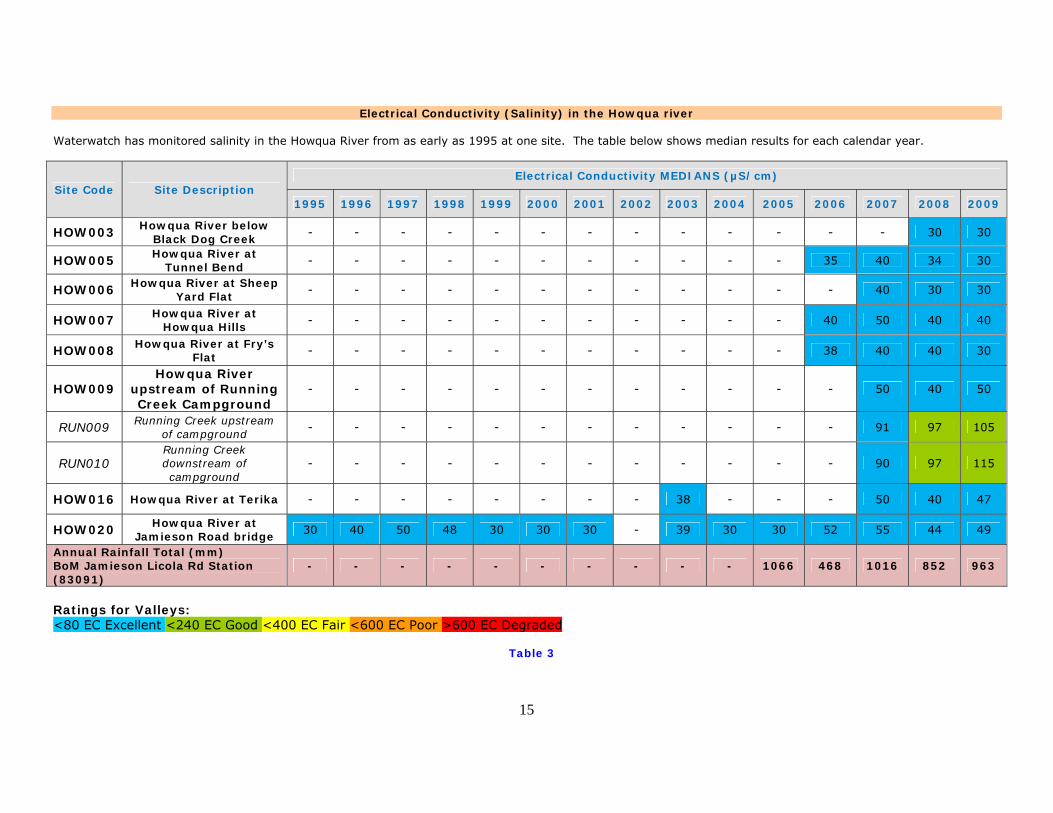
Electrical Conductivity (Salinity) in the Howqua river
Waterwatch has monitored salinity in the Howqua River from as early as 1995 at one site. The table below shows median results for each calendar year.
Site Code Site Description Electrical Conductivity MEDIANS (µS/cm)
1995 1996 1997 1998 1999 2000 2001 2002 2003 2004 2005 2006 2007 2008 2009
HOW003 Howqua River below Black Dog Creek
- - - - - - - - - - - - - 30 30
HOW005 Howqua River at Tunnel Bend - - - - - - - - - - - 35 40 34 30
HOW006 Howqua River at Sheep Yard Flat - - - - - - - - - - - - 40 30 30
HOW007 Howqua River at Howqua Hills - - - - - - - - - - - 40 50 40 40
HOW008 Howqua River at Fry’s Flat - - - - - - - - - - - 38 40 40 30
HOW009 Howqua River
upstream of Running Creek Campground
- - - - - - - - - - - - 50 40 50
RUN009 Running Creek upstream of campground
- - - - - - - - - - - - 91 97 105
RUN010 Running Creek downstream of campground
- - - - - - - - - - - - 90 97 115
HOW016 Howqua River at Terika - - - - - - - - 38 - - - 50 40 47
HOW020 Howqua River at Jamieson Road bridge 30 40 50 48 30 30 30 - 39 30 30 52 55 44 49
Annual Rainfall Total (mm) BoM Jamieson Licola Rd Station (83091)
- - - - - - - - - - 1066 468 1016 852 963
Ratings for Valleys: <80 EC Excellent <240 EC Good <400 EC Fair <600 EC Poor >600 EC Degraded
Table 3

• Ele
• Re
als
Figure 6 ashown in F
Figure 7 smonitoringconductivit
EC (µ
S/cm
)EC
(µS/
cm)
ectrical condu
esults at both
so increased
above showsFigure 7 below
shows the long has been uty for all fifte
0
100
200
300
400
500
600
(µ)
El
0
100
200
300
400
500
600
E
G
uctivity levels
h sites in Run
slightly in the
s results for w.
ng term medundertaken. Ieen years, wit
ectrical Co
Excelle
Good
Degraded
Electrical C
Good
Degraded
s have remai
ning Creek a
e last two ye
2009 only, a
dian electricaIt is importath many sites
onductivity
ent
d
Conductivit1
Exce
16
ned stable an
re slightly hig
ars.
Figure 6
and these re
Figure 7
al conductivitnt to note ns only being
Site Code
y Medians
Site code
ty Medians1995 - 2009
ellent
nd generally
gher than tho
esults are m
ty at each sitot all sites hmonitored sin
in the How
s in the Ho9
low.
ose in the Ho
irrored in th
te for the fifhave been mnce 2007 (Se
wqua River
owqua Rive
owqua River,
e long term
fteen year pemonitored for ee table 3).
r 2009
er
and have
medians
eriod that electrical

17
Phosphorus
Phosphorus is a nutrient that occurs naturally at low concentrations in water and it is essential for all forms of life. It comes from processes like the weathering of rocks (inorganic phosphorus) and from the decomposition of organic matter such as plant litter (organic phosphorus). Other sources of phosphorus entering river systems include:
• Organic material from animals such as waste and decaying tissue; • Wastewater treatment plants; • Stormwater runoff; • Runoff or discharge from intensive agricultural or dairy industry; and • Forest runoff.
Phosphorus is one of the nutrients required by aquatic plants and animals, however it is often the one in shortest supply, therefore limiting plant growth. If phosphorus levels are high enough they can contribute to algal blooms and excessive growth of aquatic plants. This can result in smothering of aquatic habitat, and also cause severely high oxygen peaks and low oxygen troughs due to excess photosynthesis during the day, and respiration at night. These extreme highs and lows can be enough to severely stress or kill stream fauna (Tiller and Newall, 2009). There can be seasonal variation in phosphorus levels. High flows generally result in higher phosphorus concentrations, as runoff carries sediment containing phosphorus into waterways. As for turbidity, bushfire and resultant devastation of riparian, and other, vegetation can result in extremely high levels of phosphorus. This is due to the massive sediment and ash inputs to surrounding waterways after storm events. When the Water Quality Strategy was produced for the Goulburn Broken Catchment, nutrients in waterways (particularly phosphorus) became an important parameter to monitor when deciding the quality of water in a waterway. Phosphorus is also a parameter included in the chemical sub-index as part of the Victorian Index of Stream Condition (ISC) rating system for measuring the condition of a waterway. Total phosphorus is used rather than soluble (reactive) phosphorus, as total phosphorus includes all forms of phosphorus present in a waterway rather than just the soluble component. It will generally increase from headwaters to the lower part of a waterway.
HOW005 – Howqua River at Tunnel Bend, looking downstream, September 2009

18
Phosphorus in the Howqua River
Howqua River at Jamieson Road bridge has been tested for phosphorus since 1995. Testing began at other sites when the Howqua Valley Landcare Group
and Parks Victoria began monitoring. The table below summarises the data collected to date.
Site Code Site Description Total Phosphorus MEDIANS (mg/L)
1995 1996 1997 1998 1999 2000 2001 2002 2003 2004 2005 2006 2007 2008 2009
HOW003 Howqua River below Black Dog Creek
- - - - - - - - - - - - 0.02 - -
HOW005 Howqua River at Tunnel Bend
- - - - - - - - - - - - 0.02 - -
HOW006 Howqua River at Sheep Yard Flat - - - - - - - - - - - - 0.02 - -
HOW007 Howqua River at Howqua Hills
- - - - - - - - - - - - 0.02 - -
HOW008 Howqua River at Fry’s Flat - - - - - - - - - - - <0.02 0.02 0.02 0.02
HOW020 Howqua River at Jamieson Road
bridge 0.02 0.06 0.02 0.02 - 0.03 0.03 - 0.01 0.02 0.02 - 0.02 0.02 0.02
Annual Rainfall Total (mm) BoM Jamieson Licola Rd Station (83091)
- - - - - - - - - - 1066 468 1016 852 963
Ratings for the Mountains, Valleys and Plains: <0.01 mg/L Excellent, <0.025mg/L Good, <0.05mg/L Fair, <0.1mg/L Poor, >0.1mg/L Degraded
Table 4
• Total phosphorus results in the Howqua River continue to be good in 2009.

19
E.coli Microbiological quality of a water-body is generally measured by testing for bacteria that are indicators of faecal pollution. Water intended for human consumption should contain none of these bacteria. Indicator organisms are bacteria whose presence in water gives a simple and meaningful indication that faecal contamination has occurred. Such organisms are always present in high numbers in the faeces of humans (and other warm blooded animals and birds). Their presence in a water body indicates faecal contamination which may lead to potential health risks from disease causing pathogens, such as Salmonella, Hepatitis A, and Giardia (Tiller and Newall, 2009). One of the major indicator organisms of faecal pollution is Escherichia coli (E. coli). When indicator bacteria are detected in water, their presence indicates that excrement from birds, animals or humans has recently polluted the water and that all types of pathogens (bacteria, viruses, protozoans and parasites) may also be present. E. coli is a member of the coliform group of bacteria found naturally in the intestines of all warm-blooded animals. It is the predominant coliform in fresh faeces and so its presence in water is indicative of recent faecal contamination. The E. coli count does not differentiate between bacteria of bird, animal or human origin but, as animals and birds can act as carriers of human intestinal pathogens, the presence of E. coli should always be considered to have sanitary significance. State Environment Protection Policy E coli Objectives for Waterways are shown in the table below.
Beneficial Use Description
E coli (orgs/100ml)
Median of 5 samples at regular intervals within 30 days
Primary Contact Swimming, bathing and other direct
water-contact sports ≤150
Secondary Contact Boating and fishing ≤1,000
Table 5
Some generalisations to help with interpretation:
• E coli can fluctuate widely even to the extent of increases from "tens" to "hundreds" without
necessarily indicating contamination from a pollution source;
• If this magnitude of increase occurred regularly between two sampling sites and a known possible
source was implicated, then there is some evidence of contamination;
• Normally, E coli levels will greatly increase after rainfall;
• Potential sources include sewage overflows, leaking sewerage systems, illegal sewerage connections to
stormwater, septic tanks, and runoff from contaminated areas.

20
E.coli in the Howqua River Howqua River and Running Creek have been tested for E.coli by Waterwatch and the community since the end of 2002. The table and graph below summarise the data.
Site Code
Site Description E.coli MEDIANS (orgs/100ml)
2002 2003 2004 2005 2006 2007 2008 2009
HOW003 Howqua River below Black Dog Creek
18 13 20 15 16 6 15 15
HOW005 Howqua River at Tunnel Bend 23 11 14 19 14 14 13 3
HOW006 Howqua River at Sheep Yard Flat 53 47 28 21 13 9 21 16
HOW007 Howqua River at Howqua Hills - 25 17 21 45 11 29 20
HOW008 Howqua River at Fry’s Flat 125 20 99 23 29 9 37 15
HOW009
Howqua River upstream of Running Ck Campground
- - - - 83 26 27 28
RUN009 Running Creek upstream of campground
- - - 178 41 7 13 161
RUN010 Running Creek downstream of campground
- - - 178 12 9 23 96
HOW016 Howqua River at Terika - - - 91 110 32 29 36
HOW020 Howqua River at Jamieson Road bridge
- - 34 - 231 37 38 70
Table 6
• SEPP Guidelines suggest E.coli less than 150 organisms/100 ml sample for primary contact such as
swimming or bathing. • With the exception of Running Creek upstream of the campground (RUN009), highlighted in green,
all of the sites monitored for E.coli met this guideline in 2009. • It must be noted, however, that SEPP Guidelines use five samples within a 30 day period, whereas
sites shown above are usually monitored once per month, and the medians above are calculated over the 12 months of the calendar year.
• World Health Organisation Guidelines for drinking water (2006), require 0 (zero) organisms/100ml sample for E.coli.

Figure 8 ayear only. all data co
orgs
/100
ml
2468
10121416
orgs
/100
ml
bove shows Figure 9 be
ollected from
020406080
100120140160180
orgs
/100
ml
Se
02040608000204060
median E.colelow shows lo2002 to 2009
E.c
Suitable for peg swimming
E.col
li results in tong term me9.
oli Medi
primary contg
li Media2
Suit
21
Figure 8
he Howqua Redian results
Figure 9
Site code
ians in t200
tact
Site co
ns in th2002 to 2
able for pr
River and Rufor E.coli. T
e
the How09
ode
e Howq2009
rimary con
nning Creek hese median
wqua Riv
ua Rive
tact eg sw
for the 2009s are calcula
ver
r
wimming
9 calendar ated using

22
Table 7 below gives an indication of possible E.coli levels that could be expected in different sample types. All Howqua River results and the results for Running Creek downstream of the campground (RUN010), fit well within the “Clean Water” category when looking at overall medians for 2009, as would be expected for their location.
Description E coli Number Possible Location
Very, Very Clean Water 10 organisms per 100 ml Pristine mountain stream or lake
Clean Water 100 orgs per 100 ml Upper mountain of non-polluted stream
Moderate Water 1,000 orgs per 100 ml Lowland river with agricultural or treated sewage contribution (Up to 5,000 following rain)
Agricultural Dam with Cattle Pollution
Up to 10,000 orgs per 100 ml
Septic Tank Effluent 100,000 orgs per 100 ml
Raw Sewage 1,000,000 to 10,000,000 orgs per 100 ml
Table 7

23
State Environment Protection Policy (SEPP) Compliance
The State Environment Protection Policy (SEPP) Waters of Victoria (WoV) water quality objectives identify the
‘ideal’ result range for environmental data at a particular location in a waterway. If a site fails a SEPP objective
for one parameter, it indicates a possible problem for the whole system, not just for the one parameter and not
just for the one site). It is recommended that an ecological risk assessment (ERA) be undertaken to determine
if there is a risk to the values (or “beneficial uses”) associated with that stream.
Basically, any set of results that fails the objective is a red flag to look more closely at what’s going on. This
differs from aiming for a particular turbidity or total phosphorus result, as an ERA may determine that it is
acceptable to exceed the SEPP objectives for some parameters depending on the use/value of the waterway.
Figure 10: Goulburn Broken Catchment Management Authority - SEPP (WoV) segments
(EPA,2003).

24
State Environmental Protection Policy (Waters of Victoria) Environmental Quality Objectives for Rivers and Streams – water quality
The State Environment Protection Policy (Waters of Victoria) segment and objectives applicable within the Goulburn Broken CMA region for the tests of relevance
to the Howqua River and Running Creek are shown in Table 8. This table has been reproduced from the State Environment Protection Policy Waters of Victoria
(Victorian Environment Protection Authority, 2003).
SEGMENT
INDICATOR Total
phosphorus (ug/L)
Total nitrogen (ug/L)
Dissolved oxygen % saturation
Turbidity (NTU)
Electrical conductivity
(µS/cm)
pH (pH units)
75th percentile
75th percentile
25th percentile
maximum 75th percentile
75th percentile
25th percentile
75th percentile
Forests – B
• All area except Otways ≤25 ≤350 ≥90 110 ≤5 ≤100 ≥6.4 ≤7.7
Cleared Hills and Coastal Plains • mid-reaches of Ovens, Goulburn
and Broken catchments ≤25 ≤600 ≥85 110 ≤10 ≤500 ≥6.4 ≤7.7
• Delatite River at Tonga Bridge ≤25 ≤500 ≥85 110 ≤10 ≤500 ≥6.4 ≤7.7
• Goulburn River at Eildon ≤25 ≤600 ≥85 110 ≤10 ≤500 ≥6.4 ≤7.7
Table 8
Note: SEPP objectives are long term theoretical goals for water quality. It is not expected that waterways will comply at this stage

25
2009 results in the Howqua River (Table 9) to be compared to SEPP objectives– water quality (Table 8)
FAIL
Table 9
• When comparing with SEPP objectives, three quarters of the readings taken should fall below the 75th percentile.
• Both Howqua River sites monitored for total phosphorus meet the SEPP objective of ≤25 µg/L.
• All sites meet the SEPP objective of less than 10 NTU for turbidity, which is excellent considering that SEPP objectives are long term
theoretical goals for water quality.
• Both sites on Running Creek just exceed the SEPP guideline of 100 µS/cm for electrical conductivity.
• SEPP objectives are long term theoretical goals and it is not expected that waterways will comply with all objectives at this stage.
SEGMENT
INDICATOR Total
phosphorus (ug/L)
Total nitrogen (ug/L)
Dissolved oxygen % saturation
Turbidity (NTU)
Electrical conductivity ( µS/cm )
pH (pH units)
75th percentile
75th percentile 25th percentile maximum 75th percentile
75th percentile 25th percentile
75th percentile
HOW003 Howqua River d/s of Black Dog Creek 2 30
HOW005 Howqua River at Tunnel Bend 2 40
HOW006 Howqua River at Sheep Yard Flat 2 40
HOW007 Howqua River at Howqua Hills 2 40
HOW008 Howqua River at Fry’s Flat 20 2 40
HOW009 Howqua River u/s Running Ck. campground
2 50
RUN009 Running Creek upstream of Howqua campground
2 110
RUN010 Running Ck. d/s of Howqua campground 2 128
HOW016 Howqua R. at Terika 2 50
HOW020 Howqua R. at Jamieson Road bridge 20 93 110 3 50 6.8 7.4

26
Macro-invertebrates in Howqua River
Why do a Macro-invertebrate Survey? Macro-invertebrates are animals without backbones that live at least a part of their life in water. One reason for studying macro-invertebrates (or waterbugs) is that they can be useful indicators of the ecological health of freshwater habitats. Some aquatic invertebrates are more tolerant to pollution than others. If a stream is polluted, tolerant bugs will usually be found in larger numbers than the intolerant or sensitive ones. However, if a habitat is close to pristine, or in its natural state, tolerant types of bugs will be found alongside the more sensitive bugs which will be in equal or greater numbers than the tolerant. Sites and habitats within the Howqua River were assessed against the State Environmental Protection Policy – Waters of Victoria biological objectives for Forests B (B3). The site for 2009 is:
1. The Howqua River at Tunnelbend - Waterwatch code HOW005 For comparison, an EPA site has been included from 1997
1. Howqua River at ‘Terika’- Running Creek – EEW Separate assessments are made for riffle and edge habitats. In order to make a complete and accurate assessment of a site, the biological samples must be collected in both autumn and spring, and the invertebrate data from both seasons combined in the calculation of the indices. The indicators used to assess the health of the waterway are; Number of Families. The number of invertebrate families found at a site can give a reasonable representation of the ecological health of a stream as healthy streams generally have more families. The Number of Families index is calculated by simply summing the total ‘families’ of invertebrates present at a site. The SIGNAL biotic index. SIGNAL (Stream Invertebrate Grade Number- Average Level) is an index of water quality based on the tolerance of aquatic biota to pollution (Chessman 1995). It is calculated by summing together the sensitivity grades of each of the families found at a site that have been assigned a sensitivity grade, and then by dividing by the number of graded families present. The output is a single number, between zero and ten, reflecting the degree of water pollution. The EPT biotic index The EPT index is the total number of families in the generally pollution sensitive insect orders of Ephemeroptera (mayflies), Plecoptera (stoneflies) and Trichoptera (caddisflies). It is calculated by summing together the number of families in these three orders present at a site. Any loss of families in these groups usually indicates disturbance. Key Invertebrate Families This index focuses mainly on the loss of key taxa that are indicative of good habitat and water quality. To calculate the Key Families index, simply compare the list of families present at a site with the appropriate list of key families as specified in the State Environmental Protection Policy (Waters of Victoria). The key families score is the total number of these key families present at a site.

27
1. Results The objectives for biological indicators of environmental quality are given for each of the biological regions and habitats covered by this report. To meet objectives, sites assessed must return values equal to or greater than the values given in Table 10. Three out of four objectives should be met for region B3 for SEPP compliance. Failure of a site to meet one of the four objectives for region B3 is considered an alert; however an overall pass is given to the site. Table 10 Objectives for biological indicators of environmental quality as listed in the SEPP WoV (Victorian Environmental Protection Authority 2003)
Indicators
Region & Habitat
No of Families SIGNAL index score
EPT index score
Key families combined habitat
B3 riffle 23 6.0 10 26 B3 edge 24 5.8 9 26
Table 11 Biotic indices results for one site in the Goulburn Broken Waterwatch Program 2008 and 2009 assessed against SEPP WoV objectives for biological indicators of environmental quality. Site code/
year Site location Biological
Region Habitat Number
of families score
SIGNAL index score
EPT Key Families
Combined Habitat score
Site Pass Fail
HOW005 2008
Howqua River at Tunnel Bend
B3 Riffle 27 6.5 11 40 Pass
HOW005 2009
Howqua River at Tunnel Bend
B3 Riffle 29 6.6 11 33 Pass
HOW005 2008
Howqua River at Tunnel Bend
B3 Edge 32 6.8 16 40 Pass
HOW005 2009
Howqua River at Tunnel Bend
B3 Edge 23 6.4 10 33 Pass
EEW 1997
Howqua River at ‘Terika’
B3 Riffle 32 6.5 14 NR Pass
EEW 1997
Howqua River at ‘Terika’
B3 Edge 36 6.7 15 NR Pass
Fail 2. Discussion
• 2009 shows Howqua River passes all four of the SEPP biological objectives for the riffle sample.
• The edge sample fails the Number of families score, with 23 Families (minimum is 24), however, as this site is only required to meet three out of four indices, the site still passes overall for 2009.
A comprehensive macro-invertebrate report is available by contacting Goulburn Broken Waterwatch on phone 5832 0460, or by email to [email protected] .

28
Summary for the Howqua River
Results for the Howqua River and Running Creek in 2009 show that;
• Turbidity results are very low and meet SEPP objectives which is excellent considering
these are long term theoretical goals, and it is not expected waterways will meet
these guidelines yet.
• Electrical conductivity results also continue to be excellent in the Howqua River.
• Although electrical conductivity results are higher in Running Creek, these results are
still good results, and only just exceed the SEPP long term theoretical objective.
• Total Phosphorus levels continue to be rated as “Good” and also meet the SEPP
objective.
• With the exception of Running Creek upstream of the campground (RUN009), all sites
meet the SEPP guidelines for primary contact, such as swimming.
• Macro-invertebrates passed at the Howqua River site when assessed against SEPP WoV
objectives for biological indicators of environmental quality
Similar sampling sites are recommended for 2010, and a continuation of the reduced
sampling program for total phosphorus, to add to the baseline data set and help establish
what sort of concentrations should be expected in this waterway in “Normal” conditions.
Data collected from Howqua River at Jamieson Road bridge (HOW020) during 2009 was
forwarded to the Department of Sustainability and Environment for inclusion in the 2009
Index of Stream Condition Assessment. The Department approached Waterwatch Victoria in
2008 to assist in the collection of water quality data to assist with this Assessment, which is
carried out every five years. Goulburn Broken Waterwatch had 47 sites within our
catchments being included in this project.
These results have so far been distributed to
• Goulburn Broken Catchment Management Authority
• Waterwatch State Office
• DSE

29
References
EPA (2003) Goulburn Broken Catchment Management Authority SEPP (WoV) Segments and
environmental quality objectives. Environment Protection Authority, Macleod.
GBCMA (2005). Regional River Health Strategy 2005-2015. Goulburn Broken Catchment Management
Authority, Shepparton.
GBCMA (2005). Regional River Health Strategy 2005-2015. Status of the Riverine System – Regional
Overview. Goulburn Broken Catchment Management Authority, Shepparton.
Tiller, D. and Newall, P. (2009). Interpreting River Health Data – Waterwatch Victoria. Mulqueen
Printers Pty Ltd.
World Health Organisation Drinking Water Guidelines (2006) . Website
http://www.searo.who.int/EN/Section314_4295.htm
Glossary DO Dissolved Oxygen – a measure of the concentration of oxygen in the water EC Electrical Conductivity – measures the flow of electricity in a solution in µS/cm EPA Environment Protection Authority EPT Ephemeroptera, Plecoptera and Trichoptera GBCMA Goulburn Broken Catchment Management Authority ISC Index of Stream Condition Median Numbers in a series are sorted into ascending order, and the middle number is the median Mean Average calculated by adding all data points and dividing by the number of data points pH Acidity or alkalinity of the water – 0 being acidic, 14 being alkaline Photosynthesis Process where plants produce oxygen during daylight hours Respiration Process where plants consume oxygen during non daylight hours RRHS Regional River Health Strategy SEPP State Environment Protection Policy SIGNAL Stream Invertebrate Grade Level Turbidity A measure of the clarity of water, measured in NTU

30
Appendix A
Howqua Report For Samples from 01 Jan 2009 to 31 Dec 2009 SiteNo: HOW003 Howqua River d/s of Black Dog Creek Parameters: Temp TPhos EC Turb Tcolif Ecoli pH Flow % O2 Sat DO Date: Time: Sample Type: ° C mg/L P µS/cm NTU orgs/100 orgs/100 pH Units ML/day % mg/L mL mL
21-Jan-09 12:00 PM Grab 20 30 2 >2420 73 17-Feb-09 11:00 AM Grab 16 40 2 >2420 23 25-Mar-09 1:20 PM Grab 16 40 2 >2420 84 20-May-09 1:20 PM Grab 8 30 1 1733 2 17-Jun-09 1:50 PM notsam 22-Jul-09 1:35 PM Grab 8.2 30 2 1046 4 20-Aug-09 12:00 PM Grab 7.1 30 2 1300 3 medhigh 23-Sep-09 10:30 AM Grab 9.9 30 2 2420 6 mediu 28-Oct-09 11:20 AM Grab 11.5 30 2 1986 2 mediu 26-Nov-09 12:00 PM Grab 11.7 30 2 >2420 45 mediu 22-Dec-09 9:15 AM Grab 14.8 30 2 >2420 32 low
SiteNo: HOW005 Howqua River at Tunnel Bend Parameters: Temp TPhos EC Turb Tcolif Ecoli pH Flow % O2 Sat DO Date: Time: Sample Type: ° C mg/L P µS/cm NTU orgs/100 orgs/100 pH Units ML/day % mg/L mL mL
21-Jan-09 12:45 PM Grab 22 40 2 >2420 17 17-Feb-09 11:50 AM Grab 18 40 2 >2420 13 25-Mar-09 2:00 PM Grab 16 40 2 >2420 61 16-Apr-09 11:45 AM Grab 10 40 1 1203 13 30-Apr-09 2:00 PM Grab 7.5 39 1 6.4 20-May-09 2:00 PM Grab 8 30 1 2420 3 17-Jun-09 2:00 PM Grab 5.3 30 2 1300 2 med 22-Jul-09 2:15 PM Grab 8.5 30 866 2 medhigh 20-Aug-09 1:30 PM Grab 7.9 30 2 1120 2 medhigh 23-Sep-09 11:45 AM Grab 9.9 30 2 2420 3 mediu 28-Oct-09 12:10 PM Grab 13.6 30 2 1986 0 mediu 26-Nov-09 12:00 PM Grab 12.5 0.02 30 2 mediu 30-Nov-09 9:30 AM Grab 13.4 30 8 6.6 steady 90 9.3 22-Dec-09 10:25 AM Grab 17.3 30 2 >2420 45 low Report Date: 03 Jun 2010Field60: 1 of 5 Pages.

31
Waterwatch Victoria Application (WVA) - Site Report
SiteNo: HOW006 Howqua River at Sheep Yard Flat Parameters: Temp TPhos EC Turb Tcolif Ecoli pH Flow % O2 Sat DO Date: Time: Sample Type: ° C mg/L P µS/cm NTU orgs/100 orgs/100 pH Units ML/day % mg/L mL mL
21-Jan-09 12:55 PM Grab 23 40 2 >2420 38 17-Feb-09 11:55 AM Grab 19 40 2 >2420 54 25-Mar-09 2:10 PM Grab 17 40 2 >2420 72 16-Apr-09 12:00 PM Grab 10 40 1 >2420 22 20-May-09 2:10 PM Grab 8 30 1 1300 9 17-Jun-09 2:10 PM Grab 4.8 30 2 1300 4 med 22-Jul-09 2:25 PM Grab 8.6 30 2 687 4 medhigh 20-Aug-09 1:40 PM Grab 7.9 30 2 1046 1 medhigh 23-Sep-09 12:30 PM Grab 9.9 30 2 1986 16 mediu 28-Oct-09 12:46 PM Grab 13.6 30 2 1986 4 mediu 26-Nov-09 12:00 PM Grab 12.5 30 2 mediu 22-Dec-09 10:40 AM Grab 17.7 30 2 >2420 41 low
SiteNo: HOW007 Howqua River at Howqua Hills d/s of Blackbird Creek Parameters: Temp TPhos EC Turb Tcolif Ecoli pH Flow % O2 Sat DO Date: Time: Sample Type: ° C mg/L P µS/cm NTU orgs/100 orgs/100 pH Units ML/day % mg/L mL mL
21-Jan-09 1:55 PM Grab 24 40 2 >2420 37 17-Feb-09 12:25 PM Grab 20 40 2 2420 27 25-Mar-09 2:30 PM Grab 17 50 3 >2420 138 16-Apr-09 12:30 PM Grab 10 40 1 >2420 23 20-May-09 2:35 PM Grab 9 40 1 1986 12 17-Jun-09 2:30 PM Grab 6.4 50 2 1414 1 med 22-Jul-09 2:55 PM Grab 8.7 40 2 980 8 medhigh 20-Aug-09 2:10 PM Grab 8.6 40 1203 4 medhigh 23-Sep-09 2:00 PM Grab 10.1 30 2 >2420 16 mediu 28-Oct-09 1:22 PM Grab 13.8 40 2 mediu 26-Nov-09 12:00 PM Grab 13.0 30 2 mediu 22-Dec-09 11:25 AM Grab 18.3 40 2 >2420 51 low Report Date: 03 Jun 2010Field60: 2 of 5 Pages.

32
Waterwatch Victoria Application (WVA) - Site Report
SiteNo: HOW008 Howqua River at Fry's Flat Parameters: Temp TPhos EC Turb Tcolif Ecoli pH Flow % O2 Sat DO Date: Time: Sample Type: ° C mg/L P µS/cm NTU orgs/100 orgs/100 pH Units ML/day % mg/L mL mL
21-Jan-09 1:05 PM Grab 23 <0.02 40 2 >2420 32 17-Feb-09 12:05 PM Grab 19 0.02 40 2 >2420 41 25-Mar-09 2:20 PM Grab 17 <0.02 40 2 >2420 276 16-Apr-09 12:10 PM Grab 10 40 1 >2420 167 20-May-09 1:20 PM Grab 8 <0.02 30 1 1553 11 17-Jun-09 2:20 PM Grab 5.2 <0.02 30 2 1414 6 med 22-Jul-09 2:40 PM Grab 8.7 <0.02 30 2 727 15 medhigh 20-Aug-09 1:55 PM Grab 8.2 30 2 1046 1 medhigh 23-Sep-09 1:25 PM Grab 9.9 30 2 >2420 11 mediu 28-Oct-09 1:05 PM Grab 13.7 30 2 1986 9 mediu 26-Nov-09 12:00 PM Grab 13.0 0.02 30 2 mediu 22-Dec-09 11:00 AM Grab 18.5 40 2 >2420 69 low
SiteNo: HOW009 Howqua River upstream of the Running Creek Campground Parameters: Temp TPhos EC Turb Tcolif Ecoli pH Flow % O2 Sat DO Date: Time: Sample Type: ° C mg/L P µS/cm NTU orgs/100 orgs/100 pH Units ML/day % mg/L mL mL
21-Jan-09 10:12 AM Grab 21 2 >2420 51 18-Feb-09 8:30 AM Grab 20 50 2 1733 32 18-Mar-09 1:00 PM Grab 15 51 2 >2420 82 7.6 15-Apr-09 8:00 AM Grab 10 50 1 921 23 20-May-09 8:45 AM Grab 7 40 1 15-Jul-09 9:50 AM Grab 7.8 40 1 866 11 strong 16-Sep-09 9:40 AM Grab 8.3 50 1 2420 15 strong Report Date: 03 Jun 2010Field60: 3 of 5 Pages.

33
Waterwatch Victoria Application (WVA) - Site Report
SiteNo: HOW016 Howqua River at Flow Gauging Station at Terika Parameters: Temp TPhos EC Turb Tcolif Ecoli pH Flow % O2 Sat DO Date: Time: Sample Type: ° C mg/L P µS/cm NTU orgs/100 orgs/100 pH Units ML/day % mg/L mL mL
21-Jan-09 10:43 AM Grab 22 2 >2420 46 18-Feb-09 9:05 AM Grab 20 50 2 >2420 70 15-Apr-09 8:35 AM Grab 10 60 1 >2420 59 20-May-09 9:10 AM Grab 7 40 1 980 36 15-Jul-09 10:20 AM Grab 8.0 40 1 365 11 strong 16-Sep-09 10:20 AM Grab 8.8 50 1 1986 11 strong 17-Dec-09 1:00 PM Grab 22.7 43 1 2420 5 7.9 low
SiteNo: HOW020 Howqua River at Jamieson Road Bridge Parameters: Temp TPhos EC Turb Tcolif Ecoli pH Flow % O2 Sat DO Date: Time: Sample Type: ° C mg/L P µS/cm NTU orgs/100 orgs/100 pH Units ML/day % mg/L mL mL
21-Jan-09 2:05 PM Grab 27 0.02 46 2 >2420 49 7.6 21-Jan-09 11:00 AM Grab 22 3 17-Feb-09 12:40 PM Grab 22 0.02 48 3 6.9 110 9.7 18-Feb-09 9:30 AM Grab 20 <0.02 50 2 >2420 91 18-Mar-09 12:40 PM Grab 17 0.007 52 2 >2420 110 7.1 109 10 14-Apr-09 2:20 PM Grab 17 <0.005 50 1 6.8 104 10 15-Apr-09 8:50 AM Grab 10 60 1 1986 137 Report Date: 03 Jun 2010Field60: 4 of 5 Pages.

34
Waterwatch Victoria Application (WVA) - Site Report Parameters: Temp TPhos EC Turb Tcolif Ecoli pH Flow % O2 Sat DO Date: Time: Sample Type: ° C mg/L P µS/cm NTU orgs/100 orgs/100 pH Units ML/day % mg/L mL mL 20-May-09 1:20 PM Grab 8 0.03 42 1 1553 109 6.5 83 8.9 16-Jun-09 10:30 AM Grab 12 0.008 50 3 7.1 90 10 15-Jul-09 10:40 AM Grab 8.2 40 1 210 15 strong 15-Jul-09 9:20 AM Grab 12 0.02 50 3 7.3 95 11 31-Aug-09 10:20 AM Grab 11 0.007 50 2 7.2 98 12 13-Sep-09 2:40 PM Grab 11.8 0.0082 41 3.7 6.8 16-Sep-09 10:45 AM Grab 9.5 50 1 1553 19 strong 26-Oct-09 7:10 PM Grab 0.007 45 3.3 6.3 27-Nov-09 3:00 PM Grab 20.0 0.02 47 3 7.8 modera 17-Dec-09 1:20 PM Grab 22.9 0.02 43 2 >2420 21 7.8 low
SiteNo: RUN009 Running Creek u/s of Campground at Howqua Parameters: Temp TPhos EC Turb Tcolif Ecoli pH Flow % O2 Sat DO Date: Time: Sample Type: ° C mg/L P µS/cm NTU orgs/100 orgs/100 pH Units ML/day % mg/L mL mL
21-Jan-09 9:55 AM Grab 16 2 308 308 18-Feb-09 8:05 AM Grab 16 110 1 >2420 >2420 18-Mar-09 1:30 PM Grab 14 51 2 >2420 161 7.4 15-Apr-09 7:40 AM Grab 7 120 1 >2420 308 20-May-09 8:20 AM Grab 8 110 1 1733 32 15-Jul-09 9:30 AM Grab 8.5 100 1 1203 5 strong 16-Sep-09 9:20 AM Grab 8.1 100 1 1733 66 strong
SiteNo: RUN010 Running Creek below Campground at Howqua Parameters: Temp TPhos EC Turb Tcolif Ecoli pH Flow % O2 Sat DO Date: Time: Sample Type: ° C mg/L P µS/cm NTU orgs/100 orgs/100 pH Units ML/day % mg/L mL mL
21-Jan-09 10:02 AM Grab 16 2 >2420 416 18-Feb-09 8:20 AM Grab 17 120 1 >2420 96 18-Mar-09 1:35 PM Grab 15 162 >2420 435 7.3 15-Apr-09 7:50 AM Grab 8 130 1 1300 5 20-May-09 8:35 AM Grab 8 110 1 2420 24 15-Jul-09 9:40 AM Grab 8.2 110 1 435 10 strong 16-Sep-09 9:30 AM Grab 8.1 100 1 >2420 104 strong Report Date: 03 Jun 2010Field60: 5 of 5 Pages.