How will restaurants adapt and succeed in a world without...
102
How will restaurants adapt and succeed in a world without plastics? by Shea O’Neil Bachelor of Environmental Geography, Simon Fraser University, 2014 Project Submitted in Partial Fulfillment of the Requirements for the Degree of Master of Urban Studies in the Urban Studies Program Faculty of Arts and Social Sciences © Shea O’Neil 2019 SIMON FRASER UNIVERSITY Fall 2019 Copyright in this work rests with the author. Please ensure that any reproduction or re-use is done in accordance with the relevant national copyright legislation.
Transcript of How will restaurants adapt and succeed in a world without...

How will restaurants adapt and succeed in a world
without plastics?
by
Shea O’Neil
Bachelor of Environmental Geography, Simon Fraser University, 2014
Project Submitted in Partial Fulfillment of the
Requirements for the Degree of
Master of Urban Studies
in the
Urban Studies Program
Faculty of Arts and Social Sciences
© Shea O’Neil 2019
SIMON FRASER UNIVERSITY
Fall 2019
Copyright in this work rests with the author. Please ensure that any reproduction or re-use is done in accordance with the relevant national copyright legislation.

ii
Approval
Name: Shea O’Neil
Degree: Master of Urban Studies
Title: How will restaurants adapt and succeed in a world without plastics?
Examining Committee: Chair: Meg Holden Professor of Urban Studies, Simon Fraser University
Peter V. Hall Senior Supervisor Professor of Urban Studies, Urban Studies, Simon Fraser University
Anthony Perl Supervisor Professor of Urban Studies and Political Science, Simon Fraser University
Karen Storry External Examiner Senior Project Engineer, Zero Waste Implementation Solid Waste Services Metro Vancouver
Date Defended/Approved: December 16, 2019

iii
Ethics Statement

iv
Abstract
Plastic pollution is an escalating global issue, prompting many national and local
governments to take action on single-use plastic items; however, many of these
strategies impact small restaurants. This research paper considers the City of
Vancouver’s Single-Use Item Reduction Strategy (SUIRS) in terms of potential
impacts on small restaurants in the West End neighbourhood. It examines types of
packaging materials used, factors that affect whether a restaurant uses sustainable
packaging, and the motivations and barriers for doing so. Data was gathered through
a questionnaire and conversations with restaurant owners and managers. Over half of
respondents identified management values as the primary reason for adopting
sustainable packaging, and nearly a quarter of respondents identified cost as a key
barrier. Although small restaurants face significant barriers, there are opportunities for
local government interventions to inspire innovation and collaboration to assist in the
transition away from single-use items in the restaurant industry.
Keywords: sustainability; restaurant; zero waste; single-use item; packaging;
corporate environmental responsibility

v
Dedication
I dedicate this thesis to both all the hardworking small restaurant owners in Vancouver
who keep our local economy thriving and to all those that are doing their part to take
action on climate change.

vi
Acknowledgements
This research would not have been possible without the participation of the small
restaurants in the West End Neighbourhood. Many owners, managers, and other staff
members took a good portion of time to fully answer any questions I had and, in some
cases, provided additional information that helped shape my research.
I would not have been able to complete this paper without the support and guidance
from my supervisor Dr. Peter Hall who has helped guide my research over the past
several years and keep me on track.
Thank you to those who supported me with their consultation and advice on my
proposed methodology and survey questions: Stephen Regan, Landon Hoyt, Wes
Regan, Amelia Huang, Jessica Carson, Andy Nguyen and Chenoa Robertson. Thank
you to Hollie O’Halloran for your guidance using GIS and creating the maps used in my
thesis.
A special thank you to a few friends and family who helped me distribute and collect
surveys on several occasions: Barb and Paul O’Neil, Aimee Flemmer, and Kayleigh
Wilder and to all my friends and family for their continued support.

vii
Table of Contents
Approval .......................................................................................................................... ii
Ethics Statement ............................................................................................................ iii
Abstract .......................................................................................................................... iv
Dedication ....................................................................................................................... v
Acknowledgements ........................................................................................................ vi
Table of Contents .......................................................................................................... vii
List of Tables .................................................................................................................. ix
List of Figures................................................................................................................. xi
List of Acronyms ............................................................................................................ xii
Chapter 1. Introduction .............................................................................................. 1
1.1. Research Question and Significance ..................................................................... 4
Chapter 2. The Single-Use Item Problem .................................................................. 6
2.1. The Global Context ................................................................................................ 6
2.2. The Local Context ................................................................................................. 8
2.3. The Small Business Problem ............................................................................... 12
2.3.1. The rise in property tax for small business ................................................... 12
2.3.2. Stability in Vancouver’s small restaurant scene ........................................... 13
Chapter 3. Cities, Sustainable Business, and Local Government Policy Interventions ...................................................................................................... 15
3.1. Corporate Environmental Responsibility .............................................................. 15
3.2. Sustainable Local Economic Development .......................................................... 18
3.2.1. The Business Costs of Going Green ............................................................ 18
3.2.2. Small business and the local economy ........................................................ 21
3.3. Local Government Policy Interventions ................................................................ 22
3.4. Inferences from the literature ............................................................................... 25
Chapter 4. Methodology ........................................................................................... 26
4.1. Restaurant Sample .............................................................................................. 26
4.2. Data Collection .................................................................................................... 27
4.2.1. Qualitative Data Collection........................................................................... 30
4.2.2. Observation Data ......................................................................................... 31
4.3. Survey Content and Data .................................................................................... 32
4.4. Language ............................................................................................................ 35
4.5. Data entry and cleaning ....................................................................................... 36
4.6. Validity and reliability of methods ......................................................................... 36
Chapter 5. Sustainable Packaging .......................................................................... 38
5.1. Defining Sustainable Packaging .......................................................................... 38
5.2. Types of packaging materials and products ......................................................... 39
Chapter 6. Factors affecting packaging materials ................................................. 41

viii
6.1. Cuisine Type ....................................................................................................... 41
6.2. Entrée price ......................................................................................................... 44
6.3. Size of restaurant ................................................................................................ 45
6.4. Ownership model ................................................................................................. 46
6.5. Green Marketing .................................................................................................. 48
6.6. Primary languages spoken in-house .................................................................... 50
6.7. Restaurant take-out culture ................................................................................. 54
6.7.1. Use of restaurant delivery services .............................................................. 55
6.7.2. Restaurant design – “designed for eat-in or take-out” .................................. 57
6.7.3. Ordering style .............................................................................................. 59
6.8. Quantitative findings ............................................................................................ 60
Chapter 7. Motivations and Barriers ....................................................................... 62
7.1. Motivations for choosing sustainable packaging .................................................. 62
7.2. The barriers to using sustainable packaging ........................................................ 65
Chapter 8. Conclusions and Recommendations for Future Studies .................... 69
8.1. Limitations ........................................................................................................... 69
8.2. Conclusions: ........................................................................................................ 70
8.2.1. Barriers ........................................................................................................ 70
8.2.2. Opportunities ............................................................................................... 71
8.3. Recommendations for future studies ................................................................... 72
Appendix I. Survey ................................................................................................. 75
Appendix II. Themes from comments and notes on motivations for choosing sustainable packaging ...................................................................................... 77
Appendix III. Themes from comments and notes on barriers to choosing sustainable packaging ...................................................................................... 78
Appendix IV. Quantitative Data Analysis ................................................................... 80
References ................................................................................................................... 81

ix
List of Tables
Table 1 Number of restaurants closed since January 2019 ........................................... 14
Table 2 Significant relationships between restaurants I went to and didn't..................... 30
Table 3 Data collection methods ................................................................................... 31
Table 4 Hypotheses that guided the questionniare ........................................................ 34
Table 5 Type of cuisine by dataset ................................................................................ 42
Table 6 Percentage of SUI/Styrofoam use among top cuisine types from questionnaire43
Table 7 Relationship between South Asian cuisine type and Styrofoam from questionnaire ......................................................................................... 43
Table 8 Percentage of SUI/Styrofoam use among top cuisine types from observed data ............................................................................................................... 44
Table 9 Percentage of restaurants using Styrofoam and SUI based on average entree price from questionnaire ......................................................................... 44
Table 10 Relationship between average entree price and SUI from questionnaire ........ 45
Table 11 Relationship between average entree price and Styrofoam from questionnaire ............................................................................................................... 45
Table 12 Percentage of SUI/Styrofoam use among restaurants of different sizes from questionniare data .................................................................................. 46
Table 13 Percentage of SUI/Styrofoam use among restaurants of different sizes from observed data ........................................................................................ 46
Table 14 Percentage of independent and chain/franchise restaurants using SUI and Styrofoam from questionnaire ................................................................ 47
Table 15 Percentage of independent and chain/franchise restaurants using SUI and Styrofoam from observed data ............................................................... 47
Table 16 Relationship between ownership model and Styrofoam within the questionnaire ............................................................................................................... 48
Table 17 Observed relationship between ownership model and Styrofoam ................... 48
Table 18 Relationship between describing the restaurant as green/sustainable and SUI’s ............................................................................................................... 50
Table 19 Relationship between describing the restaurant as green/sustainable and Styrofoam............................................................................................... 50
Table 20 Spanish as the primary language used in-house vs other languages and use of SUI’s ...................................................................................................... 52
Table 21 Spanish as the primary language used in-house vs other languages and use of Styrofoam............................................................................................... 52
Table 22 Indian (Punjabi or Hindi) as the primary language used in-house vs other languages and use of SUI’s ................................................................... 52
Table 23 Indian (Punjabi or Hindi) as the primary language used in-house vs other languages and use of Styrofoam ............................................................ 52
Table 24 Chinese as the primary language used in-house vs other languages and use of SUI and Styrofoam ................................................................................. 53

x
Table 25 Chinese as the primary language used in-house vs other languages and use of Styrofoam............................................................................................... 53
Table 26 English as a primary language used in-house and use of SUI and Styrofoam 53
Table 27 English as a primary language used in-house and use of SUI's ...................... 54
Table 28 Percentage of restaurants surveyed that use Styrofoam and SUI and are designed for take-out, use delivery services, or have counter-only ordering from questionnaire ................................................................... 54
Table 29 Number of restaurants using delivery services from questionnaire and observed data ........................................................................................ 55
Table 30 Relationship between the use of delivery service and SUI from questionniare 56
Table 31 Relationship between the use of delivery service and Styrofoam from questionnaire ......................................................................................... 56
Table 32 Observed Relationship between the use of delivery service and SUI.............. 57
Table 33 Observed Relationship between the use of delivery service and Styrofoam ... 57
Table 34 Criteria for visually identifying restaurant design ............................................. 58
Table 35 Relationship between restaurant designed for take out and SUI from questionnaire ......................................................................................... 58
Table 36 Observed between restaurants designed for take-out and SUI ....................... 59
Table 37 Relationship between average entrée price over $25 and restaurants that only have doggy bag take-away options ........................................................ 59
Table 38 Relationship between ordering style and restaurant design for all restaurants 60
Table 39 Ordering style for Styrofoam and SUI from questionnaire ............................... 60
Table 40 Observed ordering style for Styrofoam and SUI from ...................................... 60
Table 41 Comments and notes from questionnaire respondents on motivations for choosing sustainable packaging ............................................................. 77
Table 42 Comments and notes from questionnaire respondents on barriers to choosing sustainable packaging ............................................................................ 78
Table 43 Questionnaire data on languages spoken in-house ........................................ 80

xi
List of Figures
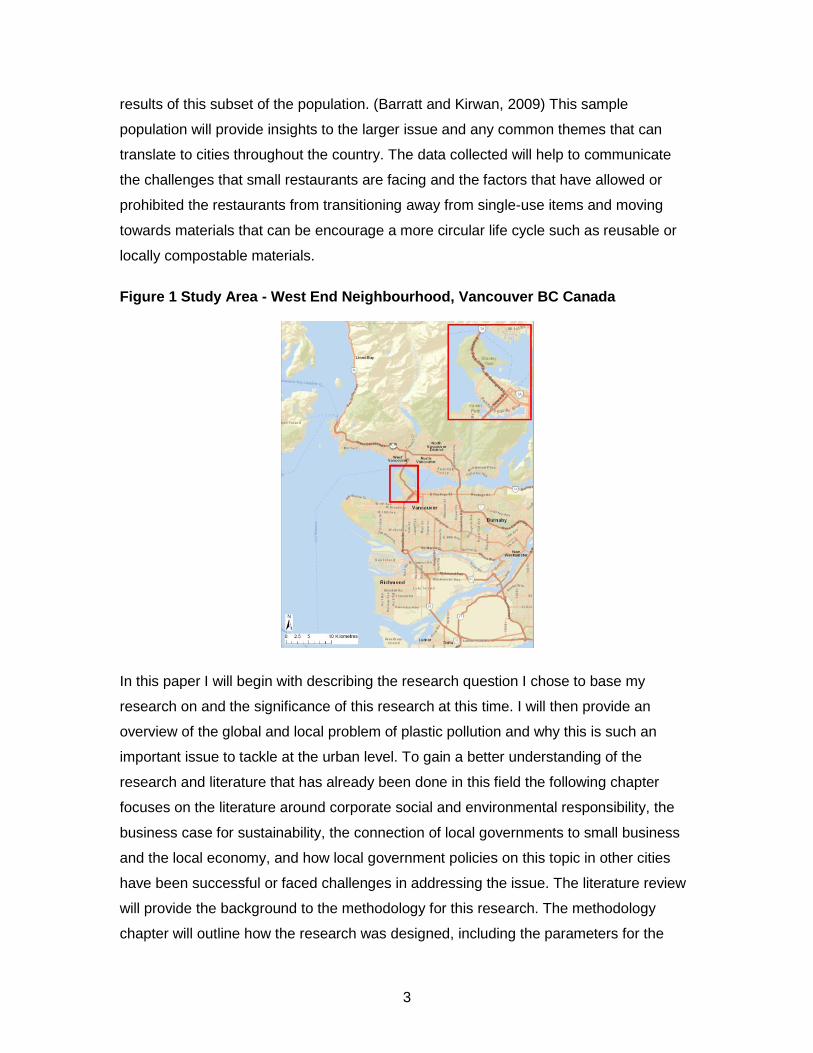
Figure 1 Study Area - West End Neighbourhood, Vancouver BC Canada ....................... 3
Figure 2 Sample size of 156 restaurants used for distributing questionnaire ................. 27
Figure 3 Restaurants visited during questionnaire distribution ....................................... 29
Figure 4 Titles of Survey Respondents .......................................................................... 33
Figure 5 Representation of primary languages spoken in-house ................................... 35
Figure 6 Materials used for packaging in small restaurants in the West End from questionnaire ......................................................................................... 39
Figure 7 Packaging items used in small restaurants in the West End from survey ........ 40
Figure 8 Restaurant size from survey data and observed data ...................................... 45
Figure 9 Reasons for using sustainable materials ......................................................... 63
Figure 10 Reasons for not choosing sustainable materials ............................................ 66
xii
List of Acronyms
CER
CSR
MSW
Mt
SUI
SUIRS
WEBIA
Corporate Environmental Responsibility
Corporate Social Responsibility
Municipal Solid Waste
Metric tonnes
Single-Use Item
Single-Use Item Reduction Strategy
West End Business Improvement Association

xiii

1
Chapter 1. Introduction
Plastic waste is a global issue that cities, regions, and nations around the world are
attempting to address. Stunning amounts of used and discarded plastics are being found
in oceans, sea life, and in nature, and governments are realizing the weight of this global
issue and the responsibility they bear to find solutions. (Howard et al, 2019) Ocean
health has been a major topic at key climate conferences throughout the past several
years and at the G20 and G7 meetings. (Obayashi, 2019) Although there is a need for
national and global regulation for the largest contributors to this waste; large
corporations using and manufacturing plastic items that are difficult to reuse or recycle,
municipalities are ultimately collecting a large proportion of this waste on a local level
after it makes its way to the consumer. Municipalities are seeing firsthand the effects of
plastic pollution in their cities and are taking action across the world, including in
Vancouver.
In June 2018, Vancouver City Council took local action and passed the Zero Waste
2040 strategy which included the Single-Use Item Reduction Strategy – a plan to
eliminate single-use plastics in Vancouver. The Zero Waste 2040 plan has the goal of
making Vancouver a zero-waste city by the year 2040 by reducing and eliminating waste
through lifestyle choices, business practices, and community engagement through public
policy, and recycling and recovery programs. A key outcome of this strategy was through
innovations in public policy that led to the Single-Use Item Reduction Strategy (SUIRS).
The SUIRS included a council-approved ban on polystyrene take-out containers and
plastic straws beginning June 2019, and reduction requirements for plastic bags and
other take-out materials by 2021 as well as several other measures to reduce plastic
waste. (City of Vancouver, 2018)
Shortly before the original date of the ban on polystyrene and plastic straws of June 1st
2019, Vancouver City Staff brought a recommendation to council to delay the
implementation of the ban based on consultation with the public and small businesses
and a sense that there was not enough time to adjust to the new by-laws. (City of
Vancouver, 2019)

2
In 2018 there were 1.13 billion SUI’s disposed of in Metro Vancouver. In a study
commissioned by Metro Vancouver, the composition of disposed SUI’s were broken
down into several categories: retail bags (256 million items), cups (262,000,000 items),
takeout containers (179 million items), and utensils (331 million items). Additionally, a
total of 102 million straws were disposed of with only 300,000 being paper. (Metro
Vancouver, 2019) Within these categories the number of SUI’s was also separated
between single family (SF) and multi-family (MF) homes and commercial/industrial (C/I)
waste. In SF and MF homes retail bags, which includes paper, plastic and compostable
bags, in Commercial and industrial buildings utensils were the most prevalent single-use
items (135.2 million). The Vancouver SUIRS will impact 10,000 businesses in Vancouver
currently purchasing and distributing single-use plastics and a significant number of
them are restaurants. (City of Vancouver, 2017)
When implementing sustainability policies, it is important to consider the impacts on
industry and businesses. Although the Zero Waste 2040 strategy is aggressive and aims
to tackle the issue of plastic waste on a local level, it could have consequential impacts
on our local economy.
My research focused on a small portion of business that makes up the local economy;
small and independent restaurants in the West End neighbourhood of Vancouver (see
Figure 1). This sample population leaves out large corporate chains such as McDonalds
and Starbucks who are the big emitters of waste and specifically single-use items and
focuses on small restaurants who generate much less waste in comparison. The
reasoning for focusing this study on small businesses and not large chains is to
investigate and provide recommendations on how local governments can help small
businesses adapt to sustainable practices and thrive as opposed to being given the
same regulations as chains with no additional support.
Although small businesses in the West End is only a small group that is being studied, it
provided a good picture of the local restaurant scene in one area that features many
different types of restaurant. While it would be ideal to have a large sample population of
several neighbourhoods in Vancouver, or indeed across the country, this would require a
significant amount of resources and time. Since the study specifically related to a policy
in Vancouver, I chose to use a target population. This sampling method as an alternative
to surveying an entire population allows for the ability to infer information based on the
3
results of this subset of the population. (Barratt and Kirwan, 2009) This sample
population will provide insights to the larger issue and any common themes that can
translate to cities throughout the country. The data collected will help to communicate
the challenges that small restaurants are facing and the factors that have allowed or
prohibited the restaurants from transitioning away from single-use items and moving
towards materials that can be encourage a more circular life cycle such as reusable or
locally compostable materials.
Figure 1 Study Area - West End Neighbourhood, Vancouver BC Canada
In this paper I will begin with describing the research question I chose to base my
research on and the significance of this research at this time. I will then provide an
overview of the global and local problem of plastic pollution and why this is such an
important issue to tackle at the urban level. To gain a better understanding of the
research and literature that has already been done in this field the following chapter
focuses on the literature around corporate social and environmental responsibility, the
business case for sustainability, the connection of local governments to small business
and the local economy, and how local government policies on this topic in other cities
have been successful or faced challenges in addressing the issue. The literature review
will provide the background to the methodology for this research. The methodology
chapter will outline how the research was designed, including the parameters for the

4
survey sample and design of the questionnaire, as well as the data collection and the
data entry.
1.1. Research Question and Significance
My research is focused specifically on the restaurant industry due to the amount of
packaging that is used in the food and beverage industry and the relevance the local
industry has with the City of Vancouver’s Single-Use Item Reduction Strategy. I chose to
focus on small restaurant businesses because I believe that they face the most
challenges as far as implementing new sustainability policies or changes while retaining
staff and paying rent and property taxes. To address this issue of the use of single-use
items in small restaurants, I developed a question to guide my research and reach
conclusions that will allow other restaurants and local governments to create policies
that will both help the local economy and improve sustainability within the small
restaurant industry. The question that was developed to guide this research is:
Following Vancouver’s adoption of a Single-Use Item Reduction Strategy, which are the small restaurants that have managed to eliminate single-use plastics and how have they successfully transitioned to using more sustainable food packaging while continuing to remain economically viable?
Over the next several years the City of Vancouver’s SUIRS will be implemented and will
have an impact on thousands of local businesses. Although this is a significant step to
tackling plastic waste in Vancouver, it is also a policy that could hinder small business
owners through policies such as a ban on polystyrene, straws, plastic bags, and fees on
disposable cups These entities contribute to the economic diversity of our
neighbourhoods creating more liveable and vibrant communities; thus, it is important to
ensure these businesses are not just complying with these new regulations but can
thrive simultaneously.
Many of the businesses in Vancouver that will be affected by these new regulations are
not stand-alone but relate to larger organizations and may have multiple locations in
Metro Vancouver, Canada, or internationally. This makes local government policies
more complicated for businesses if they have different regulations to comply with based
on the city their business is located in. Metro Vancouver regional authority has
announced it is working on a region-wide single-use item toolkit that will provide

5
guidance on how to tackle similar issues and attempt to address this issue for
businesses. Other municipalities are looking at bringing forward similar strategies or
policies within the strategy such as acting on plastic bags and Styrofoam use.(Pawson,
2018)
This research can be used as a resource for municipalities around the world that are in
the process of implementing these policies or are considering them, and specifically for
municipalities within the Metro Vancouver region which might have similar types of
businesses as those surveyed in this study. It provides insights into the types of
packaging materials and specific packaging that is most commonly being used in small
restaurants in Vancouver and can provide a good sense of how this might be similar to
other cities within the region. This information along with the barriers that many
restaurants are facing can also be used as a resource for the Metro Vancouver regional
authority as they continue to consult and design a region-wide strategy.
Economic and social sustainability are essential in creating a successful zero waste
policy that allows businesses to continue to grow. To allow for this success, local
businesses that drive the economy and create community spaces need to not only be
complying with local government waste policies but utilizing this opportunity to be
innovative and improve their business. There is a lack of knowledge and awareness not
only of sustainable packaging products but of opportunities to use green marketing or
other innovative ideas or technology to improve sustainability and potentially increase
business.
This research touches on many of the barriers that small restaurants face and common
themes that were highlighted. These conclusions show a general lack of awareness
amongst those restaurants surveyed in the West End and the associated costs involved
and the nature of the small restaurant industry in Vancouver prove to be very prohibitive
for restaurants to make these changes. The conclusions and key findings from
restaurants that are using sustainable materials can help small businesses around the
region who are facing similar challenges to learn from others’ experiences and work
together to comply and thrive with any new single-use item regulations.

6
Chapter 2. The Single-Use Item Problem
This thesis addresses how small businesses can transition to reduce dependence on
single-use items while still making enough profit to continue to remain economically
viable. This problem is relevant for businesses around the world, large and small, as
climate change and marine plastic pollution, and the global scale of plastic production
are very serious threats to our economy, our health, and our planet.
To address this larger problem, my specific question focused solely on the small
restaurant businesses in Vancouver’s West End neighbourhood. I selected this
neighbourhood because it has a very large concentrated group of small restaurants.
These restaurants range from local hot spots such as the Greenhorn Café to tourist-
driven take out restaurants such as the Mediterranean Grill and many in between. The
restaurants are diverse and feature a variety of different cuisines, prices, and
atmospheres that encourage either sit down dining or a take-out meal for the beach or
Stanley Park.
In this chapter, I start with an overview of the global plastic and waste problem, and then
move to how this translates to the local level and municipal governments and to the
issues that small businesses are dealing with.
2.1. The Global Context
Over the last century, plastic production has increased exponentially. The first synthetic
polymer was created in 1869, but over the last 50 years plastic has saturated our planet,
from packaging to automobile parts, plastic is everywhere. By 2017 it is estimated that
8.3 billion metric tonnes (Mt) of virgin plastics had been produced and according to
previous years data, around 80% of this plastic ends up either in landfill or in the natural
environment. (Geyer, Jambeck, & Law, 2017) It is estimated that 4-12 million Mt of
plastic that is generated on land enters the ocean every year, affecting organisms, sea
life, and human health. (Jambeck et al., 2015) Not only does plastic cause harm to the
environment by entering the ocean or natural environments but plastic production
requires the extraction of oil and other fossil fuels. Plastics (polymers) are produced by
the synthesis from primary chemicals coming from oil, natural gas, or coal. (American
Chemistry Council, 2019) The findings from the IPCC report released in 2018 state that

7
the spread of fossil-fuel based material consumption is a key contributor to rising
greenhouse gas (GHG) emissions. (Allen et al., 2018, p.53) Although the production of
plastic is not the sole contributor to fossil fuel extraction, its continued production in its
current form would require continued demand for oil, natural gas, or coal.
The public awareness for this global issue is rapidly growing as pictures of turtles with
straws in their nostrils, seahorses carrying cotton swabs, and beached whales whose
stomachs are filled with plastic attract massive attention and outcry from the public. Not
only are plastics harming wildlife, but some of this wildlife is regularly consumed by
humans. Some scientists estimate that by the year 2050 there could be more plastic in
the ocean than fish. (Ellen MacArthur Foundation, 2017) Most of the scientific research
that has been done has indicated that plastic does not biodegrade, it does not react
chemically with most other substances and therefore doesn’t decay (Freudenrich, 2020),
but there are some initial lifetime environmental estimates that indicate that polystyrene
does not stay in the environment forever. (Ward et al., 2019) The science around the
long-term implications of plastic on in the environment will continue to evolve, especially
with the introduction of new technologies and materials. Whether plastic is able to
eventually biodegrade, for now much of the plastic that ends up in the ocean is slowly
breaking down over time into smaller pieces that are often mistaken as plankton and
consumed by fish, which can then be consumed by humans or sea life.
The largest market for plastics is for the packaging of goods, used in many industries to
protect, transport, and market items. Solid waste has continued to steadily grow over the
last five decades in unison with the increase in income per capita, and the portion of
plastics within municipal solid waste has increased from less than 1% in 1960 to over
10% in 2005 in 58% of countries with available data. (Jambeck et al., 2015)
Plastic production and pollution are global issues and a problem that national
governments are attempting to address. In Canada, one-third of all plastics used are for
single-use or short-lived products and packaging and every year over 3 million tonnes of
plastic waste is thrown away. (Government of Canada, 2019) This represents $8 billion
per year in lost value of resources and energy. In response to a trend of taking action on
single-use items spreading across municipalities in Canada and other jurisdictions
around the world (Calderwood, 2018) in June 2019, the Government of Canada declared

8
they would be putting in place a nation-wide single-use plastic reduction strategy starting
in 2021.
The ban aims to reduce pollution from single-use plastic products and packaging
including shopping bags, straws, cutlery, plates, and stir sticks, all of which are items
commonly used in the restaurant industry. (Prime Minister of Canada’s Office, 2019) The
plan also includes a strategy on how to include small businesses with an invitation to
participate in developing innovative solutions to these plastic challenges which includes
finding smart packaging designs and new ways of separating mixed plastics for
recycling. (Government of Canada, 2018) This is also a problem at a very local level,
especially in a coastal city like Vancouver, where there is a direct link to the ocean and
marine ecosystem. Waste and debris that is not disposed of properly often finds its way
to the ocean through drains, streams, wetlands, rivers, and tides. In a study done by
Jambeck et al. it was found that in 2010 99.5 million MT of plastic waste was generated
in coastal regions (defined as populations living within 50km of a coastline). Of this
plastic waste, 31.9 million MT was mismanaged, and 4.8 to 12.7 million MT was
estimated to have entered the ocean. This is equivalent to 4.6% of the total plastic waste
generated in coastal countries. (Jambeck et al., 2010)
Vancouver’s coastline has a connection to the local hospitality economy as much of the
success of the cuisine derives from being a coastal city that has fresh seafood. Local
businesses keep our urban economies diverse and resilient, but they currently rely on
plastic packaging to stay in business. The Vancouver waterfront stimulates a thriving
tourism and restaurant industry, but it is at risk of becoming an eyesore of with plastic
debris.
2.2. The Local Context
At a local level, solid waste disposal is not only an issue, but waste collection is one of
the core services that local governments offer. Public solid waste is visible to the
community in streetscape garbage bins and litter in public spaces, parks, and beaches.
Individual residential waste and recycling collection is a service from the municipal
government that is expected and important to all residents of a city, not only for esthetics
but for health and safety reasons. Solid waste collection for businesses is an essential
service required to continue to function although this function is not operated by the

9
municipal government, much of the packaging waste that restaurants produce end up in
streetscape bins or residential bins. This immediate connection ties local governments to
waste collection, but they are also connected to the small businesses that require these
services through business licenses and the creation of a strong local economy.
Communities thrive when small businesses are successful and contribute to a dynamic
neighbourhood atmosphere for the residents to enjoy and build upon therefore having an
impact on the local governments and their priorities to improve citizens quality of life.
Vancouver has a history of prioritizing building community in neighbourhoods. (Regan,
2018) The Vancouver City Plan, created in 1995, had a vision of building character in
neighbourhoods and a focus on place building. This City Plan launched a
neighbourhood-by-neighbourhood process to work with the community and build
neighbourhood centres. This focus from the City of Vancouver has remained and but
has been redirected over the past two decades into a series of official community plans.
(McAfee, 2013) Regan’s study focuses on the importance of small businesses in
Vancouver and the premise that independent businesses are more than just economic
units, but they are symbols of neighbourhood identity, history and culture. Waste is a
local problem, but it is also an opportunity to connect business, government, and
community uniquely and in a way that other levels of government are not able to.
Billions of single-use items are being used and disposed of in Metro Vancouver, by
businesses and individuals. In 2018, 1.1 billion single-use items were disposed of in
Metro Vancouver which accounted for around 2.4 per cent of the overall weight of the
waste. These single-use items consisted of plastic bags, straws, containers, cups and
more, and indicate that solid waste from the restaurant and hospitality industry is a
significant issue (Metro Vancouver, 2019)) A large quantity of these items can be
attributed to take-out from restaurants. According to the manager of a local take-out
noodle restaurant, that specific restaurant uses approximately 750,000 units annually.
(SPEC, 2014) This is only one of approximately 5,000 restaurants in Metro Vancouver,
with billions of to-go containers being used – and discarded -- in the region every year.
In 2017, approximately 1,291,169 tonnes of municipal solid waste generated in the
Metro Vancouver region went to either incineration or landfill. (Metro Vancouver, 2018)
The Vancouver Landfill, located within Burns Bog in Delta, currently accepts around 69
per cent of the total municipal solid waste (MSW) generated in the region, with the

10
remaining amount going to the Burnaby Waste to Energy (WTE) Facility and landfills in
outside regions. The Burnaby WTE Facility which is run by Covanta Burnaby Renewable
Energy began operating in 1988 and currently accepts 25 per cent of Metro Vancouver’s
post-recycled waste (approximately 250.000 tons per year) mostly from the North-Shore,
Burnaby, and New Westminster. (Covanta, 2019) In 2015 Metro Vancouver decided to
indefinitely delay any plans for further expansion of the current facility or additional
facilities in the region due to a decrease in production of garbage, an increase in
diversion rates, and the amount of garbage that is being taken by commercial haulers to
outside of the region. (Sinoski, 2015) WTE facilities need to be continuously fed with
garbage which contradicts the waste reduction goals for cities within the region.
Landfilling is still globally the most commonly used method of solid waste disposable.
(Feuyit, 2019) The Vancouver Landfill is authorized to accept up to 750,000 tonnes of
MSW for disposal each year. It has been operating since 1966 and as of 2018 has a
remaining capacity of 8,568,868 tonnes. (City of Vancouver, 2018) Landfill operations
can pose as a health risk for those who live in the vicinity. The Vancouver landfill is
located within a 5km proximity of numerous homes and businesses and is located
directly inside the ecologically significant Burns Bog. Twenty years ago, the Burns Bog
Ecosystem Review had already indicated that the Vancouver landfill was ranked as a
concern for contamination due to leachate migration into the bog. (AGRA Earth &
Environmental Limited, 1999)
Waste that goes to the landfill is harmful to the environment but is also creating
economic costs for local governments, and in turn, taxpayers. The maintenance and
operational costs of the landfill were $22.8M in 2018, up from $18.4M in 2017, and
although single-use items only make up a small percentage of the total weight of waste
disposed, these items have additional costs before they arrive at the landfill. (City of
Vancouver, 2019. p.33) The City of Vancouver estimates spending approximately $2.5m
a year to clean up just cups and containers within the City. (City of Vancouver, 2018)
These costs are similar in cities throughout North America, according to studies done by
Taylor & Villas-Boas, Americans are expected to consume a total of 100 billion plastic
bags per year, leaving municipalities to spend $3.2-$7.9 billion per year cleaning them
up. (Taylor & Villas-Boas, 2016) Plastic bags, cups, and containers are common items
used in the restaurant industry specifically for take-away. Restaurant owners have the
power to reduce their use of these items or the materials, and with the support of local

11
governments, these initiatives could help reduce overall costs for both business and
local governments.
Cities and local businesses within them have a unique opportunity to tackle these
problems using innovative ideas that could help grow their businesses or industries
instead of hindering them. Examples from other cities around the world, such as
Portland Oregon, show that businesses and local governments can work together to
develop innovative ideas for such as container share programs. The City of Portland
also support organizations such as the “Go Box” which is a reusable takeout container
service that partners with vendors to offer reusable containers through a subscription
service that offers the drop-off site and the redistribution to vendors well as the
professional cleaning that complies with health regulations. (Go Box, 2019)
In Amsterdam, Ozarka is a company that rents out takeaway packaging to restaurants,
cafeterias and delis that can then use these containers to fulfil customer orders for a
small deposit fee at point of sale. The customers can then return the empty container to
the food producer and is refunded the deposit. Ozarka handles all washing, sanitizing
and redistribution. This program not only helps restaurants improve their sustainability,
but it also provides an incentive for customers to return to the location to return the
container and place another order. (Ozarka, 2017)
In New York City, one small restaurant chain has taken the initiative to launch their own
reusable container program that is run through a mobile application called “Canteen”.
This new pilot program requires the customers pay a monthly fee of $3 and in return
they will receive a reusable bowl and lid with their order and can return these to the
restaurant at any time. The restaurant takes care of cleaning and maintaining the
program. (Fassler, 2019) More examples of local government policies and how they can
impact small restaurant businesses will be further explored in the literature review.
Although municipal governments do not have clear authority to implement policies on
eliminating single-use items for environmental reasons, they do have a unique
connection to businesses through the issuing of business licenses. Any organization
doing business in Vancouver must have a business license. The application process is
through the City of Vancouver website and includes an application fee. Business
licenses expire at the end of each year and must be re-applied for, which allows the City

12
administration to implement new requirements for these business licenses every year.
(City of Vancouver, 2019)
My research focuses specifically on the SUIRS as a case study for the larger problem
that businesses face and will prove as a valuable insight for other small businesses who
are either facing similar policies or pressures from customers. The SUIRS is one of the
first municipal policies that aims at tackling such a wide variety of packaging materials
that would impact restaurants to this extent. This provides an opportunity for the City of
Vancouver to be a leader on this issue in the region and push other municipalities to
implement policies to tackle single-use items. Pressure to keep up with environmental
policies such as bans on plastic bags and polystyrene can come from citizens if they see
other municipalities tackling this issue. Metro Vancouver has an opportunity to be a
region that is leading globally on this issue and raising the ambition of cities around the
world on reducing single-use items.
2.3. The Small Business Problem
2.3.1. The rise in property tax for small business
Vancouver’s fast and significant increase in rent and housing prices over the past
several years has not only affected homeowners and renters; it is also affecting the
restaurant industry. In recent years, property values have increased to record-high
amounts which have been especially noticeable in the West End after recent zoning
changes in the neighbourhood. Typically, property owners in this neighbourhood would
see an average increase in property value of 5-10% per year, but in the past several
years the average was 40% with some owners seeing increases of up to 300%. (St.
Denis, 2017) An increase in property value leads to an increase in taxes for the business
owners, whether the business owner owns the space or is renting. It is common for
restaurants owners in the Vancouver and specifically in the West End to rent their
spaces due to high real estate prices. A common lease agreement for small businesses
in Vancouver is a Triple Net Lease (NNN). The NNN model requires the tenants, in this
case the restaurant owners, to pay a base rental amount but also the amount of the
property owner’s property taxes and the net amount of maintenance expenses.
(McCormick, 2017) This model means that the tenant leasing the property ends up
paying for this increase in property value through their rental costs to their landlords in

13
addition to their original rent and maintenance costs. This unintended consequence of
the NNN model is contributing to higher taxes for small business and only one example
of how government policies on taxes can impact small business. Other policies such as
the Foreign Buyer’s Tax which adds an additional 20% tax (of market value) for
residential properties for foreign nationals, corporations or trustees could increase
investment in commercial properties. (Government of BC, 2019)
Stephen Regan, executive director of the West End Business Improvement Association
(WEBIA), indicated concerns about the changes this might bring to the neighbourhood,
saying “shopping areas will be dominated with ‘safe’ tenants, like chain restaurants and
banks.” (St. Denis, 2017) This comment was in specific reference to Alberni St. in the
West End where properties currently rented by restaurants are being sought out by
luxury retail brands. Local restaurant owners have said that this demand is causing rent
in the neighbourhood to drastically increase and will make it impossible for them to stay
(Global News, 2016). In these conditions, it makes it difficult for independent businesses
to continue to rent properties in Vancouver, especially in the downtown and West End
neighbourhoods, and they end up being replaced by chains that have the stability and
security to survive. Small business owners are faced with extreme conditions, trying to
retain their property and compete with other businesses in Vancouver, making it more
difficult to prioritize transitioning to compostable/recyclable take-out containers if it will
require additional resources and costs.
Although small restaurants face these significant issues and challenges, they are also
presented with a unique situation that gives the flexibility for innovation and collaboration
with other businesses. My research explored the challenges that small businesses face
but also how they can be successful and sustainable at the same time. Looking at the
motivations of restaurant managers and owners for either using sustainable packaging
or using single-use items has helped to understand the barriers and motivations in
making this transition and some of the benefits that can be reaped.
2.3.2. Stability in Vancouver’s small restaurant scene
From the results of the survey, out of the 52 restaurants that completed the
questionnaire, three have closed since I received the data in February 2019. Of the total
of 134 that were on my original list from the City of Vancouver 2018 business license

14
data before adjusting based on my observation of restaurants that were permanently
closed or had been replaced by new restaurants, 17 of these restaurants were closed at
the time that I began my survey distribution in January 2019. This left me with a total of
156 restaurants after adding new restaurants based on observation and online research.
Out of the 156 restaurants that either completed a survey or were observed, eight of
these restaurants have closed since completing my field research in February 2019
(Table 1).
Table 1 Number of restaurants closed since January 2019
Permanently closed
Percentage closed since Jan 2019
Completed surveys 3/52 6%
List from COV BL data
17/134 13%
Final list of restaurants in datasheet
8/156 5%
Although this does not directly affect the results of my study, it adds to the overall
importance of why small businesses will be most impacted by the SUIRS. In addition to
barriers mentioned already such as tight margins, lack of authority or will from
management, or lack of knowledge, the additional barrier of the instability can hinder a
restaurant owner’s ability or desire to invest in more expensive products, especially if
most of the benefits to using the products will come in the long-term.
Restaurants that rent their properties have not only property taxes or keeping up
business to worry about, but they could be evicted from their space at any time. In the
spring of 2019, two restaurants from my original data set were asked to vacate their
property at 600 Robson Street due to the owner of the building’s plans for development.
One of these restaurants was India Gate, which has been in operation for 41 years in
Vancouver. (Daily Hive, 2019)
This common issue of uncertainty and sustainability for small restaurant owners could be
hindering their ability to invest in sustainable products for a long-term benefit of cost-
savings or customer retention. This was a topic that did not come to my attention before
distributing the survey, but after reviewing the collected data, it could be a topic for future
studies to see if this is a leading barrier to restaurants making sustainable choices.

15
Chapter 3. Cities, Sustainable Business, and Local Government Policy Interventions
To help create a conceptual framework for my research and the hypotheses that would
guide my questionnaire, I conducted a literature review focused on several key themes.
These key topics have helped to identify some of the core issues for small businesses
and how these connect to sustainability and local governments. The literature review
focused on the themes of corporate social and environmental responsibility, local
economic development, and local government policy interventions.
In the literature, there were limited sources that specifically focused on single-use items
and independent or small businesses, and even in the literature that focused on relevant
topics such as the financial implications for sustainability in businesses, or CSR, there
were limited authors. There were several examples of research that has been done in
the Lower Mainland related to the industry – such as local food purchasing at
restaurants, and household food waste. These studies provided insight for creating the
methodology and the questionnaires, with a specific focus on the sustainability and
restaurant scene in Vancouver. International research on sustainability in the hospitality
industry was also useful in defining the research.
Other pertinent research has addressed corporate social and environmental
responsibility and how this impacts business, as well as the business case for why
companies have chosen to make sustainable decisions and the costs associated with
them. This literature does not specifically relate to small businesses and how they can
adapt to new bold policies like the SUIRS or get ahead of these policies and use a
sustainability strategy to their benefit but it does provide an overarching picture of how
sustainability fits in with business and management practices.
These following three themes from the literature create a framework that enabled me to
design my research and assisted in analyzing the outcomes from the data.
3.1. Corporate Environmental Responsibility
Although there is no single definition for the term, corporate environmental responsibility
(CER) derives from corporate social responsibility (CSR) and describes the contribution

16
of an enterprise to environmental, social, and economic improvement with a more
dedicated focus to environmental impacts. It is the concept of a corporation going
beyond its responsibility to shareholders but also including its responsibility to
stakeholders who are impacted by the business, including staff, the surrounding
community and the surrounding environment. (Swift, 2011) Swift analyzes the
connection between trust and corporate accountability when looking at the actions of
businesses and their willingness to engage in environmental or social initiatives. The
definition of trust used is reliant upon expectation that interests will be protected, and
when looking at this from the CES or CER point of view, the stakeholder’s interests
include the staff, the surrounding community, and the environment.
CER is often looked at from two perspectives: personal and organizational. The personal
aspect of CER or any environmental management practice (EMP), is based around the
paradigms or beliefs of management or around the overall values of the organization.
Although more research is needed in this area, studies have shown that managers who
are more eco-oriented play a greater role in greening their businesses. (El Dief and Font,
2010) Management and owners of businesses have the ability to decide the direction of
their restaurant and the values that they choose to focus on. Because my research
focuses mostly around small and independent businesses, the questionnaire was
intended for restaurant managers and owners because of their insight into corporate
values.
Corporate management of restaurants is an extremely important factor in studying how
they are complying with sustainability practices. (Kang, Lee, & Huh, 2010) Although CER
may be important for some managers, it is not for many others. Restaurants in
Vancouver are focused on many issues and are putting their bottom line first. This is
when government intervention is crucial and can assist in creating an equitable playing
field by putting in place fair regulations for smaller businesses with fewer resources and
experience.
The motivation for managers to comply with and embrace environmental policies in
restaurants often includes opportunities for branding and marketing. Jeong et al. (2014)
found that two-thirds of the top retail companies indicate that their greatest motive for
going green is to improve the company’s image. Businesses and managers are
receiving more pressure to reduce environmental impact and waste than ever before.

17
Although there is some data to suggest that making more sustainable procurement
choices could save money, these profits are often forecasted for the future and are not
enough to cover the immediate costs of transition.(Jeong et al., 2014) In the research
done by Redmond, Walker, and Wang, restaurant managers also expressed that they
were not able to pass the costs of the transition to the consumer due to the market of the
product they are selling. For example, a take-away sushi restaurant is expected to have
a certain range of prices and if the prices increase to make up for other costs, they will
not be able to compete compared to other restaurants who have not added this cost.
(Redmond et al, 2008)
Reasons for not making sustainability a priority or a norm in small business do not rest
with green marketing or concern about costs; in a study done by Markle, there were
several reasons why individuals did not believe that sustainability, and specifically
recycling, was a priority for them. These reasons included the belief that a lack of pro-
environmental behaviour was, for a variety of reasons, not the responsibility of the
individual and the belief that not taking action was not that harmful, and the individual
should not be held responsible for it.(Markle, 2014) Markle’s research cites others like
Swidler who connects culture to action on an individual level, explaining that this could
be an explanation to why some individuals do not take the initiatives to act in certain
circumstances (Swidler, 1986). Markle also cites Nordhaus who speaks to the
connection to the political climate and the impact this can have on environmental action.
Sustainability and environmental action have been contentious issues for several years
and continues to create debate amongst those with opposing political views and
ideologies. (Schellenberger and Nordhaus, 2005) This could stem from a belief that
environmental action can be a detriment to increasing profits, and this has taken the
pressure off government and companies and put it back on the individual. (Markle, 2014)
For my research, a focus on individual behaviour is relevant as my focus is small,
independent businesses run by individuals who often carry sole decision-making power,
but it does not focus on consumer behaviour change. Through Markle’s surveying of
individuals throughout the United States, some key findings were discovered: the most
common reason for not taking action on climate change or transitioning to more
sustainable behaviours was a lack of knowledge and a belief that the individual did not
have the responsibility to take any action. Other reasons included a lack of leadership -
wanting someone else to “step up and take charge”, and the “sad tale” where individuals
18
relate unfortunate circumstances to explain their non-action. This could be applied to
restaurants dealing with other issues like rent, costs, staff and this causing them not to
be able to worry about sustainability. (Markle, 2014)
From this literature I determined that some of the key hypotheses for this research would
revolve around the values of restaurant owners or managers; that an interest in
sustainability would be a key factor for restaurants who had transitioned to sustainable
packaging and that a key barrier for those who hadn’t would be a lack of knowledge, or
responsibility, for these changes.
3.2. Sustainable Local Economic Development
3.2.1. The Business Costs of Going Green
The costs of making a transition to more sustainable practices in restaurants has been
identified as a key issue in both the literature and in the results of the questionnaire.
There is literature that explores the relationship between CESR and Corporate Financial
Performance (CFP) but very little of this research is focused on small businesses or the
hospitality industry. (Garay & Font, 2011) This literature review will explore whether
there is evidence that businesses choosing to make these transitions to more
sustainable practices can provide opportunities to improve business.
There are two key aspects to management and businesses transitioning to more
environmentally friendly practices in the hospitality industry; the resources that they
have, and the attitudes and values of managers. The attitudes of managers refers to the
values that, in this case, restaurant managers have and whether sustainability and
environmental issues are one of these values or priorities. Resources can be referring to
restaurant organizational capacity which includes the number and capacity and
capabilities of staff, the quality of management and the location, or it can refer to the
material resources available, such as infrastructure, packaging, and products. (Redmond
et al., 2008)
The availability of resources can impact the way that business decisions are made.
Resource efficiency is key in any business, and some have recognized this by signalling
that “waste is money”. (Redmond et al., 2008) Striving towards sustainability in the
restaurant industry essentially centers on efficiencies and saving resources, and

19
improving efficiencies is ultimately tied to saving money. (Rewards Network, 2019) A
business that uses less products or uses more efficient products will spend less. One
very practical example of this is saving electricity. If restaurants reduce their energy
waste, they will save money and although this might be the most obvious way that going
green could reduce costs it is not the only way that limiting resource use could save
money. Another example could be an investment in good products and table ware that
would allow customers to use within the restaurant and encourage them to do so. This
would reduce the number of take-away products purchased and the amount of waste
generated (and therefore costs associated with pick up of waste).
The waste of resources does not just focus on electricity and materials, but also food
waste which adds costs to both the business and the environment. When looking at
resource efficiency for food waste, there are considerations for restaurant owners to
make as far as their use of packaging. Packaging is often used to protect food and, in
some cases, will allow food to be edible for longer and potentially be consumed instead
of thrown away. This will be expanded upon in the definition of sustainable packaging.
The concept of a circular economy is one that stems around sustainability, a circular
movement of goods, and creating products that are designed to be reused in some way.
The Ellen McArthur Foundation defines a circular economy as decoupling economic
activity from the consumption of finite resources, designing waste out of the system.
(Ellen McArthur Foundation, 2017) This concept is also beneficial for businesses if they
are able to recover their own products and reuse them. Some examples of this model
would be participating in a container sharing program, using packaging that can be
composted commercially, or even composted on-site if that is an available option.
Wells notes that resource constraints are likely to become more significant and the
importance of circular value creation, and resource capturing systems, will become
critical for the success of businesses. (Wells, 2016) Ultimately, restaurant businesses
must rely on consumerism and human behaviour to remain unchanged - if the customer
demand remains for take-away packaging, the business should not try to decrease this
demand but instead adapt. (Rees, 2010) Although there are some signals from citizens
in Vancouver that there is a demand for change and a decrease in plastics, likely,
consumer behaviour will not change and the demand for convenience and products will
continue to remain steady or even grow. The focus should instead be on improving

20
materials and technology to allow for more sustainable packaging in the industry without
having to reduce the consumption of products these restaurants are selling. This could
include extending the life of products by ensuring the materials are more durable, that
the packaging is designed for re-use, and allowing for more open source design,
collaboration on design ideas from external partners and innovators on products and
materials. (Wells, 2016)
Innovation is key with regards to materials and resources, but this cannot be done
without innovation in management and organizational structures of restaurants. Small
and medium restaurants are often operating on “survival management” instead of a
more strategic management plan. Managers and owners are concerned about any
change in operations as they believe that this will lead to an increase in costs and end
up not making these changes towards more sustainable operations. This can then
perpetuate this idea that good environmental practices will have a negative effect on the
bottom line for restaurants. (Redmond et al., 2008)
Many restaurant managers and owners are unaware that environmental improvements
could reduce costs or improve profits, and when they are faced with legislative changes
to their operations (bans and fees) they are defensive and often do not comply with the
changes. (Redmond et al., 2008) Not only could these changes reduce costs through
practical measures, but they could also have a positive impact on business. In a study
done by Garay and Font it was concluded that when a restaurant was identified as
being committed to sustainability, ethical consumers would see the worth in
spending their money on such a business. (Garay & Font, 2011)
Implementation of legislation changes was found to be more effective in small
businesses when accompanied by enhanced education and awareness. This is where
municipal governments have the opportunity to make a difference, through policy
interventions and regulation through business license approvals but also an opportunity
to educate on opportunities for increased business. They also have an opportunity to
provide incentives for innovative policies or green business grants that could help small
businesses with the impetus that they need.
Although there is no assurance for businesses that reducing waste and improving
environmental practices will cut costs, it can be argued that it can improve customer

21
loyalty and sales, staff loyalty, and government relations. Restaurants also have an
opportunity to create a market niche, save on operational costs, and improve the
business brand and reputation. These social aspects can lead to a payback, even if not
immediately noticeable, and can contribute to the local economy. (Redmond et al., 2008)
3.2.2. Small business and the local economy
The success of small business is integral to the growth and diversity of the local
economy. Over 98% of businesses in British Columbia are small businesses with under
50 employees and 83% of businesses have less than 5 employees. These small
businesses provide a significant contribution to the strength and growth of the economy.
Between 2014 and 2017 small businesses grew by 7.7% and much of this growth has
occurred in urban areas. (Small Business BC, 2018) These numbers show that although
the largest emitters of waste are the large chains or corporate businesses, small
business still plays an important role in the local economy and it is important that they
are given tools to succeed when tackling the same issues as larger corporations with
more resources.
Although small businesses rely heavily on their local governments for permits, property
taxes, municipal waste regulations, etc. the municipal government relies on small
businesses to drive and maintain a thriving, vibrant, local economy that attracts residents
and other businesses. In a study done by JPMorgan Chase & Co. in looking at the
impact of small business in 5 different US cities, in four of these cities small business
created most of the jobs in the city. The study also found that although small businesses
were creating the most jobs, cities were not focusing enough efforts on improving the
small business environment. (ICIC, 2016)
In 2019, the City of Vancouver developed a small business strategy which includes an
online guide for small businesses with information on permitting, and the available
support and resources from the City. In April 2019 the City of Vancouver took an
additional measure and directed a property tax shift intended to provide savings for
business property owners. This change was made in reaction to the significant
challenges faced by small businesses. (City of Vancouver, 2019)

22
Small businesses have ample contributions to offer to local governments, but to be able
to continue to build the type of economy that many cities strive for, they need the support
that will allow them to compete with big box stores or corporate chains. In the case of
restaurants, the barriers to being successful for a small restaurant are numerous and to
take this risk would be a challenge for any independent business owner. The risks and
abilities for larger corporations to take those risks are less onerous. Therefore, the
relationship and support between small businesses and the local government becomes
critical in both the success of the local economy, and the success of plans such as the
SUIRS for both the businesses and the City. Other cities in North America have been
able to create this partnership with some success, and others have not which has led to
failure in policies. The next section will provide specific examples of cities which have
implemented policies to address the use of single-use plastics.
3.3. Local Government Policy Interventions
Cities around the world are implementing policies to tackle single-use items including
bans and fees on items such as plastic bags, straws and polystyrene foam etc.
Vancouver’s SUIRS includes a ban on straws and polystyrene foam containers,
originally by June 2019 and now delayed until January 2020. There has been serious
opposition and resistance on municipal legislation banning these materials from the
restaurant and hospitality industry, largely due to assumed cost increases which was a
factor in the City’s decision to delay the ban. On average, a single-use plastic bag costs
3 cents, and a paper bag costs 7-10 cents. (Taylor & Villas-Boas, 2016) This cost
difference is comparable for take-out containers, cups, utensils, etc. and for a small
restaurant business that relies on take-away business, any increase in costs can be
detrimental.
There are some recent local examples of cities taking action on plastic bags. Victoria
and Montreal have now implemented bans on single-use items. On January 1st 2018,
Ville de Montreal banned the distribution of plastic bags less than 50 microns thick, this
includes bags that are biodegradable or oxo-degradable. (Ville de Montreal, 2016) The
penalties for not complying with this new by-law range from $200-2000 for individuals
and $400-$4000 for businesses. Some critics of the ban believe that this was the
unsuitable approach, and that the city should have developed a comprehensive plan to
regulate all forms of soft plastics. (Gyulai, 2016) On July 1st, 2018, the City of Victoria

23
followed suit and also banned plastic bags. Victoria faced backlash from the plastics
industry and was taken to the BC Supreme Court which initially ruled in their favour to
uphold the ban. (Zussman, 2018) The ban has since been deemed to be invalid by the
Court of Appeal due to a requirement to have approval from the Ministry of Environment
and Climate Change. (City of Victoria. 2019) The results of these two policies have not
been realized yet but will set the precedent for those cities who will follow with similar
policies.
South of the border, Seattle stands out as a success story. In 2010 the City committed to
banning the use of non-recyclable or non-compostable (SUI) plastics. This built upon a
ban on polystyrene foam that was implemented in 2009. (City of Seattle, 2018)
Businesses were able to apply for exceptions to this law during the transition period, but
the City indicated that exceptions would not be granted as of 2019. These exceptions
were granted on the basis that there were limited alternatives to a certain product at the
time which has shifted dramatically in the past several years as new products and
technologies are widely available on the market. (Seattle Public Utilities, 2018)
Seattle has now gone one step further to implement a ban on plastic straws and utensils.
Building off a campaign done by a local non-profit, the Lonely Whale Foundation, which
on its own (pre-ban) has led 200 retailers to make the switch to compostable straws. City
Council passed this law in spring 2017, and the ban was implemented July 2018. The
Lonely Whale Foundation has plans to continue their campaign in 10 other cities and
hopefully have a similar outcome. (Lee, 2017) The City has an enforcement policy with a
penalty of up to $250 per violation. There are also opportunities for the public to report
businesses that are still using banned materials. (City of Seattle, 2017)
Building off this idea of inciting action from businesses even before a government policy
has been approved, a local non-profit in Vancouver, Drop the Plastic, has been taking a
similar approach by working directly with businesses and working with them to reduce
their use of SUI’s. (Drop the Plastic, 2019) Drop the Plastic (formerly Drop the Straw)
gathered support from local businesses in Vancouver indicating their support for a straw
ban in Vancouver ahead of SUIRS presentation to council. Further research on how
non-profits and local businesses can work together and embrace these policies could be
very useful for Vancouver.

24
The examples of bans in Victoria and Montreal have demonstrated government
intervention at an early stage but there is not yet a good sense on how this has or will
impact local businesses. The City of Seattle has a long history of action on reducing
single-use items and is now seeing action and initiative from these local restaurant
businesses to take further steps. From the outside, their story seems to be a success,
where local government action had led the way for an equitable playing field with
restaurants and even provided opportunities for restaurants to ask for more aggressive
policy initiatives such as the first city in the world to ban straws.
New York City is an example that demonstrates one of the worst-case scenarios for both
restaurant businesses and local government regarding the implementation of policies on
reducing single-use plastics. The example provides lessons on why it is important to
ensure that businesses are succeeding through these policy implementations, and the
repercussions if they are not. In 2015, New York City Mayor and Council announced
they would ban polystyrene foam containers and cups. Mayor De Blasio and his staff
faced significant opposition to this ban from the hospitality industry as well as the foam
industry. More than 1,000 New York City businesses wrote letters asking city council to
rethink the proposed ban on polystyrene foam food service products. (Hardcastle, 2013)
A coalition of independent business owners, Restaurant Action Alliance (RAA) insisted
that the new proposed legislation would hurt business in small restaurants due to the
almost double cost of an alternative material to polystyrene foam. In a study done by MB
Public Affairs it was calculated that for every $1 spent on polystyrene products these
businesses would have to spend approximately $1.94 on alternative materials.
(Hardcastle, 2013) This has proven to be an accurate price comparison based on the
information available on restaurant supplies ordering websites. (Supply Box, 2017)
Restaurant owners had serious concerns over costs, and over the quality of their
products as the polystyrene material holds heat better than most compostable
alternatives. (Hardcastle, 2013) The chair of the RAA believed that this policy change
would hurt small restaurants the most, as many depend on take-out and delivery and
these are the materials that are used for this purpose.
In the summer of 2015, the ban was taken to the Supreme Court and overturned. It was
an unfortunate outcome for the City of New York, but can provide some very valuable
insight and information on why it is essential that restaurant businesses not only comply

25
with regulations but are partners in this transition, finding ways to both improve
sustainability in their businesses and remain economically viable in their current state as
a local small business.
The example of how the restaurant industry responded to the Styrofoam ban in New
York City was valuable to compare with the survey results as some of the same themes
were raised as concerns with restaurant owners including increased costs and
challenges for independent restaurants. Other examples from Victoria and Montreal will
serve as models of best practices as they continue to enforce their plastic bag ban
policies. These case studies can help to inform the national single-use plastic reduction
plan, but also help other cities get ahead of this and implement policies that will work
best for both their citizens and businesses.
3.4. Inferences from the literature
The review of literature and the conceptual framework helped to define the concepts that
would be applied in the research. The focus on corporate environmental responsibility
and its benefits is not something that has been widely studied for small businesses or in
the hospitality industry. This only confirms the need for additional research on this topic
and that my research question should focus specifically on small and independent
restaurants. The literature also proved that there is a lack of research that specifically
focus on single-use plastics in the restaurant or hospitality industry.
The literature guided the focus on the values of the management and ownership of the
restaurant and the need for this to be incorporated into the questionnaire. The literature
that looked at the business case for sustainability and the barriers and opportunities for
transitioning to more sustainable practices confirmed that cost was an issue that needed
to be explored as a prohibiting factor for small businesses.
Other key findings from the literature that helped to guide the research was the content
on ethical consumers and whether this is something that businesses are aware of and
using as motivation for utilizing sustainable packaging. The literature on similar policies
to the SUIRS from other cities has helped to identify some of the possible barriers for
restaurants. It also helped to validate the importance for engagement with businesses
throughout the process of developing a strategy like the City of Vancouver’s SUIRS.

26
Chapter 4. Methodology
I designed the methodology of this study using the relevant literature available of similar
studies that have been done. To respond to my research question, I concluded that a
form of a survey or questionnaire would be most useful in specifically determining which
restaurants were using sustainable packaging.
The literature that I used to design the questionnaire relied heavily on the work of Smith,
who completed a similar research project which surveyed restaurants in Vancouver on
their use of locally produced food. (Smith, 2011) The Hua Foundation also completed a
similar survey, commissioned by the City of Vancouver, for restaurants in Chinatown
which focused on their use of single-use plastic and the Vancouver SUIRS. (Hua
Foundation, 2018) Both of these pieces of research allowed me to begin to create the
methodology of designing and distributing the questionnaire.
The questionnaire method not only allowed for me to get quantitative data from
restaurants on the use of SUI’s, but it also allowed for interactions with respondents and
more in-depth conversations around the questions.
4.1. Restaurant Sample
A questionnaire was distributed to small restaurant businesses in the West End. To
create the list of questionnaire recipients, I extracted the City of Vancouver’s restaurant
business license data listed as of January 2019. (City of Vancouver, 2019) The list of
restaurants included are what the City of Vancouver categorizes as Restaurant Classes
1 and 2, which are food establishments with less than 150 seats, and have a sub
classification of liquor serving and non-liquor serving. Class 2 restaurants are those
which have the ability of providing entertainment: singing, dancing, karaoke etc. There
are over 2,000 restaurants in Vancouver with a valid business license.
This list was then narrowed down to include only small restaurants in the West End
neighbourhood as defined in the business license data. I have classified small
restaurants as those with 1-35 employees and those that are not a part of a large
corporate chain such as McDonalds, Starbucks, A&W etc. (City of Vancouver, 2018)

27
The final list before distributing the surveys included 134 restaurants that fit the above
criteria. This list changed as I began my field research as many restaurants that had
moved, closed, or newly opened since this City of Vancouver data had been published.
The final list of 156 restaurants that I used included a variety of cuisine types and sizes
as well as locations (see Figure 2).
Figure 2 Sample size of 156 restaurants used for distributing questionnaire
4.2. Data Collection
The findings in this paper are based on original research done through survey data
collected from small restaurants in the West End neighbourhood, Vancouver, Canada.

28
Each survey was hand-delivered and either left with the restaurant to complete,
completed on the spot, or administered on the spot. Notes were documented to record
information that was relevant and not asked during the survey.
I spent more time at each restaurant that wanted to respond to the questionnaire than
originally expected, and due to time constraints and additional factors, I was only able to
deliver surveys to 88 restaurants in the West End out of the 156 on the list (see Figure
3). I did not enter some of these restaurants because of the number of customers in the
restaurant at that time, other restaurants were closed for lunch or closed between the
lunch/dinner rush, a few restaurants were still closed for winter break, and several were
closed permanently. Some areas of the neighbourhood I was not able to get to because
of their location, for example, if there was one restaurant that was located a considerable
walking distance from any others, I made the decision to skip that restaurant in order to
get to others (see Figure 3).

29
Figure 3 Restaurants visited during questionnaire distribution

30
Because I was not able to get to all the restaurants on the original list, this allows for
potential bias in the results for the restaurants that I chose to visit. To account for this, I
have tested the relationship between the restaurants I went to and several data sets that
I had for all restaurants. The results from Table 2 indicate that the restaurants that I had
visited from my overall list were a sample that encompassed more restaurants with an
average entrée price of $15 - $25, between 10-20 seats, and table service. This shows
that the sample size from my research of these three categories were larger than the
greater population. There were no significant relationships between the restaurants that I
went to and those I did not, and the type of cuisine served.
Table 2 Significant relationships between restaurants I went to and didn't
Categories Pearson Chi-Square
df P value
Average price of entrée = $15-$25
14.225 1 0.000
Number of seats= 10-20
10.457 1 0.001
Ordering style = counter only
7.800 1 0.005
4.2.1. Qualitative Data Collection
When I first began my survey distribution, I had planned to distribute approximately 154
surveys and complete five in-person interviews with restaurant managers or owners. As I
began my first day of distributing surveys, I realized quickly that I would not be simply
dropping off surveys and moving on to the next restaurant, as many of these
respondents wanted to complete the form right away or have me administer the
questions. Not only that, but many wanted to offer additional insights or comments to the
questions or on the topic. I left a section on the survey for notes and had a personal
notes section on the observation data collection sheet that allowed me to immediately
record my thoughts.
I included a question on the survey asking if they would be willing to complete a 30-
minute interview on this topic. There were no responses indicating interest to this

31
question, and I believe this was due to time constraints but also to the fact that they were
having the opportunity to discuss further already.
4.2.2. Observation Data
To ensure that the survey remained short and easy to complete for the respondents, I
chose to leave out questions where information could be found through online data
collection or direct observation. Some basic information such as cuisine type could be
easily found through online data collection and others through observing in person
(Table 3). For those restaurants that I was not able to observe in person due to
availability or temporary and permanent closures, I was able to find this data online
through restaurant websites and restaurant review websites that also provide photos.
Table 3 Data collection methods
Categories Method of data collection
Types of packaging Observation and questionnaire
Size of restaurant Observation Online data collection through restaurant review sites and photographs
Restaurant design (designed for take-out or sit-down)
Observation
Ordering style (counter or table service) Observation Online data collection through restaurant review sites and photographs
Cuisine type Online data collection
Average entrée price Online data collection
Ownership model Questionnaire
Reasons for using sustainable packaging Questionnaire and interviews
Reasons for not using sustainable packaging
Questionnaire and interviews
Use of food delivery services Questionnaire Online data collection through website
Use of green marketing Questionnaire
Languages primarily used among restaurant staff
Questionnaire

32
The data collected through observation and through online data collection allowed for
the hypotheses to be tested on two different data sample sets. The first with the data
from the 52 completed questionnaires and the second with the data from the
observations and research on 88 restaurants. For the remaining restaurants, I was not
able to collect the observation data on whether there were single-use items, Styrofoam
or sustainable packaging being used, and therefore was not able to use this data to test
the hypotheses.
4.3. Survey Content and Data
The questionnaire (Appendix I) was created to collect data from restaurants on the types
of packaging they are using, the challenges they face, or motivations they had for
already transitioning to sustainable packaging. There were several variables collected
through observation or online research such as average entrée price. These questions
were omitted from the questionnaire to ensure it remained concise and relatively easy to
complete. The questionnaire was directed at managers and owners of restaurants but
could be completed by any employee familiar with the products used. Out of the 52
completed surveys, 39% were completed by the manager of the restaurant, 22% by the
owner, and 25% by a server (Figure 4). When I entered the restaurant, I began by
introducing myself and my research topic and would then ask if the manager or owner
was available. If they were not available, I would ask if there was someone who had time
to answer a few questions about the packaging used in the restaurant. Some staff
members preferred to take the survey and leave it for the manager to complete, but most
were willing to answer the survey themselves.

33
Figure 4 Titles of Survey Respondents
The questionnaire content was guided by literature, similar surveys that had been
completed in Vancouver on local food, and the consultation that the City of Vancouver
had done through the Hua Foundation (Hua Foundation, 2018). Through this research I
developed several hypothesis questions that would guide the questionnaire and answer
these hypotheses (see Table 4). After creating a draft questionnaire, it was tested by
three restaurant owners or managers outside of the West End Neighbourhood and two
former Executive Directors of the Hastings BIA (and former SFU MURB Students). Their
feedback was valuable and served as a good opportunity to test the relevance of the
questions and expected responses, the feedback was incorporated into the final version
of the questionnaire.
Owner22%
Manager 39%
Server 25%
Bartender 4%
Other 10%
WHAT IS YOUR TITLE?

34
Table 4 Hypotheses that guided the questionniare Hypotheses Question
Restaurants with ownership models of chains/franchises will be more likely to use sustainable materials
What is the ownership model of the restaurant?
Restaurants whose owners value sustainability will be more likely to use sustainable materials
If your restaurant uses any compostable, recyclable or reusable materials, please select one or more of the reasons below:
- Sustainability is a core value for my restaurant
Customer demand will be one of the key motivations for restaurants to use sustainable packaging
If your restaurant uses any compostable, recyclable or reusable materials, please select one or more of the reasons below:
- Customers prefer more sustainable packaging options
There is a lack of awareness of the City of Vancouver’s SUIRS
If your restaurant uses any compostable, recyclable or reusable materials, please select one or more of the reasons below:
- I know that the City of Vancouver is implementing a Single-Use Item Reduction Strategy
The cost of alternatives to SUI’s is a barrier for restaurants
If your restaurant DOES NOT use any compostable, recyclable or reusable materials, please select one or more of the reasons below:
- It is too expensive
Not knowing where to purchase sustainable packaging or what to purchase is a barrier for restaurants
If your restaurant DOES NOT use any compostable, recyclable or reusable materials, please select one or more of the reasons below:
- I do not know where to procure compostable, recyclable or reusable packaging
- There are not enough alternative options that meet my restaurants needs
Restaurants believe that SUI’s are more hygienic to use than compostable or reusable items
If your restaurant DOES NOT use any compostable, recyclable or reusable materials, please select one or more of the reasons below:
- Single-use plastic items are more hygienic
There is a lack of awareness amongst restaurant owners that SUI’s are problematic and the benefits of using more sustainable materials
If your restaurant DOES NOT use any compostable, recyclable or reusable materials, please select one or more of the reasons below:
- I have not considered using compostable, recyclable or reusable packaging
Restaurants that are using food delivery services are more likely to use SUI’s
Does your restaurant use food delivery services, either in house, or companies such as Foodora, Uber Eats, Skip the Dishes etc.?
Restaurants whose staff speak languages other than English are less likely to use sustainable materials due to lack of awareness and lack of educational outreach in other languages
Languages primarily used at your restaurant (front and back of house):

35
4.4. Language
I had originally identified languages spoken among restaurant staff as a barrier to
receiving completed surveys or additional information from restaurants due to notes from
similar research in Vancouver such as the study done by the Hua Foundation. (Hua
Foundation 2018) Due to the large number of Asian restaurants in the West End, I had
considered hiring someone who spoke Mandarin or Cantonese to come with me when
picking up the surveys to help with any translation. Based on my interactions during the
distribution of the surveys, I decided this was not necessary as most restaurant staff
spoke English. In fact, from the questionnaire results, the most common language
spoken among staff was Spanish (see Figure 5). Out of the 88 restaurants that I went to
there was only one restaurant staff member who didn’t want to complete the survey
because of a language barrier. This could change based on the neighbourhood or types
of restaurants the study is focused on. For future studies I would recommend conducting
the initial distribution of the surveys before deciding if translation was necessary or
including someone who spoke a relevant language.
Figure 5 Representation of primary languages spoken in-house

36
4.5. Data entry and cleaning
When distributing and collecting the surveys, I kept a spreadsheet marked with all
observations that just required a 1 or 0, as well as a section for notes or comments to
write down immediately. I added both survey data, observation data, and data from
online research to one spreadsheet. I then recorded all relevant notes in the same
spreadsheet separated by notes given by the respondent and my observational notes.
Once I had input all the data from the surveys and observations, I completed any
missing data on cuisine type, restaurant size, entrée price, address etc. I then converted
all “yes” and “no” values to “1” s and “0” s to be used in SPSS. The cleaning also
required going through all of the data and ensuring that there were no “0’s” where there
should have been no value. To ensure that I was able to calculate the relationship
between the different variables and the use of SUI and Styrofoam, I combined all of the
survey responses on materials used and packaging used to a column for “SUI” and a
column for “Styrofoam”.
The final datasheet was then separated into several datasheets to be used for the data
from the questionnaire (52 restaurants), the observed data (88 restaurants) and the all
restaurant data (156 restaurants).
4.6. Validity and reliability of methods
The research response rate from the restaurants that I went to was 52 out of 88
restaurants which is a response rate of 59% and an adequate rate to be doing analysis
and reporting. (Babbie and Benaquisto, 2002)
To test the validity of the content of the research, the questionnaire that was
administered was developed from the literature review and tested amongst those in the
field. After going through several rounds of drafts of the survey, the final draft copy was
sent to three people who worked in the restaurant industry as either managers or
owners. It was also sent to the Executive Director of the West End BIA and former
Executive Director of the Hastings BIA. Their feedback and suggestions confirmed that
the content of the survey was valid and relevant to address my research question.
37
To test the reliability of this study, the research would need to be replicated in a similar
way. This could be done but would likely produce different results as it’s unlikely that the
same restaurants would respond, it is also unlikely that the same respondents would
complete the survey again and therefor give different results. The inconsistency in the
restaurant industry makes it very difficult to test these results, but they could be
compared to other surveys done in the future with restaurants on this issue.
In comparing the results of the survey to the literature, there is consistency in the
themes. As highlighted in the literature, cost was identified as a key barrier for
restaurants to transition to more sustainable practices. The literature also indicated that
the values of management plays a key role in the transition to sustainable practices
which was reproduced in the results of the survey. Both key findings assist in confirming
that the results of the research are reliable.
38
Chapter 5. Sustainable Packaging
5.1. Defining Sustainable Packaging
Packaging is a key component of the food industry. It allows food to be transported and
distributed safely from producer to consumer. Occasionally this packaging is necessary
for transportation and health safety and sometimes not. As pointed out in the book “Why
Shrink Wrap a Cucumber”, sometimes what seems like unnecessary wasteful packaging
is necessary. Studies show that a wrapped cucumber will last three times longer than
one that is not wrapped. This continues down the life-cycle chain, reducing food waste,
reducing the need for more cucumbers to be delivered to the store, which in turn
reduces energy and fuel use, etc. (Usborne, 2012) It is a complicated cycle to track and
to weigh the benefits between products like a paper bag versus a plastic bag, resulting in
a very tedious and controversial debate.
These complex calculations of which products and materials are “most sustainable” can
oftentimes be discouraging for businesses while attempting to make a transition to a
more sustainable option. Companies like PIQET have tried to address this by creating
business tools that assess the lifecycle of products to determine their sustainability, but
for a small restaurant business, this might not be a viable option. (PIQET, 2018)
For this research, I chose to consider what I have labelled as “non-sustainable”
packaging as those that are listed in the City of Vancouver’s SUIRS: plastic and paper
bags, plastic straws, plastic utensils, Styrofoam containers and cups, single-use plastic
and paper containers and polycoat paper cups. (City of Vancouver, 2018b, p. 2) This list
of SUI’s does not include materials that can be composted or that can be reused.
Something that should be considered for defining an item as “compostable” is that most
plastic products that are labelled “biodegradable” or “compostable” are not currently
accepted in municipal food scraps recycling programs in Metro Vancouver. Some
businesses may establish a program with a private hauler to have these items
composted if the items are being disposed of within the business. (Metro Vancouver,
2019b) This can be an issue for restaurants that are purchasing these products under
the belief that they are widely compostable throughout the city. This question was not
included in the survey but could be a topic for further research in this field.

39
5.2. Types of packaging materials and products
Respondents of the questionnaire were asked to specifically identify which materials
they were using in their restaurants and specific items they had available. The most
common materials used were soft plastic, hard plastic, and compostable (paper or
biodegradable materials), which included cardboard boxes or paper bags that were
compostable (Figure 6).
To gain a better understanding of the specific items that restaurants were using, the
questionnaire asked respondents to indicate which of the items listed were currently
being used, and to add any others that were not listed. Due to the variety of products
used within the restaurant industry, most of the respondents indicated they used several
of the items in their restaurants. Only one restaurant responded that they used only one
take-out item listed and this was one that used mostly compostable materials or plastic
that was meant to be re-used.
Figure 6 Materials used for packaging in small restaurants in the West End from questionnaire
The most common materials used were soft plastic and hard plastic but closely followed
by compostable materials. Respondents were able to choose any of the items listed, all
or none and many of these restaurants used many items in their restaurant and chose
the materials based on this.
0 5 10 15 20 25 30 35
Compostable or biodegradable plastic
Compostable (paper or natural materials)
Reusable
Styrofoam
Hard Plastic
Soft Plastic
NUMBER OF RESTAURANTS THAT INDICATED THEY USED THESE PACKAGING MATERIALS
TYP
ES O
F P
AC
KA
GIN
G M
ATE
RIA
LS
PACKAGING MATERIALS

40
As shown in Figure 7, the most common item was plastic bags, with 30 respondents
indicating their use as well as 28 respondents indicating they used paper bags. The next
most common items used were plastic straws and plastic cutlery. These items are all
exterior packaging items that don’t hold the products that are being taken away to eat,
but instead they are items used to carry boxes of food, straws, and utensils to eat the
food. These are also items that are being primarily targeted by municipalities for bans
such as the City of Victoria ban on plastic bags and the City of Seattle’s ban on plastic
straws.
Figure 7 Packaging items used in small restaurants in the West End from survey
0 5 10 15 20 25 30 35
Plastic Bags
Paper bags
Plastic containers
Compostable straws
Plastic cups
Coffee cups
Aluminum
NUMBER OF RESTAURANTS THAT INDICATED THEY USE THESE PACKAGING ITEMS
SPEC
IFIC
ITEM
S U
SED
TYPES OF PACKAGING USED

41
Chapter 6. Factors affecting packaging materials
When creating the questionnaire to be distributed there were several questions that were
selected based on my original hypothesis questions of what would affect whether
restaurants use single-use items or sustainable packaging materials. These questions
included data on cuisine type, entrée price, size of restaurant, ownership model,
marketing, languages spoken, and take-out culture (see Appendix I). These questions
were chosen based on my literature review and conversations and advice from those
working in the industry.
6.1. Cuisine Type
The hypothesis for this category was that cuisine type would be directly related to the
use of single-use items. The reason for this hypothesis was due to the nature of the
different types of restaurants and the expected prices that come with it. Based on
previous conversations with a restaurant owner of an independent ethnic restaurant in
Vancouver, it was brought to my attention that this type of restaurant is likely to charge
less than an equivalent non-ethnic restaurant in Vancouver. For example, a take-out
sushi or donair restaurant are expected to have a lower price point for consumers than a
than a take-out pasta or fish and chips restaurant. This leaves the cost margins tighter
for a restaurant that is charging less per meal and provides more reasoning for
management to purchase the less expensive products such as Styrofoam.
Cuisine type was not added to the questionnaire as this was something I could easily
find through online research. The categories of restaurant cuisines were chosen based
on both initial research of similar studies done with restaurants in Vancouver and my
initial data collection as this adjusted the types of cuisine that had their own category as
opposed to “Other” or being grouped into a broader category such as “European”.
(Smith, 2011) Table 5 shows the cuisine categories that were chosen for the final
dataset.

42
Table 5 Type of cuisine by dataset Type of Cuisine Number in
survey dataset Number in observed dataset
Number in full dataset
European (Italian, French, Spanish, Irish)
13 15 19
Asian (Japanese, Chinese, Korean)
12 24 64
Westcoast Contemporary
7 10 18
South Asian (Indian)
7 8 10
Middle Eastern & Greek (Persian, Turkish, Greek)
5 8 11
South East Asian (Thai, Malaysian, Vietnamese)
4 8 11
Latin American (Mexican, Brazilian)
3 5 4
Other 3 10 19
Total 54 88 156
There were no significant relationships between any other cuisine types and the use of
SUI’s or Styrofoam from the questionnaire data. From the data of the percentage of
Styrofoam and SUI use among the top five cuisine types from the questionnaire in Table
6, the use of SUI’s was high for all five, but both Asian cuisines and Middle Eastern
cuisines used SUI’s in every restaurant surveyed. For Styrofoam use, 87% of South
Asian restaurants indicated using Styrofoam compared to 42% of Asian restaurants and
only 13% of restaurants with Westcoast contemporary cuisine. A chi-square test of
independence was performed to examine the relationship between South Asian cuisine
and the use of Styrofoam in restaurants. The relationship between these variables was
significant, p=0.005. South Asian restaurants were more likely to use Styrofoam than
other cuisine types (Table 7).

43
Table 6 Percentage of SUI/Styrofoam use among top cuisine types from questionnaire
Styrofoam SUI
Asian 42% 100%
South Asian 87% 86%
Middle Eastern 40% 100%
European 31% 69%
Westcoast contemporary
13% 88%
Table 7 Relationship between South Asian cuisine type and Styrofoam from questionnaire
South Asian
Other Cuisines
No Styrofoam 13.5% 71%
Styrofoam 86.5% 29%
Totals 100% 100%
Chi-Squared = 8.436, df=1, p=0.004
From the data in Table 8 of the percentage of Styrofoam and SUI used among the top
five cuisine types from the observed data, there are similar patterns to the results from
the questionnaire. South Asian and Middle Eastern cuisines have the highest
percentage of Styrofoam use among restaurants, and while there is an overall lower
overall use of SUI’s, Middle Eastern restaurants still have the highest percentage (88%)
of restaurants using SUI’s. There were no significant relationships between the cuisine
types and the use of Styrofoam or SUI’s from the observed data.

44
Table 8 Percentage of SUI/Styrofoam use among top cuisine types from observed data
Styrofoam SUI
Asian 29% 54%
South Asian 50% 63%
Middle Eastern 50% 88%
European 25% 56%
Westcoast contemporary
10% 20%
6.2. Entrée price
The average entrée price was divided into four categories: under $10, $10-$15, $15-$25,
and over $25. These categories were picked from the research of other similar surveys
completed in Vancouver on local food. (Smith, 2011) The data on the average price of
entrées at was collected by observing menus either in person or online. The average
price of an entrée is an important category as one of the hypotheses for this research
was that restaurants that have more expensive menu items can purchase sustainable
(more expensive) packaging, and those who have less expensive menu items have
tighter margins and might be less likely to make this investment. Although there were no
statistically significant relationships between average entrée price and the use of SUI or
Styrofoam, Table 9 shows that generally as the average price of entrée increases, the
percentage of restaurants using Styrofoam and SUI’s decreases (aside from <$10 for
SUI). Most noticeably, the restaurants with the average entrée price of over $25 were
not using any SUI or Styrofoam in their take-away packaging.
Table 9 Percentage of restaurants using Styrofoam and SUI based on average entree price from questionnaire
<$10 $10-$15 $15-$25 >$25
Styrofoam 45.5% 15% 20% 0%
SUI 28% 37.5% 32.3% 0%

45
Table 10 Relationship between average entree price and SUI from questionnaire
<$25 >$25
Sustainable Materials
90% 100%
SUI 10% 0%
TOTAL 100% 100%
Chi Square: 3.328, df=1, p=0.068
Table 11 Relationship between average entree price and Styrofoam from questionnaire
<$25 >$25
No Styrofoam 68% 100%
Styrofoam 32% 0%
TOTAL 100% 100%
Chi Square: 0.924a, df=1, p=0.336
6.3. Size of restaurant
The size of the restaurant was determined by the number of seats in the restaurant. This
was calculated by observation when I distributed the surveys. The categories of under
10 seats, between 10-20 seats, and over 20 seats were chosen to represent the size of
the restaurant: small, medium, and large. Most of the restaurants that completed the
questionnaire and most of the restaurants that I observed fell into the category of 10-20
seats (Figure 8). The hypothesis for this question on the questionnaire was that small
restaurants would be more likely to use SUI or Styrofoam because they would have
fewer customers eating in the restaurant and more customers taking their meals to go.
Figure 8 Restaurant size from survey data and observed data
17%
48%
35%
RESTAURANT SIZE FROM SURVEYS
<10 seats 10-20 seats >20 seats
23%
52%
25%
OBSERVED RESTAURANT SIZE
<10 seats 10-20 seats >20 seats

46
There was no significant relationship between the size of the restaurant and the use of
SUI or Styrofoam. The results were similar for all three sizes of restaurants for both the
questionnaire data and the observed data showing no significant results. The medium
size restaurants in most cases used the least amount of SUI’s and Styrofoam, but they
were also noted as having a significant relationship with the restaurants I went to versus
didn’t.
Table 12 Percentage of SUI/Styrofoam use among restaurants of different sizes from questionniare data
Styrofoam SUI
Under 10 Seats 44% 89%
10-20 seats 36% 84%
Over 20 Seats 44% 78%
Table 13 Percentage of SUI/Styrofoam use among restaurants of different sizes from observed data
Styrofoam SUI
Under 10 Seats 35% 60%
10-20 seats 19% 49%
Over 20 Seats 38% 62%
6.4. Ownership model
The criteria for the original list of restaurants excluded large chains such as McDonald’s,
Tim Hortons, Starbucks etc. but it did include smaller chains such as Banana Leaf or
Café Crepe or restaurants whose owners have several restaurants such as Nook and
Tavola who have the same owner but both offer the feel of small, independent
restaurant. It was important to see if the ownership model had an impact on whether
restaurants chose more sustainable packaging because the hypothesis was that
restaurants that belonged to a chain or multi-restaurant ownership model would have
more restaurants to purchase products for and buying sustainable products in bulk could
help to reduce these costs. Group purchasing between restaurants has been suggested

47
in some research as a solution for the cost issue and this question would help to identify
whether this is an accurate assumption. The criteria for identifying whether this was a
truly independent restaurant was by asking whether 1 - This was the only location and 2-
did the owner own any other restaurants within Metro Vancouver.
The data in Table 14 shows that that there are very few Chain/Franchise restaurants that
completed the questionnaire that use Styrofoam or SUI. Only 6% of restaurants who
identified as a chain or a franchise had any Styrofoam products, whereas 50% of
independent restaurants identified having Styrofoam products (Table 14). A similar
pattern was seen in the results of the observed data, where only 14% of chain/franchise
restaurants were observed using Styrofoam.
Table 14 Percentage of independent and chain/franchise restaurants using SUI and Styrofoam from questionnaire
Styrofoam SUI
Independent 50% 88.9%
Chain/Franchise 6.3% 12%
Table 15 Percentage of independent and chain/franchise restaurants using SUI and Styrofoam from observed data
Styrofoam SUI
Independent 38.1% 59.5%
Chain/Franchise 13.6% 43.2%
A chi-square test of independence was performed to examine the relationship between
the ownership model and the use of Styrofoam in restaurants. The relationship between
these variables was significant in both the questionnaire data, p=0.002 (Table 16) and
the observed data, p=0.009 (Table 17). Restaurants that were a part of a chain or had a
franchise ownership model were less likely to use Styrofoam than those that were
independently run and owned.
These numbers from the sample group of restaurants do indicate that being a part of a
chain or a multi-restaurant ownership model could assist in getting small restaurants
away from purchasing cheaper options for packaging such as Styrofoam. These results
indicate that there should be further research on whether group purchasing options

48
could make a difference for small, independent restaurants and to allow them to
purchase in bulk and share the cost of these items with other restaurants.
Table 16 Relationship between ownership model and Styrofoam within the questionnaire
Independent Chain/Franchise
NO
50% 93.8%
STYRO
50% 6.3%
Totals 100% 100%
Chi Square= 9.144a, df= 1, p= 0.002
Table 17 Observed relationship between ownership model and Styrofoam
Independent Chain/Franchise
No Styrofoam
61.9% 86.4%
Styrofoam
38.1% 13.6%
Totals 100% 100%
Chi Square: 6.753, d=1, p= 0.009
6.5. Green Marketing
The restaurant industry is competitive, and marketing and branding are a key aspect of
maintaining a stable and successful business. A positive company image or use of
branding either online or in-store can go a long way to assist with this. According to a
study done in the USA by Upserve Restaurant Insider, 90% of guests surveyed indicated
that they research a restaurant online before dining. (Everett, 2019) Based off the
literature around restaurant marketing, and green marketing in particular, and how this
impacts a sustainable business model, one of the questions on the survey was whether
the restaurants who had chosen sustainable packaging options had done this in the
hopes of attracting a new clientele that valued sustainability and improving their overall
image. The question specifically asked, “Do you describe your restaurant as green,
sustainable, or environmentally conscious in your marketing?”
49
In the Jeong et al. study (Jeong et al., 2014) the results showed that two-thirds of retail
companies indicated their greatest motive for going green was to improve the company’s
image. In an online survey of 30,000 consumers in 60 countries conducted by The
Nielsen Company in 2015, it was found that marketing environmental impact initiatives
was a strategy commonly used by businesses to reach consumers and sales of
consumer goods from brands that demonstrated a commitment to sustainability grew
more than 4% globally and those without grew less than 1%. (The Nielson Company,
2015) There was a difference between those who chose to actively market their focus on
sustainability and those who simply used claims such as “organic” or “Oceanwise” (in
this case) on their products, storefront, or menus. For this study, both active marketing
strategies and claims were considered to fall into the “yes” category.
For those respondents that I spoke with while completing the survey, if they had
responded to the previous questions that they used Styrofoam or several other single-
use items, they were often surprised that I was asking this question on green marketing
and responded with a definite “no”. This response is shown in the data, particularly
related to the use of Styrofoam and those restaurants who did not describe their
restaurant as green or sustainable (Table 18 and 19).
A chi-square test of independence was performed to examine the relationship between
the use of green marketing and the use of Styrofoam or SUI’s in restaurants. The
relationship between these variables was significant for Styrofoam, p=0.002 (Table 19).
Respondents that indicated they described their restaurant as green, sustainable, or
environmentally friendly, were less likely to use Styrofoam than those that did not. This
differs from the results showing the use of SUI’s, where those restaurants who used
green marketing (84.6%) only showed a slightly lower use of SUI’s than those who did
not (89.2%) (Table 18).

50
Table 18 Relationship between describing the restaurant as green/sustainable and SUI’s
Green/sustainable marketing
Doesn’t use green/sustainable marketing
SUI
84.6% 89.2%
Sustainable Materials
15.4% 10.8%
Totals 100% 100%
Chi Square: 0.191a, d=1, p=0.638
Table 19 Relationship between describing the restaurant as green/sustainable and Styrofoam
Green/sustainable marketing
Doesn’t use green/sustainable marketing
Styrofoam
0% 45.9%
No Styrofoam
100%% 54.1%
Totals 100% 100%
Chi Square: 9.050a, df= 1, p=0.002
From my conversations with those completing the questionnaire, many respondents
related this question of green marketing to more specific certifications such as “Certified
Organic”, or “Oceanwise” (the Canada-specific certification of sustainable seafood) and
asked if this would qualify as “green marketing”. Many respondents mentioned that these
were indicated on their menus or their websites. Although it does not relate specifically
to packaging, these certifications indicate that the restaurant values the sustainability
and the origin of their food and want to make sure it is available for their customers to
see. (Ocean Wise, 2019)
6.6. Primary languages spoken in-house
The City of Vancouver conducted a phase 3 report on the engagement and consultation
done to date with local businesses on the SUIRS, and a key result from this report
indicated the strong importance of language access to connect with business owners
and customers on issues such as consumer awareness, associated costs and the need
for reducing SUIs. (City of Vancouver, 2018) The 2016 census reports that visible

51
minorities represent more than half (51.6%) of Vancouver’s population, yet the City of
Vancouver has found through this consultation process that they have very little
interaction with the city.
In a targeted engagement from the City of Vancouver with small business owners, there
was a resounding request for more information in other languages on the reduction
strategies and information on recyclable and compostable packaging. The participants of
this consultation indicated that the city should continue to explore methods for expanding
language access and participation of these small ethno cultural businesses to minimize
unintended consequences and help build trust. (City of Vancouver, 2018)
It was because of this consultation done by the City of Vancouver that I decided to ask
respondents about the languages that were spoken in-house. Although the types of
cuisine were surveyed as well, this does not necessarily or, based on my research,
regularly indicate the primary languages spoken among staff. There were no significant
relationships between languages spoken in-house and the use of SUI or Styrofoam from
the 52 restaurants surveyed, but there were some notable statistics when looking at the
languages most used and the use of either SUI or Styrofoam in the restaurant.
Out of the 52 restaurants managers and owners surveyed, there were 19 that indicated
a language other than English was the primary language used in-house. There were
also another 22 restaurants that indicated another language in addition to English as a
primary language used in-house. From the results of the questionnaire, only 11
restaurants had English as their only primary language used within the restaurant (see
Table 37 in Appendix iv).
The top three languages spoken aside from English were Spanish, Indian (Punjabi or
Hindi), and Chinese (Mandarin or Cantonese). Of the 12 restaurants that indicated
Spanish as the primary language, 11 of these restaurants were not using Styrofoam
(91.7%) (Table 20) and only 4 were using SUI’s (Table 21). Out of the 10 restaurants
that indicated Indian (Punjabi or Hindi) as their primary language, 90% were using SUI’s
(Table 22) and 70% were also using Styrofoam (Table 23). Of the eight restaurants that
indicated Chinese as their primary language used in-house, all eight used SUI’s (Table
24) and over one third use Styrofoam (Table 25).

52
Table 20 Spanish as the primary language used in-house vs other languages and use of SUI’s
Other languages Spanish
Sustainable Materials Only
5% 33.3%
SUI 95% 66.7%
Totals 100% 100%
Table 21 Spanish as the primary language used in-house vs other languages and use of Styrofoam
Other languages
Spanish
No Styrofoam 55% 91.7%
Styrofoam 45% 5.3%
Totals 100% 100%
Table 22 Indian (Punjabi or Hindi) as the primary language used in-house vs other languages and use of SUI’s
Other languages
Indian (Punjabi or Hindi)
Sustainable Materials
11.9% 10%
SUI 88.1% 90%
Totals 100% 100%
Table 23 Indian (Punjabi or Hindi) as the primary language used in-house vs other languages and use of Styrofoam
Other languages
Indian (Punjabi or Hindi)
No Styrofoam
71.4% 30%
Styrofoam 28.6% 70%
Totals 100% 100%

53
Table 24 Chinese as the primary language used in-house vs other languages and use of SUI and Styrofoam
Other languages Chinese (Mandarin or Cantonese)
Sustainable Materials Only
14% 0%
SUI 86% 100%
Totals 100% 100%
Table 25 Chinese as the primary language used in-house vs other languages and use of Styrofoam
Other languages Chinese (Mandarin or Cantonese)
No Styrofoam 63.6% 62.5%
Styrofoam 36.4% 37.5%
Totals 100% 100%
From the completed surveys, 33 of the 52 respondents indicated English as a primary
language used in-house (see Table 43 in Appendix IV), and over two-thirds of these
restaurants were not using any Styrofoam (Table 26).
Although there were no significant relationships between language and the use of SUI or
Styrofoam, there is evidence that the request for resources in additional languages for
engagement and consultation with small businesses on the SUIRS is valid and should
be taken seriously by the City of Vancouver.
Table 26 English as a primary language used in-house and use of SUI and Styrofoam
Other languages English
No Styrofoam 58% 67%
Styrofoam 42% 33%
Totals 100% 100%

54
Table 27 English as a primary language used in-house and use of SUI's
Other languages English
Sustainable Materials Only
10.5% 12.1%
SUI 89.5% 87.9%
Totals 100% 100%
6.7. Restaurant take-out culture
Restaurant take-out culture is growing, whether that be the traditional take-out through
the restaurant itself, or through new delivery services, the convenience of having food
delivered to your door continues to drive demand. (Coppolino, 2018). There were three
different aspects of take-away food covered in this research: use of delivery services,
type of packaging available for either take-out or eat-in, and ordering style (counter or
table). These three different categories were able to be studied both through observation
and through the questionnaire responses.
The focus on take-away in restaurants and its relationship to SUI’s became even more
relevant to my study after speaking with several business owners who indicated that
their percentage of business that comes from delivery services continues to grow and
has in some cases changed the main focus of their restaurant. One restaurant owner
estimated that 60%-70% of business now came from take-out, and the restaurant often
sat empty while the kitchen focused on preparing these orders (see Table 42, Appendix
III).
Table 28 Percentage of restaurants surveyed that use Styrofoam and SUI and are designed for take-out, use delivery services, or have counter-only ordering from questionnaire
Styrofoam SUI
Designed for take-out
39% 100%
Use delivery services
74% 97.2%
Counter order only 48% 72.7%

55
6.7.1. Use of restaurant delivery services
For the past several years, food delivery services have become more and more popular
in Vancouver and apps such as Door Dash, Uber Eats, Foodora, Skip the Dishes, etc.,
have become a staple for small restaurants. According to research done by the NPD
group in November 2018, the sales from food delivery services in the US alone are over
$2 billion annually and growth is 15 per cent each year. (Coppolino, 2018). Skip the
Dishes, a Canadian food delivery service, says they have more than one million active
customers in Canada placing millions of orders each month. Uber Eats, an international
food delivery service, has partnered with over 10,000 restaurants in Canada and
150,000 worldwide. (Coppolino, 2018) This switch over the past several years has
required restaurants to be prepared for more take-out deliveries, which not only means
having a higher quantity of packaging items but more diversity to cover items like sides,
dips, soups, etc. as online take-out menus expand.
The questionnaire asked respondents whether they used delivery services such as
Foodora, Uber Eats, DoorDash etc. and 70% of those who completed the survey
responded “Yes”.
Table 29 Number of restaurants using delivery services from questionnaire and observed data
Uses delivery services
Total number of restaurants with data
Percentage
Questionnaire data
36 51 71%
Observed data 46 86 53%
From the questionnaire data, 97% of the restaurants who used delivery services were
using SUI’s (Table 30) and 87% of restaurants who did not use food delivery services
were not using Styrofoam (Table 31). A chi-square test of independence was performed
to examine the relationship between the use of food delivery services and the use of
SUI’s and Styrofoam in restaurants. The relationship between these variables was
significant for SUI’s, p=0.006 (Table 30) and for Styrofoam, p=0.03 (Table 31).
Restaurants that use food delivery services were more likely to use SUI’s and Styrofoam
than those who did not.
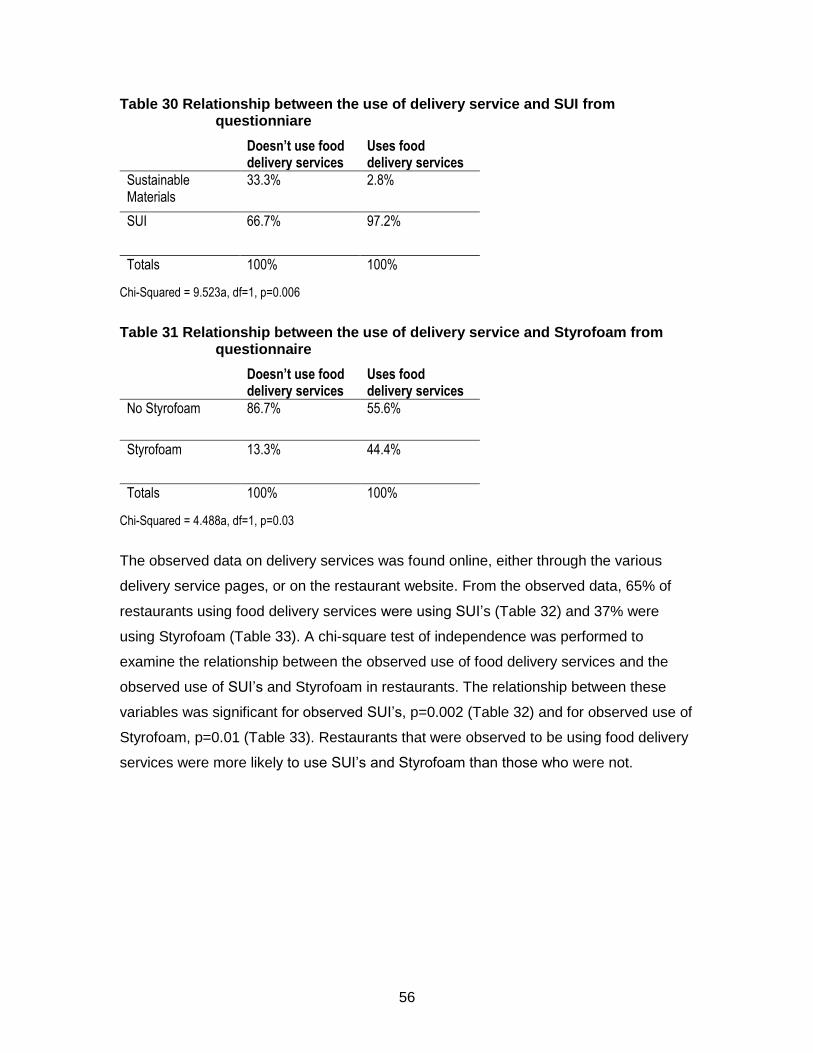
56
Table 30 Relationship between the use of delivery service and SUI from questionniare
Doesn’t use food delivery services
Uses food delivery services
Sustainable Materials
33.3% 2.8%
SUI
66.7% 97.2%
Totals 100% 100%
Chi-Squared = 9.523a, df=1, p=0.006
Table 31 Relationship between the use of delivery service and Styrofoam from questionnaire
Doesn’t use food delivery services
Uses food delivery services
No Styrofoam 86.7% 55.6%
Styrofoam
13.3% 44.4%
Totals 100% 100%
Chi-Squared = 4.488a, df=1, p=0.03
The observed data on delivery services was found online, either through the various
delivery service pages, or on the restaurant website. From the observed data, 65% of
restaurants using food delivery services were using SUI’s (Table 32) and 37% were
using Styrofoam (Table 33). A chi-square test of independence was performed to
examine the relationship between the observed use of food delivery services and the
observed use of SUI’s and Styrofoam in restaurants. The relationship between these
variables was significant for observed SUI’s, p=0.002 (Table 32) and for observed use of
Styrofoam, p=0.01 (Table 33). Restaurants that were observed to be using food delivery
services were more likely to use SUI’s and Styrofoam than those who were not.

57
Table 32 Observed Relationship between the use of delivery service and SUI
Doesn’t use food delivery services
Uses food delivery services
Sustainable Materials
67.5% 34.8%
SUI 32.5% 65.2%
Totals 100% 100%
Chi-Squared = 9.161a, df=1, p=0.002
Table 33 Observed Relationship between the use of delivery service and Styrofoam
Doesn’t use food delivery services
Uses food delivery services
No Styrofoam 87.5% 63%
Styrofoam 12.5% 37%
Totals 100% 100%
Chi-Squared = 9.722a, df=1, p=0.01
The use of food delivery services was a popular point of discussion during conservations
with respondents. One respondent of the survey noted that with the substantial amount
of business being take-out it is still important to ensure customer satisfaction, and this
means having their orders arrive hot and intact. The quality of food for these restaurants
remains important and the appropriate materials need to be available to achieve this. In
the example of the New York City polystyrene ban, the restaurant associations noted
this concern of the quality of their products being at risk with alternate products (such as
compostable items) when fighting against the ban. (Hardcastle, 2013) In an interview
with CBC, the owner of the Wooden Boat Food Company in Kitchener Ontario said he
didn’t want to risk the quality of food and has therefore chosen not to use these delivery
services. (Coppolino, 2018) And while some restaurants have decided not to use these
services, others now rely on this business to survive and must adapt to using the
necessary packaging to maintain quality.
6.7.2. Restaurant design – “designed for eat-in or take-out”
Given the obvious uptake of restaurant delivery services and how big a role this plays for
local business, my observations included the packaging options available for serving
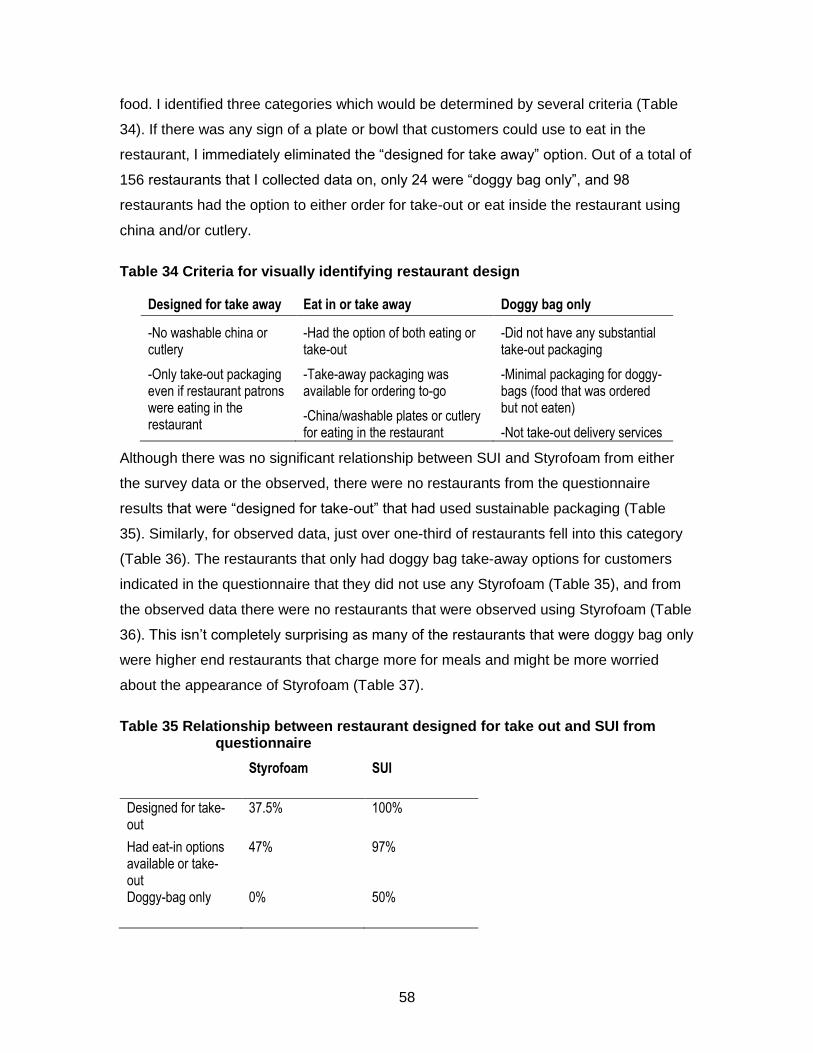
58
food. I identified three categories which would be determined by several criteria (Table
34). If there was any sign of a plate or bowl that customers could use to eat in the
restaurant, I immediately eliminated the “designed for take away” option. Out of a total of
156 restaurants that I collected data on, only 24 were “doggy bag only”, and 98
restaurants had the option to either order for take-out or eat inside the restaurant using
china and/or cutlery.
Table 34 Criteria for visually identifying restaurant design
Designed for take away Eat in or take away Doggy bag only
-No washable china or cutlery
-Only take-out packaging even if restaurant patrons were eating in the restaurant
-Had the option of both eating or take-out
-Take-away packaging was available for ordering to-go
-China/washable plates or cutlery for eating in the restaurant
-Did not have any substantial take-out packaging
-Minimal packaging for doggy-bags (food that was ordered but not eaten)
-Not take-out delivery services
Although there was no significant relationship between SUI and Styrofoam from either
the survey data or the observed, there were no restaurants from the questionnaire
results that were “designed for take-out” that had used sustainable packaging (Table
35). Similarly, for observed data, just over one-third of restaurants fell into this category
(Table 36). The restaurants that only had doggy bag take-away options for customers
indicated in the questionnaire that they did not use any Styrofoam (Table 35), and from
the observed data there were no restaurants that were observed using Styrofoam (Table
36). This isn’t completely surprising as many of the restaurants that were doggy bag only
were higher end restaurants that charge more for meals and might be more worried
about the appearance of Styrofoam (Table 37).
Table 35 Relationship between restaurant designed for take out and SUI from questionnaire
Styrofoam SUI
Designed for take-out
37.5% 100%
Had eat-in options available or take-out
47% 97%
Doggy-bag only 0% 50%

59
Table 36 Observed between restaurants designed for take-out and SUI
Styrofoam SUI
Designed for take-out
38.9% 66.7%
Had eat-in options available
24.6% 50.8%
Doggy-bag only 0% 9%
Table 37 Relationship between average entrée price over $25 and restaurants that only have doggy bag take-away options
Average entrée price
Take-away or eat in options
Doggy bag only
Under $25 100% 82%
Over $25 0% 18%
Totals 100% 100%
Chi-Square = 12.232a, df=1, p=0.01
6.7.3. Ordering style
Through observation I was able to determine whether restaurants had table service or if
they required customers to order at the counter. This category was kept separate from
the question of “designed explicitly for take-out” because there were restaurants where
you could order at the counter and ask for a “for here” cup/plate/bowl. For the
restaurants that I was able to collect data on out of the 156 on the total list, none of the
restaurants that had table service were explicitly designed for take-out, meaning they
were all able to provide washable dishes and cutlery for eating in (Table 38).
There is a significant relationship between having a restaurant where you order at the
counter and only having take-out packaging available. A chi-square test of
independence was performed to examine the relationship between the observed
ordering style and the types of packaging available for customers. The relationship
between these variables was significant for counter service only, p=0.00 (Table 38).
Restaurants that only had counter service ordering available were more likely to only
have take-out packaging available for customers than those who had table service
ordering options.

60
Table 38 Relationship between ordering style and restaurant design for all restaurants
Counter service
Table service
Ability to eat-in 43.6% 100%
Explicitly designed for take-out
56.4% 0%
Totals 100% 100%
Chi Square: 69.333a, df=1, p=0.000
Table 39 Ordering style for Styrofoam and SUI from questionnaire
Styrofoam SUI
Table service 35% 92.5%
Counter Service 45.5% 72.7%
Table 40 Observed ordering style for Styrofoam and SUI from
Styrofoam SUI
Table service 23.1% 50%
Counter Service 37.9% 65.5%
6.8. Quantitative findings
The quantitative results from the questionnaire have led to several key findings with
regards to cuisine type, average entrée price, size of the restaurant, ownership model,
green marketing, primary languages spoken amongst staff, and restaurant take-out
culture.
Some of the key statistically significant results showed that chain or franchise owned
restaurants were less likely to use SUI’s than independently owned restaurants, that
restaurants who describe themselves as green or sustainable were less likely to use
Styrofoam, and that restaurants that use food delivery services were more likely to use
SUI’s and Styrofoam than those who did not.

61
Other noteworthy conclusions from this data shows that as the average entrée price
increases, the number of restaurants using Styrofoam and SUI’s decreases and
approximately half of restaurants surveyed and observed had between 10-20 seats. Out
of 52 restaurants surveyed, 19 (37%) indicated a language other than English was the
primary language used by staff. All restaurants that indicated Chinese (Cantonese or
Mandarin) as their primary language and 90% of restaurants that indicated Indian
(Punjabi or Hindi) were using SUI’s.
These quantitative conclusions have helped to supplement the results from the
motivations and barriers section that allowed restaurants to give more information on
their own reasoning for using or not using SUI’s. These conclusions will be discussed
further in the conclusions chapter.

62
Chapter 7. Motivations and Barriers
7.1. Motivations for choosing sustainable packaging
Respondents were asked to identify their motivations for using sustainable packaging in
the questionnaire. There were several restaurants owners or managers that I spoke with
that were very enthusiastic about this topic, and others that thought this was just the
norm.
Almost half of the restaurants who were using sustainable materials indicated that this
was a values-based decision and that sustainability was important to them (Figure 9).
Those who provided additional comments (see Table 41, Appendix II) indicated that their
owners “cared a lot about sustainability” or that they chose to make certain decisions like
switching to compostable straws or buying the more expensive and durable plastic
container hoping that customers will reuse them. These owners and managers showed
interest in developing sustainable practices, even if they had only started with small
steps such as removing plastic straws. One restaurant owner went even further to
explain that their restaurant had the “highest standards of organic, and free-range meat”
as well as an option for customers to bring in their own containers. Another restaurant
owner, that still uses some Styrofoam for take-away, but was trying to make the switch,
mentioned that they purchase the hard-plastic containers even though they are more
expensive because they hope that their customers will re-use them.

63
Figure 9 Reasons for using sustainable materials
Over one third of restaurants who are using sustainable materials indicated that this was
due to consumer demand (Figure 9). Several of the respondents brought up Styrofoam
and how this can immediately put off customers. One restaurant owner described a story
of a customer posting a picture of their doggy-bag in a Styrofoam container in a review,
and how this could ruin someone’s otherwise very pleasant experience. This specific
restaurant owner chose to move away from Styrofoam for this reason. This story fits with
the data from restaurants with an average entrée price of over $25 where Styrofoam is
rarely used.
Another owner said that their customers expected sustainable packaging and told a
story of when they first took over the location, the previous restaurant had left Styrofoam
containers, they begin to use these as they would have gone in the waste otherwise and
were already purchased, but customers complained and they eventually had to stop
using them and throw them away (see Table 41, Appendix II).These types of responses
came from those restaurants who had indicated that they were already using sustainable
materials, whereas many restaurants who indicated they were using Styrofoam did not
mention any concerns from their customers.
Only 11% of respondents indicated that they had made any sustainable packaging
choices due to the City of Vancouver’s SUIRS. One restaurant specifically stated that
their sustainable packaging choices had nothing to do with City of Vancouver regulations
or plans, but that the owner cared about sustainability and they chose to purchase boxes
Sustainability is a core value
for my restaurant
48%
It made financial sense
4%
Customers prefer more sustainable packaging
options33%
I know that the City of Vancouver is implementing a Single-Use Item
Reduction Strategy
11%
Other:4%

64
with hard plastic that cost $1 each instead of the cheaper versions in the hopes that the
customers would be able to use these again. Other restaurants that did indicate they had
made these choices due to the SUIRS, specifically mentioned the straw ban and that it
was why they had chosen to move away from straws. Some restaurants mentioned that
the City of Vancouver had banned straws already, but this was inaccurate as the ban
was originally to be instated June 2019, and now January 2019.
There were only 4% of restaurants that indicated that they had made sustainable
choices because it made financial sense (Figure 9). I believe this is an opportunity for
further engagement and education for small restaurant owners on how making certain
sustainable choices for their restaurant and packaging specific could help to save money
in the long run.
In both the literature, and in the quantitative and qualitative results from my research,
management values were identified as being a key motivation for prioritizing
sustainability within business. In a survey of over 400 enterprises in Spain, Garay and
Font (2011) showed that the key reason for acting responsibly was for altruistic reasons
and findings from interviews done in the tourism and hospitality industry in Western
Australia showed that management awareness of impact of their actions on the
environment was key (Alonso and Ogle, 2010). These examples and those from this
research indicate that there is a need for further research into whether values driven
motivation is consistent as a key factor in businesses and restaurants becoming early
adopters of sustainable practices.
Although I had expected to gain more practical information on how these restaurants
had made the decision to switch to sustainable packaging, it became clear that values
were a leading driver of this decision. This is a more difficult take-away to share with
other restaurants than some of the other possible motivations but does provide insight
into opportunities for engagement such as further education on the environmental
impacts of single-use items.

65
7.2. The barriers to using sustainable packaging
Respondents were asked to identify the barriers that they face in using sustainable
packaging in the questionnaire. This question was completed on the survey but also
came up frequently in conversations with the respondents. The biggest barrier for
restaurants was cost, which came up with almost one quarter of the respondents (Figure
10). Those who chose to provide further comments on why cost was a barrier
specifically mentioned that paper products were more expensive than plastic, and that
there were not enough affordable alternatives to SUI’s (see Table 42, Appendix III).
From prices on restaurant supplies ordering websites, the difference in price between
ordering Styrofoam containers and ordering compostable packaging alternatives is
substantive. A case of 500 16oz foam soup containers costs $32.99, compared to a
case of 500 16oz soup containers made of heavy clear plastic which costs double at
$69.99 (this does not include the price of the lid). Looking at the cost difference for a
larger hinged container, a case of 500 foam containers costs $29.99, compared to a
case of 500 of the compostable alternative which costs more than double at $79.99.
(Supply Box, 2017) These differences in prices can be a barrier for small restaurants
and could hinder their ability to hire another staff person or cause them to raise the cost
of their food and therefore potentially risk their sales.
One respondent specifically mentioned the challenge of the costs of switching from
plastic straws to paper straws and the lack of affordable alternatives for a product they
need for the disabled community. Respondents also mentioned the overall challenge of
prices rising both for products, but also for recycling and waste management fees, and
especially property taxes. These comments were also reiterated by small businesses in
several news articles done around the time that property taxes increased substantially in
the West End. One long-time business owner in the West End said her property tax bill
increased by nearly 93 per cent that year, meaning their small business has to pay
$130,000 in property taxes. (Azpiri and McArthur, 2017)

66
Figure 10 Reasons for not choosing sustainable materials
The second most common barrier for respondents was that they were not in control of
the purchasing of their packaging. For some restaurants this was because they were a
part of a small chain and orders were made by a central office or primary locations and
then distributed amongst the restaurants. Other respondents indicated they were not in a
position within the restaurant to make these types of decisions (servers, bartenders, etc.)
and these purchasing decisions were made by a manager or owner. A few of these
respondents identified some frustration as the management team had no interest in
sustainability, or in some cases even basic recycling of bottles and plastic (see Table 42,
Appendix III). This point was recognised later in the questionnaire with the question “Is
your restaurant struggling with any other waste management issues?” where several
staff responded that recycling was an issue as their restaurant did not recycle at all. Staff
who brought this point up seemed frustrated about the lack of leadership from the
management of the restaurant and that this was something that should be done. One
server said that the topic of recycling or composting had never been brought up to the
servers. Another respondent said that they faced barriers to recycling and composting as
many of the staff come from different cultures and explaining the system was difficult
(see Table 42, Appendix III).
It is too expensive23%
There are not enough alternative options that meet
my restaurants needs16%
I do not know where to procure
compostable, recyclable, or
reusable packagin 2%
I am not in control of product purchasing for my
restaurant 21%
It is inconvenient for staff and/or customers
3%
Single-use plastic items are more
hygienic0%
I have not considered using
compostable, recyclable or
reusable packaging
17%
Other:18%

67
The other major barriers for respondents focused around a shortage of alternative
options and lack of awareness. The lack of awareness was linked to comments from
staff regarding their management team’s non-interest in sustainability, or an absence of
comments from the respondents while completing the survey.
I chose to add the option of “single-use items are more hygienic” to the questionnaire
based on feedback from several people who had worked in this field and had heard this
from other restaurant owners as an issue. From the restaurants who responded to the
survey, no one chose this as a barrier to moving away from SUIs.
In further conversations with some the respondents, several additional barriers were
brought up including a lack of time and space. Space is an issue that many restaurants
face in the West End as properties are usually quite small and businesses want to make
the most of this space with tables and seats for customers. One respondent indicated
that switching packaging products will require more storage space for the new items,
and this is something they don’t have.
Time is money, and as a small restaurant, and especially a new restaurant, there are
already many burdens in keeping your business going. Respondents indicated that with
a limited number of staff in a small restaurant the majority of time goes towards
managing the budget, the staff, and often running managing the restaurant themselves.
Although some indicated they would like to be more sustainable, it was easiest to go
with the status-quo as the alternative options were not readily available or clear. This
comes back to the barriers that small restaurants face in making these transitions, such
as a lack of knowledge, a lack of will, or a belief that they do not need to be the ones to
make this change. (Markle, 2014)
One of the key points to take away from these conversations was that restaurant owners
who would like to use more sustainable packaging didn’t know where to look and didn’t
have the time to research the best, most affordable, sustainable options. Several
respondents specifically mentioned the need for governmental support on the transition
to more sustainable packaging. Several ideas were mentioned such as reducing taxes
for small businesses, reducing GST to 2.5% and putting the rest towards helping
businesses transition to more sustainable practices, having a fixed location and price for
restaurants to purchase products, and having local government dedicate time and

68
resources to push cities in the right direction with the right resources. One respondent
ended their final thoughts on the topic by saying “the City needs to push for these things,
or they won’t happen” (see Table 42, Appendix III).

69
Chapter 8. Conclusions and Recommendations for Future Studies
To conclude this research paper, I would first like to recognize the limitations of the study
with regards to non-response bias and the generalizability of the results. The
conclusions will then provide a summary of the key points throughout this paper that
assisted in identifying the key motivations and barriers for cities in transitions to
sustainable packaging. Finally, I will conclude with recommendations for future studies
related to this topic or to the methodology of the research.
8.1. Limitations
There were several limitations to the study starting with time constraints. The original
study area was the West End, but I was not able to make it to all the restaurants on my
original list and I was only able to follow up with restaurants where I dropped off a survey
once. If I had more time, I believe I would have been able to collect more data from the
restaurants in the neighbourhood and ensure there was a full representation of
restaurants in the neighbourhood.
Because of these limitations of time and resources, there is a possibility of non-response
bias. The results of the tests on the restaurants that I went to and those that I didn’t
showed that I went to more restaurants that had the average entrée price between $15-
$25, 10-20 seats, and had table service. There is also the possibility of non-response
bias, and that of the restaurants that I dropped off surveys to, the ones who responded
differed from those who didn’t due to unknown factors. These factors could include
language barriers that I did not recognize, lack of capacity and time, lack of knowledge
of the topic, and more.
The conclusions outlined in this paragraph represent the results from this study and can
help to provide insights for local governments and small restaurants. The conclusions
are not generalizable across the entire population of restaurants in Vancouver as this
was just a sample, target population and other neighbourhoods could see different
results.

70
8.2. Conclusions:
There were several conclusions that came from this research and although it was a
relatively specific sample size, it provides a good overview of some of the key barriers
that restaurants face in adopting more sustainable packaging options, and some of the
motivations for those who have already made this switch.
To answer my thesis question which is:
Following Vancouver’s adoption of a Single-Use Item Reduction Strategy, which are the small restaurants that have managed to eliminate single-use plastics and how have they successfully transitioned to using more sustainable food packaging while continuing to remain economically viable?
Of the 52 restaurants that completed the questionnaire only 11% (6 restaurants) had
completely made the switch to sustainable packaging, From the observation data, only
16% of the 88 restaurants (14 restaurants) had made the switch to sustainable
packaging. A large quantity of the other restaurants identified a mix of sustainable
materials and SUI’s, and some relied heavily on SUI and Styrofoam.
8.2.1. Barriers
I will begin my conclusions by identifying some of the key barriers that are prohibiting
such a large proportion of small restaurants from making this complete transition to more
sustainable packaging.
Stability and costs: As many other growing cities, Vancouver’s restaurant scene is
fragile one. Businesses around the city are struggling to stay alive due to increased
costs, specifically property tax increases, but also an increase in costs of products.
These costs hinder the ability to make any decisions that would impact the bottom line of
a restaurant, including spending a bit more for sustainable packaging.
Engagement and education: Even after consultation on the SUIRS, there is a lack of
consultation and education for small businesses on this plan and the opportunities and
resources available to support them to make changes. There is also a significant
relationship between the languages spoken by restaurant staff and the use of SUI’s.
There is a need for more direct engagement with business owners and staff in a variety

71
of languages to explain the SUIRS and address the barriers these businesses are
facing.
Lack of affordable and accessible alternatives: Styrofoam and other SUI’s are
serving a purpose for small restaurants and in many cases the owners and managers
are not seeing acceptable alternatives that will fit their budgets.
New focus for the restaurant industry: The steady rise of delivery food services has
had a huge impact on the small restaurant industry. Small and independent restaurants
are now relying on these applications and the business they bring, which drives the need
for more take-away packaging options.
8.2.2. Opportunities
Although small businesses are facing many challenges and barriers to transitioning to
sustainable packaging, there are several restaurants who have managed to do so and
there are opportunities for learning from them.
Opportunity for partnerships and innovation: There is a global movement to take
action on single-use plastics from both local, regional and national governments. Local
governments have an opportunity to work with businesses and create innovative
programs to support and boost the local economy while assisting small restaurants in
transitioning to more sustainable practices. Businesses rely on local governments for
support, but small businesses are also essential to maintaining a vibrant and diverse
local economy. There are successful examples of partnerships and new technologies in
other cities around the world for reducing waste and creating a circular and sharing
economy, these can help small restaurants and local governments, and other industries,
adapt and thrive.
Local Government Policy Regulations: In addition to implementing bans and fees on
single-use items, local governments might have other opportunities to implement policies
that could help to reduce waste in the restaurant industry while supporting small
businesses.
Given the surge of delivery services indicated in the results of this research and the
global growth of companies such as Uber Eats, Foodora, etc. there could be an

72
opportunity for local governments to regulate the online food delivery industry.
Regulation through business licenses like the City of Vancouver has done with home
share companies such as Airbnb, could help to ensure that the demand for meals to be
delivered to the home quickly and efficiently does not encourage the use and growth of
single-use items.
The literature and results from this research have shown that there are several barriers
for small businesses to be successful. For this reason and that small businesses are
emitting little waste compared to large corporation, there could be reason for allowing
exemptions for small and independent businesses on regulations within the SUIRS
which would force the larger chain restaurants to make this transition first.
Marketing and branding: The restaurant industry is highly competitive, and many
businesses rely on marketing and branding to attract a viable customer base. Several
studies show that there is an increase in demand from customers for more sustainable
businesses (and restaurants) and some restaurants in the West End are already using
this to their advantage. There is an opportunity for businesses to use sustainability
initiatives to attract a new customer base through marketing.
Collaboration and engagement: Many businesses are interested in making the switch
to sustainable packaging and would be welcome to the idea of support and guidance
from government. There was a significant relationship between chain and franchise
restaurants and a lack of SUI’s, indicating that collaboration among restaurants could
provide an opportunity for group purchasing or knowledge sharing.
Given the upcoming implementation of the SUIRS, and the most recent delay of the ban
of plastic straws and Styrofoam, these results could be useful in determining the best
strategies for ensuring that restaurants are complying with new regulations but also
taking the opportunities for innovation and collaboration and ultimately compliance while
remaining economically viable
8.3. Recommendations for future studies
The collection of data from restaurants was a different process than I had originally
expected. I was able to dedicate two weeks between January 7th and January 31st 2019
to distribute the surveys to restaurants. I found that many restaurants were closed the

73
first week of January to take a break after the holidays, but most re-opened the following
week (January 7th). I chose to do this during regular business hours and was able to do
this because of my work schedule at that time. From my experience working in the
restaurant industry, I decided that the ideal times for visiting restaurants would be
between 11am-12pm and between 130pm-6pm. I quickly learned after my first day
distributing the surveys that this would not be a quick process of dropping off the surveys
and leaving, as many of the managers, owners, or other staff members were willing to
have deeper discussions. The first restaurant I visited, the manager asked if I would like
to sit down and have a complimentary coffee. This sentiment was replicated many times
as I continued this process in restaurants throughout the West End and led me to
confirm my original hypothesis that this would be a time of the year when restaurants
would not be as busy. I recommend to any future studies that involve work with
restaurants to take advantage of this slow time of year after the holidays to approach
those who work in the hospitality industry.
Due to the lack of awareness of the SUIRS and the issues and benefits related to the
types of packaging used in restaurants, further studies could explore how local
governments could better communicate with small businesses and restaurants. This
study could include different types of engagements with the restaurants throughout the
creation of the SUIRS and gathering feedback from restaurant owners on what has
worked and what has not. There is a lack of information flow to those restaurants who
are not actively engaged. The study should also include a focus on engagement with
staff in other languages.
Other future studies on this topic could focus on the potential of using group purchasing
models for small restaurants to allow bulk orders to be placed with less financial risk.
This was not a specific question on the survey, but the results indicated that there was a
significant relationship between independent restaurants and the use of Styrofoam.
Given the fast turnover of restaurants in the West End, this could also support the idea
that small restaurants who are unsure of their longevity might be hesitant to purchase
cheaper, bulk orders of more sustainable materials.
The feasibility for local governments to successfully regulate of food delivery services
and provide exemptions for small and independent restaurants is a topic that would

74
require further research as well as further investigation on the potential results these
policies could yield.
As cities like Victoria, Seattle, and Montreal continue to implement their policies on
single-use items, there is a great opportunity to evaluate whether these plans have been
successful and how they have worked with local business. This evaluation and reporting
could be very useful for those cities who are just in the initial stages of their research and
planning initiatives.

75
Appendix I. Survey
Restaurant Survey: Packaging in the West End
1. Restaurant Name*: __________________________________________ (*information is only for the purpose of this study and will be kept confidential)
2. What is the ownership model of the restaurant?
Independent (this is the only location)
Chain (centralized ownership – more than one restaurant)
Franchise (owned separately, but part of a chain concept)
3. What is your job title?
Owner
Manager
Other: ________________________________________________________
4. What type of materials does your restaurant use for take-out/to-go packaging? Please check all that apply.
Compostable or biodegradable plastic
Compostable (paper or natural materials)
Reusable (ex. Cloth bags, reusable containers etc.)
Styrofoam
Hard plastic (plastic take-out boxes, plastic ramekins etc.)
Soft plastic (plastic bags etc.)
Other (please describe): _____________________________________________
5. Which of these items does your restaurant purchase? (Please check all that apply):
Coffee cups (wax-lined paper cups)
Plastic cups
Styrofoam cups
Plastic bags
Paper bags
Styrofoam containers
Plastic containers
Plastic straws
Compostable straws
Plastic cutlery
Compostable cutlery
Other (please describe): ______________________________________________
6. If your restaurant uses any compostable, recyclable or reusable materials, please select one or more of the reasons below:
Sustainability is a core value for my restaurant
It made financial sense
Customers prefer more sustainable packaging options

76
I know that the City of Vancouver is implementing a Single-Use Item Reduction Strategy
Other (please describe): ______________________________________ 7. If your restaurant DOES NOT use any compostable, recyclable or reusable
materials, please select one or more of the reasons below:
It is too expensive
There are not enough alternative options that meet my restaurants needs
I do not know where to procure compostable, recyclable or reusable packaging
I am not in control of product purchasing for my restaurant
It is inconvenient for staff and/or customers
Single-use plastic items are more hygienic
I have not considered using compostable, recyclable or reusable packaging
Other (please describe): ______________________________________________
8. Does your restaurant use food delivery services, either in house, or companies such as Foodora, Uber Eats, Skip the Dishes etc.?
Yes
No
9. Do you describe your restaurant as green, sustainable, or environmentally conscious in your marketing? Please check one.
Yes
No Other comments: ______________________________________________________
10. Languages primarily used at your restaurant (front and back of house): _______________________________________________________________
11. Are you interested in engaging in a 25-minute conversation to discuss your restaurants packaging challenges or the impact that a single-use item strategy will have on your business?
Yes, please contact me at: ____________________________________________
No Additional comments: Is your restaurant struggling with any other waste management issues? Please check all that apply.
Organic/food waste collection
Disposing of grease waste
Recycling refundable bottles or plastic/glass containers
Other: _________________________________________________________ Do you have any other comments or concerns regarding the packaging or materials used in your restaurant? _____________________________________________________________________ Contact: Shea O’Neil Masters of Urban Studies Candidate – Simon Fraser University | t: 604-562- 7079 | [email protected]

77
Appendix II. Themes from comments and notes on motivations for choosing sustainable packaging
Table 41 Comments and notes from questionnaire respondents on motivations for choosing sustainable packaging
Theme Comments/notes
Values -Owners care a lot about sustainability but has nothing to do with the COV, it is part of how the restaurant is - values of the owners and sustainability was important to them - Very passionate about sustainability - highest standards of organic, free range, etc. and this carries over to their packaging. They use all compostable packaging and you can bring your own container to fill too. - They care a lot about sustainability- customers really happy about switching to compostable straws. They don’t do much take out - only have plastic cutlery if people ask. -The owner really cares about recycling. - Sustainability is important for owners -Chose to use hard plastic containers over Styrofoam, hoping that people will re-use even though it costs more.
SUIRS -They knew about the straw ban and have adjusted accordingly.
-They have some Styrofoam but mostly use hard plastic even though it costs $1 per box but owner hopes that people will re-use them. Uses Styrofoam for some dishes to go.
Customer demand - Customers complained immediately. They don’t want to use Styrofoam because customers expect them to be sustainable and it’s important to the owner. - customers don’t want Styrofoam and plastic -Don’t want to give Styrofoam to customers because one post on social media of a customer posting about Styrofoam could ruin an otherwise great experience. -People care a lot about Styrofoam- would bring their own containers to avoid using.

78
Appendix III. Themes from comments and notes on barriers to choosing sustainable packaging
Table 42 Comments and notes from questionnaire respondents on barriers to choosing sustainable packaging
Themes
Comments
Customer Demand - Customers prefer Styrofoam and plastic bags - Customer demand ie. they need plastic bags to carry -Customers go to the beach with their food and they want bags to carry it. -People are still asking for straws
Out of their control -Headquarters are in Paris - can't make changes here
-Staff said the owners do not care at all. They tried to do small things in the store to reduce waste, but he doesn’t really have control.
Resources -Time
New restaurant and needs to dedicate time that I don’t have to finding the right products
Having to check many options and prices is difficult, would be easier if there was a fixed price.
-Storage
not enough room for other containers
For take-out you need many different types of containers: bags, plastic and paper containers. Take out is huge part of the business and you need different containers for every different meal, sauce etc
Another issue is space for storing all of these different containers. Restaurants are low on space.
-Money
it is more expensive, but we are in the process of looking into switching to more sustainable materials
Paper is expensive
Straws are a big problem - not enough affordable alternatives and there are issues with the disabled community. Paper straws are expensive. All prices are rising, which makes it difficult to pay more for straws. There are fees for recycling.
. Cost is the main concern and then convenience and the space to store.
Restaurants have small margins and have to save money wherever they can. If something costs more then it effects the margins.
They want to do the right thing, but cost and customer demand get in the way.
Not a priority -It is not a priority for the owners -Owners don’t care about sustainability. They have one compostable container but only for convenience - because it can go in the microwave

79
-He didn’t know anything about SUI strategy and hasn’t thought about switching to more sustainable packaging -no recycling/compost in the restaurant and has not talked about by management and has never been explained to the servers. -The manager cares a bit ab1`out sustainability but the owner does not. -Staff are from other countries and don’t know or care about recycling or reducing waste. -owners don’t care - No composting and only recycling glass bottles and cardboard nothing else
-Cutlery specific and straws - not enough alternatives
Need government support
- Time/knowledge - They would switch to mores sustainable options if the government helped them. -Easier to do it now. If it’s easy for people, then they will do it. -City needs to push for these things or they won’t happen. Owner has two young daughters who care a lot and push for sustainable products. -If the government helped it might be easier for restaurants. They could reduce taxes for businesses. - Reduce GST to 2.5% and put the rest towards sustainable packaging -If the City organized a program to switch to more sustainable options, we would be happy.

80
Appendix IV. Quantitative Data Analysis
Table 43 Questionnaire data on languages spoken in-house
Farsi Chinese
(Cantonese,
Mandarin)
English Spanish Korean Japanese Indian (Punjabi or
Hindi)
Other:
4 8 33 12 4 7 10 8

81
References
AGRA Earth & Environmental Limited. (1999, November 19) Burns Bog Ecosystem Review Contaminated Soils/Water. Retrieved from https://www2.gov.bc.ca/assets/gov/environment/natural-resource-stewardship/environmental-assessments/eao-project-reviews/burns-bog-syntheses-report.pdf
Allen, M.R., O.P. Dube, W. Solecki, F. Aragón-Durand, W. Cramer, S. Humphreys, M. Kainuma, J. Kala, N. Mahowald, Y. Mulugetta, R. Perez, M. Wairiu, and K. Zickfeld. (2018) Global Warming of 1.5°C. An IPCC Special Report on the impacts of global warming of 1.5°C above pre-industrial levels and related global greenhouse gas emission pathways, in the context of strengthening the global response to the threat of climate change, sustainable development, and efforts to eradicate poverty. 1, p. 49-90
Alonso, A. D., & Ogle, A. (2010). Tourism and hospitality small and medium enterprises and environmental sustainability. Management Research Review, 33(8), 818–826.
American Chemistry Council. (2019). American Chemistry Council. How Plastics Are Made. Retrieved from https://plastics.americanchemistry.com/How-Plastics-Are-Made/
Azpiri, J and McArthur, A. (2017, December 18). Robson street store closing after 93 per cent property tax increase. Global News. Retrieved from https://globalnews.ca/news/3924007/robson-street-store-closing-after-93-per-cent-property-tax-increase/
Babbie, E. R., & Benaquisto, L. (2002). Fundamentals of social research. Scarborough, ON: Nelson Thomson Learning
Barratt, H. and Kirwan, M. (Revised in 2018 Shantikumar, S) (2009). Methods of sampling from a population. HealthKnowledge. Retrieved from https://www.healthknowledge.org.uk/public-health-textbook/research-methods/1a-epidemiology/methods-of-sampling-population
BBC. (2015). Why New York banned polystyrene foam. BBC News. Retrieved from https://www.bbc.com/news/magazine-33334994
Borrelle, S. B., Rochman, C. M., Liboiron, M., Bond, A. L., Lusher, A., Bradshaw, H., & Provencher, J. F. (2017). Opinion: Why we need an international agreement on marine plastic pollution. Proceedings of the National Academy of Sciences, 114(38), 9994–9997.
Bowdler, J & Zeuli, K. (2016). What Cities Should Be Doing for Small Business. Retrieved from https://www.governing.com/gov-institute/voices/col-cities-focus-economic-development-job-strategies-small-business.html

82
Calderwood, I. (2018, April 25). 16 Times Countries and Cities Have Banned Single-Use Plastics. Global Citizen. Retrieved from https://www.globalcitizen.org/en/content/plastic-bans-around-the-world/
City of Portland. (2019). Disposable Cups, Cutlery and Dishware. Sustainability at Work. Retrieved at https://www.portlandoregon.gov/sustainabilityatwork/article/507465
City of Seattle. (2018). City Clerk - Online Information Resources | seattle.gov. Retrieved from http://clerk.seattle.gov/~scripts/nph-brs.exe?s3=&s4=122751&s5=&s1=&s2=&S6=&Sect4=AND&l=0&Sect2=THESON&Sect3=PLURON&Sect5=CBORY&Sect6=HITOFF&d=ORDF&p=1&u=%2F~public%2Fcbor1.htm&r=1&f=G
City of Vancouver. (2017). Creating a Single-Use Item Reduction Strategy. Retrieved from https://vancouver.ca/files/cov/single-use-consultation-paper-9-12-2017.pdf
City of Vancouver. (2018a). Business Licence - Open Data. Retrieved from https://data.vancouver.ca/datacatalogue/businessLicence.htm
City of Vancouver. (2018b). Single-Use item Reduction Strategy 2018-2025. Retrieved from https://vancouver.ca/files/cov/single-use-item-reduction-strategy-with-amendments.pdf
City of Vancouver. (2018.). Zero waste goal | City of Vancouver. Retrieved December 6, 2018, from https://vancouver.ca/green-vancouver/zero-waste.aspx
City of Vancouver. (2019a). Standing Committee on City Finance and Services agenda
April 24 and 29, 2019. Retrieved from
https://council.vancouver.ca/20190424/cfsc20190424ag.htm
City of Vancouver. (April 30, 2019b). Council approved shift in tax levy to benefit
businesses. Retrieved from https://vancouver.ca/news-calendar/council-
approves-shift-in-tax-levy-to-benefit-businesses.aspx
City of Vancouver. (2019c). Guide to starting a small business. Retrieved from https://vancouver.ca/guides/starting-a-small-business.aspx
City of Vancouver. (2019d). Get a Business License. Retrieved form https://vancouver.ca/doing-business/get-a-business-licence.aspx
City of Victoria. (2018). Reducing Single-use Plastic Bags | Victoria. Retrieved December 6, 2018, from https://www.victoria.ca/EN/main/residents/climate-change/single-use-plastic-bags.html

83
City of Victoria. (2019). Appeal Court Rules in Favour of Plastic Bag Industry – City Vows to Find Another Way to Eliminate Single-Use Plastic Bags. Retrieved from https://www.victoria.ca/EN/meta/news/news-archives/2019-news/appeal-court-rules-in-favour-of-plastic-bag-industry-city-vows-to-find-another-way-to-eliminate.html
Covanta. (2019). Covanta Burnaby. Retrieved from https://www.covanta.com/Our-Facilities/Covanta-Burnaby
Daily Hive. (2019, March) India Gate Restaurant to close after 41 years of business in Vancouver. Dished Vancouver. Retrieved from https://dailyhive.com/vancouver/india-gate-restaurant-closing-vancouver
Daniszewski, K. (2016) Opinions and behaviours contributing to household level food waste in Langley, 165.
Drop the Plastic. (2019). Drop the Plastic. Retrieved from www.droptheplastic.org
El Dief, M. and Font, X. (2012 February). Determinants of environmental management in the Red Sea hotels: personal and organizational values and contextual variables. Journal of Hospitality and Tourism Research, 36(1), 115-137.
Ellen MacArthur Foundation. (2017). The New Plastics Economy: Catalysing action. Retrieved from https://www.ellenmacarthurfoundation.org/publications/new-plastics-economy-catalysing-action
Ellen MacArthur Foundation. (2017). what is a circular economy? Retrieved from https://www.ellenmacarthurfoundation.org/circular-economy/concept
Ellen MacArthur Foundation. (2017, January 16).Industry endorses plan to recycle 70% of plastic packaging globally. Retrieved from https://www.ellenmacarthurfoundation.org/news/new-plastics-economy-report-2-launch
Everett, H. (2019, January 31). Digital Marketing for Restaurants: How to Get Found Online. Upserve Restaurant Insider. Retrieved from https://upserve.com/restaurant-insider/digital-marketing-restaurants/
Fassler, J. (2019, October 10). Can a new reusable container program – dishwashing included – help solve America’s takeout trash problem? New Food Economy. https://newfoodeconomy.org/dig-reusable-container-canteen-pfas/
Feuyit, G., Nzali, S., Lambi, J., and Laminsi, S. (2019). Air Quality and Human Health Risk Assessment in Residential Areas at the Proximity of the Nkolfoulou Landill in Yaounde Metropolic, Cameroon. Journal of Chemistry. Retrieved from https://www.hindawi.com/journals/jchem/2019/3021894/
Frank, J. (2015). ICI WASTE CHARACTERIZATION PROGRAM, 60.

84
Freudenrich, C. (2020). How Stuff Works. How Plastic Work. Retrieved from https://science.howstuffworks.com/plastic.htm
Garay, L., & Font, X. (2012). Doing good to do well? Corporate social responsibility reasons, practices and impacts in small and medium accommodation enterprises. International Journal of Hospitality Management, 31(2), 329–337.
Geyer, R., Jambeck, J. R., & Law, K. L. (2017). Production, use, and fate of all plastics ever made. Science Advances, 3(7), e1700782.
Global News. (2016, July 14). Vancouver restaurants squeezed out by rent increases? Global News. Retrieved from https://globalnews.ca/video/2825738/vancouver-restaurants-squeezed-out-by-rent-increases/
Go Box. (2019). Frequently Asked Questions. Go Box. Retrieved from https://www.goboxpdx.com/faqs/
Government of BC. (2019). Additional Property Transfer Tax for Foreign Entities & Taxable Trustees. Government of British Columbia. Retrieved from https://www2.gov.bc.ca/gov/content/taxes/property-taxes/property-transfer-tax/additional-property-transfer-tax
Government of Canada. (2018, September 21), Canadian small businesses invited to develop innovative solutions to seven domestic plastic challenges. Innovation, Science and Economic Development Canada. Retrieved from https://www.canada.ca/en/innovation-science-economic-development/news/2018/09/government-helping-small-businesses-develop-sustainable-solutions.html
Gray, J. (2018, November 5). Industry calls on city to scrap new waste plan. Retrieved from https://www.theglobeandmail.com/news/national/industry-calls-on-city-to-scrap-new-waste-plan/article662895/
Green Restaurant Association. (2018). Green Restaurant Association. Retrieved from http://www.dinegreen.com
Gyulai, L. (2016, August 24). Montreal adopts plastic bag ban. Montreal Gazette. Retrieved from https://montrealgazette.com/news/local-news/montreal-adopts-plastic-bag-ban
Hardcastle, J. L. (2013, August 7). 1,000 Restaurants Say No to Polystyrene Foam Ban. Environmental Leader. Retrieved from https://www.environmentalleader.com/2013/08/1000-restaurants-say-no-to-polystyrene-foam-ban/

85
Hoekstra, G. (2019, July 13). Metro Vancouver aiming to divert more waste from landfills, sell waste. Vancouver Sun. Retrieved from https://vancouversun.com/news/local-news/metro-vancouver-aiming-to-divert-more-waste-from-landfills-sell-waste
Howard, B, Gibbens, S., Zachos, E., and Parker, L. (2019, June 10) A running list of action on plastic pollution. National Geographic Environment. Retrieved from https://www.nationalgeographic.com/environment/2018/07/ocean-plastic-pollution-solutions/
Hua Foundation. (2018). CoV-SUI-Consultation-Final-Report.
Initiative for a Competitive Inner City (ICIC). (2016, October). The Big Impact of Small Business on Urban Job Creation: Evidence from Five Cities. JP Morgan Chase. Retrieved from https://www.jpmorganchase.com/corporate/Corporate-Responsibility/document/sbf-big-impact-small-business-rpt.pdf
Jambeck, J. R., Geyer, R., Wilcox, C., Siegler, T. R., Perryman, M., Andrady, A. Law, K. L. (2015). Plastic waste inputs from land into the ocean, 347(6223), 768–771.
Jang, Y. J. (2016). Top managers’ environmental values, leadership, and stakeholder engagement in promoting environmental sustainability in the restaurant. Graduate Theses and Dissertations.
Jeong, E., Jang, S. (Shawn), Day, J., & Ha, S. (2014). The impact of eco-friendly practices on green image and customer attitudes: An investigation in a café setting. International Journal of Hospitality Management, 41, 10–20.
JingJing, D., Xinze, L., & Sitch, R. (2008). Ethical Consumers: Strategically Moving the Restaurant Industry towards Sustainability, 118.
Kang, K. H., Lee, S., & Huh, C. (2010). Impacts of positive and negative corporate social responsibility activities on company performance in the hospitality industry. International Journal of Hospitality Management, 29(1), 72–82.
Lee, J. (2017, September 8). The last straw? Seattle will say goodbye to plastic straws, utensils with upcoming ban. Seattle Times. Retrieved from https://www.seattletimes.com/seattle-news/the-last-straw-seattle-will-say-goodbye-to-plastic-straws-utensils-with-upcoming-ban/
Lo, A., King, B., & Mackenzie, M. (2017). Restaurant Customers’ Attitude toward Sustainability and Nutritional Menu Labels. Journal of Hospitality Marketing & Management, 26(8), 846–867.
Markle, G. (2014). Accounting for the Performance of Environmentally Significant Behavior: The Symbolic Significance of Recycling. Symbolic Interaction, 37(2), 246–263.

86
McAfee, A. (2013, December).Tools for Change: CityPlan Vancouver’s Strategic Planning Process. Built Environment, 29(4), 438-453.
Metro Vancouver. (2010). Integrated Solid Waste and Resource Management. Retrieved from http://www.metrovancouver.org/services/solid-waste/SolidWastePublications/ISWRMP.pdf
Metro Vancouver. (2016). 2016 Metro Vancouver Waste Composition Monitoring Program (p. 103).
Metro Vancouver. (2019a). Metro Vancouver Single-Use Item Reduction Toolkit. Retrieved from http://www.metrovancouver.org/services/solid-waste/reduction-reuse/single-use-items/Pages/default.aspx
Metro Vancouver. (2019b). Plastics in the green bin. Metro Vancouver. Retrieved from http://www.metrovancouver.org/services/solid-waste/recycling-programs/food-scraps-recycling/residents/tips/plastics/Pages/default.aspx
Mikadze, K. (2016, April). Effective tool or pipe dream? Municipal World Inc. Retrieved from https://www.municipalworld.com/articles/municipal-bans-on-single-use-plastic-bags-effective-tool-or-pipe-dream/
Nordin, N., & Selke, S. (2010). Social aspect of sustainable packaging. Packaging Technology and Science, 23(6), 317–326.
Obayashi, Y. (2019 June 16). G20 agrees to tackle ocean plastic waste. Reuters. Retrieved from https://uk.reuters.com/article/uk-g20-japan-energy-environment/g20-agrees-to-tackle-ocean-plastic-waste-idUKKCN1TH0BY
OneNYC. (2018).New York City’s plan to become the most resilient, equitable, and sustainable city in the world. One NYC. Retrieved from https://onenyc.cityofnewyork.us/plan/
Ozarka. (2017). Ozarka. Retrieved from https://www.ozarka.club/
Pawson, C. (2018, February 25). Plastic plan (not a ban) hope of New Westminster councillor for all of Metro Vancouver. Retrieved from https://www.cbc.ca/news/canada/british-columbia/new-westminster-plastic-bag-reduction-plan-1.4549775
PIQET. (2018). About - PIQET. Retrieved from http://piqet.com/about-piqet/
Porter, R. C. (2002). The economics of waste. Washington, DC: Resources for the Future.
Porter, R. C. (2005). The Economics of Waste, Richard C. Porter, Resources for the Future Press, Washington, DC (2002), 301 pages, paperback, ISBN: 1891853430. Resources Policy, 30(2), 141–142.
https://www.cbc.ca/news/canada/british-columbia/new-westminster-plastic-bag-reduction-plan-1.4549775
87
Prime Minister of Canada’s Office. (2019, June 10). Government of Canada taking action to reduce plastic pollution. Retrieved from https://pm.gc.ca/en/news/backgrounders/2019/06/10/government-canada-taking-action-reduce-plastic-pollution
Redmond, J., Walker, E., & Wang, C. (2008). Issues for small businesses with waste management. Journal of Environmental Management, 88(2), 275–285.
Rees, W. (2010). What’s blocking sustainability? Human nature, cognition, and denial. Sustainability: Science, Practice and Policy, 6(2), 13–25.
Rewards Network. (2019). Green Restaurants: Why Are They Popping Up Now? Rewards Network. Retrieved from https://www.rewardsnetwork.com/blog/green-restaurants-popping-reasons-think/
Richards, J. P. (2005). Richard C. Porter, The Economics of Waste, Resources for the Future Press, Washington, DC (2002) ISBN 1891853430 301 pages, paperback. Resources Policy, 30(2), 141–142.
Rochman CM, Browne MA, Underwood AJ, van Franeker JA, Thompson RC, and Amaral-Zettler LA. (2016). The ecological impacts of marine debris: unraveling the demonstrated evidence from what is perceived. PubMed – NCBI. Retrieved from https://www.ncbi.nlm.nih.gov/pubmed/27145606?dopt=Abstract
Sandalj, M., Treydte, A. C., & Ziegler, S. (2016). Is wild meat luxury? Quantifying wild meat demand and availability in Hue, Vietnam. Biological Conservation, 194, 105–112.
Schaltegger, S., Lüdeke-Freund, F., & Hansen, E. G. (2012). Business Models for Sustainability, 26.
Science History Institute. (2016, July 18). The History and Future of Plastics. Science History. Retrieved from https://www.sciencehistory.org/the-history-and-future-of-plastics
Seattle Public Utilities. (2018). Temporary Exceptions to Food-Service Ware and Packaging Products. Retrieved from http://www.seattle.gov/util/cs/groups/public/@spuweb/@policy/documents/webcontent/1_064356.pdf
Shellenberger, M. and Nordhaus, S. 2005. The Death of Environmentalism Global Warming in a Post-Environmental World. American Institute for Social Justice. Retrieved from https://web-a-ebscohost-com.proxy.lib.sfu.ca/ehost/pdfviewer/pdfviewer?vid=1&sid=6648f8b3-cff2-400e-9f3a-bf4935ecb498%40sdc-v-sessmgr02

88
Sinoski, K. (2015, Dec 10) Metro Vancouver postpones plans for new trash incinerator. Vancouver Sun. Retrieved from http://www.vancouversun.com/technology/metro+vancouver+postpones+plans+trash+incinerator/11580216/story.html
Small Business BC. (2018). Small Business Profile 2018 A profile of small business in British Columbia. British Columbia Ministry of Jobs, Trade, and Technology. Retrieved from https://www2.gov.bc.ca/assets/gov/employment-business-and-economic-development/business-management/small-business/sb_profile.pdf
Smith, S. M. (2011). Putting local food on the menu: comparing the food purchasing practices of Vancouver’s Chinese and fine dining restaurants. Retrieved from http://summit.sfu.ca/item/11670
Sonneveld, K., James, K., Fitzpatrick, L., & Lewis, H. L. (2005). Sustainable Packaging : How do we Define and Measure It ?
SPEC. (2014). Green 2 Go Report. Retrieved December 6, 2018, from http://www.spec.bc.ca/Resources/Documents/Waste/G2G/Green%202%20Go%20Report%20FINALFINAL.pdf
St. Denis, J. (2017). Robson Street businesses hit with 200% assessment increase. Metro News. http://www.metronews.ca/news/vancouver/2017/02/01/robson-street-businesses-hit-with-200-per-cent-tax-increase.html
Stengel, G. (2018). What Will It Take To Keep Small Businesses Alive In Big Cities? Forbes. Retrieved from https://www.forbes.com/sites/geristengel/2018/03/07/what-will-it-take-to-keep-small-businesses-alive-in-big-cities/
Supply Box. (2019). "Food Containers | Take-Out". Retrieved from www.Supplybox.ca
Swidler, A. (1986). Culture in Action: Symbols and Strategies. American Sociological Review, 51(2), 273-286.
Swift, T. (2001, January). Trust, reputation and corporate accountability to stakeholders. Business Ethics: A European Review,10(1), 16-26.
Tatàno, F., Caramiello, C., Paolini, T., & Tripolone, L. (2017). Generation and collection of restaurant waste: Characterization and evaluation at a case study in Italy. Waste Management, 61, 423–442.
Taylor, R. L., & Villas-Boas, S. B. (2016). Bans vs. Fees: Disposable Carryout Bag Policies and Bag Usage. Applied Economic Perspectives and Policy, 38(2), 351–372.

89
The Canadian Press. (2018, July 10). Canadians throwing out up to $150b worth of plastic a year: McKenna | CTV News Atlantic. Retrieved from https://atlantic.ctvnews.ca/canadians-throwing-out-up-to-150b-worth-of-plastic-a-year-mckenna-1.4007967
The Nielsen Company. (2015, October). The Sustainability Imperative. Retrieved from https://www.nielsen.com/us/en/insights/report/2015/the-sustainability-imperative-2/
TRI Environmental Consulting. (2019, July 9). 2018 Single-Use Items Waste Composition Study Metro Vancouver. Retrieved from http://www.metrovancouver.org/services/solid-waste/SolidWastePublications/2018Single-UseItemsWasteCompositionStudy.pdf
Usborne, S. (2012, November 21). A lesson in packaging myths: Is shrink-wrap on a cucumber really mindless waste? | The Independent. Retrieved from https://www.independent.co.uk/life-style/food-and-drink/features/a-lesson-in-packaging-myths-is-shrink-wrap-on-a-cucumber-really-mindless-waste-8340812.html
Ville de Montreal. (2016). By-Law Prohibiting The Distribution of Certain Shopping Bags in Retail Stores. Retrieved from http://ville.montreal.qc.ca/sel/sypre-consultation/afficherpdf?idDoc=27530&typeDoc=1
Ward, C., Armstrong, C., Walsh, A., Jackson, J., and Reddy, C. (2019). Sunlight Converts Polystyrene to Carbon Dioxide and Dissolved Organic Carbon. Environmental Technology Letters. 6, 669-674.
Wells, P. (2016). Economies of Scale Versus Small Is Beautiful: A Business Model Approach Based on Architecture, Principles and Components in the Beer Industry. Organization & Environment, 29(1), 36–52.
Wood, R. (2002, July 15). Restaurant cooperative helps independent owners save dollars, compete with chains - Albany Business Review. Biz Journals. Retrieved from https://www.bizjournals.com/albany/stories/2002/07/15/focus1.html
World Waste Facts. (2018). Tons of waste dumped - globally, this year. The World Counts. Retrieved from http://www.theworldcounts.com/counters/shocking_environmental_facts_and_statistics/world_waste_facts
Xanthos, D., & Walker, T. R. (2017). International policies to reduce plastic marine pollution from single-use plastics (plastic bags and microbeads): A review. Marine Pollution Bulletin, 118(1–2), 17–26.
Zussman, R. (2018). BC Supreme Court rules in favour of Victoria’s plastic bag ban – BC. Global News. Retrieved from https://globalnews.ca/news/4284313/victoria-plastic-bag-ban/
http://www.theworldcounts.com/counters/shocking_environmental_facts_and_statistics/world_waste_facts