How Weebly use Looker and Snowplow to do funnel analysis
30
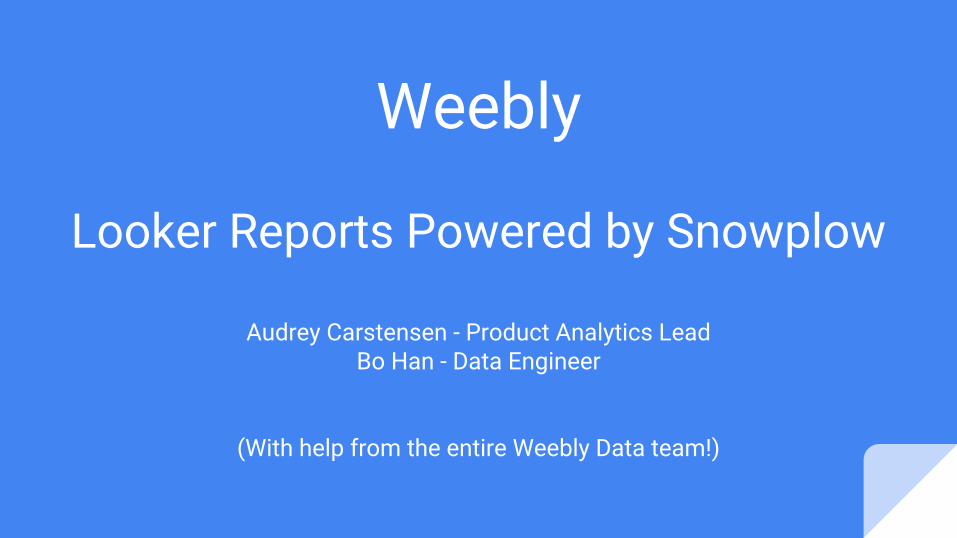
Weebly Looker Reports Powered by Snowplow Audrey Carstensen - Product Analytics Lead Bo Han - Data Engineer (With help from the entire Weebly Data team!)
-
Upload
yalisassoon -
Category
Business
-
view
157 -
download
2
Transcript of How Weebly use Looker and Snowplow to do funnel analysis
Weebly
Looker Reports Powered by Snowplow
Audrey Carstensen - Product Analytics LeadBo Han - Data Engineer
(With help from the entire Weebly Data team!)

Who is Weebly?● Drag n’ Drop Website Builder and Tools to Support Entrepreneurs Online
● ~30 million users, 16MM websites, ~10B Pageviews per year
● 3 data engineers & 7 data analysts supporting 200+ employee company
● Use Snowplow’s data-pipeline for events on Weebly.com and Weebly built sites

What are we going to show you?● Journey to Snowplow + Looker
○ Why Event Tracking?○ Snowplow Implementation
● What we implemented in Looker (Usage / Visuals / LookML)○ Event and User Counts○ Funnels○ Retention○ Onboarding timing
● What we learned

Why Event Tracking?
● Product needs to track user behavior...○ Product dashboards showing cohorts, retention, funnel
● Marketing needs visitor/pre-signup data...○ Visitor / campaign level breakdown
● Analysts need granular/raw data...○ AB testing, ad-hoc SQL queries into raw event stream
● Data scientists need features and need it real-time○ Story for another meetup...
Our needs are beyond what Google Analytics offers ...
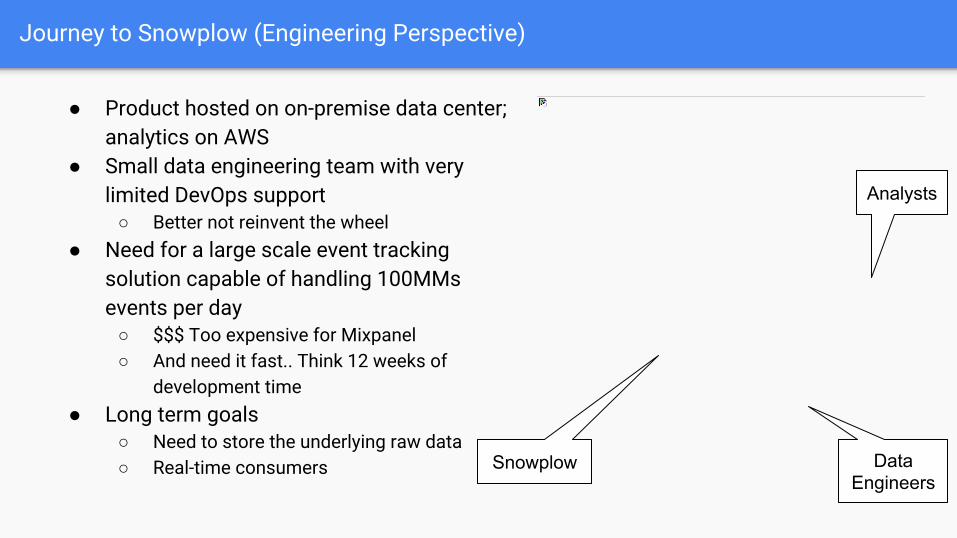
Journey to Snowplow (Engineering Perspective)
● Product hosted on on-premise data center; analytics on AWS
● Small data engineering team with very limited DevOps support
○ Better not reinvent the wheel● Need for a large scale event tracking
solution capable of handling 100MMs events per day
○ $$$ Too expensive for Mixpanel ○ And need it fast.. Think 12 weeks of
development time● Long term goals
○ Need to store the underlying raw data○ Real-time consumers
Analysts
Data Engineers
Snowplow

Example Summary Tables
● Events rollup○ General event volumes by date (no user data)
● Last 60 days○ Base many dashboards / looks off this○ Faster than all time table
● Users○ User facts based on Snowplow events
● User action times○ Keep track of onboarding timestamps○ Quickly pull “time to X” metrics
Pro-tip: Store frequently used views as summary tables for better performance

Rollup Explore: Usage and Visualization● Date / Category / Action / Label / Page Type (Weebly-specific based on URL)
● Usage: troubleshooting events as an engineer or data analyst, quick estimates as a data analyst

Rollup Explore: LookML
Events Explore: Usage
● Growth - interaction volume○ Weekly users performing specific steps in onboarding○ Monthly active users
● Core Editor - editor actions and upgrade views○ Weekly users adding pages to their website○ Most common elements added to sites○ Upgrade modal views
● Product - use of specific features○ # of users enabling / disabling a given feature (especially new ones!)○ Differing rates of feature usage by AB test
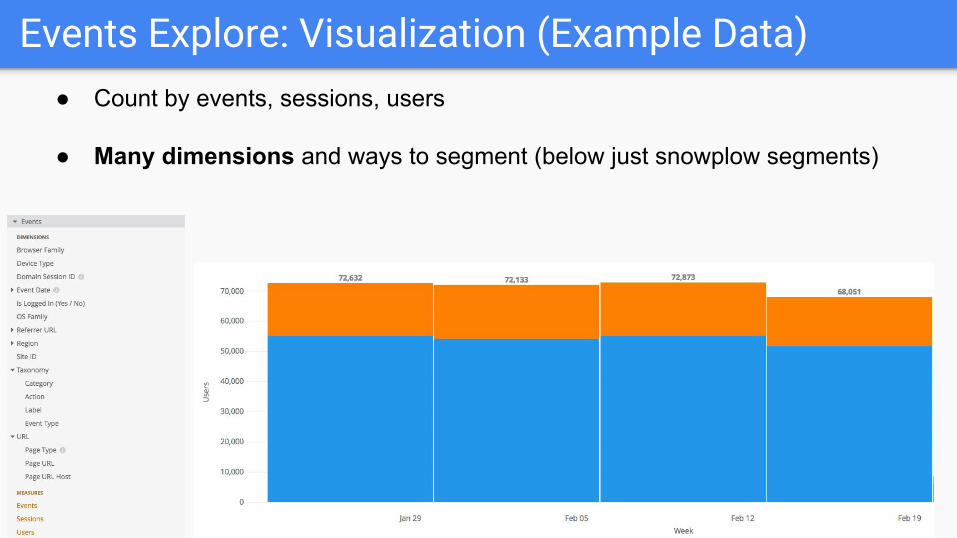
Events Explore: Visualization (Example Data)● Count by events, sessions, users
● Many dimensions and ways to segment (below just snowplow segments)

Events Explore: LookML
Funnel Explore: Usage
● Growth - onboarding and conversion ○ Landing Page → Signup → Themes Choice → Editor View○ Domain Modal → Domain Selection○ Upgrade Modal → Transaction
● Core Editor - initial editor interaction○ Signup → Editor Interaction○ Signup → Viewing / Adding Pages
● App Center - app installation○ App Center Page View → View app → Install app

Funnel Explore: Filters

Funnel Explore: Visualization (Example Data)

Funnel Explore: LookML (truncated)
See Appendix for more detailed code samples, this slide for the special filter for exclusions
Based off: https://looker.com/blog/modeling-conversion-funnels-in-looker-a-mysql-subselect-approach
view: user_funnel { derived_table: { sql: select s0.blended_user_id, s0.s0_tstamp, min(s1.derived_tstamp) as s1_tstamp from ( select blended_user_id, min(derived_tstamp) as s0_tstamp from snowplow_pivots.events_last_60 where {% condition step_1_event_type %} event {% endcondition %} … and {more conditions here} and blended_user_id NOT IN {special filter for exclusions here} group by 1 ) s0 left join snowplow_pivots.events_last_60 s1 on s0.blended_user_id = s1.blended_user_id and s1.derived_tstamp >= s0.s0_tstamp and {% condition conversion_window %} and {% condition step_2_event_type %} event {% endcondition %} and …. {more conditions here} group by 1,2;;}
Retention Explore: Usage
● Growth - track early retention○ % of signups visiting on day 2○ % of signups visiting in the first week
● Analytics - deep dives○ Impact of product launches on retention○ Differential retention between SEM/SEO/etc○ Differential retention between AB tests
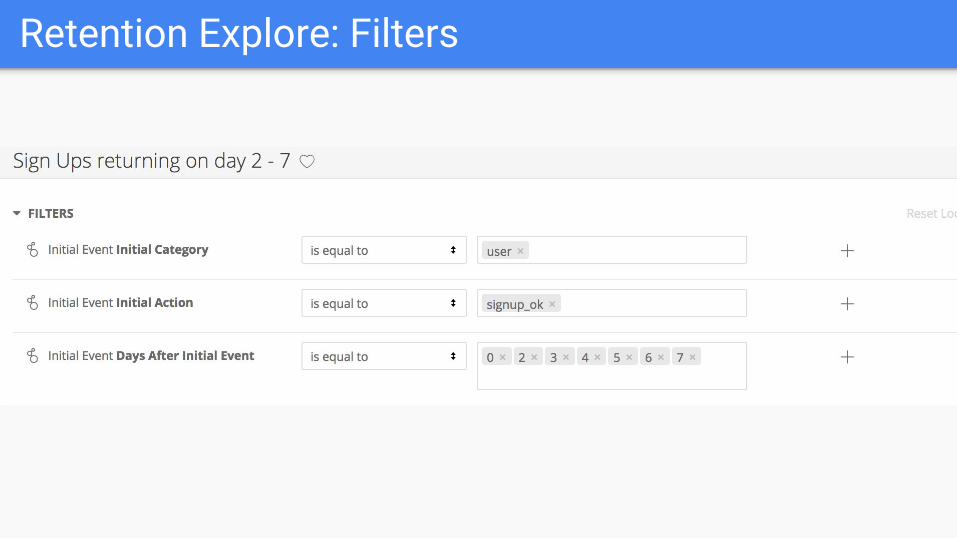
Retention Explore: Filters
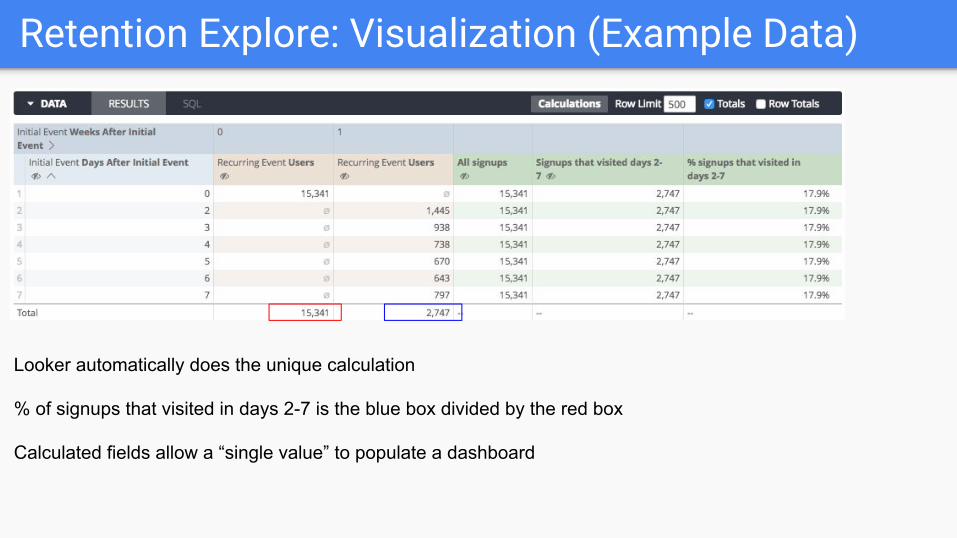
Retention Explore: Visualization (Example Data)
Looker automatically does the unique calculation
% of signups that visited in days 2-7 is the blue box divided by the red box
Calculated fields allow a “single value” to populate a dashboard

Retention Explore: LookML (truncated)
See Appendix for full code
derived_table: { sql: with xxx as ( select blended_user_id, min(derived_tstamp) as first_tstamp from snowplow_pivots.events_last_60 where {% condition initial_event_type %} event {% endcondition %} and {more conditions} group by 1) select e.blended_user_id, coalesce(e.derived_tstamp, xxx.first_tstamp) as derived_tstamp, xxx.first_tstamp, event, page_type, category, action, label from snowplow_pivots.events_last_60 e left join xxx on e.blended_user_id = xxx.blended_user_id where ( {% condition recurring_event_type %} event {% endcondition %} and {more conditions} and xxx.first_tstamp - '0 second'::interval < e.derived_tstamp ) or ( {% condition initial_event_type %} event {% endcondition %} and {more conditions} and xxx.first_tstamp = e.derived_tstamp) ;; }
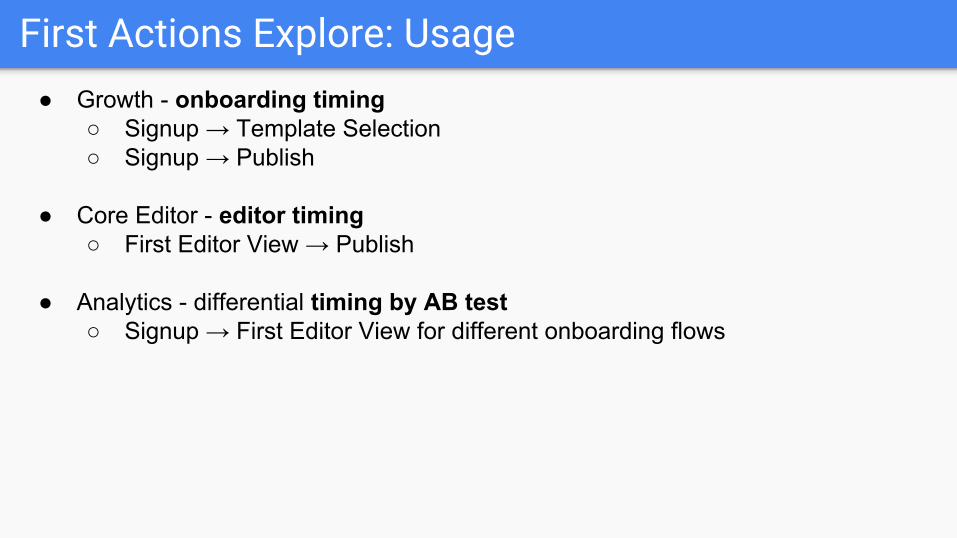
First Actions Explore: Usage● Growth - onboarding timing
○ Signup → Template Selection○ Signup → Publish
● Core Editor - editor timing○ First Editor View → Publish
● Analytics - differential timing by AB test○ Signup → First Editor View for different onboarding flows

First Actions Explore: Visualization (Example Data)
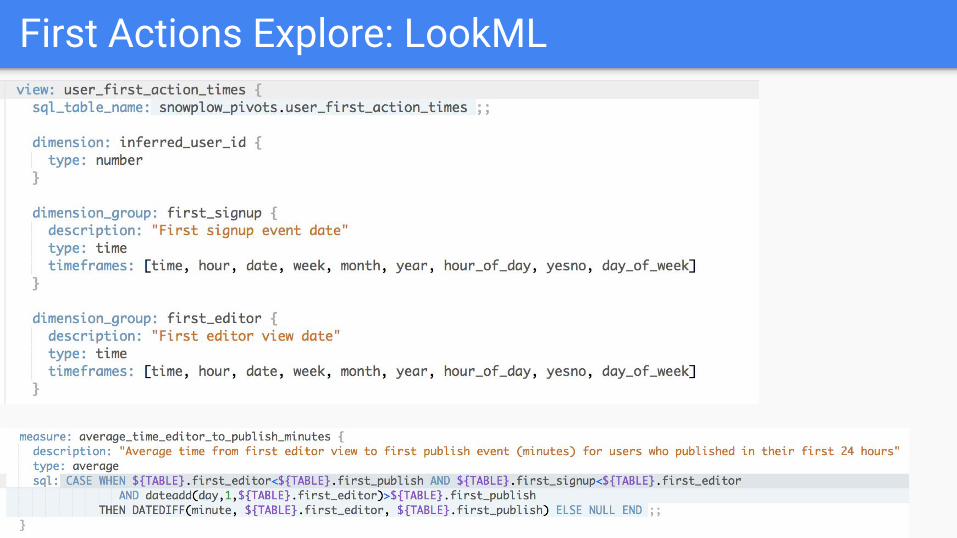
First Actions Explore: LookML

Learnings - the Good
● Users huge on refreshable dashboards
● See events data and other data side by side in dashboards
● Join to AB segmentation data○ Funnel drop off by AB segment○ Event rate by AB segment
● Join to user data○ Exclude banned users○ Has best guess to country / location data

Learnings - the Challenges
● Timing has been tricky for us since Snowplow starts at 5 PM PST. Often set up dashboards to hide the partial day of data / tell users data is 2 days behind.
● Events can be slightly out of order - added some “slop” to our funnels to account for this
● Looks can take minutes each to run (depends on Redshift load). Opening a large dashboard causes a sudden large load on the servers. ○ We persist queries for 8 hours to help with this○ Still have outstanding user requests to reduce latency
● Explores are complicated - working on getting all PMs creating their own looks

Appendix: LookML for User Funnels & Retention Funnels
● Copied directly from Looker
● Tables / fields to know
○ snowplow_pivots.events_last_60 - enriched table with data for past 60 days
○ blended_user_id - internal user id to the best of our knowledge, otherwise cookie-based user id
○ derived_tstamp - snowplow “best guess” timestamp, see http://snowplowanalytics.com/blog/2015/09/15/improving-snowplows-understanding-of-time/
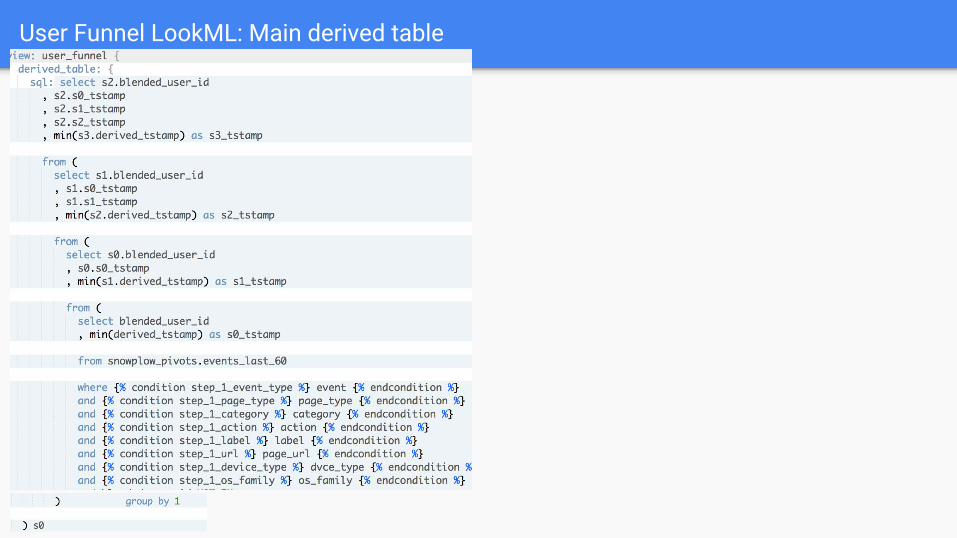
User Funnel LookML: Main derived table
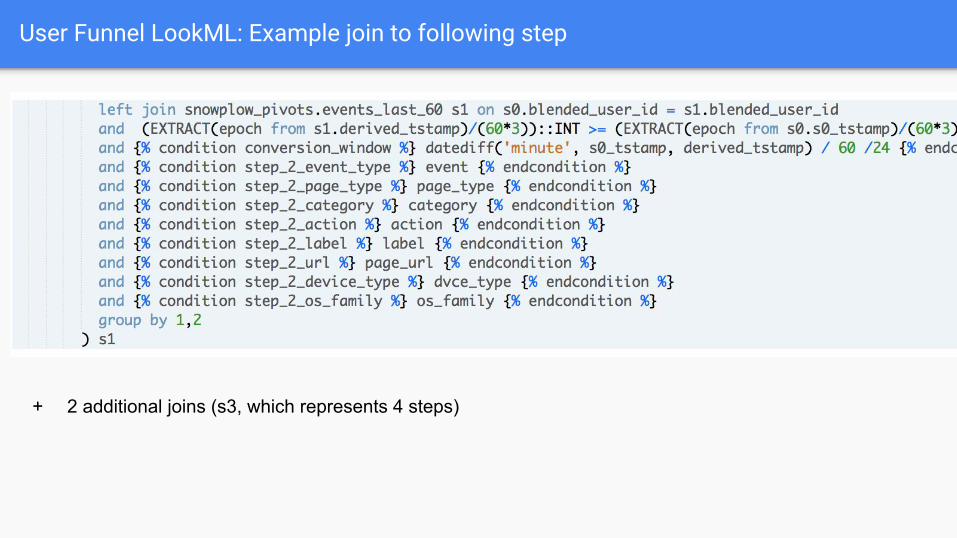
+ 2 additional joins (s3, which represents 4 steps)
User Funnel LookML: Example join to following step
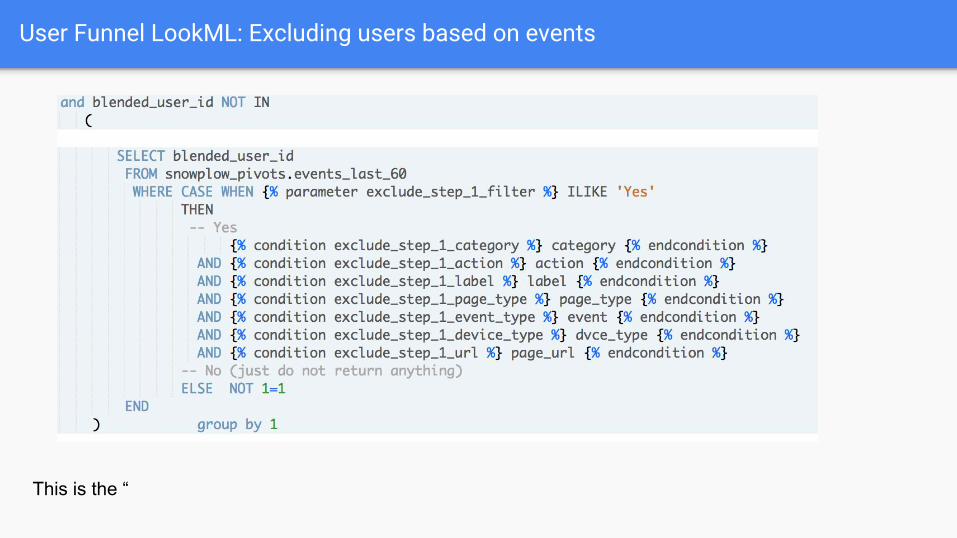
User Funnel LookML: Excluding users based on events
This is the “
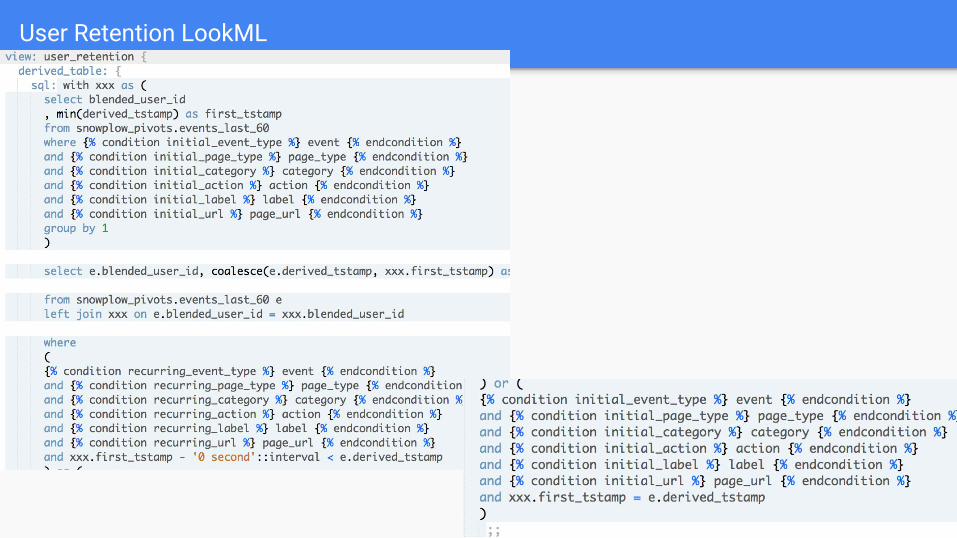
User Retention LookML