HOW VISUALIZATION LAYOUT RELATES TO LOCUS …remco/publications/2012/TVCG2012-LOC.pdf · HOW...
14
HOW VISUALIZATION LAYOUT RELATES TO LOCUS OF CONTROL AND OTHER PERSONALITY FACTORS 1 How Visualization Layout Relates to Locus of Control and Other Personality Factors Caroline Ziemkiewicz, Member, IEEE, Alvitta Ottley, R. Jordan Crouser, Ashley Rye Yauilla, Sara L. Su, Member, IEEE, William Ribarsky, Member, IEEE, and Remco Chang, Member, IEEE Abstract—Existing research suggests that individual personality differences are correlated with a user’s speed and accuracy in solving problems with different types of complex visualization systems. We extend this research by isolating factors in personality traits as well as in the visualizations that could have contributed to the observed correlation. We focus on a personality trait known as “locus of control” (LOC), which represents a person’s tendency to see themselves as controlled by or in control of external events. To isolate variables of the visualization design, we control extraneous factors such as color, interaction, and labeling. We conduct a user study with four visualizations that gradually shift from a list metaphor to a containment metaphor and compare the participants’ speed, accuracy, and preference with their locus of control and other personality factors. Our findings demonstrate that there is indeed a correlation between the two: participants with an internal locus of control perform more poorly with visualizations that employ a containment metaphor, while those with an external locus of control perform well with such visualizations. These results provide evidence for the externalization theory of visualization. Finally, we propose applications of these findings to adaptive visual analytics and visualization evaluation. Index Terms—Visualization, individual differences, locus of control. ✦ 1 I NTRODUCTION G RAPHIC designs, such as diagrams and maps, support users in processing sensory data, rea- soning about it, solving problems, and identifying patterns [1]. A well-designed visualization accounts for both the complex preattentive and cognitive pro- cesses triggered when a user views it. The balance of visual elements can dramatically affect the user’s comprehension of the information presented. As a result of separable and integral feature relationships, using several elements in conjunction can amplify or dampen a single element’s effect [2]. Understanding the relations among preattentive processes, cognitive processes, and visual interfaces is a longstanding goal of the visual analytics community, but evaluating interfaces in this context is difficult for many reasons. One reason is the problem of individual differences. Because visualizations are meant to support com- plex thinking, they may be more sensitive to nuances • C. Ziemkiewicz is with the Department of Computer Science, Brown University. E-mail: [email protected] • A. Ottley, R.J. Crouser, and R. Chang are with the Department of Computer Science, Tufts University. E-mail: [email protected], [email protected], and [email protected] • A.R. Yauilla is with the Department of Computer Science, Winthrop University. E-mail: [email protected] • S.L. Su is with Google, Inc. E-mail: [email protected] • W. Ribarsky is with the Department of Computer Science, UNC Charlotte. E-mail: [email protected] of an individual user’s cognitive style than other types of interfaces. This would explain findings that show significant differences in visualization perfor- mance based on personality. Earlier work has found an effect from the personality dimension known as “locus of control” [3], [4]. This dimension measures a person’s tendency to see herself as either shaped by or in control of external events. While the effects of individual differences such as locus of control have been observed, an explanation for why those differences arise remains elusive. Early work in this area employed real-world data exploration systems that differed on many dimensions, including the use of color, labeling, interaction, and layout style. Any of these variables may contribute to the effect of locus of control, making it difficult to apply the findings to visualization design for different user groups. We propose that layout style is the key variable that determines the interaction between locus of control and compatibility with different system designs. Our definition of layout encompasses any differences in the spatial arrangement and presentation of marks in a visualization. This is to be distinguished from differ- ences in the visual encoding, that is, how individual data variables are mapped to individual graphical variables, such as color or size 1 . Our hypothesis is that individual differences based on locus of control are more affected by layout in this sense than by visual encoding or interaction style. 1. In cases where a variable is directly mapped to spatial position, as in a scatterplot, that aspect of spatial arrangement is of course part of the encoding. No such mapping existed in the visualizations we study.
Transcript of HOW VISUALIZATION LAYOUT RELATES TO LOCUS …remco/publications/2012/TVCG2012-LOC.pdf · HOW...

HOW VISUALIZATION LAYOUT RELATES TO LOCUS OF CONTROL AND OTHER PERSONALITY FACTORS 1
How Visualization Layout Relates to Locus ofControl and Other Personality Factors
Caroline Ziemkiewicz, Member, IEEE, Alvitta Ottley, R. Jordan Crouser, Ashley Rye Yauilla,Sara L. Su, Member, IEEE, William Ribarsky, Member, IEEE, and Remco Chang, Member, IEEE
Abstract—Existing research suggests that individual personality differences are correlated with a user’s speed and accuracy insolving problems with different types of complex visualization systems. We extend this research by isolating factors in personalitytraits as well as in the visualizations that could have contributed to the observed correlation. We focus on a personality traitknown as “locus of control” (LOC), which represents a person’s tendency to see themselves as controlled by or in control ofexternal events. To isolate variables of the visualization design, we control extraneous factors such as color, interaction, andlabeling. We conduct a user study with four visualizations that gradually shift from a list metaphor to a containment metaphor andcompare the participants’ speed, accuracy, and preference with their locus of control and other personality factors. Our findingsdemonstrate that there is indeed a correlation between the two: participants with an internal locus of control perform more poorlywith visualizations that employ a containment metaphor, while those with an external locus of control perform well with suchvisualizations. These results provide evidence for the externalization theory of visualization. Finally, we propose applications ofthese findings to adaptive visual analytics and visualization evaluation.
Index Terms—Visualization, individual differences, locus of control.
F
1 INTRODUCTION
G RAPHIC designs, such as diagrams and maps,support users in processing sensory data, rea-
soning about it, solving problems, and identifyingpatterns [1]. A well-designed visualization accountsfor both the complex preattentive and cognitive pro-cesses triggered when a user views it. The balanceof visual elements can dramatically affect the user’scomprehension of the information presented. As aresult of separable and integral feature relationships,using several elements in conjunction can amplify ordampen a single element’s effect [2]. Understandingthe relations among preattentive processes, cognitiveprocesses, and visual interfaces is a longstanding goalof the visual analytics community, but evaluatinginterfaces in this context is difficult for many reasons.One reason is the problem of individual differences.
Because visualizations are meant to support com-plex thinking, they may be more sensitive to nuances
• C. Ziemkiewicz is with the Department of Computer Science, BrownUniversity.E-mail: [email protected]
• A. Ottley, R.J. Crouser, and R. Chang are with the Department ofComputer Science, Tufts University.E-mail: [email protected], [email protected], [email protected]
• A.R. Yauilla is with the Department of Computer Science, WinthropUniversity.E-mail: [email protected]
• S.L. Su is with Google, Inc.E-mail: [email protected]
• W. Ribarsky is with the Department of Computer Science, UNCCharlotte.E-mail: [email protected]
of an individual user’s cognitive style than othertypes of interfaces. This would explain findings thatshow significant differences in visualization perfor-mance based on personality. Earlier work has foundan effect from the personality dimension known as“locus of control” [3], [4]. This dimension measuresa person’s tendency to see herself as either shapedby or in control of external events. While the effectsof individual differences such as locus of controlhave been observed, an explanation for why thosedifferences arise remains elusive. Early work in thisarea employed real-world data exploration systemsthat differed on many dimensions, including the useof color, labeling, interaction, and layout style. Any ofthese variables may contribute to the effect of locusof control, making it difficult to apply the findings tovisualization design for different user groups.
We propose that layout style is the key variable thatdetermines the interaction between locus of controland compatibility with different system designs. Ourdefinition of layout encompasses any differences in thespatial arrangement and presentation of marks in avisualization. This is to be distinguished from differ-ences in the visual encoding, that is, how individualdata variables are mapped to individual graphicalvariables, such as color or size1.
Our hypothesis is that individual differences basedon locus of control are more affected by layout inthis sense than by visual encoding or interaction style.
1. In cases where a variable is directly mapped to spatial position,as in a scatterplot, that aspect of spatial arrangement is of coursepart of the encoding. No such mapping existed in the visualizationswe study.

HOW VISUALIZATION LAYOUT RELATES TO LOCUS OF CONTROL AND OTHER PERSONALITY FACTORS 2
This hypothesis is based on the idea that locus of con-trol can provide insight into a user’s tendency to relyon the external representations that a visualizationemploys. The overall arrangement of visual elementsin a layout is more likely to directly affect the natureof this external representation than surface qualitiessuch as color and shape, or more intangible qualitiessuch as interaction style.
1.1 Contributions
This paper makes a number of contributions to ourunderstanding of how personality factors affect howpeople use visualizations:
• First, we present experimental evidence to showthat visual layout is a key factor in previousfindings in individual differences. Our findingsexpand previous work by showing that the effectof locus of control can still be found when restrict-ing visualization differences to layout factors.
• Second, we use these findings to argue for amodel of visualization use based on a user’sadoption of external representations. Our find-ings suggest that locus of control affects the use ofdifferent visualization types by affecting a user’swillingness to adapt to a novel externalization ofinformation. This framework places these find-ings in the context of external representation as amodel for visualization use.
We evaluate our hypothesis in a study with 240 onlinesubjects who varied in their locus of control. Partici-pants are presented with four variations of a hierarchyvisualization showing phylogenetic data (Figure 1).These designs include a view that employs a list-likeorganizational structure (V1), a view that presents thehierarchy in a strong containment metaphor (V4), andtwo designs that lie between these extremes (V2 andV3). We hypothesize that users with a more externallocus of control are more willing to adapt their think-ing to unfamiliar visual metaphors than those withan internal locus of control. We show how locus ofcontrol can predict performance on inferential taskquestions using these interface designs. Specifically,we test the hypothesis that an individual with a moreinternal locus of control will show a performance de-crease when using layouts with a strong containmentmetaphor, while those with a more external locusof control will not show this decrease. Our findingsprovide evidence for the externalization model ofvisualization use and can inform the design of visu-alization interfaces adapted to an individual’s needs.
2 RELATED WORK
There is a substantial history of research in how indi-vidual differences affect interface use in the broaderhuman-computer interaction field, reviewed by Dillonand Watson [5]. A subset of this research focuses
specifically on individual differences in visualization,driven by the belief that a reliance on visual andspatial cognitive abilities makes individual differencesa potentially greater factor in this field. We reviewfindings on how cognitive differences affect visual-ization use and discuss why locus of control is apotentially significant factor.
2.1 Individual Differences and VisualizationMuch of the existing work in the visualization fieldon the impact of individual differences has focusedon the influence of perceptual ability on visualiza-tion use. Conati and Maclaren [6] find that a user’sperceptual speed predicts whether a star graph orheatmap will be most effective. Similarly, Allen [7]finds a role for perceptual speed and spatial scanningability in search performance. However, he foundthat users do not tend to optimize their visualizationuse for greater search efficiency, and proposes thedevelopment of user models to automatically guideusers toward optimal strategies. This work shows thatperceptual abilities can affect task performance, butsuggests that the connection between these abilitiesand a user’s cognitive strategies may be less direct.
Taking a more cognitive perspective, Chen [8]found that spatial ability has no effect on participants’search performance in a visualization of paper citationlinks. Cognitive factors did, however, play a role inusers’ subjective feedback; users with high associativememory rated the interface higher on usefulness, andusers with high spatial ability rated the tasks higheron familiarity. Chen goes on to suggest that users withvarying cognitive abilities may be more or less likelyto impose certain kinds of mental models on data.
A related finding comes from Ziemkiewicz andKosara [9], who studied the role of personality andspatial ability in a user’s ease in switching betweenincompatible visual metaphors in tree visualizationuse. They found that users with high spatial visu-alization ability and a high score on the Opennessscale of the Big Five Personality Inventory [10] weremore adept at answering questions despite a verbalmetaphor that conflicted with the visual metaphor ofthe visualization they were viewing. Both this workand Chen’s suggest that users with different cognitivestyles may be more or less comfortable with adaptingtheir thinking to an external representation.
Tversky et al. [11], [12], [13] studied how indi-vidual differences in ability impact the extraction ofstructure and function from diagrams. They foundthat participants with high ability form mental mod-els integrating structure and function, while thosewith low ability form models dominated by structure.They suggest that structural diagrams designed forthe latter group can be annotated with functionalinformation for improved comprehension [14].
These findings have begun to build the case thatsome individual differences in visual analytics can be

HOW VISUALIZATION LAYOUT RELATES TO LOCUS OF CONTROL AND OTHER PERSONALITY FACTORS 3
(a) V1: Basic Tree (b) V2: Bordered Tree
(c) V3: Indented Boxes (d) V4: Nested Boxes
Fig. 1. The four visualizations used in our study. Each view is showing the same portion of one of the phylogenetictree datasets.
attributed to a complex interaction between the men-tal model suggested by a visual layout and the user’sown cognitive style. However, most previous studiesthat show an effect of individual differences eitherexamine a single system or compare two or moresystems with numerous differences. In order to applyknowledge of individual differences to visualizationdesign, it is necessary to make a clearer connectionbetween personality groups and exactly which factorslead them to better performance with one visualiza-tion over another. Context for these connections cancome from psychology research on how personalityrelates to problem solving and decision making.
2.2 Personality and Problem Solving
Problem solving is the process by which we bridge thegap between the perceived and a desired outcome.Since this process often requires complex thought,researchers have long been investigating the effect ofpersonality on problem solving and decision makingprocesses. These investigations have identified a seriesof personality traits that impact problem solving in-cluding extraversion, neuroticism and locus of control.For example, when approaching a problem, personswho score high on the judgment scale of the Myers-Briggs Personality Inventory (i.e., those who are de-cisive and are quick at making decisions) prefer aproblem to be concise and well structured [15]. On the
other hand, persons who score high in the perceptivescale are more concerned with seeing all sides of aproblem and prefer flexibility.
Disposition on the extraversion scale also affectsproblem solving [15]. Individuals with high extraver-sion have greater tendencies to be sociable and re-quire engagement with others. When given a problem,extraverts are more likely to discuss the problem inorder to ascertain clarity and understanding, whileintroverts are more likely to take time and think aboutthe problem before they begin. This implies that intro-verts would generally take longer before attemptinga solution but are more likely to have a well-definedpath toward finding that solution. Furthermore, in-troverts are more likely to take time to understandimportant concepts while extraverts require feedbackon the correctness of their ideas.
While extraversion and judgment can be used as apredictor of a user’s approach to a problem, similartendencies can also be deduced from an individual’sneuroticism orientation. Neuroticism measures a per-son’s degree of emotional stability. Individuals whoscore high on the neuroticism scale are more proneto experiencing negative emotions such a stress andanxiety. As recent study by Uziel [16] has investigatedthe correlation of neuroticism and extraversion andsuggest a negative correlation between them whenaffective states are considered. An individual’s neu-roticism disposition can also be a predictor of their

HOW VISUALIZATION LAYOUT RELATES TO LOCUS OF CONTROL AND OTHER PERSONALITY FACTORS 4
(a) GVis
(b) NCBI Map Viewer
Fig. 2. The two interfaces used in Green et al.’sstudy [3] of personality differences in visual analyticsuse.
problem-solving approach [17]. Persons with highmeasures of neuroticism are more like to have lowerperceived problem-solving skills and are less likelyto make decisions when risks are involved. Moreneurotic people also take more time to solve problems,as was found by Farley [18], who found a curvilinearcorrelation between neuroticism and time spent solv-ing a problem. Individuals who are measured on theneuroticism scale as average are significantly fasteron problem-solving tasks than the combined low andhigh scoring people.
Several studies have also established correlationsbetween locus of control and neuroticism [19], [20].These traits are multidimensional constructs and arecomprised of similar traits such as anxiety and self-esteem. It is therefore not surprising that locus of con-trol may also affect problem solving ability and style.Of the three personality dimensions we study, locus ofcontrol has been found to have the most pronouncedcorrelation to problem solving using visualizations.
2.3 Locus of ControlMuch of the direct background for this work comesfrom Green et al.’s research [3], [4] on personalityfactors in visual analytics use. Their work foundeffects on interface performance from three psycho-metric measures: locus of control (LOC), neuroticism,and extraversion. Locus of control [21] measures thedegree to which a person sees herself as in control ofevents (internal LOC) as opposed to seeing her fate ascontrolled by outside events (external LOC).
Locus of control has been associated with a numberof significant practical outcomes. People with a moreinternal LOC tend to be more effective at work [22]and on many academic measures [23], and are morecapable of coping with stress [24]. Locus of control inan academic setting is also associated with differentlearning styles. Cassidy and Eachus [25] found a pos-itive correlation between external LOC beliefs and atendency to use “surface learning” approaches, wherethe student attempts to fit the demands of an assign-ment instead of “deep learning,” which focuses onthe underlying principles being taught. On the otherhand, students with an internal locus of control weremore likely to use a deep learning approach. Suchfindings suggest the possibility that locus of controlis related to how a user approaches problem-solvingtasks in a novel setting, which may explain why itinfluences use of a novel visualization technique.
Green et al.’s work studied the effect of locus of con-trol and other personality dimensions on both proce-dural and inferential learning in a GVis, a visual ana-lytics interface (Figure 2(a)) versus NCBI Map Viewer,a more traditional web interface (Figure 2(b)). Theprocedural tasks they studied involved searching fora specific piece of information in a genomic database,while inferential tasks were those in which a userhad to make a more open-ended comparison betweentwo items. In both cases, the tasks were promptedby questions of the kind found in a typical usabilitystudy. The findings from both experiments suggestedthat the web table interface was more conducive toanswering procedural questions and the findings fromtheir first experiment suggest that the visual interfaceis more conducive to answering inferential questions.
In the first experiment, they found that participantswith an external locus of control completed inferen-tial tasks more quickly than those with an internallocus. This effect was more pronounced in GVis. Inthe second experiment, they studied only proceduraltasks and found that, in contrast to inferential tasks,those with an internal locus of control completedprocedural tasks more quickly. They also found corre-lations between the Big Five personality dimensionsof neuroticism and extraversion and completion timesfor search tasks. More neurotic and more extravertedparticipants were significantly faster at finding thetarget of a search task in both interfaces.
In these studies, there were differences not onlybetween interface structures but also between theirinteraction techniques. For example, GVis used a drill-down zooming technique while Map Viewer useda menu-driven interaction technique. In our work,we build upon these findings by seeking to isolatethe factors of the interface structure that cause thedifferent effects between those with an internal orexternal locus of control.
The amount of data we have about how differ-ent user types react to different interfaces is rapidly

HOW VISUALIZATION LAYOUT RELATES TO LOCUS OF CONTROL AND OTHER PERSONALITY FACTORS 5
increasing. Our goal as visualization researchers isto make sense of this data within the context ofmodels of the user. In order to apply this knowledgeto improve design, we need to know not just whatdifferences exist between users, but why. This work isan attempt to answer that question relative to Greenet al.’s findings on personality and interface design.
3 EXPERIMENT
Research by Green et al. [3], [4] suggests that locus ofcontrol and other personality traits influence an indi-vidual’s use of a complex visualization system. How-ever, the reason for this relationship is not obviousfrom previous research. We propose that rather thanan interaction between between locus of control andspecific complex visualizations, the observed patternmay in fact be a correlation between locus of controland visual layout.
For example, consider the nested circles used inthe GVis system from work by Green et al. [3], [4];these structural elements are visually dominant dueto their unusual shape and large size with respect tothe surrounding textual elements. In contrast, MapViewer uses a more subtle indentation-based struc-tural expression which is dominated by text. Apartfrom using different visual encodings and interactionstyles, these two designs represent significantly dif-ferent visual layouts of the same underlying data.Exploring how those layouts differ may help explainwhy locus of control interacts significantly with them.
To more closely investigate this interaction, weconduct a comparable study in which the test visu-alizations are more tightly controlled. We restrict thevariation between our four test interfaces to visuallayout style, holding interaction metaphor and visualencoding consistent across all interfaces. We hypoth-esize that, even under this simplified setting, partic-ipants with a more internal LOC will have difficultywith layouts that depend on a strong containmentmetaphor, while participants with a more externalLOC will show a greater willingness to adapt to avariety of visual layouts.
To test this hypothesis, we performed a user studyin which participants were asked to answer searchand inferential questions about data in four simplehierarchy visualizations (Figure 1). The four viewswere designed to express an increasingly visually ex-plicit containment metaphor for the hierarchy, rangingfrom a list-like view that only used indentation toshow hierarchical structure to a view that used largenested rectangles. Like Green et al., we measuredpersonality traits of the participants beforehand inorder to test whether Locus of Control, Neuroticism,and Extraversion affect a participant’s ability to usethese visualizations.
Green et al. [3] used two real-world systems in theirwork, which has the benefit of providing a realistic
testing environment. However, this also makes it diffi-cult to isolate exactly which aspects of the two designsprompted the differing user behavior they found. Asthe long-term goal of this work is to assist designers inchoosing how to display information for varying usertypes, knowing exactly which elements of the designshould be altered is vitally important. Therefore, ourintention in designing the visualizations used in ourstudy was, as much as possible, to isolate the factorof layout style which we hypothesized to be the keyto these differences.
Before viewing the data, each participant was givena personality test, including the Locus of ControlInventory [21] and the Neuroticism and Extraversionscales of the Big Five Personality Inventory [26]. Theparticipant was then presented with a series of tasksto perform on each visualization. The order in whichthe visualizations were presented was randomized,and the user’s ability to successfully complete tasksusing each visualization was recorded.
3.1 ParticipantsWe recruited 240 participants over Amazon’s Mechan-ical Turk service. Altogether, it took approximatelytwo days to collect data from all participants. Me-chanical Turk is an online job market in which peoplecan be recruited for brief tasks and paid for theirefforts. This service has become increasingly popularfor use in online experiments, as a large numberof relatively diverse participants can be processedvery quickly [27]. Reservations remain about usingMechanical Turk among the human-computer inter-action and visualization communities. However, sinceMechanical Turk helps correct for a number of thetraditional limitations of online studies, such as thepossibility of vote flooding and the lack of incentivefor completion [28], it is gradually becoming moreaccepted as a user study platform. It can be partic-ularly useful in studies such as this, in which thereis a ground truth by which to measure results [29]and the possibility of incentivizing accurate responsesthrough bonuses [28].
That said, some limitations remain with interpretingonline studies in general. Chief among these is envi-ronmental control. In an online study, it is impossibleto know whether a participant’s environment is noisyor distracting, or whether the participant is doingsomething else while performing the study. Whilethese limitations should be kept in mind, this is astudy with a clear ground truth and a task that shouldnot be strongly affected by varying computing setups.In addition, our task questions were designed not tobe answerable using a search engine. Under thesecircumstances, we argue that the advantages of usingMechanical Turk to obtain a high number of usersoutweigh the potential issues.
Of the 240 participants, four did not report their ageor gender. Of the rest, there were 124 males and 112

HOW VISUALIZATION LAYOUT RELATES TO LOCUS OF CONTROL AND OTHER PERSONALITY FACTORS 6
females. Self-reported age ranged from 18 to 62, witha mean of 26.7 (σ = 9.5). Our participants reportedan average locus of control score of 3.61 (σ = .59).This is slightly lower than scores reported in otherpublications that use this particular scale [30], [31]. Forexample, Lapierre and Allen [31] find a mean locusof control of 4.03 (σ = .61) for a participant pool of205 employees in various professions. This differencemay reflect the broader demographics of MechanicalTurk workers versus participants in traditional psy-chological studies. Locus of control in particular isoften studied in the context of work or education,meaning the participants in these studies may havedifferent educational or economic backgrounds thanthe general population. However, as we did not collectsuch demographics from our participants, we canonly speculate on this point.
3.2 Materials
Participants were initially given two questionnairesto measure the aspects of their personality which arerelevant to our hypotheses: a scale to measure theBig Five personality dimensions of Extraversion andNeuroticism and a locus of control scale to measurethe degree to which they see themselves as in controlof or controlled by external events. Both scales weretaken from the International Personality InventoryPool [26] and were combined to form a 40-questionsurvey. Neuroticism and Extraversion were includedfor comparison with Green et al.’s results, althoughthey are not the focus of the current analysis.
Green et al.’s study used two fully functional dataexploration systems with many differences betweenthem. For our study, we wished to isolate as muchas possible the variable of layout style, so we createda set of four very specific visualizations (Figure 1).The first of these, V1 (Figure 1(a)) displays a treein a simplified Windows Explorer style, using onlyindentation to indicate hierarchical relationships. Thisis representationally similar to the webpage organi-zation used by Map Viewer in Green et al.’s work.The fourth view, V4 (Figure 1(d)) uses a nested boxesdisplay that relies heavily on the visual metaphor ofhierarchy as containment [32]. Although it uses rectan-gles rather than circles and a very different interactionstyle, this view is representationally similar to thenested bubbles of the GVis visual analytics system.
Between these two extremes, we designed two in-termediate views. V2 (Figure 1(b)) is very similar tothe indentation style of V1, but adds borders aroundthe tree nodes to suggest a containment metaphor. V3(Figure 1(c)) breaks the strictly vertical layout styleused in V1 in favor of a horizontal layout closerto that used in V4, but still employs indentation toorganize the levels of the hierarchy. These views areintended to provide cases that interpolate between thetwo layout styles used in Green et al. Our use of such
simplified views may raise the concern that our resultsdo not directly apply to more realistic visual analyticsscenarios. However, since we are partially attemptingto replicate results from a study that employed real-world analysis systems, we feel this approach is com-plementary to previous work. If our results are similarto those found by Green et al, it would demonstratethat this simplification still maintains the importantdifferences between the systems used in their study.
Furthermore, if a trend can be found to increasefrom V1 to V4, it would show that our intermediateviews do indeed capture the major differences be-tween the two views. Since the intermediate viewsprimarily differ in the degree to which they expresseither a list-like or containment metaphor, this couldsupport our argument that the finding is largely basedon the different user groups’ willingness to adapt toone metaphor over the other. That said, layout is acomplex factor that by nature is made up of manydimensions. While this study design is intended tokeep these layout differences as controlled as possible,there are like other aspects of the layout, such as data-ink ratio or size of visual elements, which cannot beentirely ruled out as factors. Nonetheless, this studydesign can at least test whether layout factors ingeneral can lead to a locus of control effect withoutdifferences in visual encoding or interaction.
Apart from these specific design differences, weendeavored to maintain consistency between the fourviews whenever possible. They all use the same fontsize and folder icons. Each visualization also has thesame interaction style, based on the collapsing foldersmetaphor seen in a standard desktop file system.This may somewhat bias the results in favor of V1,which most closely resembles the interfaces used infile systems. Nonetheless, we argue that maintaininginteraction consistency is important enough for isolat-ing design factors that this is worth the tradeoff.
In addition, we implemented the restriction thatonly one subtree could be open at one time. If a userexpanded one branch of the hierarchy and then at-tempted to expand a node in an unconnected branch,the first branch would automatically collapse. Thiswas intended to keep the amount of potentially visibleinformation consistent across the four views. Havingseveral subtrees open is fairly easy in V1, which ispurely vertical, but it would be difficult or impossibleto open an infinite number of subtrees in V4 withoutmaking the lower-level nodes too small to displayan entire label. Finally, to see genome data aboutindividual species, the participant hovered the mouseover the species name to bring up a tooltip. Our goalwith this interaction style was to keep the four viewsas consistent as possible except in how they visuallyorganize the space.
The datasets presented in these four visualizationswere four subsets of the full taxonomic tree fromthe National Center for Biotechnology Information’s

HOW VISUALIZATION LAYOUT RELATES TO LOCUS OF CONTROL AND OTHER PERSONALITY FACTORS 7
TABLE 1The eight task questions seen in the study.
Dataset Question Type Question
Amphibia search Within the classification “Batrachuperus,” which species was most recently updated?inferential Under “Anura,” find the classification “Bufo” and note the subclasses it contains. There is another classification under
“Mesobatrachia” that has something notable in common with “Bufo.” Find that classification.
Aves search Under the classification “Falco,” find the species with a “Length” value over 18000.inferential Looking in “Sphenisciformes,” find the classification “Eudyptula” and note the species under it. Now look in
“Threskiornithidae” for a classification that has something notable in common with “Eudyptula.”
Eutheria search Within the classification “Tarsius,” find the species which was most recently updated.inferential Under “Caniformia,” find the classification “Canis” and note the subclasses and species it contains. Now find another
classification under “Ursidae” that has something notable in common with “Canis.”
Lepidosauria search Under the classification “Bipes,” find the species with the lowest “Length” value.inferential Within “Scincomorpha,” find the classification “Lacerta” and note the species under it. Now look in “Crotalinae” for
a classification which has something in common with “Lacerta.”
Genome database [33]. Each dataset represents a phy-logenetic tree where leaf nodes are individual species.At the leaf level, there is data on the genome mappingdata available for that species, such as the date theentry was updated and the number of proteins andgenes in the database. This is similar to the data usedin Green et al., but does not include all the informationfound in the Map Viewer subset of the database. Wechose to show less data at the leaf level in order topresent more data overall and more complex trees.The four datasets had, on average, 98.75 leaf nodes(i.e. individual species) and 114.75 non-leaf nodes inthe phylogenetic tree. There was some variety in thebranching factors and overall structure of the trees,although this was not carefully controlled for. How-ever, since the datasets were ultimately balanced withrespect to the view types, these differences should notsignificantly affect our results.
We considered the unfamiliarity of the datasetsto be beneficial to our study, since we could trustthat participants would need to consult the viewsin order to answer the task questions we presentedthem. Following Green et al. [4], these questions weredivided into search tasks and inferential tasks. Inboth cases, tasks took the form of questions thatparticipants were expected to consult the visualizationto answer. This is similar to the methodology usedin most visualization evaluation studies. These twoquestion types are meant to represent simple datalookup and more complex analytical tasks, althoughthey are simplified versions of the real-world versionsof these tasks. We expect to see more differences inthe inferential questions, since these are more likelyto require understanding of the structure of a datasetrather than simple navigation ability.
The search questions asked the participants to finda single species within a classification that had a cer-tain property. For example, “Within the classification‘Batrachuperus,’ which species was most recently up-dated?” The verbal metaphor for tree structure used inthese questions was varied between a levels metaphor
and containment metaphor, to avoid any potentialconfound of metaphor compatibility [32]. Participantswere asked to write the name of the species theyfound within a text field. The inferential questionswere more open-ended, asking the participant to finda certain classification, then find another classificationin another part of the taxonomy that had somethingin common with the first. For example:
Under “Anura,” find the classification “Bufo”and note the subclasses it contains. There is an-other classification under “Mesobatrachi” that hassomething notable in common with “Bufo.” Findthat classification.
This was usually a similar pattern of names ornumbers of species that fell under the classification.For example, the classification “Bufo” contained aclassification also called “Bufo,” and the correct an-swer was another classification that contained a childnode with the same name as itself. Since correctnessmay be harder to judge in questions with free text re-sponses, participants in this case chose their responsefrom a list of four multiple choice answers (as wellas a “None of the Above” response). Each datasetwas associated with two task questions: one searchquestion and one inferential question. Participantstherefore saw eight task questions altogether (Table 1).
3.3 ProcedureAfter selecting the study task from the MechanicalTurk website participants were asked to fill out a 40-question personality scale by rating each item from1 (strongly disagree) to 5 (strongly agree). Once theywere done, they read instructions for the remainderof the experiment.
The main portion of the experiment consisted offour sessions, one with each of the four views. Thesequence in which these views were presented wascounterbalanced to prevent ordering effects. Fourdatasets were randomly distributed between the fourviews, such that each dataset was seen exactly once.
When they first saw the visualization, participantswere asked to familiarize themselves with the in-

HOW VISUALIZATION LAYOUT RELATES TO LOCUS OF CONTROL AND OTHER PERSONALITY FACTORS 8
terface for as long as they liked. When they weredone, they clicked on a button labeled “Start” andwere presented with the search question. They againhad unlimited time to interact with the visualizationand find the answer. When they were satisfied, theyclicked on a “Ready to Answer” button and werepresented with a text field to fill in their answer.Interaction with the visualization was then lockedto limit the recorded response time to the actualinteraction time and ignore the time used to type inthe answer.
After answering the search question, the participantwas presented with an inferential question on thesame dataset. The procedure for the inferential ques-tion was the same as for the search question, exceptthat participants were presented with a set of multiplechoice responses instead of a text field to record theiranswer. The responses were presented in randomorder and were not visible during the interactionperiod. Once both questions were answered, partic-ipants were shown a brief four-question preferencesurvey on how much they liked the visualization. Thequestions in this survey were:
• This system was easy to use.• The way this system arranged information made sense
to me.• I understand the data better after using this system.• I enjoyed using this system.
Participants rated how much they agreed with eachof these statements on a five-point scale. After com-pleting all four sessions, participants were asked toprovide their age, gender, and any comments aboutthe study in a form on the Mechanical Turk site.
Overall, the experiment lasted approximately onehour. We measured the time spent in the initial train-ing period, the time taken in the interaction period,and the time needed to record their response, as wellas whether their response was correct or incorrect.In addition, we calculated each participant’s locusof control, neuroticism, and extraversion based ontheir personality scale responses, and averaged theirpreference survey responses to generate a PreferenceScore for each visualization.
4 RESULTS
The task questions proved quite challenging, with anoverall accuracy of 68.6% correct responses on searchtasks and 47.1% on inferential tasks. This, coupledwith the large amount of time spent interacting withthe views, should be kept in mind when interpret-ing the following results. Across all participants andquestion types, no view condition was more or lessdifficult in terms of accuracy (χ2(3, N = 1919) = 3.7,p = .29) or correct response time (F (3, 1109) = .57,p = .63). As our primary interest is the influenceof a participant’s personality factors, further analysisfocuses on participants grouped by personality type.We found support for our hypothesis that participants
Grouped LOCexternal LOCaverage LOCinternal LOC
Mea
n C
orre
ct R
espo
nse
Tim
e(s
econ
ds)
400
300
200
100
0
V1Basic tree
V2Bordered
tree
V3Indented
boxes
V4Nested boxes
Fig. 3. Inferential task response time for correct an-swers only across the four view conditions and threelocus of control (LOC) groups. Participants with ahighly internal LOC, who see themselves as in con-trol of external events, were much slower than otherparticipants at answering inferential questions in V4,a visualization that uses a strong nested-boxes visualmetaphor. Participants with a highly external LOC, whosee themselves as controlled by outside events, arerelatively more likely to perform quickly on V4.
with a more internal locus of control would havemore difficulty with views similar to V4. While wefound that participants with a more external locus ofcontrol did perform very well with V4, we did notfind a corresponding trend in which their performeddecreased on views similar to V1. We found partialsupport for Green et al.’s finding that more neuroticparticipants would perform better with the moreexplicitly structured views, but no support for thetheir finding that less extraverted participants wouldperform better with these views.
4.1 Effects of Locus of ControlWe initially divided participants into three groupsbased on their score on the Locus of Control scale.Participants with a score lower than one standarddeviation from the mean (i.e. less than 3.01) wereclassified as external LOC users. Those with a scoregreater than one standard deviation from the mean(i.e. greater than 4.21) were classified as internal LOCusers. The rest were classified as average LOC users.
The independent variables we analyzed to test ourhypothesis were Question Type (search task versusinferential task), View Condition (V1, V2, V3, or V4),and LOC Group (external, average, or internal). Ouroverall model was therefore a 2x4x3 Univariate Anal-ysis of Variance (ANOVA). This overall model wassignificant for the variable of Correct Response Time(F (23, 1109) = 10.67, p < .01, η2p = .18). Correct

HOW VISUALIZATION LAYOUT RELATES TO LOCUS OF CONTROL AND OTHER PERSONALITY FACTORS 9
View ConditionV1 (basic tree)V2 (bordered tree)V3 (indented boxes)V4 (nested boxes)
external LOC average LOC internal LOC
Perc
ent C
orre
ct R
espo
nses
60%
40%
20%
0%
80%
Fig. 4. Percentage of correct answers in both questiontypes across the four view conditions for participantsgrouped by their locus of control score. Participantswith a more external locus of control were more ac-curate overall, while the other groups performed poorlywith V4.
Response Time only included correct responses, andrepresents only the time spent interacting with theview, not the time spent writing or choosing a re-sponse.
In addition, there were significant main effects ofquestion type (F (1, 1109) = 158.86, p < .01, η2p = .13)and locus of control (F (2, 1109) = 5.38, p < .01,η2p = .01). Unsurprisingly, search questions wereanswered faster than the more difficult inferentialquestions. Overall, internal LOC participants wereslower at answering questions correctly (M = 183.4seconds, SD = 11.6) than external LOC participants(M = 147.9 seconds, SD = 10.3). There was alsoa significant interaction between view condition andquestion type (F (3, 1109) = 3.01, p < .05, η2p =.01) and between question type and LOC group(F (2, 1086) = 5.93, p < .01, η2p = .01). The reason forthe latter is that internal LOC participants are muchslower than the others on inferential tasks, but arethe same speed when answering search tasks. Thesource of the interaction between view and questiontype is that, while inferential questions were answeredmore slowly than search questions in all views, thisdifference was significantly larger in V3. For infer-ential questions, V3 produced the slowest responsetimes of all views, but produced the fastest for searchtasks. We focus our subsequent analysis on inferentialquestions, since it was on these questions that theindividual differences between participants were mostsubstantial.
The results relevant to our main hypothesis aresummarized in Figure 3, which shows inferentialquestion response times across view types and par-ticipants grouped by locus of control. We found thatparticipants with an external LOC answer inferential
80%
60%
40%
20%
0%low
neuroticismaverage
neuroticismhigh
neuroticism
V1 (basic tree)V2 (bordered tree)V3 (indented boxes)V4 (nested boxes)
View Condition
Perc
ent C
orre
ct R
espo
nses
Fig. 5. Percentage of correct answers in both questiontypes across the four view conditions for participantsgrouped by their neuroticism score. More neurotic par-ticipants performed more accurately with visualizationsthat used a more container-like layout, while partici-pants in other groups displayed the opposite trend.
questions in V4 (the nested boxes) faster than otherparticipants, although they answer questions in V1faster as well. Internal LOC participants show a cleartrend of slower performance from V1 to V4, althoughthere is no distinction for these participants betweenV3 and V4. Average LOC participants show no re-sponse time difference between the four views. Wealso found that raw locus of control score correlatessignificantly with correct response time on nestedboxes but no other condition (r(104) = .23, p < .05).For search tasks, there was no significant responsetime difference for any participants between the fourviews.
To test overall accuracy, we used a Pearson’s chi-square test on correctness (in both question types) andgrouped locus of control. Participants with an exter-nal LOC answered more questions correctly overall(χ2(2, N = 1919) = 7.7, p < .05), possibly due to theirbetter performance on conditions V3 and V4. Theseresults are summarized in Figure 4.
4.2 Results by Big Five Personality Factors
As with Locus of Control, we divided participantsinto high, low, and average groups for both Extraver-sion and Neuroticism using one standard deviationfrom the mean as dividing points. This split par-ticipants into three groups based on Extraversion:introverted (less than 2.29), average extraversion, andextraverted (greater than 3.86). For Neuroticism, thesegroups were low neuroticism (less than 2.02), averageneuroticism, and high neuroticism (greater than 3.53).
We found no overall effects of either of the two BigFive measures on correct response time. As with LOC,we used a Pearson’s chi-square test on correctnessand grouped personality type to test differences in

HOW VISUALIZATION LAYOUT RELATES TO LOCUS OF CONTROL AND OTHER PERSONALITY FACTORS 10
accuracy. Introverts were more accurate across allfour views and both question types than extraverts(χ2(2, N = 1919) = 34.15, p < .001). A similar effectwas found for participants with high Neuroticismscores (χ2(2, N = 1919) = 9.24, p = .01).
In addition, highly neurotic participants were sig-nificantly more accurate than the other groups in thehigh-structure V4 condition (χ2(2, N = 480) = 6.12,p < .05). In general, the more neurotic participantsseemed to answer a higher percentage of questionsaccurately as views became more container-like, whilethe other groups showed the opposite trend (Figure 5).There was no equivalent significant effect for extraver-sion. Additionally, unlike Green and Fisher [3], wefound no effect of either extraversion or neuroticismon response time for search tasks.
4.3 Other FindingsIn addition to the personality variables that we mea-sured, we analyzed our results based on the de-mographics and preference information we collectedfrom participants. According to a repeated measuresANOVA on the preference scores for each visualiza-tion, V1 and V2 were rated significantly more posi-tively than V3 and V4 (F (3) = 15.09, p < .001). Thesepreference ratings displayed no significant correlationwith accuracy or response time. There was also norelationship between locus of control and preferenceratings for any of the four views.
Female participants answered more questions cor-rectly than male participants (t(231) = −2.31, p <.05). We found that the age of participants correlatedpositively with overall response time (r(1893) = .13,p < .001), so that older participants took more timeinteracting with the interfaces. Age had no effect,however, on accuracy, and did not correlate with anyof the personality measures. In the following sections,we will discuss these implications of these findings forour hypothesis and for visualization design in general.
5 DISCUSSION
Through this study, we demonstrated previously re-ported effects of locus of control in a simplified designthat isolates layout style. This supports our mainhypothesis that the way visual elements are spatiallyarranged is a significant factor of design that interactswith locus of control. This clarifies the earlier findingsand suggests an explanation for this effect rooted inthe relationship between locus of control and use ofexternal representations.
5.1 Replication and Expansion of Previous Find-ings on Locus of ControlOur results replicate those of Green et al. [3], [4] insome cases, but not all. Error rates across the two ex-periments are not directly comparable. In the previous
study, participants were allowed as many attemptsas needed to answer a question correctly, with eachmistake recorded as an error. However, both studiesfound that participants made more errors overall inthe containment-metaphor visualization than in themore list-like view (V1 in this study, Map Viewerin [3], [4]). More significantly, external LOC partici-pants in both studies responded faster to inferentialquestions than internal LOC participants, particularlyin a visualization with a containment-based visualmetaphor (V4 in this study, GVis in [3], [4]).
Together, these findings provide evidence that theeffects of locus of control on visualization use can bereplicated. Users with either an internal or externallocus of control show performance differences in gen-eral on data exploration tasks, and additionally, eachgroup performs better with different visualizationstyles. This suggests that locus of control may be avariable that merits further study, and that personalitydifferences in general may be a valuable area forresearch in visualization.
We did not replicate previous findings on searchtask response times. Green et al. found that internalLOC participants responded faster to search tasks inGVis, and that neurotic and extraverted participantsresponded faster to search tasks overall. However,completion times for these tasks included incorrectresponses and guesses made by participants, so ourresponse times are not directly comparable for thesequestions. This was not the case for the inferentialquestions, where they recorded only the time to makea single response.
We speculate that the inferential questions forcedthe users to consider the structure of the data toa greater degree. The search questions may havesimply measured a participant’s ability to navigate theinterface quickly, while the inferential questions askedthem to characterize parts of the data in an open-ended fashion. Participants may have interpretedthese questions in a variety of ways, allowing thestructural elements of the visualization design to playa greater role in their thought process.
Although external LOC participants were fasterthan other participant groups at answering questionsin V4, they were equally fast in V1. This findingdoes not fit our original hypothesis that internal andexternal participants prefer different types of visuallayouts. It may be that the high familiarity of treemenus like V1 created a training effect that causeda break in the overall pattern. However, given thedata, we cannot conclude that external participantsperform better with containment views than withlist-like views. Rather than a clear trend of grouppreference, a better interpretation of our results maybe that external LOC participants are generally betterable to answer inferential questions using unusualvisualization layouts. An experiment controlling thepotential confound of a highly familiar view is needed

HOW VISUALIZATION LAYOUT RELATES TO LOCUS OF CONTROL AND OTHER PERSONALITY FACTORS 11
to test which interpretation is better supported.Familiarity may also explain the higher preference
scores across all participants for V1 and V2, thoughit is interesting that there was no correspondence be-tween preference and performance. It is also possiblethat this lacking relationship may reflect the fact thatparticipants were paid a bonus for correct responses,and therefore had an incentive to perform well despitedisliking the interface. In any case, people may havefelt that V3 and V4 were especially confusing dueto their unusual appearance, but they were just ascapable of answering questions with these interfaces.
5.2 Findings on Other Personality Factors
Compared to Green and Fisher [3], we found fewernotable differences between participants categorizedby neuroticism or extraversion. In fact, these person-ality dimensions had no significant effect on responsetime, which is where the most dramatic effects of lo-cus of control were found. On the other hand, we didfind that these dimensions influenced participants’accuracy on search tasks.
In the case of neuroticism, our results provide sup-port for Green and Fisher’s finding that more neuroticparticipants generally perform better on search taskswith visual interfaces. The highly neurotic partici-pants were significantly more accurate overall, ag-gregating all four views and both question types. Assuggested by Green and Fisher, this may be explainedby the theory that people with more neurotic or trait-anxious personalities tend to be more attentive toproblem-solving tasks up to a certain level of com-plexity [34].
However, we also found that this effect was es-pecially pronounced in the case of V3 and V4, themost container-like of the four views. Notably, thelow-neuroticism participants performed more poorlyon these two views than on V1 and V2, which likelycontributes to the overall relationship between neu-roticism and accuracy (Figure 5). This mirrors thefindings on locus of control (see Figures 4 and 5) andsuggests that less neurotic participants, like the moreinternal ones, are less able to make sense of thesetypes of visual layouts. It is possible that the greaterattentiveness of these users makes it easier for themto learn an unfamiliar interface. Lower neuroticismalso correlates with a more internal locus of control,and it is possible that the two scales measure similarqualities that both indicate different aspects of a user’sunwillingness or inability to adapt to unusual externalrepresentations. An alternate explanation is that theneurotic participants may put more pressure on them-selves to complete a question correctly rather thanabandoning a task due to an unfamiliar visualization.
In the case of extraversion, our results seemingly di-verge from Green and Fisher’s. They found that moreextraverted participants responded more quickly to
search tasks, and we found that more introvertedparticipants were more accurate on all task types.One possibility is that, under some circumstances,extraverted users respond more quickly but less ac-curately. That said, we did not find any significantresults regarding response time in the current work,so this remains speculative. However, this hypothesisis supported by previous work on introversion andproblem solving which finds that more introvertedpeople tend to take more time to think through prob-lems [15]. This extra time may have been particularlyhelpful in a situation where they had to reason withunfamiliar visual interfaces and datasets.
Since extraversion showed no significant relation-ship with view type, the overall profile of a par-ticipant in our study who performed well with themore containment-like visual layouts is someone whohad an external or average locus of control and washighly neurotic. As neuroticism measures emotionalstability, and locus of control the degree to whicha participant feels in command of situations, thesefindings may indicate that feeling somewhat out ofcontrol can be an advantage when it comes to makingsense of novel visualization designs. It is worth notingthat both of these dimensions tend to be negativelycorrelated with job performance and other practicaloutcomes [22]. Taken together, this suggests the pos-sibility that persons who struggle with more standardtasks are better suited to thinking with complex vi-sual representations. This possibility warrants furtherinvestigation. At the same time, a novel visualizationdesign, while helpful for some users, may be a hin-drance to users who already perform a task well usingtheir own methods.
Further work is needed to understand these pat-terns of users who perform better or more poorlyas visual layouts tend towards a strong containmentmetaphor. It is necessary to examine whether thesefindings can be generalized beyond this specific taskand data type as well as whether they can be gener-alized to different sets of visual metaphors. Nonethe-less, we argue that our findings, particularly thoseon locus of control, serve as a step towards a betterunderstanding of the externalization theory of visual-ization and how it works for different types of users.
5.3 Locus of Control and External Representa-tions
By isolating the variable of layout style in this study,we have shown that simplified layout changes canproduce locus of control effects similar to those foundin a user study that compares real-world systems.This provides evidence that layout is a key factorin mediating this effect, independent of the effectsof interaction style, visual encoding, and generaldifferences between traditional interfaces and visualanalytic systems. Although the current work does
HOW VISUALIZATION LAYOUT RELATES TO LOCUS OF CONTROL AND OTHER PERSONALITY FACTORS 12
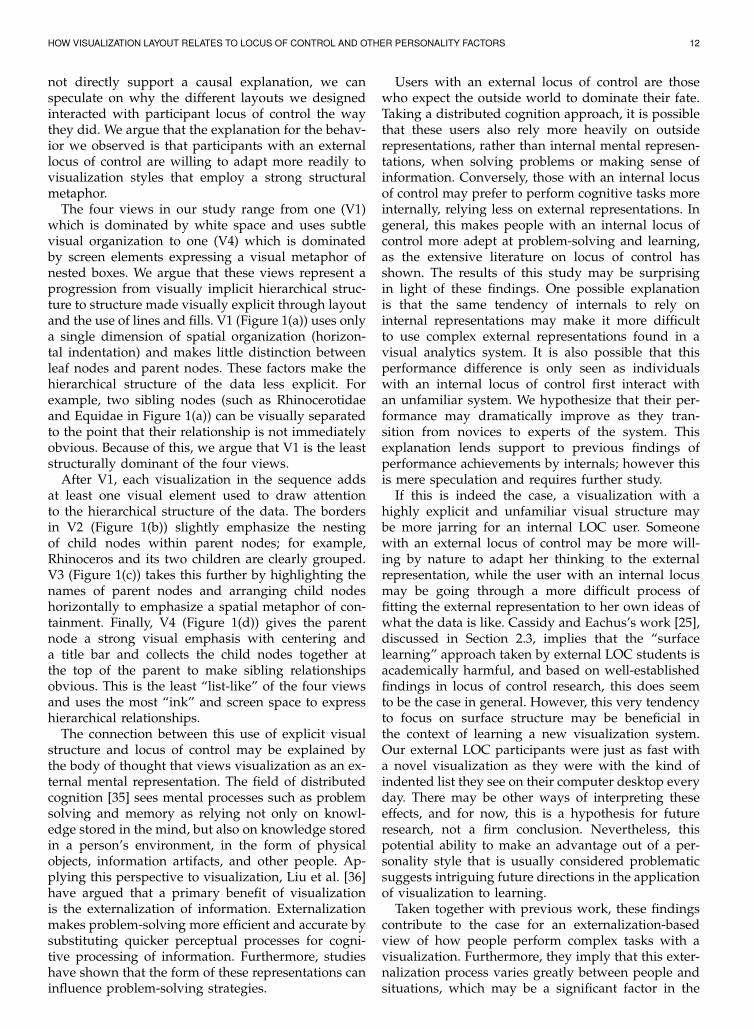
not directly support a causal explanation, we canspeculate on why the different layouts we designedinteracted with participant locus of control the waythey did. We argue that the explanation for the behav-ior we observed is that participants with an externallocus of control are willing to adapt more readily tovisualization styles that employ a strong structuralmetaphor.
The four views in our study range from one (V1)which is dominated by white space and uses subtlevisual organization to one (V4) which is dominatedby screen elements expressing a visual metaphor ofnested boxes. We argue that these views represent aprogression from visually implicit hierarchical struc-ture to structure made visually explicit through layoutand the use of lines and fills. V1 (Figure 1(a)) uses onlya single dimension of spatial organization (horizon-tal indentation) and makes little distinction betweenleaf nodes and parent nodes. These factors make thehierarchical structure of the data less explicit. Forexample, two sibling nodes (such as Rhinocerotidaeand Equidae in Figure 1(a)) can be visually separatedto the point that their relationship is not immediatelyobvious. Because of this, we argue that V1 is the leaststructurally dominant of the four views.
After V1, each visualization in the sequence addsat least one visual element used to draw attentionto the hierarchical structure of the data. The bordersin V2 (Figure 1(b)) slightly emphasize the nestingof child nodes within parent nodes; for example,Rhinoceros and its two children are clearly grouped.V3 (Figure 1(c)) takes this further by highlighting thenames of parent nodes and arranging child nodeshorizontally to emphasize a spatial metaphor of con-tainment. Finally, V4 (Figure 1(d)) gives the parentnode a strong visual emphasis with centering anda title bar and collects the child nodes together atthe top of the parent to make sibling relationshipsobvious. This is the least “list-like” of the four viewsand uses the most “ink” and screen space to expresshierarchical relationships.
The connection between this use of explicit visualstructure and locus of control may be explained bythe body of thought that views visualization as an ex-ternal mental representation. The field of distributedcognition [35] sees mental processes such as problemsolving and memory as relying not only on knowl-edge stored in the mind, but also on knowledge storedin a person’s environment, in the form of physicalobjects, information artifacts, and other people. Ap-plying this perspective to visualization, Liu et al. [36]have argued that a primary benefit of visualizationis the externalization of information. Externalizationmakes problem-solving more efficient and accurate bysubstituting quicker perceptual processes for cogni-tive processing of information. Furthermore, studieshave shown that the form of these representations caninfluence problem-solving strategies.
Users with an external locus of control are thosewho expect the outside world to dominate their fate.Taking a distributed cognition approach, it is possiblethat these users also rely more heavily on outsiderepresentations, rather than internal mental represen-tations, when solving problems or making sense ofinformation. Conversely, those with an internal locusof control may prefer to perform cognitive tasks moreinternally, relying less on external representations. Ingeneral, this makes people with an internal locus ofcontrol more adept at problem-solving and learning,as the extensive literature on locus of control hasshown. The results of this study may be surprisingin light of these findings. One possible explanationis that the same tendency of internals to rely oninternal representations may make it more difficultto use complex external representations found in avisual analytics system. It is also possible that thisperformance difference is only seen as individualswith an internal locus of control first interact withan unfamiliar system. We hypothesize that their per-formance may dramatically improve as they tran-sition from novices to experts of the system. Thisexplanation lends support to previous findings ofperformance achievements by internals; however thisis mere speculation and requires further study.
If this is indeed the case, a visualization with ahighly explicit and unfamiliar visual structure maybe more jarring for an internal LOC user. Someonewith an external locus of control may be more will-ing by nature to adapt her thinking to the externalrepresentation, while the user with an internal locusmay be going through a more difficult process offitting the external representation to her own ideas ofwhat the data is like. Cassidy and Eachus’s work [25],discussed in Section 2.3, implies that the “surfacelearning” approach taken by external LOC students isacademically harmful, and based on well-establishedfindings in locus of control research, this does seemto be the case in general. However, this very tendencyto focus on surface structure may be beneficial inthe context of learning a new visualization system.Our external LOC participants were just as fast witha novel visualization as they were with the kind ofindented list they see on their computer desktop everyday. There may be other ways of interpreting theseeffects, and for now, this is a hypothesis for futureresearch, not a firm conclusion. Nevertheless, thispotential ability to make an advantage out of a per-sonality style that is usually considered problematicsuggests intriguing future directions in the applicationof visualization to learning.
Taken together with previous work, these findingscontribute to the case for an externalization-basedview of how people perform complex tasks with avisualization. Furthermore, they imply that this exter-nalization process varies greatly between people andsituations, which may be a significant factor in the

HOW VISUALIZATION LAYOUT RELATES TO LOCUS OF CONTROL AND OTHER PERSONALITY FACTORS 13
difficulty of controlling and interpreting evaluationsof visualization systems. This increased understand-ing of how externalization relates to individual dif-ferences not only contributes to visualization theory,but also has practical implications for the design ofvisualization systems.
6 IMPLICATIONS FOR DESIGN
These studies and others like them provide mountingevidence that personality and design style can havea significant effect on whether a user accepts a visu-alization design. It is possible that a user’s personal-ity can serve as shorthand for subtle cognitive styledifferences that are not easily measurable otherwise,but which gain importance in the exploratory contextof visualization use. The significant effect of locusof control on performance suggests that it measuressomething particularly important to visualization use,and so in this section we focus on how understandinglocus of control can be used to improve visualizationdesign.
When we give users a novel visualization, we areessentially asking them to give up some control overtheir thinking processes. Some users will find thishelpful, while others may find it a hindrance. Weargue that a visualization designer should have asense of how willing a given user will be to take onan external representation, and know how to designa visualization that makes it more or less difficult toignore the structural aspects of that representation.
Based on our findings, a useful guideline for adap-tation would be to increase the amount of explicitstructure for users that might have a more externallocus of control. Users with a very internal locus ofcontrol will likely perform best with a visualizationstyle that uses simple spatial organization and min-imal borders, outlines, and other grouping elements.In practice, this type of design may correspond to themaximized “data-ink ratio” argued for by Tufte [37].External LOC users, on the other hand, may performmore efficiently with a visualization style that vio-lates this classic guideline by including more non-functional elements such as borders, fills, and outlinesto call attention to a specific information structure.In addition, this type of user may have an easiertime working with visualizations that use a two-dimensional spatial layout to organize information.
Although it would be impractical to directly mea-sure a user’s locus of control and adapt the visu-alization accordingly, future work can address thepossibility of using this principle to guide design. Ourresearch views locus of control as predicting the de-gree to which a user will, by innate disposition, preferher own internal mental models (internal LOC) versusbeing willing to adapt to an external representation(external LOC). This general principle, then, may ap-ply in other situations where users are likely to prefer
a pre-existing mental model or problem-solving pro-cess for reasons other than personality. Expert users,for example, may be more resistant to visualizationswith highly explicit structure. Likewise, a user groupwith a highly standardized analysis process shouldbe given visualizations with low structural emphasis.A user group which is likely to approach a problemin a more exploratory mode may find it easier towork with visualizations that makes the structuralorganization of data explicit.
While an analysis of our results suggests possibili-ties for design, more research is needed to formalizethe growing body of insights into individual usersand visualization. Future work in this domain shouldinclude the development of formal design guidelinesdriven by a more comprehensive analysis of individ-ual differences and their relationships to visual designelements.
7 CONCLUSION
In subsequent work, we hope to combine these find-ings with other work in individual differences topursue more complete models of the visualizationuser. As Yi [38] has argued, major advances in un-derstanding these individual differences must comefrom collecting knowledge across studies. This workis one attempt at doing so, and much more can bedone to find commonalities among the measures andfindings on how users adapt to visualizations.
In this paper, we have contributed findings on howusers with different personality types react to varyinglayout styles used in a hierarchy visualization. Wefound evidence that systematic differences in layoutstyle can indeed influence a user’s response time andaccuracy with different types of visualizations that areinformationally equivalent but differ in layout. Thesefindings seem to fit a pattern in which users witha more external locus of control are more efficientat using a visualization which uses a highly explicitvisual metaphor than users with a more internal locusof control. We expect that these findings can serve asa step towards better understanding of why subtledifferences between users’ personality styles can havea surprising influence on visualization use.
ACKNOWLEDGMENTS
The authors wish to thank Tera M. Green and BrianFisher for their helpful discussions and collaboration.This material is based in part upon work supportedby the International Program of the Department ofHomeland Security under grant number 2009-ST-108-000007. Any opinions, findings, and conclusions orrecommendations expressed in this material are thoseof the authors and do not necessarily reflect theviews of the Department of Homeland Security. Thismaterial is based in part upon work supported bythe National Science Foundation under Grant No.

HOW VISUALIZATION LAYOUT RELATES TO LOCUS OF CONTROL AND OTHER PERSONALITY FACTORS 14
CIF-B-195. Any opinions, findings, and conclusions orrecommendations expressed in this material are thoseof the authors and do not necessarily reflect the viewsof the National Science Foundation.
REFERENCES
[1] S. E. Palmer, Vision science: Photons to phenomenology. MITPress., 1999, vol. 1.
[2] C. G. Healey, “Perception in visualiza-tion,” North Carolina State University,http://www.csc.ncsu.edu/faculty/healey/PP, RetrievedMarch 2011.
[3] T. M. Green and B. Fisher, “Towards the personal equationof interaction: The impact of personality factors on visualanalytics interface interaction,” in IEEE Visual Analytics Scienceand Technology (VAST), 2010.
[4] T. M. Green, D. H. Jeong, and B. Fisher, “Using personalityfactors to predict interface learning performance,” in HawaiiInternational Conference on System Sciences 43, January 2010.
[5] A. Dillon and C. Watson, “User analysis in HCI: The histori-cal lesson from individual differences research,” InternationalJournal of Human-Computer Studies, vol. 45, pp. 619–637, 1996.
[6] C. Conati and H. Maclaren, “Exploring the role ofindividual differences in information visualization,” inAdvanced Visual Interfaces. ACM Press, 2008. [Online].Available: http://www.cs.ubc.ca/ conati/my-papers/AVI-2008-cameraWithInteraction.pdf
[7] B. Allen, “Individual differences and the conundrums of user-centered design: Two experiments,” Journal of the AmericanSociety for Information Science, vol. 51, no. 6, pp. 508–520, 2000.[Online]. Available: http://www3.interscience.wiley.com/cgi-bin/fulltext/71001471/PDFSTART
[8] C. Chen, “Individual differences in a spatial-semanticvirtual environment,” Journal of the American Society forInformation Science, vol. 51, no. 6, pp. 529–542, 2000.[Online]. Available: http://www3.interscience.wiley.com/cgi-bin/fulltext/71001476/PDFSTART
[9] C. Ziemkiewicz and R. Kosara, “Preconceptions and individ-ual differences in understanding visual metaphors,” ComputerGraphics Forum, vol. 28, no. 3, pp. 911–918, 2009, proceedingsEuroVis.
[10] L. R. Goldberg, “An alternative “description of personality”:The big-five factor structure,” Journal of Personality and SocialPsychology, vol. 59, no. 6, pp. 1216–1229, 1990.
[11] B. Tversky, “Functional significance of visuospatial represen-tations,” in Handbook of higher-level visuospatial thinking, P. Shahand A. Miyake, Eds. Cambridge University Press, 2005, pp.1–34.
[12] B. Tversky, M. Agrawala, J. Heiser, P. U. Lee, P. Hanrahan,D. Phan, C. Stolte, and M.-P. Daniele, “Cognitive designprinciples: From cognitive models to computer models,” inModel-based reasoning in science and engineering, L. Magnani,Ed. King’s College, 2007, pp. 1–20.
[13] J. Heiser and B. Tversky, “Mental models of complexsystems: Structure and function,” http://www-psych.stanford.edu/simwbt/diagrams/papers/mental models-heiser-tversky.pdf.
[14] B. Tversky, J. Zacks, P. U. Lee, and J. Heiser, “Lines,blobs, crosses, and arrows: Diagrammatic communication withschematic figures,” in Theory and application of diagrams, M. An-derson, P. Cheng, and V. Haarslev, Eds. Springer, 2000, pp.221–230.
[15] M. McCaulley, “The myers-briggs type indicator: A jungianmodel for problem solving,” New Directions for Teaching andLearning, vol. 1987, no. 30, pp. 37–53, 1987.
[16] L. Uziel, “The extraverted and the neurotic glasses are ofdifferent colors,” Personality and Individual Differences, vol. 41,no. 4, pp. 745–754, 2006.
[17] J. Chartrand, M. Rose, T. Elliott, C. Marmarosh, and S. Cald-well, “Peeling back the onion: Personality, problem solving,and career decision-making style correlates of career indeci-sion,” Journal of Career Assessment, vol. 1, no. 1, pp. 66–82, 1993.
[18] F. H. Farley, “Individual differences in solution time in error-free problem solving,” British Journal of Social and ClinicalPsychology, vol. 5, no. 4, pp. 306–309, 1966.
[19] T. Judge, A. Erez, J. Bono, and C. Thoresen, “Are measuresof self-esteem, neuroticism, locus of control, and generalizedself-efficacy indicators of a common core construct?” Journalof Personality and Social Psychology, vol. 83, no. 3, p. 693, 2002.
[20] J. Walsh, J. Wilding, M. Eysenck, and J. Valentine, “Neuroti-cism, locus of control, type a behaviour pattern and occupa-tional stress,” Work & Stress, vol. 11, no. 2, pp. 148–159, 1997.
[21] J. B. Rotter, “Generalized expectancies for internal versusexternal control of reinforcement,” Psychological Monographs,vol. 80, no. 609, 1966.
[22] T. A. Judge and J. E. Bono, “Relationship of core self-evaluations traits—self-esteem, generalized self-efficacy, locusof control, and emotional stability—with job satisfaction andjob performance: A meta-analysis,” Journal of Applied Psychol-ogy, vol. 86, no. 1, pp. 80–92, 2001.
[23] M. J. Findley and H. M. Cooper, “Locus of control and aca-demic achievement: A literature review,” Journal of Personalityand Social Psychology, vol. 44, no. 2, pp. 419–427, 1983.
[24] C. R. Anderson, “Locus of control, coping behaviors, andperformance in a stress setting: A longitudinal study,” Journalof Applied Psychology, vol. 62, no. 4, pp. 446–451, 1977.
[25] S. Cassidy and P. Eachus, “Learning style, academic beliefsystems, self-report student proficiency and academic achieve-ment in higher education,” Educational Psychology, vol. 20,no. 3, pp. 307–320, 2000.
[26] L. R. Goldberg, J. A. Johnson, H. W. Eber, R. Hogan, M. C.Ashton, C. R. Cloninger, and H. C. Gough, “The internationalpersonality item pool and the future of public-domain person-ality measures,” Journal of Research in Personality, vol. 40, pp.84–96, 2006.
[27] J. Heer and M. Bostock, “Crowdsourcing graphical perception:Using Mechanical Turk to assess visualization design,” inProceedings CHI, 2010, pp. 203–212.
[28] R. Kosara and C. Ziemkiewicz, “Do Mechanical Turks dreamof square pie charts?” in BELIV Workshop, 2010, pp. 373–382.
[29] A. Kittur, E. H. Chi, and B. Suh, “Crowdsourcing user studieswith Mechanical Turk,” in Proceedings CHI, 2008, pp. 453–456.
[30] S. Hamlyn-Wright, R. Draghi-Lorenz, and J. Ellis, “Locus ofcontrol fails to mediate between stress and anxiety and depres-sion in parents of children with a developmental disorder,”Autism, vol. 11, no. 6, pp. 489–501, 2007.
[31] L. M. Lapierre and T. D. Allen, “Control at work, control athome, and planning behavior: Implications for workfamilyconflict,” 2010, published online before print in Journal ofManagement.
[32] C. Ziemkiewicz and R. Kosara, “The shaping of informationby visual metaphors,” IEEE Transactions on Visualization andComputer Graphics, vol. 14, no. 6, pp. 1269–1276, 2008.
[33] National Center for Biotechnology Information, “NCBIgenome database,” http://www.ncbi.nlm.nih.gov/genome/,accessed 11/18/2010.
[34] M. C. Ioannou, K. Mogg, and B. P. Bradley, “Vigilance forthreat: effects of anxiety and defensiveness,” Personality andIndividual Differences, vol. 36, pp. 1879–1891, 2004.
[35] J. Hollan, E. Hutchins, and D. Kirsh, “Distributed cognition:Toward a new foundation for human-computer interactionresearch,” ACM Transactions on Computer-Human Interaction,vol. 7, no. 2, pp. 174–196, 2000.
[36] Z. Liu, N. Nersessian, and J. Stasko, “Distributed cognition asa theoretical framework for information visualization,” IEEETransactions on Visualization and Computer Graphics, vol. 14,no. 6, pp. 1173–1180, 2008.
[37] E. R. Tufte, The Visual Display of Quantitative Information.Graphics Press, 1983.
[38] J. S. Yi, “Implications of individual differences on evaluatinginformation visualization techniques,” in Proceedings of theBELIV Workshop, 2010.