How to write method and material results statistical findings Dr L. Ghalichi Department of...
49
How to write method and material results statistical findings Dr L. Ghalichi Department of Epidemiology & Biostatistics School of public health Tehran University of Medical Sciences
-
Upload
eustace-sutton -
Category
Documents
-
view
215 -
download
1
Transcript of How to write method and material results statistical findings Dr L. Ghalichi Department of...

How to writemethod and materialresultsstatistical findings
Dr L. Ghalichi
Department of Epidemiology & Biostatistics
School of public health
Tehran University of Medical Sciences

METHOD

methodAllows reader to judge the quality
of the workIdentifies weaknessesAllows repetition of the studyState the study design &
specifications

methodWWWWWH (who, what, where,
why, when & how?)Define variablesPatient/Participants inclusionDatesRandomisation/Placebo/BlindnessEthics/consentTreatmentsOutcomes and endpointsStatistical methods & power

Check-list for MethodsStudy designClear definition of the participantsInclusion/exclusion criterialogical & chronological orderMeasurementsSample size statistical analyses New techniques validationCould the reader reproduce your
study from the details provided?

Patient / Animals / Specimens
• Numbers• How are they grouped• Criteria • Informed consent obtained

Method… Reason for selecting the design of the study. Statistical methods used for analysisIf standard techniques is used,
give appropriate reference, any modifications should be clearly explained
If new techniques is used, give validity and reliability measures

If applicable… Ethical approvalQuestionnairesInterventionsClinical assessmentsProper references

What to include in the methods section How the study was designedHow the study was carried out How the participants were recruited
and chosen Give reasons for excluding participants Consider mentioning ethical features Give accurate details of materials used Give exact drug dosages Give exact form of treatments
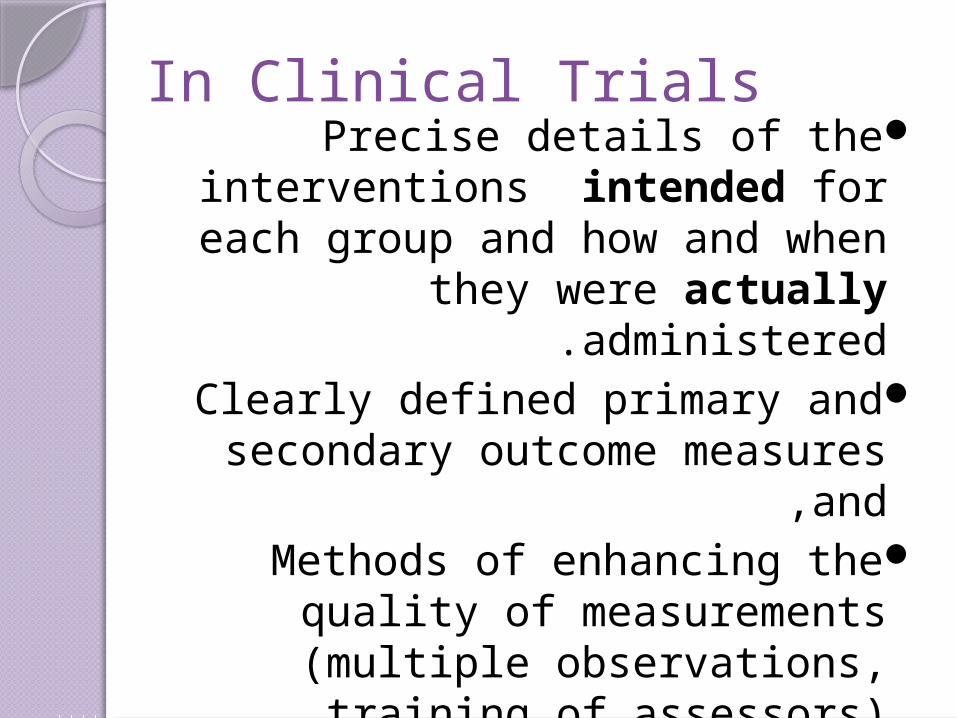
In Clinical TrialsPrecise details of the
interventions intended for each group and how and when they
were actually administered.Clearly defined primary and
secondary outcome measures and ,
Methods of enhancing the quality of measurements (multiple
observations, training of assessors).
interim analyses and stopping rules

In Clinical Trials
Method used to generate the random allocation sequence, including details of
any restriction (e.g., blocking, stratification).
Method used to implement the random allocation sequence (e.g., numbered
containers or central telephone),Concealment
◦Who generated the allocation sequence,◦who enrolled participants◦who assigned participants to their groups.

blinding
Participantsthose administering the
interventionsthose assessing the outcomes Those analyzing the findings
If done, how the success of blinding was evaluated.

blinding
Participantsthose administering the
interventionsthose assessing the outcomes Those analyzing the findings
If done, how the success of blinding was evaluated.

RESULTS

Results
Simplecomplex
Describe the populationStart with positive findingsEstablish how comparable your groups
were Use a mixture of text, tables and figuresMention units of measurementMention what numbers, brackets, etc.
refer toBring the P values

Results
Provide only enough interpretation to lead the reader from one
experiment to the other◦Avoid lengthy analysis and
comparison to the work of othersNo need to follow chronology of
study◦Rather, provide a logical progression
and tell a story

.1Start with positive findings.
.2Do not compare the present data with previously published results.
.3Write the text of the Results section concisely and
objectively ..4The passive voice will likely
dominate here, but use the active voice as much as possible
Results

Tables and Figures
Consider using a table to present large amounts of
data/results.◦Must refer to all tables in text.Use figures to graphically
represent significant results .

ResultsUse the “Stand alone” tablesMake sure totals add to 100%Do not repeat the Tables and
Figures in text◦Summarize: e.g., there were no
significant associations…◦Describe: e.g. there was a three fold
increase in the risk of..

Each Table or Figure must include a brief description of the results being
presented and other necessary information in a legend .
Table legends go above the Table; tables are read from top to bottom .
Figure legends go below the figure; figures are usually viewed from
bottom to top
Tables and Figures

Tables and Figures are assigned numbers separately and in the sequence that you will refer to
them from the text .◦The first Table you refer to is Table 1,
the next Table 2 and so forth .◦Similarly, the first Figure is Figure 1,
the next Figure 2, etc .
Tables and Figures

When referring to a table from the text, "Figure" is abbreviated
as Fig.,e.g., Fig. 1.
Table is never abbreviated, e.g., Table 1 .
Tables and Figures

23
Example 1: Courtesy of Shelley Ball.
Example 2: Courtesy of Shelley Ball.

24

Used when we want to distinguish a result & make it prominent into readers
viewFigures are visual presentations of
results, including graphs, diagrams, photos, drawings, schematics, maps,
etc.Graphs are the most common type of
figure .Graphs show trends or patterns of
relationship .
Figures

• Avoid clutter(too many numbers &symbols)
• Should provide a clear statistical message
• Vertical (“Y”) axis: outcome/dependent variable
• Horizontal (“X”) axis: exposure/independent variable
• Name & define each axis• Give the measurement unit of each axis
Figures


28

Common mistakes
• Raw data• Redundancy• Discussion and interpretation of data• No figures or tables • Methods/materials reported

Figure 1. Effect of total alkaloid fraction of methanolic extract on mean survival time

Figure 1. Effect of total alkaloid fraction of methanolic extract of unripe fruit of Solanum pseudocapsicum on mean survival time (MST) in tumor bearing mice.


33
Something to avoid! Do not present the same data in
both a Table and Figure - this is considered redundant and a waste
of space and energy .Decide which format best shows
the result and go through it .Do not report raw data values
when they can be summarized as means, percents, etc.

34
Do NOT !Use big words that you do not really
mean◦Attributable◦Causality◦Preferential◦Significant (without statistical
evidence)◦Validity
Mix incidence and prevalenceMix frequency, rate, proportion, ratio

Statistical findingsFor each primary and secondary
outcome, a summary of results for each group, and the estimated effect size and its precision (e.g., 95% confidence interval).
Address multiplicity by reporting any other analyses performed, including subgroup analyses and adjusted analyses, indicating those prespecified and those exploratory

گزارش نتايج آماري
نوشتن تعداد فراواني همراه با درصدها وقتي تعداد نمونهاندك است.
ی حجم نمونه و آزمون های ها عدم نياز به نوشتن فرمولآماری
اند مانند ميانگين, نسبت كه آزمون شدهپارامترهايی ارائهدار ها معني يا درصد, ضريب همبستگي, حتي اگر آزمون
نشده باشند.نوشتن شاخص آزمون و مقدار آن همراه با درجه آزادي و
p-value نوشتن مقداردقيقp-valueدار هاي معني براي آزمون
(تا دو رقم اعشار) دار وغيرمعني

تعريف كردن عالئمي كه براي نتايج(مانند ستاره) و رود كار ميه ب دار معني
كار بردن عالئم مشابهه ب نوشتن اعداد به صورت گرد شده با
درنظرگرفتن دقت داده هاي اوليه (ميانگين تا يك رقم اعشار و انحراف معيار و
خطاي معيار تا دو رقم اعشار بيشتر از داده هاي خام)
درج درصدها تا يك رقم اعشار (گاهيحتي نياز به ارقام اعشاري هم نيست).
نوشتن شاخص هايي مانندt ,r تا دو رقم اعشار
گزارش نتايج آماري

p-value
p < 0.05a statistically significant result p = 0.05
or 1 in 20result fairly
unlikely to be due to chance
0 1
Could the result have occurred by chance?
The result is unlikely to be due to chance
The result is likely to be due
to chance
1 20
p > 0.05not a
statistically significant
resultp = 0.5
or 1 in 2result quite
likely to be due to chance
1 2

Confidence Interval (CI)
Is the range within which the true size of effect (never exactly known) lies, with a given degree of assurance (usually 95%)

Check list for ResultsBaseline data provided?Primary and other endpoints
clear and complete?Does the text complement
figures and tables?Are measures of uncertainty
mentioned ?

In Results
Tell a storyUse the most logical sequence to
present the data (not necessarily the order in which you did the
experiments)Just report the data - do not include
interpretation or comparison to literature
No duplication of data

Guidelines for Writing Results
Specify the dates of the studyProvide a schematic summaryDescribe the characteristics of
each groupIndicate if the sample is
representativeIndicate if randomization was
successfulDescribe duration and nature of
follow up

The Study Outcomes
Present the results for all primary endpoints
Report statistical findings in detailReport actual p values , 95% CI , etc.Report the main findings in figures
or tables, you don’t need to also report them in the text
Report confounders

A Few Rules
The first time you use an abbreviation, define it
When you give the commercial source for a reagent, the first time you cite the
source include the location of the company (city and state)
Make sure the subject and verb agree in every sentence
No exclamation points!

A Few Rules - continued
Look for redundancy within the manuscript
Try not to use “it” or “they” - be specific!
No jargonTwo shorter sentences are frequently
much more effective than a long, complex sentence
“Data” is plural not singular, i.e., “the data are…” NOT “ the data is”…

A Few Rules - continued Capitalize people’s namesNever, ever plagiarize! (even from
yourself!)Use numbers when expressing
measurements, except when the number would begin a sentence

In Clinical Trials: Participant flowFlow of participants through each
stage (a diagram is strongly recommended). Specifically, for each group report the numbers of participants randomly assigned, receiving intended treatment, completing the study protocol, and analyzed for the primary outcome. Describe protocol deviations from study as planned, together with reasons.


Remember… Number of participants
(denominator) in each group included in each analysis and whether the analysis was by “intention-to-treat.”
State the results in absolute numbers when feasible (eg, 10/20, not 50%).
All important adverse events or side effects in each intervention group.